Parametric Insurance Market Size, Share & Trends Analysis Report by Type of Coverage (Natural Catastrophe Insurance, Weather Index Insurance, Specialty Risk Insurance, Pandemic & Health Event Insurance, Energy & Power Output Insurance, Agricultural Yield Insurance, Travel Disruption Insurance, Event Cancellation Insurance, Others), Trigger Mechanism, Risk Type, Policy Duration, End User, Industry Vertical and Geography (North America, Europe, Asia Pacific, Middle East, Africa, and South America) – Global Industry Data, Trends, and Forecasts, 2026–2035
|
|
|
Segmental Data Insights |
|
|
Demand Trends |
|
|
Competitive Landscape |
|
|
Strategic Development |
|
|
Future Outlook & Opportunities |
|
Parametric Insurance Market Size, Share, and Growth
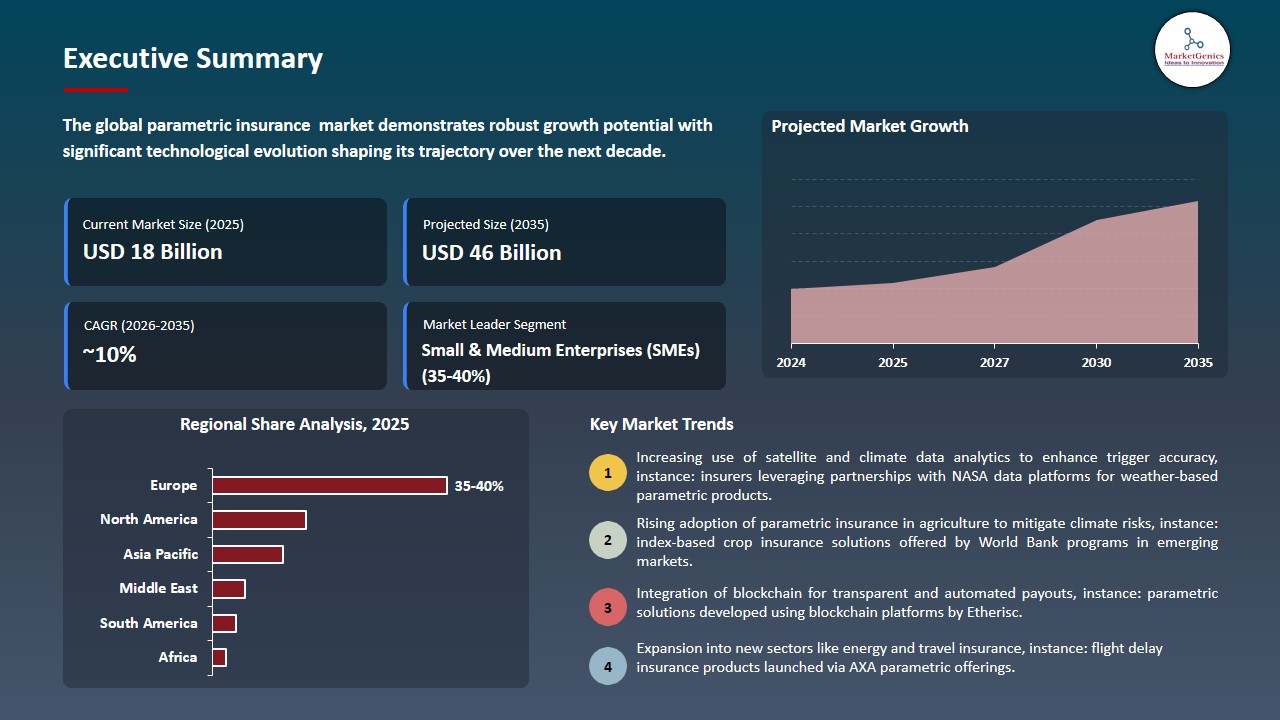
The global parametric insurance market is witnessing strong growth, valued at USD 18.3 billion in 2025 and projected to reach ~USD 46 billion by 2035, expanding at a CAGR of 9.6% during the forecast period. North America is the fastest-growing parametric insurance market due to high climate risk exposure, advanced data analytics adoption, and increasing demand for rapid, transparent insurance solutions across agriculture, energy, and infrastructure sectors.
Mark Rueegg, Chief Executive of CelsiusPro Group, said, "Our partnership with ECOM will help Indonesian farmers manage their climate risks and income volatility. The region is seeing increased frequency and severity of climate-related events, which makes accessible and affordable insurance products all the more important.”
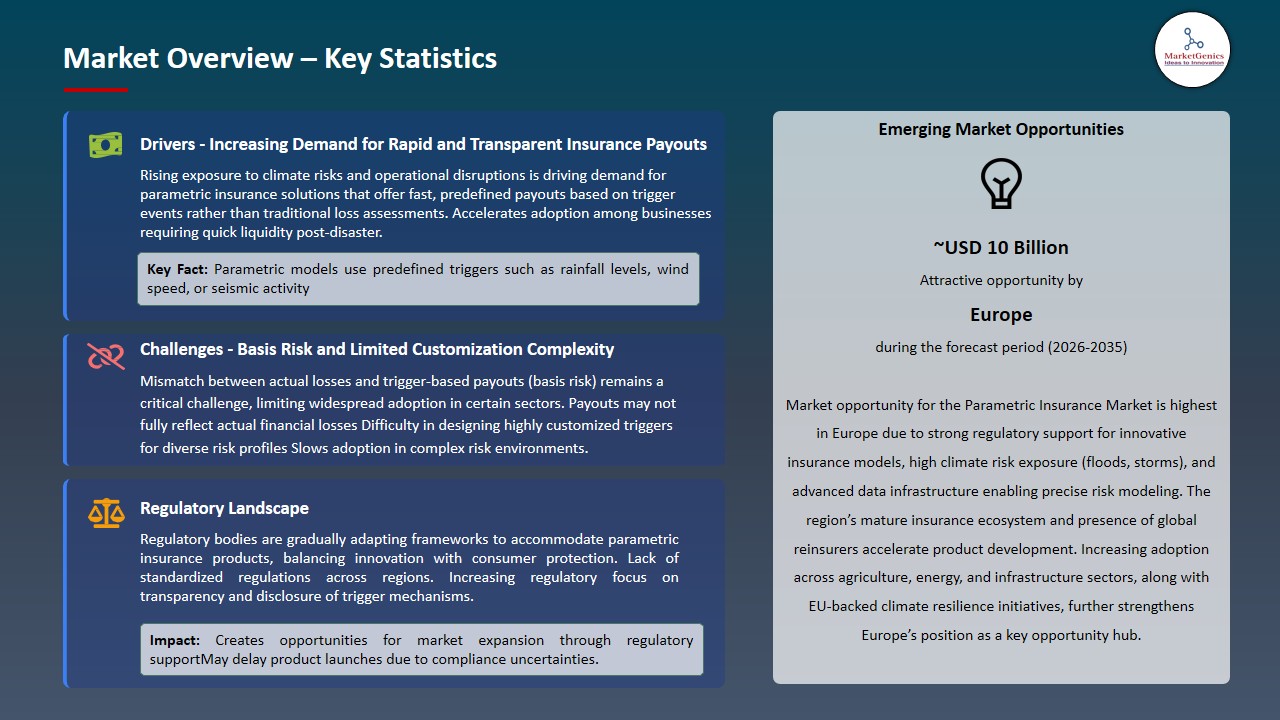
Rising climate volatility and widening protection gaps are accelerating adoption of parametric insurance, as traditional indemnity models struggle with delayed claims and limited coverage in high-risk zones. The need for rapid liquidity is also fueling demand, since trigger-based structures enable near-instant payouts without loss assessment, supporting business continuity during disasters, strengthening the role of climate risk transfer.
Advances in satellite data, IoT, and AI-based risk modeling are improving the precision of event triggers, strengthening insurer confidence and enabling scalability across sectors such as agriculture, energy, and manufacturing. Growing corporate focus on supply chain resilience and financial risk hedging is further driving uptake, particularly in regions exposed to extreme weather and operational disruptions. For instance, Swiss Re has expanded parametric catastrophe covers for climate-linked risks, while AXA Group has introduced parametric solutions for SMEs to ensure faster disaster recovery and cash flow protection, supporting catastrophe risk cover frameworks.
Expansion into climate risk analytics platforms, integration with IoT-based smart agriculture solutions, partnerships with reinsurance and catastrophe bond markets, embedded insurance in fintech and supply chain finance platforms, and applications in renewable energy risk coverage represent key adjacent opportunities for parametric insurance, enabling diversified use cases and broader adoption across industries, including weather index insurance applications.
Parametric Insurance Market Dynamics and Trends
Driver: Growing Demand for Disaster Risk Management by Corporates and Governments for Business Continuity
- Companies and governments must implement advanced risk management systems which protect both their operational activities and their financial resources because climate-related disruptions are becoming more frequent. The existing insurance systems do not provide sufficient coverage for companies because they cannot compensate for indirect damages which include supply chain disruptions and lost business income, increasing reliance on disaster risk financing.
- The requirement for immediate financial protection during emergencies is fulfilled by parametric insurance which provides predetermined event-based payout systems to deliver instant financial benefits that help businesses recover their expenses. The complete solutions which organizations and government bodies use for their disaster resilience planning help them reduce operational interruptions while protecting their financial stability in areas more likely to experience disasters.
- The development of the market depends on parametric insurance which serves as an essential resource for organizations to develop their resilience strategies and conduct their business operations.
Restraint: Limited Data Infrastructure and Basis Risk Challenges Restricting Widespread Adoption Globally
- The accurate trigger design of parametric insurance systems needs strong data systems because the insurance system requires continuous environmental protection and event data. The lack of weather stations and historical data and digital systems in developing and climate-vulnerable areas create problems for measuring their environmental conditions. The situation decreases trust between insurers and policyholders who need financial help the most.
- Basis risk remains a significant concern because payouts depend on predefined triggers that do not consider actual losses which occurred. The situation where damages happen without reaching trigger thresholds results in customer discontent which damages their trust and limits their use of the product across major user sectors.
- The system limits market growth because it decreases trust in high-risk areas and reduces operational accuracy.
Opportunity: Integration with Renewable Energy and Climate Finance Unlocking New Risk Transfer Applications
- Renewable energy infrastructure and climate-related financing are experiencing fast growth which creates significant chances for parametric insurance to solve problems related to revenue fluctuations caused by weather conditions. Solar, wind, and hydro projects increasingly require protection against deviations in natural conditions that directly impact power generation and financial returns.
- Parametric solutions enable predefined, data-driven payouts based on factors such as wind speed or solar irradiation which enhance revenue predictability for investors and project developers. The mechanism aligns with climate finance systems which create risk management systems that enable sustainable infrastructure development to expand throughout the world.
- A 2025 instance includes a parametric wind hedge by kWh Analytics for Apex Clean Energy, backed by Munich Re, mitigating wind variability risk while enhancing project bankability and debt capacity.
- Broadens market applicability by linking insurance with energy transition and climate investment ecosystems.
Key Trend: Advancements in AI Driven Climate Modeling Enhancing Parametric Product Precision and Scalability
- The combination of AI developments with satellite analytics and geospatial information leads to better precision in determining parametric insurance triggers. The enhanced climate models which insurers use enable them to predict event intensity and frequency with greater accuracy. This improvement decreases basis risk while it increases policyholder confidence.
- Real-time data integration together with machine learning technology enables organizations to implement dynamic pricing systems which support automated payout processes and adaptable product development for different markets. AI-powered analytics help Swiss Re assess risk more accurately while expanding coverage options to new market areas.
- The Munich Re NatCatSERVICE database which tracks global natural disaster losses since 1980 helps the company improve its AI-based climate modeling systems. This system enables more accurate parametric trigger development and better risk evaluation results.
- The system drives parametric solutions to achieve greater market acceptance through their enhanced ability to deliver dependable output which customers can trace and which they can expand into larger operational environments.
Parametric Insurance Market Analysis and Segmental Data
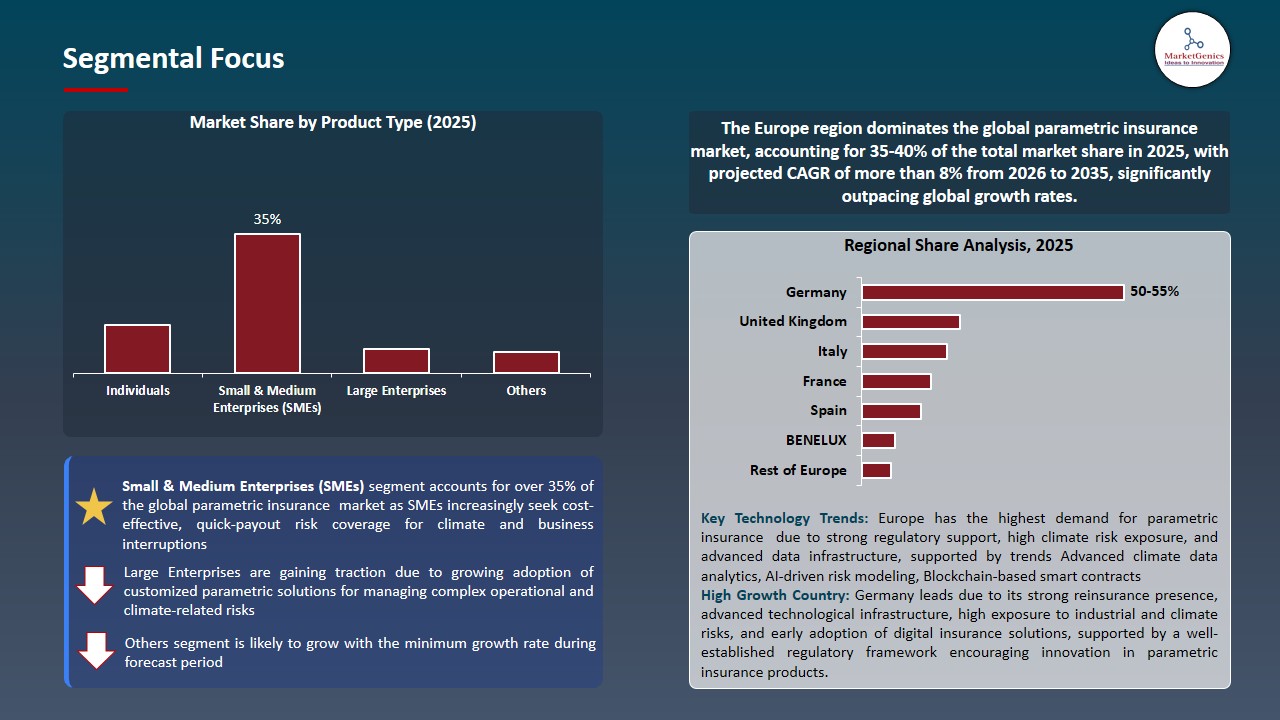
Small & Medium Enterprises (SMEs) Dominate Global Parametric Insurance Market
- Small and medium enterprises represent the biggest part of the parametric insurance market because their business operations face high risks which they cannot manage due to insufficient financial resources. Small and medium enterprises need rapid access to cash during severe weather events and supply chain disruptions because they do not have complete risk management systems which large companies possess.
- The parametric insurance system provides small and medium enterprises with fast payment methods which meet their needs because it eliminates complicated claims procedures while decreasing their administrative workload. The growth of digital distribution channels together with embedded insurance systems enables insurance companies to expand their offerings throughout global SME networks especially in developing countries.
- The solution generates extensive market reach because it meets the critical cash flow needs and business continuity demands of a widely neglected market sector.
Europe Leads Global Parametric Insurance Market Demand
- Europe represents a leading region in the parametric insurance market, driven by strong regulatory frameworks, high insurance penetration, and increasing exposure to climate-related risks such as floods, storms, and heatwaves. Governments and enterprises across the region are actively adopting innovative risk transfer solutions to enhance financial resilience and ensure faster disaster recovery.
- The presence of major insurers and reinsurers, along with advanced data infrastructure and climate modeling capabilities, supports the development of highly customized parametric products. Additionally, growing alignment with sustainability and climate adaptation initiatives is accelerating adoption across sectors including agriculture, energy, and infrastructure.
- Reinforces market leadership through strong institutional support, technological capability, and high climate risk awareness.
Parametric Insurance Market Ecosystem
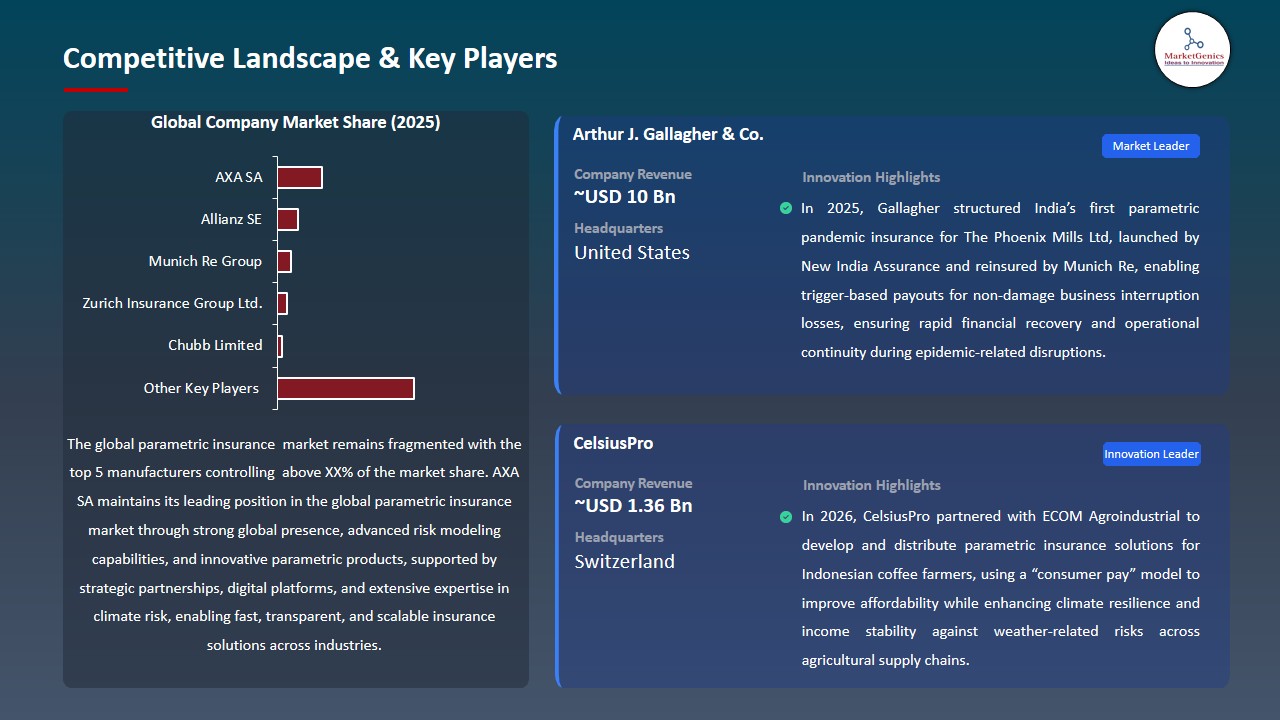
The global parametric insurance market is consolidated, with key players including AXA SA, Allianz SE, Munich Re Group, Zurich Insurance Group Ltd., and Chubb Limited. The companies in this industry compete against each other by creating solutions which use satellite data and artificial intelligence climate models and real-time data analysis to deliver faster payment and better risk assessment. The company establishes its competitive advantage through its ability to connect with climate risk platforms and digital underwriting systems and its particular solutions which include agricultural and energy and disaster risk protection.
The Parametric Insurance market value chain starts when companies collect data through satellite imagery and weather stations and IoT sensors and climate history databases. The process continues with risk modeling and product design which enables insurers to create trigger-based policies that use advanced analytics and actuarial frameworks for accurate risk assessment. Underwriting and structuring work examines pricing models and risk transfer methods which reinsurers typically help to develop. The company uses brokers and digital platforms and strategic alliances with government agencies and businesses for distribution while their post-event services deliver automated payouts and monitoring capabilities and ongoing model updates which enhance operational efficiency and client trust.
The industry presents high entry barriers because companies require advanced data systems together with strong analytical skills and they need substantial financial resources to support risk assessment activities. New companies face two main obstacles which include requirements for regulatory compliance and the need to create accurate trigger systems. Market expansion occurs because climate-related risks increase and people want faster claim resolution and various industries like agriculture and infrastructure and renewable energy adopt the practice and financial resilience and climate risk management receive more focus.
Recent Development and Strategic Overview:
- In October 2025, Gallagher structured India’s first parametric pandemic insurance for The Phoenix Mills Ltd, launched by New India Assurance and reinsured by Munich Re, enabling trigger-based payouts for non-damage business interruption losses, ensuring rapid financial recovery and operational continuity during epidemic-related disruptions.
- In January 2026, CelsiusPro partnered with ECOM Agroindustrial to develop and distribute parametric insurance solutions for Indonesian coffee farmers, using a “consumer pay” model to improve affordability while enhancing climate resilience and income stability against weather-related risks across agricultural supply chains.
Report Scope
|
Detail |
|
|
Market Size in 2025 |
USD 18.3 Bn |
|
Market Forecast Value in 2035 |
USD 46 Bn |
|
Growth Rate (CAGR) |
9.6% |
|
Forecast Period |
2026 – 2035 |
|
Historical Data Available for |
2021 – 2024 |
|
Market Size Units |
US$ Billion for Value |
|
Report Format |
Electronic (PDF) + Excel |
|
North America |
Europe |
Asia Pacific |
Middle East |
Africa |
South America |
|
|
|
|
|
|
|
Companies Covered |
|||||
|
|
|
|
|
|
Parametric Insurance Market Segmentation and Highlights
|
Segment |
Sub-segment |
|
Parametric Insurance Market, By Type of Coverage |
|
|
Parametric Insurance Market, By Trigger Mechanism |
|
|
Parametric Insurance Market, By Risk Type |
|
|
Parametric Insurance Market, By Policy Duration |
|
|
Parametric Insurance Market, By End User |
|
Frequently Asked Questions
Table of Contents
- 1. Research Methodology and Assumptions
- 1.1. Definitions
- 1.2. Research Design and Approach
- 1.3. Data Collection Methods
- 1.4. Base Estimates and Calculations
- 1.5. Forecasting Models
- 1.5.1. Key Forecast Factors & Impact Analysis
- 1.6. Secondary Research
- 1.6.1. Open Sources
- 1.6.2. Paid Databases
- 1.6.3. Associations
- 1.7. Primary Research
- 1.7.1. Primary Sources
- 1.7.2. Primary Interviews with Stakeholders across Ecosystem
- 2. Executive Summary
- 2.1. Global Parametric Insurance Market Outlook
- 2.1.1. Parametric Insurance Market Size Value (US$ Bn), and Forecasts, 2021-2035
- 2.1.2. Compounded Annual Growth Rate Analysis
- 2.1.3. Growth Opportunity Analysis
- 2.1.4. Segmental Share Analysis
- 2.1.5. Geographical Share Analysis
- 2.2. Market Analysis and Facts
- 2.3. Supply-Demand Analysis
- 2.4. Competitive Benchmarking
- 2.5. Go-to- Market Strategy
- 2.5.1. Customer/ End-use Industry Assessment
- 2.5.2. Growth Opportunity Data, 2026-2035
- 2.5.2.1. Regional Data
- 2.5.2.2. Country Data
- 2.5.2.3. Segmental Data
- 2.5.3. Identification of Potential Market Spaces
- 2.5.4. GAP Analysis
- 2.5.5. Potential Attractive Price Points
- 2.5.6. Prevailing Market Risks & Challenges
- 2.5.7. Preferred Sales & Marketing Strategies
- 2.5.8. Key Recommendations and Analysis
- 2.5.9. A Way Forward
- 2.1. Global Parametric Insurance Market Outlook
- 3. Industry Data and Premium Insights
- 3.1. Global Information Technology & Media Industry Overview, 2025
- 3.1.1. Information Technology & Media Industry Ecosystem Analysis
- 3.1.2. Key Trends for Information Technology & Media Industry
- 3.1.3. Regional Distribution for Information Technology & Media Industry
- 3.2. Supplier Customer Data
- 3.3. Technology Roadmap and Developments
- 3.4. Trade Analysis
- 3.4.1. Import & Export Analysis, 2025
- 3.4.2. Top Importing Countries
- 3.4.3. Top Exporting Countries
- 3.5. Trump Tariff Impact Analysis
- 3.5.1. Manufacturer
- 3.5.1.1. Based on the component & Raw material
- 3.5.2. Supply Chain
- 3.5.3. End Consumer
- 3.5.1. Manufacturer
- 3.6. Raw Material Analysis
- 3.1. Global Information Technology & Media Industry Overview, 2025
- 4. Market Overview
- 4.1. Market Dynamics
- 4.1.1. Drivers
- 4.1.1.1. Rising climate risks increasing demand for rapid payouts
- 4.1.1.2. Need for fast, transparent claim settlement
- 4.1.1.3. Advancements in data and risk modeling technologies
- 4.1.2. Restraints
- 4.1.2.1. Basis risk challenges
- 4.1.2.2. Low awareness and adoption
- 4.1.1. Drivers
- 4.2. Key Trend Analysis
- 4.3. Regulatory Framework
- 4.3.1. Key Regulations, Norms, and Subsidies, by Key Countries
- 4.3.2. Tariffs and Standards
- 4.3.3. Impact Analysis of Regulations on the Market
- 4.4. Ecosystem Analysis
- 4.5. Porter’s Five Forces Analysis
- 4.6. PESTEL Analysis
- 4.7. Global Parametric Insurance Market Demand
- 4.7.1. Historical Market Size – Value (US$ Bn), 2020-2024
- 4.7.2. Current and Future Market Size – Value (US$ Bn), 2026–2035
- 4.7.2.1. Y-o-Y Growth Trends
- 4.7.2.2. Absolute $ Opportunity Assessment
- 4.1. Market Dynamics
- 5. Competition Landscape
- 5.1. Competition structure
- 5.1.1. Fragmented v/s consolidated
- 5.2. Company Share Analysis, 2025
- 5.2.1. Global Company Market Share
- 5.2.2. By Region
- 5.2.2.1. North America
- 5.2.2.2. Europe
- 5.2.2.3. Asia Pacific
- 5.2.2.4. Middle East
- 5.2.2.5. Africa
- 5.2.2.6. South America
- 5.3. Product Comparison Matrix
- 5.3.1. Specifications
- 5.3.2. Market Positioning
- 5.3.3. Pricing
- 5.1. Competition structure
- 6. Global Parametric Insurance Market Analysis, by Type of Coverage
- 6.1. Key Segment Analysis
- 6.2. Parametric Insurance Market Size Value (US$ Bn), Analysis, and Forecasts, by Type of Coverage, 2021-2035
- 6.2.1. Natural Catastrophe Insurance
- 6.2.2. Weather Index Insurance
- 6.2.3. Specialty Risk Insurance
- 6.2.4. Pandemic & Health Event Insurance
- 6.2.5. Energy & Power Output Insurance
- 6.2.6. Agricultural Yield Insurance
- 6.2.7. Travel Disruption Insurance
- 6.2.8. Event Cancellation Insurance
- 6.2.9. Others
- 7. Global Parametric Insurance Market Analysis, by Trigger Mechanism
- 7.1. Key Segment Analysis
- 7.2. Parametric Insurance Market Size Value (US$ Bn), Analysis, and Forecasts, by Trigger Mechanism, 2021-2035
- 7.2.1. Weather-Based Triggers
- 7.2.2. Catastrophe-Based Triggers
- 7.2.3. Index-Based Triggers
- 7.2.4. Satellite & Remote Sensing Data-Based Triggers
- 7.2.5. IoT & Sensor-Based Triggers
- 7.2.6. Third-Party Data Provider Triggers
- 7.2.7. Others
- 8. Global Parametric Insurance Market Analysis, by Risk Type
- 8.1. Key Segment Analysis
- 8.2. Parametric Insurance Market Size Value (US$ Bn), Analysis, and Forecasts, by Risk Type, 2021-2035
- 8.2.1. Climate & Weather Risks
- 8.2.2. Natural Disaster Risks
- 8.2.3. Operational Risks
- 8.2.4. Supply Chain Risks
- 8.2.5. Cyber & Technology Risks
- 8.2.6. Health & Pandemic Risks
- 8.2.7. Others
- 9. Global Parametric Insurance Market Analysis, by Policy Duration
- 9.1. Key Segment Analysis
- 9.2. Parametric Insurance Market Size Value (US$ Bn), Analysis, and Forecasts, by Policy Duration, 2021-2035
- 9.2.1. Short-Term (Less than 1 Year)
- 9.2.2. Medium-Term (1–3 Years)
- 9.2.3. Long-Term (More than 3 Years)
- 10. Global Parametric Insurance Market Analysis, by End User
- 10.1. Key Segment Analysis
- 10.2. Parametric Insurance Market Size Value (US$ Bn), Analysis, and Forecasts, by End User, 2021-2035
- 10.2.1. Individuals
- 10.2.2. Small & Medium Enterprises (SMEs)
- 10.2.3. Large Enterprises
- 10.2.4. Governments & Public Sector Entities
- 10.2.5. Non-Governmental Organizations (NGOs)
- 10.2.6. Financial Institutions (Banks, MFIs)
- 10.2.7. Others
- 11. Global Parametric Insurance Market Analysis, by Industry Vertical
- 11.1. Key Segment Analysis
- 11.2. Parametric Insurance Market Size Value (US$ Bn), Analysis, and Forecasts, by Industry Vertical, 2021-2035
- 11.2.1. Agriculture
- 11.2.2. Energy & Utilities
- 11.2.3. Travel & Tourism
- 11.2.4. Construction & Infrastructure
- 11.2.5. Marine & Logistics
- 11.2.6. Aviation
- 11.2.7. Retail & Hospitality
- 11.2.8. Telecommunications
- 11.2.9. Others
- 12. Global Parametric Insurance Market Analysis and Forecasts, by Region
- 12.1. Key Findings
- 12.2. Parametric Insurance Market Size Value (US$ Bn), Analysis, and Forecasts, by Region, 2021-2035
- 12.2.1. North America
- 12.2.2. Europe
- 12.2.3. Asia Pacific
- 12.2.4. Middle East
- 12.2.5. Africa
- 12.2.6. South America
- 13. North America Parametric Insurance Market Analysis
- 13.1. Key Segment Analysis
- 13.2. Regional Snapshot
- 13.3. North America Parametric Insurance Market Size- Value (US$ Bn), Analysis, and Forecasts, 2021-2035
- 13.3.1. Type of Coverage
- 13.3.2. Trigger Mechanism
- 13.3.3. Risk Type
- 13.3.4. Policy Duration
- 13.3.5. End User
- 13.3.6. Industry Vertical
- 13.3.7. Country
- 13.3.7.1. USA
- 13.3.7.2. Canada
- 13.3.7.3. Mexico
- 13.4. USA Parametric Insurance Market
- 13.4.1. Country Segmental Analysis
- 13.4.2. Type of Coverage
- 13.4.3. Trigger Mechanism
- 13.4.4. Risk Type
- 13.4.5. Policy Duration
- 13.4.6. End User
- 13.4.7. Industry Vertical
- 13.5. Canada Parametric Insurance Market
- 13.5.1. Country Segmental Analysis
- 13.5.2. Type of Coverage
- 13.5.3. Trigger Mechanism
- 13.5.4. Risk Type
- 13.5.5. Policy Duration
- 13.5.6. End User
- 13.5.7. Industry Vertical
- 13.6. Mexico Parametric Insurance Market
- 13.6.1. Country Segmental Analysis
- 13.6.2. Type of Coverage
- 13.6.3. Trigger Mechanism
- 13.6.4. Risk Type
- 13.6.5. Policy Duration
- 13.6.6. End User
- 13.6.7. Industry Vertical
- 14. Europe Parametric Insurance Market Analysis
- 14.1. Key Segment Analysis
- 14.2. Regional Snapshot
- 14.3. Europe Parametric Insurance Market Size Value (US$ Bn), Analysis, and Forecasts, 2021-2035
- 14.3.1. Type of Coverage
- 14.3.2. Trigger Mechanism
- 14.3.3. Risk Type
- 14.3.4. Policy Duration
- 14.3.5. End User
- 14.3.6. Industry Vertical
- 14.3.7. Country
- 14.3.7.1. Germany
- 14.3.7.2. United Kingdom
- 14.3.7.3. France
- 14.3.7.4. Italy
- 14.3.7.5. Spain
- 14.3.7.6. Netherlands
- 14.3.7.7. Nordic Countries
- 14.3.7.8. Poland
- 14.3.7.9. Russia & CIS
- 14.3.7.10. Rest of Europe
- 14.4. Germany Parametric Insurance Market
- 14.4.1. Country Segmental Analysis
- 14.4.2. Type of Coverage
- 14.4.3. Trigger Mechanism
- 14.4.4. Risk Type
- 14.4.5. Policy Duration
- 14.4.6. End User
- 14.4.7. Industry Vertical
- 14.5. United Kingdom Parametric Insurance Market
- 14.5.1. Country Segmental Analysis
- 14.5.2. Type of Coverage
- 14.5.3. Trigger Mechanism
- 14.5.4. Risk Type
- 14.5.5. Policy Duration
- 14.5.6. End User
- 14.5.7. Industry Vertical
- 14.6. France Parametric Insurance Market
- 14.6.1. Country Segmental Analysis
- 14.6.2. Type of Coverage
- 14.6.3. Trigger Mechanism
- 14.6.4. Risk Type
- 14.6.5. Policy Duration
- 14.6.6. End User
- 14.6.7. Industry Vertical
- 14.7. Italy Parametric Insurance Market
- 14.7.1. Country Segmental Analysis
- 14.7.2. Type of Coverage
- 14.7.3. Trigger Mechanism
- 14.7.4. Risk Type
- 14.7.5. Policy Duration
- 14.7.6. End User
- 14.7.7. Industry Vertical
- 14.8. Spain Parametric Insurance Market
- 14.8.1. Country Segmental Analysis
- 14.8.2. Type of Coverage
- 14.8.3. Trigger Mechanism
- 14.8.4. Risk Type
- 14.8.5. Policy Duration
- 14.8.6. End User
- 14.8.7. Industry Vertical
- 14.9. Netherlands Parametric Insurance Market
- 14.9.1. Country Segmental Analysis
- 14.9.2. Type of Coverage
- 14.9.3. Trigger Mechanism
- 14.9.4. Risk Type
- 14.9.5. Policy Duration
- 14.9.6. End User
- 14.9.7. Industry Vertical
- 14.10. Nordic Countries Parametric Insurance Market
- 14.10.1. Country Segmental Analysis
- 14.10.2. Type of Coverage
- 14.10.3. Trigger Mechanism
- 14.10.4. Risk Type
- 14.10.5. Policy Duration
- 14.10.6. End User
- 14.10.7. Industry Vertical
- 14.11. Poland Parametric Insurance Market
- 14.11.1. Country Segmental Analysis
- 14.11.2. Type of Coverage
- 14.11.3. Trigger Mechanism
- 14.11.4. Risk Type
- 14.11.5. Policy Duration
- 14.11.6. End User
- 14.11.7. Industry Vertical
- 14.12. Russia & CIS Parametric Insurance Market
- 14.12.1. Country Segmental Analysis
- 14.12.2. Type of Coverage
- 14.12.3. Trigger Mechanism
- 14.12.4. Risk Type
- 14.12.5. Policy Duration
- 14.12.6. End User
- 14.12.7. Industry Vertical
- 14.13. Rest of Europe Parametric Insurance Market
- 14.13.1. Country Segmental Analysis
- 14.13.2. Type of Coverage
- 14.13.3. Trigger Mechanism
- 14.13.4. Risk Type
- 14.13.5. Policy Duration
- 14.13.6. End User
- 14.13.7. Industry Vertical
- 15. Asia Pacific Parametric Insurance Market Analysis
- 15.1. Key Segment Analysis
- 15.2. Regional Snapshot
- 15.3. Asia Pacific Parametric Insurance Market Size Value (US$ Bn), Analysis, and Forecasts, 2021-2035
- 15.3.1. Type of Coverage
- 15.3.2. Trigger Mechanism
- 15.3.3. Risk Type
- 15.3.4. Policy Duration
- 15.3.5. End User
- 15.3.6. Industry Vertical
- 15.3.7. Country
- 15.3.7.1. China
- 15.3.7.2. India
- 15.3.7.3. Japan
- 15.3.7.4. South Korea
- 15.3.7.5. Australia and New Zealand
- 15.3.7.6. Indonesia
- 15.3.7.7. Malaysia
- 15.3.7.8. Thailand
- 15.3.7.9. Vietnam
- 15.3.7.10. Rest of Asia Pacific
- 15.4. China Parametric Insurance Market
- 15.4.1. Country Segmental Analysis
- 15.4.2. Type of Coverage
- 15.4.3. Trigger Mechanism
- 15.4.4. Risk Type
- 15.4.5. Policy Duration
- 15.4.6. End User
- 15.4.7. Industry Vertical
- 15.5. India Parametric Insurance Market
- 15.5.1. Country Segmental Analysis
- 15.5.2. Type of Coverage
- 15.5.3. Trigger Mechanism
- 15.5.4. Risk Type
- 15.5.5. Policy Duration
- 15.5.6. End User
- 15.5.7. Industry Vertical
- 15.6. Japan Parametric Insurance Market
- 15.6.1. Country Segmental Analysis
- 15.6.2. Type of Coverage
- 15.6.3. Trigger Mechanism
- 15.6.4. Risk Type
- 15.6.5. Policy Duration
- 15.6.6. End User
- 15.6.7. Industry Vertical
- 15.7. South Korea Parametric Insurance Market
- 15.7.1. Country Segmental Analysis
- 15.7.2. Type of Coverage
- 15.7.3. Trigger Mechanism
- 15.7.4. Risk Type
- 15.7.5. Policy Duration
- 15.7.6. End User
- 15.7.7. Industry Vertical
- 15.8. Australia and New Zealand Parametric Insurance Market
- 15.8.1. Country Segmental Analysis
- 15.8.2. Type of Coverage
- 15.8.3. Trigger Mechanism
- 15.8.4. Risk Type
- 15.8.5. Policy Duration
- 15.8.6. End User
- 15.8.7. Industry Vertical
- 15.9. Indonesia Parametric Insurance Market
- 15.9.1. Country Segmental Analysis
- 15.9.2. Type of Coverage
- 15.9.3. Trigger Mechanism
- 15.9.4. Risk Type
- 15.9.5. Policy Duration
- 15.9.6. End User
- 15.9.7. Industry Vertical
- 15.10. Malaysia Parametric Insurance Market
- 15.10.1. Country Segmental Analysis
- 15.10.2. Type of Coverage
- 15.10.3. Trigger Mechanism
- 15.10.4. Risk Type
- 15.10.5. Policy Duration
- 15.10.6. End User
- 15.10.7. Industry Vertical
- 15.11. Thailand Parametric Insurance Market
- 15.11.1. Country Segmental Analysis
- 15.11.2. Type of Coverage
- 15.11.3. Trigger Mechanism
- 15.11.4. Risk Type
- 15.11.5. Policy Duration
- 15.11.6. End User
- 15.11.7. Industry Vertical
- 15.12. Vietnam Parametric Insurance Market
- 15.12.1. Country Segmental Analysis
- 15.12.2. Type of Coverage
- 15.12.3. Trigger Mechanism
- 15.12.4. Risk Type
- 15.12.5. Policy Duration
- 15.12.6. End User
- 15.12.7. Industry Vertical
- 15.13. Rest of Asia Pacific Parametric Insurance Market
- 15.13.1. Country Segmental Analysis
- 15.13.2. Type of Coverage
- 15.13.3. Trigger Mechanism
- 15.13.4. Risk Type
- 15.13.5. Policy Duration
- 15.13.6. End User
- 15.13.7. Industry Vertical
- 16. Middle East Parametric Insurance Market Analysis
- 16.1. Key Segment Analysis
- 16.2. Regional Snapshot
- 16.3. Middle East Parametric Insurance Market Size Value (US$ Bn), Analysis, and Forecasts, 2021-2035
- 16.3.1. Type of Coverage
- 16.3.2. Trigger Mechanism
- 16.3.3. Risk Type
- 16.3.4. Policy Duration
- 16.3.5. End User
- 16.3.6. Industry Vertical
- 16.3.7. Country
- 16.3.7.1. Turkey
- 16.3.7.2. UAE
- 16.3.7.3. Saudi Arabia
- 16.3.7.4. Israel
- 16.3.7.5. Rest of Middle East
- 16.4. Turkey Parametric Insurance Market
- 16.4.1. Country Segmental Analysis
- 16.4.2. Type of Coverage
- 16.4.3. Trigger Mechanism
- 16.4.4. Risk Type
- 16.4.5. Policy Duration
- 16.4.6. End User
- 16.4.7. Industry Vertical
- 16.5. UAE Parametric Insurance Market
- 16.5.1. Country Segmental Analysis
- 16.5.2. Type of Coverage
- 16.5.3. Trigger Mechanism
- 16.5.4. Risk Type
- 16.5.5. Policy Duration
- 16.5.6. End User
- 16.5.7. Industry Vertical
- 16.6. Saudi Arabia Parametric Insurance Market
- 16.6.1. Country Segmental Analysis
- 16.6.2. Type of Coverage
- 16.6.3. Trigger Mechanism
- 16.6.4. Risk Type
- 16.6.5. Policy Duration
- 16.6.6. End User
- 16.6.7. Industry Vertical
- 16.7. Israel Parametric Insurance Market
- 16.7.1. Country Segmental Analysis
- 16.7.2. Type of Coverage
- 16.7.3. Trigger Mechanism
- 16.7.4. Risk Type
- 16.7.5. Policy Duration
- 16.7.6. End User
- 16.7.7. Industry Vertical
- 16.8. Rest of Middle East Parametric Insurance Market
- 16.8.1. Country Segmental Analysis
- 16.8.2. Type of Coverage
- 16.8.3. Trigger Mechanism
- 16.8.4. Risk Type
- 16.8.5. Policy Duration
- 16.8.6. End User
- 16.8.7. Industry Vertical
- 17. Africa Parametric Insurance Market Analysis
- 17.1. Key Segment Analysis
- 17.2. Regional Snapshot
- 17.3. Africa Parametric Insurance Market Size Value (US$ Bn), Analysis, and Forecasts, 2021-2035
- 17.3.1. Type of Coverage
- 17.3.2. Trigger Mechanism
- 17.3.3. Risk Type
- 17.3.4. Policy Duration
- 17.3.5. End User
- 17.3.6. Industry Vertical
- 17.3.7. Country
- 17.3.7.1. South Africa
- 17.3.7.2. Egypt
- 17.3.7.3. Nigeria
- 17.3.7.4. Algeria
- 17.3.7.5. Rest of Africa
- 17.4. South Africa Parametric Insurance Market
- 17.4.1. Country Segmental Analysis
- 17.4.2. Type of Coverage
- 17.4.3. Trigger Mechanism
- 17.4.4. Risk Type
- 17.4.5. Policy Duration
- 17.4.6. End User
- 17.4.7. Industry Vertical
- 17.5. Egypt Parametric Insurance Market
- 17.5.1. Country Segmental Analysis
- 17.5.2. Type of Coverage
- 17.5.3. Trigger Mechanism
- 17.5.4. Risk Type
- 17.5.5. Policy Duration
- 17.5.6. End User
- 17.5.7. Industry Vertical
- 17.6. Nigeria Parametric Insurance Market
- 17.6.1. Country Segmental Analysis
- 17.6.2. Type of Coverage
- 17.6.3. Trigger Mechanism
- 17.6.4. Risk Type
- 17.6.5. Policy Duration
- 17.6.6. End User
- 17.6.7. Industry Vertical
- 17.7. Algeria Parametric Insurance Market
- 17.7.1. Country Segmental Analysis
- 17.7.2. Type of Coverage
- 17.7.3. Trigger Mechanism
- 17.7.4. Risk Type
- 17.7.5. Policy Duration
- 17.7.6. End User
- 17.7.7. Industry Vertical
- 17.8. Rest of Africa Parametric Insurance Market
- 17.8.1. Country Segmental Analysis
- 17.8.2. Type of Coverage
- 17.8.3. Trigger Mechanism
- 17.8.4. Risk Type
- 17.8.5. Policy Duration
- 17.8.6. End User
- 17.8.7. Industry Vertical
- 18. South America Parametric Insurance Market Analysis
- 18.1. Key Segment Analysis
- 18.2. Regional Snapshot
- 18.3. South America Parametric Insurance Market Size Value (US$ Bn), Analysis, and Forecasts, 2021-2035
- 18.3.1. Type of Coverage
- 18.3.2. Trigger Mechanism
- 18.3.3. Risk Type
- 18.3.4. Policy Duration
- 18.3.5. End User
- 18.3.6. Industry Vertical
- 18.3.7. Country
- 18.3.7.1. Brazil
- 18.3.7.2. Argentina
- 18.3.7.3. Rest of South America
- 18.4. Brazil Parametric Insurance Market
- 18.4.1. Country Segmental Analysis
- 18.4.2. Type of Coverage
- 18.4.3. Trigger Mechanism
- 18.4.4. Risk Type
- 18.4.5. Policy Duration
- 18.4.6. End User
- 18.4.7. Industry Vertical
- 18.5. Argentina Parametric Insurance Market
- 18.5.1. Country Segmental Analysis
- 18.5.2. Type of Coverage
- 18.5.3. Trigger Mechanism
- 18.5.4. Risk Type
- 18.5.5. Policy Duration
- 18.5.6. End User
- 18.5.7. Industry Vertical
- 18.6. Rest of South America Parametric Insurance Market
- 18.6.1. Country Segmental Analysis
- 18.6.2. Type of Coverage
- 18.6.3. Trigger Mechanism
- 18.6.4. Risk Type
- 18.6.5. Policy Duration
- 18.6.6. End User
- 18.6.7. Industry Vertical
- 19. Key Players/ Company Profile
- 19.1. Allianz SE
- 19.1.1. Company Details/ Overview
- 19.1.2. Company Financials
- 19.1.3. Key Customers and Competitors
- 19.1.4. Business/ Industry Portfolio
- 19.1.5. Product Portfolio/ Specification Details
- 19.1.6. Pricing Data
- 19.1.7. Strategic Overview
- 19.1.8. Recent Developments
- 19.2. Aon plc
- 19.3. Arbol Inc.
- 19.4. AXA SA
- 19.5. Berkshire Hathaway Specialty Insurance
- 19.6. Chubb Limited
- 19.7. Descartes Underwriting SAS
- 19.8. FloodFlash Limited
- 19.9. Global Parametrics Limited
- 19.10. Hannover Re Group
- 19.11. Jumpstart Insurance Solutions, Inc.
- 19.12. Lloyd’s of London
- 19.13. Marsh & McLennan Companies, Inc.
- 19.14. Munich Re Group
- 19.15. QBE Insurance Group Limited
- 19.16. SCOR SE
- 19.17. Sompo Holdings, Inc.
- 19.18. Swiss Re Group
- 19.19. Willis Towers Watson plc
- 19.20. Zurich Insurance Group Ltd.
- 19.21. Other Key Players
- 19.1. Allianz SE
Note* - This is just tentative list of players. While providing the report, we will cover more number of players based on their revenue and share for each geography
Research Design
Our research design integrates both demand-side and supply-side analysis through a balanced combination of primary and secondary research methodologies. By utilizing both bottom-up and top-down approaches alongside rigorous data triangulation methods, we deliver robust market intelligence that supports strategic decision-making.
MarketGenics' comprehensive research design framework ensures the delivery of accurate, reliable, and actionable market intelligence. Through the integration of multiple research approaches, rigorous validation processes, and expert analysis, we provide our clients with the insights needed to make informed strategic decisions and capitalize on market opportunities.

MarketGenics leverages a dedicated industry panel of experts and a comprehensive suite of paid databases to effectively collect, consolidate, and analyze market intelligence.
Our approach has consistently proven to be reliable and effective in generating accurate market insights, identifying key industry trends, and uncovering emerging business opportunities.
Through both primary and secondary research, we capture and analyze critical company-level data such as manufacturing footprints, including technical centers, R&D facilities, sales offices, and headquarters.
Our expert panel further enhances our ability to estimate market size for specific brands based on validated field-level intelligence.
Our data mining techniques incorporate both parametric and non-parametric methods, allowing for structured data collection, sorting, processing, and cleaning.
Demand projections are derived from large-scale data sets analyzed through proprietary algorithms, culminating in robust and reliable market sizing.
Research Approach
The bottom-up approach builds market estimates by starting with the smallest addressable market units and systematically aggregating them to create comprehensive market size projections.
This method begins with specific, granular data points and builds upward to create the complete market landscape.
Customer Analysis → Segmental Analysis → Geographical Analysis
The top-down approach starts with the broadest possible market data and systematically narrows it down through a series of filters and assumptions to arrive at specific market segments or opportunities.
This method begins with the big picture and works downward to increasingly specific market slices.
TAM → SAM → SOM


Research Methods
Desk / Secondary Research
While analysing the market, we extensively study secondary sources, directories, and databases to identify and collect information useful for this technical, market-oriented, and commercial report. Secondary sources that we utilize are not only the public sources, but it is a combination of Open Source, Associations, Paid Databases, MG Repository & Knowledgebase, and others.
- Company websites, annual reports, financial reports, broker reports, and investor presentations
- National government documents, statistical databases and reports
- News articles, press releases and web-casts specific to the companies operating in the market, Magazines, reports, and others
- We gather information from commercial data sources for deriving company specific data such as segmental revenue, share for geography, product revenue, and others
- Internal and external proprietary databases (industry-specific), relevant patent, and regulatory databases
- Governing Bodies, Government Organizations
- Relevant Authorities, Country-specific Associations for Industries
We also employ the model mapping approach to estimate the product level market data through the players' product portfolio
Primary Research
Primary research/ interviews is vital in analyzing the market. Most of the cases involves paid primary interviews. Primary sources include primary interviews through e-mail interactions, telephonic interviews, surveys as well as face-to-face interviews with the different stakeholders across the value chain including several industry experts.
| Type of Respondents | Number of Primaries |
|---|---|
| Tier 2/3 Suppliers | ~20 |
| Tier 1 Suppliers | ~25 |
| End-users | ~25 |
| Industry Expert/ Panel/ Consultant | ~30 |
| Total | ~100 |
MG Knowledgebase
• Repository of industry blog, newsletter and case studies
• Online platform covering detailed market reports, and company profiles
Forecasting Factors and Models
Forecasting Factors
- Historical Trends – Past market patterns, cycles, and major events that shaped how markets behave over time. Understanding past trends helps predict future behavior.
- Industry Factors – Specific characteristics of the industry like structure, regulations, and innovation cycles that affect market dynamics.
- Macroeconomic Factors – Economic conditions like GDP growth, inflation, and employment rates that affect how much money people have to spend.
- Demographic Factors – Population characteristics like age, income, and location that determine who can buy your product.
- Technology Factors – How quickly people adopt new technology and how much technology infrastructure exists.
- Regulatory Factors – Government rules, laws, and policies that can help or restrict market growth.
- Competitive Factors – Analyzing competition structure such as degree of competition and bargaining power of buyers and suppliers.
Forecasting Models / Techniques
Multiple Regression Analysis
- Identify and quantify factors that drive market changes
- Statistical modeling to establish relationships between market drivers and outcomes
Time Series Analysis – Seasonal Patterns
- Understand regular cyclical patterns in market demand
- Advanced statistical techniques to separate trend, seasonal, and irregular components
Time Series Analysis – Trend Analysis
- Identify underlying market growth patterns and momentum
- Statistical analysis of historical data to project future trends
Expert Opinion – Expert Interviews
- Gather deep industry insights and contextual understanding
- In-depth interviews with key industry stakeholders
Multi-Scenario Development
- Prepare for uncertainty by modeling different possible futures
- Creating optimistic, pessimistic, and most likely scenarios
Time Series Analysis – Moving Averages
- Sophisticated forecasting for complex time series data
- Auto-regressive integrated moving average models with seasonal components
Econometric Models
- Apply economic theory to market forecasting
- Sophisticated economic models that account for market interactions
Expert Opinion – Delphi Method
- Harness collective wisdom of industry experts
- Structured, multi-round expert consultation process
Monte Carlo Simulation
- Quantify uncertainty and probability distributions
- Thousands of simulations with varying input parameters
Research Analysis
Our research framework is built upon the fundamental principle of validating market intelligence from both demand and supply perspectives. This dual-sided approach ensures comprehensive market understanding and reduces the risk of single-source bias.
Demand-Side Analysis: We understand end-user/application behavior, preferences, and market needs along with the penetration of the product for specific application.
Supply-Side Analysis: We estimate overall market revenue, analyze the segmental share along with industry capacity, competitive landscape, and market structure.
Validation & Evaluation
Data triangulation is a validation technique that uses multiple methods, sources, or perspectives to examine the same research question, thereby increasing the credibility and reliability of research findings. In market research, triangulation serves as a quality assurance mechanism that helps identify and minimize bias, validate assumptions, and ensure accuracy in market estimates.
- Data Source Triangulation – Using multiple data sources to examine the same phenomenon
- Methodological Triangulation – Using multiple research methods to study the same research question
- Investigator Triangulation – Using multiple researchers or analysts to examine the same data
- Theoretical Triangulation – Using multiple theoretical perspectives to interpret the same data

Custom Market Research Services
We will customise the research for you, in case the report listed above does not meet your requirements.
Get 10% Free Customisation