Solar Power Market Size, Share & Trends Analysis Report by Technology Type (Photovoltaic (PV), Concentrated Solar Power (CSP)), Service Model, Component Type, System Architecture, Capacity Range, End-Use Industry, and Geography (North America, Europe, Asia Pacific, Middle East, Africa, and South America) – Global Industry Data, Trends, and Forecasts, 2026–2035
|
|
|
Segmental Data Insights |
|
|
Demand Trends |
|
|
Competitive Landscape |
|
|
Strategic Development |
|
|
Future Outlook & Opportunities |
|
Solar Power Market Size, Share, and Growth
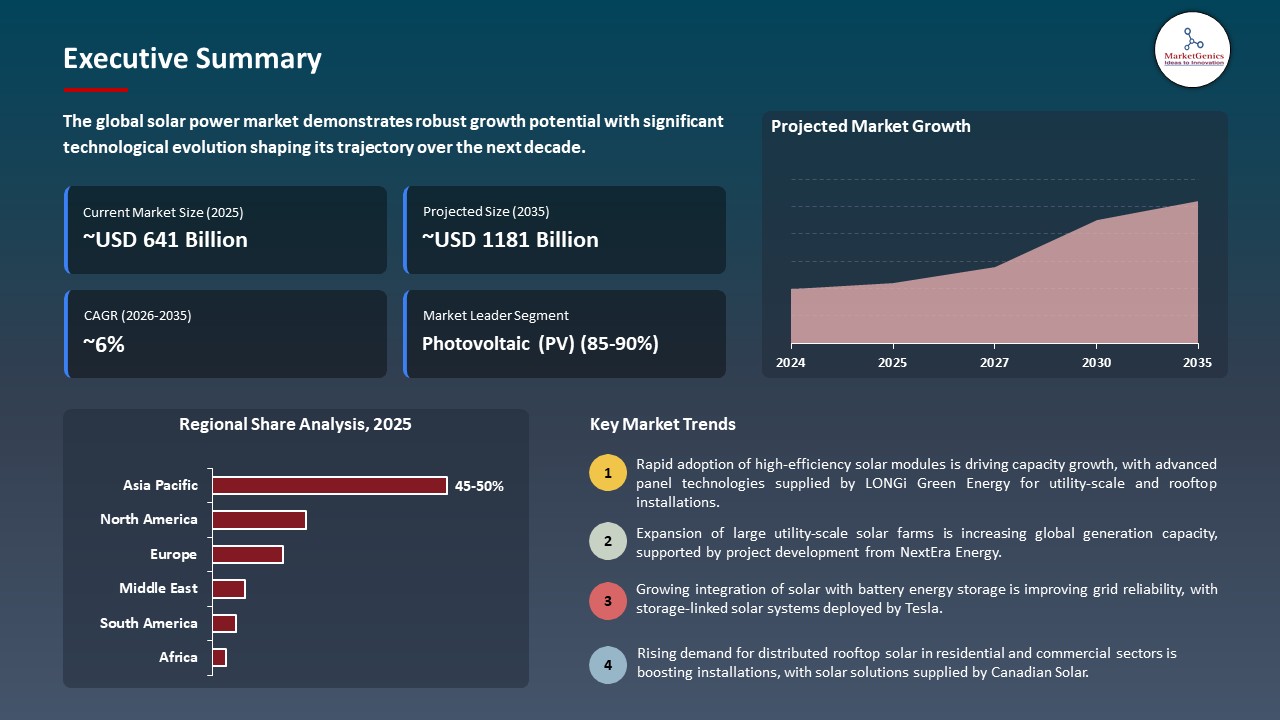
The global solar power market is witnessing strong growth, valued at USD 641.3 billion in 2025 and projected to reach USD 1181.4 billion by 2035, expanding at a CAGR of 6.3% during the forecast period. North America is the fastest-growing region due to strong government incentives, growing corporate adoption of solar power, and rapid expansion of utility-scale and distributed solar installations supporting clean energy targets.
Mr. Dennis She, Vice President of LONGi, said, “Indonesia holds immense potential in renewable energy, and LONGi is proud to contribute our world-leading solar technology to this transformative journey. This facility represents not just an investment in manufacturing but a long-term partnership to accelerate Indonesia’s clean energy future. By localizing production, we aim to drive down costs, foster innovation, and create high-value green jobs, reinforcing our commitment to a net-zero world.”
The solar power market is actively promoted by rapid decreasing prices of solar panels and encouraging government subsidies and the increasing international interest in the minimization of carbon emissions. The increasing electricity demand in residential and commercial and industrial sectors is increasing the deployment of rooftop and utility-scale solar projects across the global market. The progress of technology in high efficiency photovoltaic modules and bifacial panels is enhancing the energy output and lowering the levelized cost of electricity and hence making solar more competitive with the traditional sources of energy.
The LONGi Green Energy Technology has increased its high-efficiency monocrystalline PV modules production in 2025 to cater to utility-scale solar systems in Asia, and First Solar has set up multiple large-scale thin-film solar farms in North America to reinforce the renewable energy capacity. Greater penetration of energy storage networks into solar projects is also helping to increase grid reliability and is making the adoption of intermittent renewable energy smoother. Solar power is a pillar of clean energy transition in the world thanks to its mass adoption, which is facilitated by continual technological developments and cost-cutting measures.
Adjacent opportunities for the solar power market include energy storage systems, solar-powered electric vehicles, smart grid integration, rooftop and building-integrated photovoltaics, and off-grid solar microgrids are key adjacent opportunities for the solar power market, enabling efficient energy use, decentralized generation, and enhanced grid reliability. Growth of these adjacent markets strengthens solar adoption and accelerates the global transition to clean, sustainable energy.

Solar Power Market Dynamics and Trends
Driver: Increasing Utility‑Scale Solar Investments and Power Purchase Agreements
-
The solar power market is propelled by the increased use of utility-scale solar projects and power purchase agreements (PPAs), which span over time, as utilities and corporations pursue cost-effective and clean energy solutions to sustainability and net-zero goals.
- These investments facilitate massive capacity expansion of solar power, efficiency in the production of energy, and grid stability with holistically conceived planning and storage services. The long-term contracts, which are well organized, bring predictability of revenue to developers, which will result in more capital inflows and boost the scale adoption of renewable energy.
- NextEra Energy Resources and Meta Platforms Inc. signed 2.5 GW of solar and clean energy deals, consisting of 11 solar PPAs and two energy storage deals in ERCOT, SPP, MISO, and New Mexico in 2025, which will lead to large-scale deployment of solar and facilitate corporate objectives of 100% clean energy.
- The increasing investments in utility-scale and PPAs enhance market expansion, enhance energy security, and advocate the global shift toward sustainable electricity.
Restraint: Grid Integration Challenges and Curtailment Issues in High‑Solar Regions
-
The high level of solar penetration in the regions has witnessed the rapid increase in solar power capacity that causes grid integration dilemma and the common curtailment of the electricity produced. Since solar production tends to be much more than is needed by local customers or potential transmission capacity, utility companies must trim or cut power production, compromising the overall system effectiveness and project revenues.
- The challenges are exacerbated by the fact that the infrastructure is aging, high-capacity transmission lines are lacking, and there is not enough energy storage that allows a smooth flow of solar energy to the high-demand regions. Moreover, weather changes in the generation of sunlight and adverse load imbalances make the grid more unstable, which necessitates advanced forecasting and grid management software.
- The grid integration constraints and curtailment decrease the useful use of solar capacity, increases the cost of operation and may decrease the speed of solar market expansion in high-penetration areas.
Opportunity: Growth of Solar‑Plus‑Storage Systems for Dispatchable Clean Power
-
Combining energy storage with solar energy has a big opportunity by converting unpredictable solar power to dispatchable reliable electricity. The solar plus storage systems contribute to stabilizing the supply and demand, storing the surplus energy during low demand times, and providing power at the peak times.
- • This integration boosts grid stability, allows to use solar resource more effectively and opens new sources of income in terms of capacity markets and ancillary services. The Proliferation of these hybrid systems will speed up the process of adoption of flexible clean solutions of energy.
- ReNew Energy plans to start a hybrid renewable project with a capacity of about 2.8 GW in Andhra Pradesh in 2025, which would have a solar and wind capacity of 1.8 and 1GW, respectively, and a battery capacity of 2 GWh. The project will improve dispatchable clean power, peak demand management, and renewable energy and Make-in-India objectives.
- Solar-plus-storage increases market opportunities, energy reliability and enhances economics of renewable energy projects.
Key Trend: Digitalization, AI Forecasting, and Smart Solar Plant Operations
-
The solar power market is becoming digitalized and increasingly implementing AI-based technologies to optimize the work of the plants, to increase energy output, and predictive maintenance. High-level analytics, machine learning, and real-time monitoring enable the operators to make accurate predictions about solar generation as well as identify anomalies in performance in a timely manner.
- Smart solar plant operations allow using resources efficiently, minimize downtimes, and be integrated with grid management systems. Through these technologies, developers will be able to exploit the capacity to optimize cost, reduce operating costs, and enhance the reliability and scalability of solar power plants.
- In 2025, Huawei Digital Power has unveiled its all-scenario grid-forming ESS at Intersolar Europe to allow utility, microgrid, C&I, and residential solar applications. The solution improves grid stability, combines new high-tech 4T technologies, and leads to the shift to entirely renewable, smart power systems.
- AI and digitalization increase the performance of operations, boost returns, and advance the use of smart and technology-enabled solar energy systems.
 Solar Power Market Analysis and Segmental Data
Photovoltaic (PV) Dominate Global Solar Power Market
-
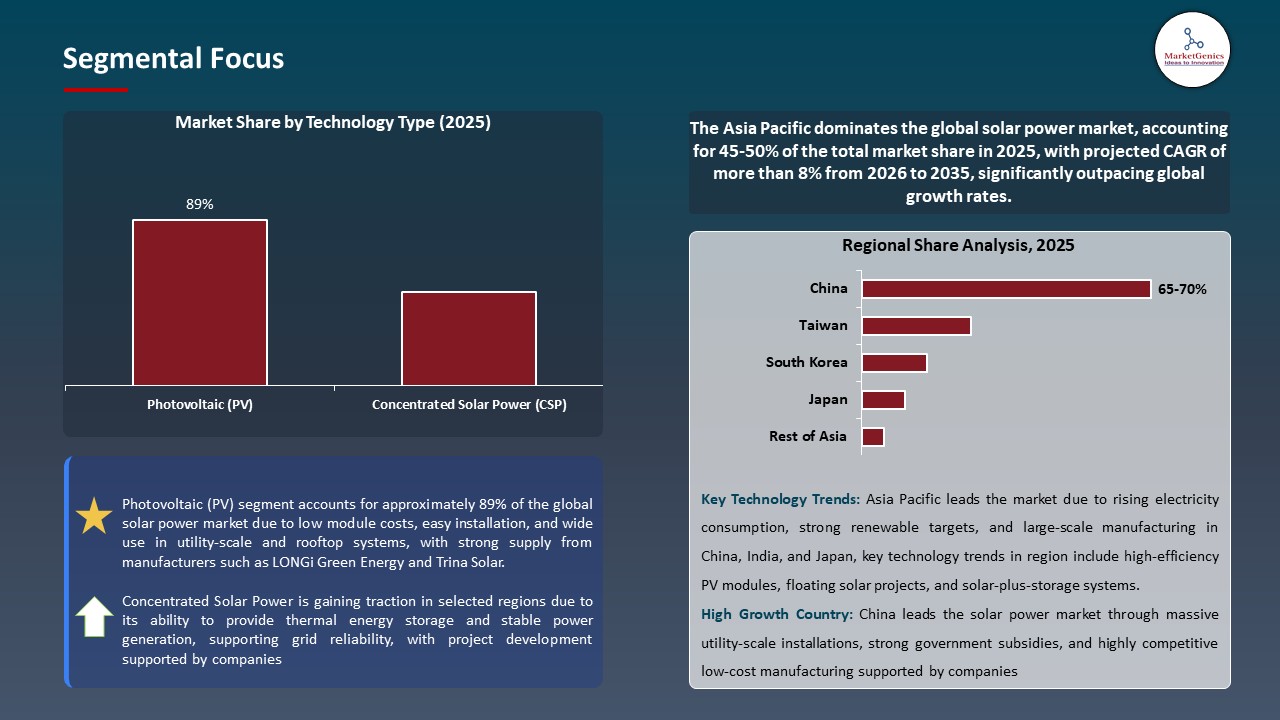
Photovoltaic (PV) technology is the most dominant segment in the global solar power market, due to its efficiency, scalability and falling prices. PV systems that can be either a roof of a home or a large utility scale farm have been widely used because of their modularity, simplicity of installation as well as the fact that it produces electricity directly by the sun.
- The development in PV technologies, such as increased efficiency cells, bifacial panels and better inverters, is increasing power generation and stability. Combination with energy storage and smart grid systems also further consolidates the role of PV in generation of consistent and dispatchable power.
- PV technology dominance will increase the pace of a worldwide switch to clean energy, increase the capacity of solar production, and support the expansion of sustainable electricity production in a wide range of applications.
Asia Pacific Leads Global Solar Power Market Demand
-
The Asia Pacific region continues to dominate the global solar power market due to its abundant solar resources, supportive government policies, and large-scale renewable energy targets. Countries in the region are investing heavily in solar infrastructure, grid expansion, and manufacturing of photovoltaic (PV) modules, enabling rapid deployment and cost efficiencies.
- High population and increased power demand also motivate the use of solar in residential, commercial, and utility type setups. The governments in the region provide incentives like the feed-in tariffs, tax credit and renewable portfolio standards, which has led to stimulated growth and investment by the private sector.
- The leadership of solar power in Asia Pacific will drive the worldwide adoption of renewable energy, empower the supply chains, and position the region as a major source of innovations and massive clean energy implementation in the global arena.
Solar Power Market Ecosystem
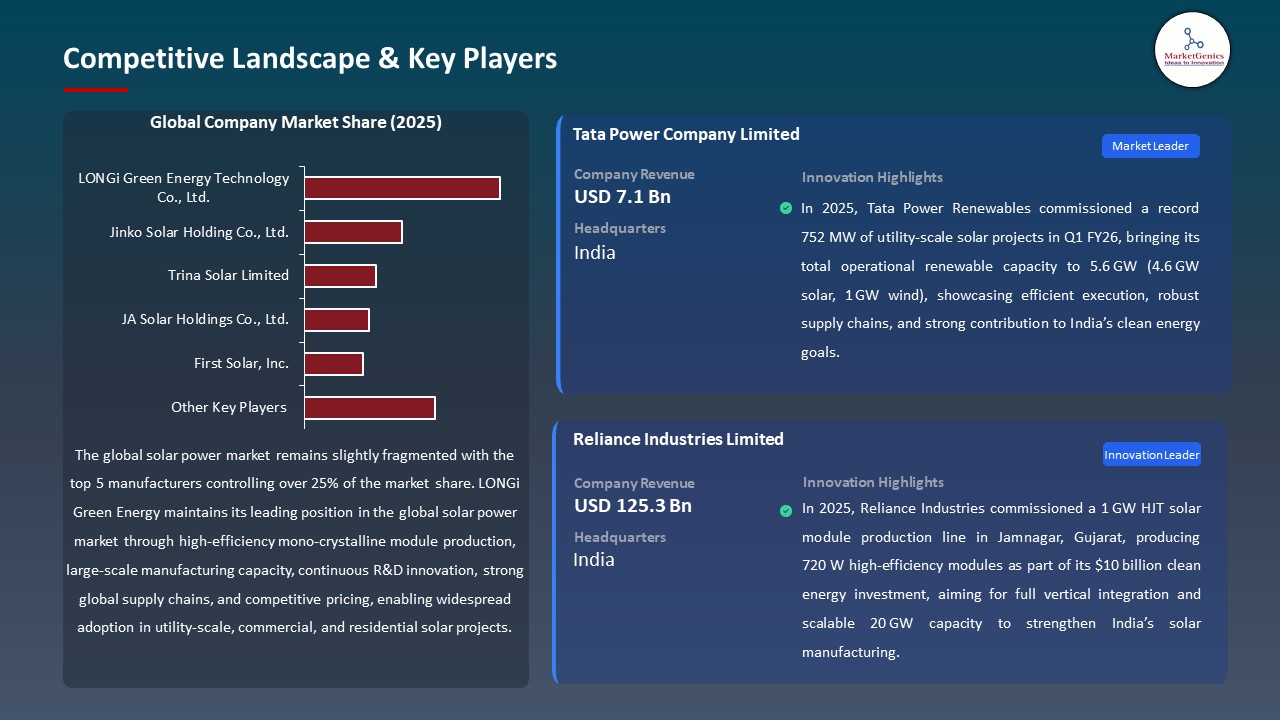
The global solar power market is slightly fragmented, with key players including LONGi Green Energy Technology Co., Ltd., Jinko Solar Holding Co., Ltd., Trina Solar Limited, JA Solar Holdings Co., Ltd., and First Solar, Inc. These corporations capitalize on diversified photovoltaic technology, high efficiency solar panels as well as large global production and distribution facilities. Their market power is also solaced by their strategic partnerships with utility companies, current R&D of high-performance and low-cost solar modules, and investments in next-generation utility-scale application, commercial and residential solar installations.
Value chain also includes sourcing of raw materials (silicon wafers, solar cells, thin-film materials), module manufacturing, panel assembly, system assembly, distribution, and post sales services (monitoring of performance, maintenance and warranty). Each stage has guaranteed domestic, business, and utility-scale energy efficiency, durability, and reliability.
The barriers to entry are high because of the complexity of technology, capital-intensive production, and close OEM-supply relationships. Differentiation, scalability, and sustainable market growth is a result of continuous innovation in high-efficiency modules, bifacial technology, and integrated solar-storage solutions.
 Recent Development and Strategic Overview:
-
In March 2026, Sunview Group Berhad announced plans to acquire a 100% stake in JSNT Renewables, which owns and operates a 50 MWac solar power plant, marking a strategic shift from EPC services to owning and operating solar assets. This acquisition will expand Sunview’s renewable portfolio and enable recurring revenue from electricity sales, enhancing long-term operational and financial stability.
- In March 2026, Bessco Power Pvt. Ltd. and Renergo Developers Pvt. Ltd. formed a joint venture to develop 1 GW of utility-scale solar projects across India and Nepal, with plans to explore green hydrogen, green ammonia, and CBG opportunities. The collaboration leverages both companies’ expertise to expand clean energy capacity and support regional energy transition goals over the next 18–24 months.
Report Scope
|
Detail |
|
|
Market Size in 2025 |
USD 641.3 Bn |
|
Market Forecast Value in 2035 |
USD 1181.4 Bn |
|
Growth Rate (CAGR) |
6.3% |
|
Forecast Period |
2026 – 2035 |
|
Historical Data Available for |
2021 – 2024 |
|
Market Size Units |
US$ Billion for Value |
|
Report Format |
Electronic (PDF) + Excel |
|
North America |
Europe |
Asia Pacific |
Middle East |
Africa |
South America |
|
|
|
|
|
|
|
Companies Covered |
|||||
|
|
|
|
|
|
Solar Power Market Segmentation and Highlights
|
Segment |
Sub-segment |
|
Solar Power Market, By Technology Type |
|
|
Solar Power Market, By Service Model |
|
|
Solar Power Market, By Component Type |
|
|
Solar Power Market, By System Architecture |
|
|
Solar Power Market, By Installation Type |
|
|
Solar Power Market, By Capacity Range |
|
|
Solar Power Market, By End-Use Industry |
|
Frequently Asked Questions
Table of Contents
- 1. Research Methodology and Assumptions
- 1.1. Definitions
- 1.2. Research Design and Approach
- 1.3. Data Collection Methods
- 1.4. Base Estimates and Calculations
- 1.5. Forecasting Models
- 1.5.1. Key Forecast Factors & Impact Analysis
- 1.6. Secondary Research
- 1.6.1. Open Sources
- 1.6.2. Paid Databases
- 1.6.3. Associations
- 1.7. Primary Research
- 1.7.1. Primary Sources
- 1.7.2. Primary Interviews with Stakeholders across Ecosystem
- 2. Executive Summary
- 2.1. Global Solar Power Market Outlook
- 2.1.1. Solar Power Market Size Value (US$ Bn), and Forecasts, 2021-2035
- 2.1.2. Compounded Annual Growth Rate Analysis
- 2.1.3. Growth Opportunity Analysis
- 2.1.4. Segmental Share Analysis
- 2.1.5. Geographical Share Analysis
- 2.2. Market Analysis and Facts
- 2.3. Supply-Demand Analysis
- 2.4. Competitive Benchmarking
- 2.5. Go-to- Market Strategy
- 2.5.1. Customer/ End-use Industry Assessment
- 2.5.2. Growth Opportunity Data, 2026-2035
- 2.5.2.1. Regional Data
- 2.5.2.2. Country Data
- 2.5.2.3. Segmental Data
- 2.5.3. Identification of Potential Market Spaces
- 2.5.4. GAP Analysis
- 2.5.5. Potential Attractive Price Points
- 2.5.6. Prevailing Market Risks & Challenges
- 2.5.7. Preferred Sales & Marketing Strategies
- 2.5.8. Key Recommendations and Analysis
- 2.5.9. A Way Forward
- 2.1. Global Solar Power Market Outlook
- 3. Industry Data and Premium Insights
- 3.1. Global Energy & Power Industry Overview, 2025
- 3.1.1. Energy & Power Industry Ecosystem Analysis
- 3.1.2. Key Trends for Energy & Power Industry
- 3.1.3. Regional Distribution for Energy & Power Industry
- 3.2. Supplier Customer Data
- 3.3. Technology Roadmap and Developments
- 3.4. Trade Analysis
- 3.4.1. Import & Export Analysis, 2025
- 3.4.2. Top Importing Countries
- 3.4.3. Top Exporting Countries
- 3.5. Trump Tariff Impact Analysis
- 3.5.1. Manufacturer
- 3.5.1.1. Based on the component & Raw material
- 3.5.2. Supply Chain
- 3.5.3. End Consumer
- 3.5.1. Manufacturer
- 3.6. Raw Material Analysis
- 3.1. Global Energy & Power Industry Overview, 2025
- 4. Market Overview
- 4.1. Market Dynamics
- 4.1.1. Drivers
- 4.1.1.1. Growing demand for clean and renewable energy sources.
- 4.1.1.2. Government incentives, subsidies, and favorable policies for solar adoption.
- 4.1.1.3. Declining costs of solar panels and advanced photovoltaic technologies.
- 4.1.2. Restraints
- 4.1.2.1. Intermittency of solar energy due to weather and daylight dependence.
- 4.1.2.2. High initial capital investment for large-scale solar installations.
- 4.1.1. Drivers
- 4.2. Key Trend Analysis
- 4.3. Regulatory Framework
- 4.3.1. Key Regulations, Norms, and Subsidies, by Key Countries
- 4.3.2. Tariffs and Standards
- 4.3.3. Impact Analysis of Regulations on the Market
- 4.4. Ecosystem Analysis
- 4.5. Porter’s Five Forces Analysis
- 4.6. PESTEL Analysis
- 4.7. Global Solar Power Market Demand
- 4.7.1. Historical Market Size – Value (US$ Bn), 2020-2024
- 4.7.2. Current and Future Market Size – Value (US$ Bn), 2026–2035
- 4.7.2.1. Y-o-Y Growth Trends
- 4.7.2.2. Absolute $ Opportunity Assessment
- 4.1. Market Dynamics
- 5. Competition Landscape
- 5.1. Competition structure
- 5.1.1. Fragmented v/s consolidated
- 5.2. Company Share Analysis, 2025
- 5.2.1. Global Company Market Share
- 5.2.2. By Region
- 5.2.2.1. North America
- 5.2.2.2. Europe
- 5.2.2.3. Asia Pacific
- 5.2.2.4. Middle East
- 5.2.2.5. Africa
- 5.2.2.6. South America
- 5.3. Product Comparison Matrix
- 5.3.1. Specifications
- 5.3.2. Market Positioning
- 5.3.3. Pricing
- 5.1. Competition structure
- 6. Global Solar Power Market Analysis, by Technology Type
- 6.1. Key Segment Analysis
- 6.2. Solar Power Market Size Value (US$ Bn), Analysis, and Forecasts, by Technology Type, 2021-2035
- 6.2.1. Photovoltaic (PV)
- 6.2.1.1. Monocrystalline Silicon
- 6.2.1.2. Polycrystalline Silicon
- 6.2.1.3. Thin-Film
- 6.2.1.4. Perovskite
- 6.2.1.5. Cadmium Telluride (CdTe)
- 6.2.1.6. Others
- 6.2.2. Concentrated Solar Power (CSP)
- 6.2.2.1. Parabolic Trough
- 6.2.2.2. Solar Tower
- 6.2.2.3. Linear Fresnel Reflector
- 6.2.2.4. Dish Stirling
- 6.2.2.5. Others
- 6.2.1. Photovoltaic (PV)
- 7. Global Solar Power Market Analysis, by Service Model
- 7.1. Key Segment Analysis
- 7.2. Solar Power Market Size Value (US$ Bn), Analysis, and Forecasts, by Service Model, 2021-2035
- 7.2.1. Equipment Sales
- 7.2.2. Solar-as-a-Service (SaaS)
- 7.2.2.1. Power Purchase Agreements (PPA)
- 7.2.2.2. Lease Models
- 7.2.2.3. Rental Models
- 7.2.2.4. Others
- 7.2.3. Maintenance & Operations
- 7.2.4. Installation Services
- 8. Global Solar Power Market Analysis, Component Type
- 8.1. Key Segment Analysis
- 8.2. Solar Power Market Size Value (US$ Bn), Analysis, and Forecasts, by Thickness Grade, 2021-2035
- 8.2.1. Solar Panels/Modules
- 8.2.2. Inverters
- 8.2.3. Balance of System (BoS)
- 8.2.3.1. Mounting Structures
- 8.2.3.2. Racking Systems
- 8.2.3.3. Wiring & Connectors
- 8.2.3.4. Others
- 8.2.4. Energy Storage Systems
- 8.2.4.1. Batteries
- 8.2.4.2. Thermal Storage
- 8.2.4.3. Others
- 8.2.5. Monitoring & Control Systems
- 8.2.6. Other Components
- 9. Global Solar Power Market Analysis, by System Architecture
- 9.1. Key Segment Analysis
- 9.2. Solar Power Market Size Value (US$ Bn), Analysis, and Forecasts, by System Architecture, 2021-2035
- 9.2.1. Grid-Tied (On-Grid) Systems
- 9.2.2. Off-Grid Systems
- 9.2.3. Hybrid Systems
- 10. Global Solar Power Market Analysis, by Installation Type
- 10.1. Key Segment Analysis
- 10.2. Solar Power Market Size Value (US$ Bn), Analysis, and Forecasts, by Installation Type, 2021-2035
- 10.2.1. Rooftop-Mounted Systems
- 10.2.2. Ground-Mounted Systems
- 10.2.3. Building-Integrated Photovoltaics (BIPV)
- 10.2.4. Floating Solar
- 10.2.5. Solar Canopies
- 11. Global Solar Power Market Analysis, by Capacity Range
- 11.1. Key Segment Analysis
- 11.2. Solar Power Market Size Value (US$ Bn), Analysis, and Forecasts, by Capacity Range, 2021-2035
- 11.2.1. Small-Scale (<10 kW)
- 11.2.2. Medium-Scale (10-100 kW)
- 11.2.3. Large-Scale (100 kW - 1 MW)
- 11.2.4. Utility-Scale (>1 MW)
- 12. Global Solar Power Market Analysis, by End-Use Industry
- 12.1. Key Segment Analysis
- 12.2. Solar Power Market Size Value (US$ Bn), Analysis, and Forecasts, by End-Use Industry, 2021-2035
- 12.2.1. Energy & Power Generation Sector
- 12.2.2. Manufacturing & Industrial Facilities
- 12.2.3. Healthcare & Medical Facilities
- 12.2.4. Hospitality & Tourism Industry
- 12.2.5. Retail & Commercial Establishments
- 12.2.6. Mining & Extraction Industry
- 12.2.7. Water & Wastewater Treatment
- 12.2.8. Transportation & Logistics
- 12.2.9. Educational Institutions
- 12.2.10. Others
- 13. Global Solar Power Market Analysis and Forecasts, by Region
- 13.1. Key Findings
- 13.2. Solar Power Market Size Value (US$ Bn), Analysis, and Forecasts, by Region, 2021-2035
- 13.2.1. North America
- 13.2.2. Europe
- 13.2.3. Asia Pacific
- 13.2.4. Middle East
- 13.2.5. Africa
- 13.2.6. South America
- 14. North America Solar Power Market Analysis
- 14.1. Key Segment Analysis
- 14.2. Regional Snapshot
- 14.3. North America Solar Power Market Size Value (US$ Bn), Analysis, and Forecasts, 2021-2035
- 14.3.1. Technology Type
- 14.3.2. Service Model
- 14.3.3. Component Type
- 14.3.4. System Architecture
- 14.3.5. Installation Type
- 14.3.6. Capacity Range
- 14.3.7. End-Use Industry
- 14.3.8. Country
- 14.3.8.1. USA
- 14.3.8.2. Canada
- 14.3.8.3. Mexico
- 14.4. USA Solar Power Market
- 14.4.1. Country Segmental Analysis
- 14.4.2. Technology Type
- 14.4.3. Service Model
- 14.4.4. Component Type
- 14.4.5. System Architecture
- 14.4.6. Installation Type
- 14.4.7. Capacity Range
- 14.4.8. End-Use Industry
- 14.5. Canada Solar Power Market
- 14.5.1. Country Segmental Analysis
- 14.5.2. Technology Type
- 14.5.3. Service Model
- 14.5.4. Component Type
- 14.5.5. System Architecture
- 14.5.6. Installation Type
- 14.5.7. Capacity Range
- 14.5.8. End-Use Industry
- 14.6. Mexico Solar Power Market
- 14.6.1. Country Segmental Analysis
- 14.6.2. Technology Type
- 14.6.3. Service Model
- 14.6.4. Component Type
- 14.6.5. System Architecture
- 14.6.6. Installation Type
- 14.6.7. Capacity Range
- 14.6.8. End-Use Industry
- 15. Europe Solar Power Market Analysis
- 15.1. Key Segment Analysis
- 15.2. Regional Snapshot
- 15.3. Europe Solar Power Market Size Value (US$ Bn), Analysis, and Forecasts, 2021-2035
- 15.3.1. Technology Type
- 15.3.2. Service Model
- 15.3.3. Component Type
- 15.3.4. System Architecture
- 15.3.5. Installation Type
- 15.3.6. Capacity Range
- 15.3.7. End-Use Industry
- 15.3.8. Country
- 15.3.8.1. Germany
- 15.3.8.2. United Kingdom
- 15.3.8.3. France
- 15.3.8.4. Italy
- 15.3.8.5. Spain
- 15.3.8.6. Netherlands
- 15.3.8.7. Nordic Countries
- 15.3.8.8. Poland
- 15.3.8.9. Russia & CIS
- 15.3.8.10. Rest of Europe
- 15.4. Germany Solar Power Market
- 15.4.1. Country Segmental Analysis
- 15.4.2. Technology Type
- 15.4.3. Service Model
- 15.4.4. Component Type
- 15.4.5. System Architecture
- 15.4.6. Installation Type
- 15.4.7. Capacity Range
- 15.4.8. End-Use Industry
- 15.5. United Kingdom Solar Power Market
- 15.5.1. Country Segmental Analysis
- 15.5.2. Technology Type
- 15.5.3. Service Model
- 15.5.4. Component Type
- 15.5.5. System Architecture
- 15.5.6. Installation Type
- 15.5.7. Capacity Range
- 15.5.8. End-Use Industry
- 15.6. France Solar Power Market
- 15.6.1. Country Segmental Analysis
- 15.6.2. Technology Type
- 15.6.3. Service Model
- 15.6.4. Component Type
- 15.6.5. System Architecture
- 15.6.6. Installation Type
- 15.6.7. Capacity Range
- 15.6.8. End-Use Industry
- 15.7. Italy Solar Power Market
- 15.7.1. Country Segmental Analysis
- 15.7.2. Technology Type
- 15.7.3. Service Model
- 15.7.4. Component Type
- 15.7.5. System Architecture
- 15.7.6. Installation Type
- 15.7.7. Capacity Range
- 15.7.8. End-Use Industry
- 15.8. Spain Solar Power Market
- 15.8.1. Country Segmental Analysis
- 15.8.2. Technology Type
- 15.8.3. Service Model
- 15.8.4. Component Type
- 15.8.5. System Architecture
- 15.8.6. Installation Type
- 15.8.7. Capacity Range
- 15.8.8. End-Use Industry
- 15.9. Netherlands Solar Power Market
- 15.9.1. Country Segmental Analysis
- 15.9.2. Technology Type
- 15.9.3. Service Model
- 15.9.4. Component Type
- 15.9.5. System Architecture
- 15.9.6. Installation Type
- 15.9.7. Capacity Range
- 15.9.8. End-Use Industry
- 15.10. Nordic Countries Solar Power Market
- 15.10.1. Country Segmental Analysis
- 15.10.2. Technology Type
- 15.10.3. Service Model
- 15.10.4. Component Type
- 15.10.5. System Architecture
- 15.10.6. Installation Type
- 15.10.7. Capacity Range
- 15.10.8. End-Use Industry
- 15.11. Poland Solar Power Market
- 15.11.1. Country Segmental Analysis
- 15.11.2. Technology Type
- 15.11.3. Service Model
- 15.11.4. Component Type
- 15.11.5. System Architecture
- 15.11.6. Installation Type
- 15.11.7. Capacity Range
- 15.11.8. End-Use Industry
- 15.12. Russia & CIS Solar Power Market
- 15.12.1. Country Segmental Analysis
- 15.12.2. Technology Type
- 15.12.3. Service Model
- 15.12.4. Component Type
- 15.12.5. System Architecture
- 15.12.6. Installation Type
- 15.12.7. Capacity Range
- 15.12.8. End-Use Industry
- 15.13. Rest of Europe Solar Power Market
- 15.13.1. Country Segmental Analysis
- 15.13.2. Technology Type
- 15.13.3. Service Model
- 15.13.4. Component Type
- 15.13.5. System Architecture
- 15.13.6. Installation Type
- 15.13.7. Capacity Range
- 15.13.8. End-Use Industry
- 16. Asia Pacific Solar Power Market Analysis
- 16.1. Key Segment Analysis
- 16.2. Regional Snapshot
- 16.3. Asia Pacific Solar Power Market Size Value (US$ Bn), Analysis, and Forecasts, 2021-2035
- 16.3.1. Technology Type
- 16.3.2. Service Model
- 16.3.3. Component Type
- 16.3.4. System Architecture
- 16.3.5. Installation Type
- 16.3.6. Capacity Range
- 16.3.7. End-Use Industry
- 16.3.8. Country
- 16.3.8.1. China
- 16.3.8.2. India
- 16.3.8.3. Japan
- 16.3.8.4. South Korea
- 16.3.8.5. Australia and New Zealand
- 16.3.8.6. Indonesia
- 16.3.8.7. Malaysia
- 16.3.8.8. Thailand
- 16.3.8.9. Vietnam
- 16.3.8.10. Rest of Asia Pacific
- 16.4. China Solar Power Market
- 16.4.1. Country Segmental Analysis
- 16.4.2. Technology Type
- 16.4.3. Service Model
- 16.4.4. Component Type
- 16.4.5. System Architecture
- 16.4.6. Installation Type
- 16.4.7. Capacity Range
- 16.4.8. End-Use Industry
- 16.5. India Solar Power Market
- 16.5.1. Country Segmental Analysis
- 16.5.2. Technology Type
- 16.5.3. Service Model
- 16.5.4. Component Type
- 16.5.5. System Architecture
- 16.5.6. Installation Type
- 16.5.7. Capacity Range
- 16.5.8. End-Use Industry
- 16.6. Japan Solar Power Market
- 16.6.1. Country Segmental Analysis
- 16.6.2. Technology Type
- 16.6.3. Service Model
- 16.6.4. Component Type
- 16.6.5. System Architecture
- 16.6.6. Installation Type
- 16.6.7. Capacity Range
- 16.6.8. End-Use Industry
- 16.7. South Korea Solar Power Market
- 16.7.1. Country Segmental Analysis
- 16.7.2. Technology Type
- 16.7.3. Service Model
- 16.7.4. Component Type
- 16.7.5. System Architecture
- 16.7.6. Installation Type
- 16.7.7. Capacity Range
- 16.7.8. End-Use Industry
- 16.8. Australia and New Zealand Solar Power Market
- 16.8.1. Country Segmental Analysis
- 16.8.2. Technology Type
- 16.8.3. Service Model
- 16.8.4. Component Type
- 16.8.5. System Architecture
- 16.8.6. Installation Type
- 16.8.7. Capacity Range
- 16.8.8. End-Use Industry
- 16.9. Indonesia Solar Power Market
- 16.9.1. Country Segmental Analysis
- 16.9.2. Technology Type
- 16.9.3. Service Model
- 16.9.4. Component Type
- 16.9.5. System Architecture
- 16.9.6. Installation Type
- 16.9.7. Capacity Range
- 16.9.8. End-Use Industry
- 16.10. Malaysia Solar Power Market
- 16.10.1. Country Segmental Analysis
- 16.10.2. Technology Type
- 16.10.3. Service Model
- 16.10.4. Component Type
- 16.10.5. System Architecture
- 16.10.6. Installation Type
- 16.10.7. Capacity Range
- 16.10.8. End-Use Industry
- 16.11. Thailand Solar Power Market
- 16.11.1. Country Segmental Analysis
- 16.11.2. Technology Type
- 16.11.3. Service Model
- 16.11.4. Component Type
- 16.11.5. System Architecture
- 16.11.6. Installation Type
- 16.11.7. Capacity Range
- 16.11.8. End-Use Industry
- 16.12. Vietnam Solar Power Market
- 16.12.1. Country Segmental Analysis
- 16.12.2. Technology Type
- 16.12.3. Service Model
- 16.12.4. Component Type
- 16.12.5. System Architecture
- 16.12.6. Installation Type
- 16.12.7. Capacity Range
- 16.12.8. End-Use Industry
- 16.13. Rest of Asia Pacific Solar Power Market
- 16.13.1. Country Segmental Analysis
- 16.13.2. Technology Type
- 16.13.3. Service Model
- 16.13.4. Component Type
- 16.13.5. System Architecture
- 16.13.6. Installation Type
- 16.13.7. Capacity Range
- 16.13.8. End-Use Industry
- 17. Middle East Solar Power Market Analysis
- 17.1. Key Segment Analysis
- 17.2. Regional Snapshot
- 17.3. Middle East Solar Power Market Size Value (US$ Bn), Analysis, and Forecasts, 2021-2035
- 17.3.1. Technology Type
- 17.3.2. Service Model
- 17.3.3. Component Type
- 17.3.4. System Architecture
- 17.3.5. Installation Type
- 17.3.6. Capacity Range
- 17.3.7. End-Use Industry
- 17.3.8. Country
- 17.3.8.1. Turkey
- 17.3.8.2. UAE
- 17.3.8.3. Saudi Arabia
- 17.3.8.4. Israel
- 17.3.8.5. Rest of Middle East
- 17.4. Turkey Solar Power Market
- 17.4.1. Country Segmental Analysis
- 17.4.2. Technology Type
- 17.4.3. Service Model
- 17.4.4. Component Type
- 17.4.5. System Architecture
- 17.4.6. Installation Type
- 17.4.7. Capacity Range
- 17.4.8. End-Use Industry
- 17.5. UAE Solar Power Market
- 17.5.1. Country Segmental Analysis
- 17.5.2. Technology Type
- 17.5.3. Service Model
- 17.5.4. Component Type
- 17.5.5. System Architecture
- 17.5.6. Installation Type
- 17.5.7. Capacity Range
- 17.5.8. End-Use Industry
- 17.6. Saudi Arabia Solar Power Market
- 17.6.1. Country Segmental Analysis
- 17.6.2. Technology Type
- 17.6.3. Service Model
- 17.6.4. Component Type
- 17.6.5. System Architecture
- 17.6.6. Installation Type
- 17.6.7. Capacity Range
- 17.6.8. End-Use Industry
- 17.7. Israel Solar Power Market
- 17.7.1. Country Segmental Analysis
- 17.7.2. Technology Type
- 17.7.3. Service Model
- 17.7.4. Component Type
- 17.7.5. System Architecture
- 17.7.6. Installation Type
- 17.7.7. Capacity Range
- 17.7.8. End-Use Industry
- 17.8. Rest of Middle East Solar Power Market
- 17.8.1. Country Segmental Analysis
- 17.8.2. Technology Type
- 17.8.3. Service Model
- 17.8.4. Component Type
- 17.8.5. System Architecture
- 17.8.6. Installation Type
- 17.8.7. Capacity Range
- 17.8.8. End-Use Industry
- 18. Africa Solar Power Market Analysis
- 18.1. Key Segment Analysis
- 18.2. Regional Snapshot
- 18.3. Africa Solar Power Market Size Value (US$ Bn), Analysis, and Forecasts, 2021-2035
- 18.3.1. Technology Type
- 18.3.2. Service Model
- 18.3.3. Component Type
- 18.3.4. System Architecture
- 18.3.5. Installation Type
- 18.3.6. Capacity Range
- 18.3.7. End-Use Industry
- 18.3.8. Country
- 18.3.8.1. South Africa
- 18.3.8.2. Egypt
- 18.3.8.3. Nigeria
- 18.3.8.4. Algeria
- 18.3.8.5. Rest of Africa
- 18.4. South Africa Solar Power Market
- 18.4.1. Country Segmental Analysis
- 18.4.2. Technology Type
- 18.4.3. Service Model
- 18.4.4. Component Type
- 18.4.5. System Architecture
- 18.4.6. Installation Type
- 18.4.7. Capacity Range
- 18.4.8. End-Use Industry
- 18.5. Egypt Solar Power Market
- 18.5.1. Country Segmental Analysis
- 18.5.2. Technology Type
- 18.5.3. Service Model
- 18.5.4. Component Type
- 18.5.5. System Architecture
- 18.5.6. Installation Type
- 18.5.7. Capacity Range
- 18.5.8. End-Use Industry
- 18.6. Nigeria Solar Power Market
- 18.6.1. Country Segmental Analysis
- 18.6.2. Technology Type
- 18.6.3. Service Model
- 18.6.4. Component Type
- 18.6.5. System Architecture
- 18.6.6. Installation Type
- 18.6.7. Capacity Range
- 18.6.8. End-Use Industry
- 18.7. Algeria Solar Power Market
- 18.7.1. Country Segmental Analysis
- 18.7.2. Technology Type
- 18.7.3. Service Model
- 18.7.4. Component Type
- 18.7.5. System Architecture
- 18.7.6. Installation Type
- 18.7.7. Capacity Range
- 18.7.8. End-Use Industry
- 18.8. Rest of Africa Solar Power Market
- 18.8.1. Country Segmental Analysis
- 18.8.2. Technology Type
- 18.8.3. Service Model
- 18.8.4. Component Type
- 18.8.5. System Architecture
- 18.8.6. Installation Type
- 18.8.7. Capacity Range
- 18.8.8. End-Use Industry
- 19. South America Solar Power Market Analysis
- 19.1. Key Segment Analysis
- 19.2. Regional Snapshot
- 19.3. South America Solar Power Market Size Value (US$ Bn), Analysis, and Forecasts, 2021-2035
- 19.3.1. Technology Type
- 19.3.2. Service Model
- 19.3.3. Component Type
- 19.3.4. System Architecture
- 19.3.5. Installation Type
- 19.3.6. Capacity Range
- 19.3.7. End-Use Industry
- 19.3.8. Country
- 19.3.8.1. Brazil
- 19.3.8.2. Argentina
- 19.3.8.3. Rest of South America
- 19.4. Brazil Solar Power Market
- 19.4.1. Country Segmental Analysis
- 19.4.2. Technology Type
- 19.4.3. Service Model
- 19.4.4. Component Type
- 19.4.5. System Architecture
- 19.4.6. Installation Type
- 19.4.7. Capacity Range
- 19.4.8. End-Use Industry
- 19.5. Argentina Solar Power Market
- 19.5.1. Country Segmental Analysis
- 19.5.2. Technology Type
- 19.5.3. Service Model
- 19.5.4. Component Type
- 19.5.5. System Architecture
- 19.5.6. Installation Type
- 19.5.7. Capacity Range
- 19.5.8. End-Use Industry
- 19.6. Rest of South America Solar Power Market
- 19.6.1. Country Segmental Analysis
- 19.6.2. Technology Type
- 19.6.3. Service Model
- 19.6.4. Component Type
- 19.6.5. System Architecture
- 19.6.6. Installation Type
- 19.6.7. Capacity Range
- 19.6.8. End-Use Industry
- 20. Key Players/ Company Profile
- 20.1. ABB Ltd.
- 20.1.1. Company Details/ Overview
- 20.1.2. Company Financials
- 20.1.3. Key Customers and Competitors
- 20.1.4. Business/ Industry Portfolio
- 20.1.5. Product Portfolio/ Specification Details
- 20.1.6. Pricing Data
- 20.1.7. Strategic Overview
- 20.1.8. Recent Developments
- 20.2. Brookfield Renewable Partners L.P.
- 20.3. Canadian Solar Inc.
- 20.4. China Sunergy Co., Ltd.
- 20.5. Daqo New Energy Corp.
- 20.6. Enphase Energy, Inc.
- 20.7. First Solar, Inc.
- 20.8. Hanwha Q CELLS
- 20.9. JA Solar Holdings Co., Ltd.
- 20.10. Jinko Solar Holding Co., Ltd.
- 20.11. LONGi Green Energy Technology Co., Ltd.
- 20.12. Risen Energy Co., Ltd.
- 20.13. Silfab Solar Inc.
- 20.14. SolarEdge Technologies, Inc.
- 20.15. Suntech Power Holdings Co., Ltd.
- 20.16. Tesla, Inc.
- 20.17. Trina Solar Limited
- 20.18. Yingli Green Energy
- 20.19. Other Key Players
- 20.1. ABB Ltd.
Note* - This is just tentative list of players. While providing the report, we will cover more number of players based on their revenue and share for each geography
Research Design
Our research design integrates both demand-side and supply-side analysis through a balanced combination of primary and secondary research methodologies. By utilizing both bottom-up and top-down approaches alongside rigorous data triangulation methods, we deliver robust market intelligence that supports strategic decision-making.
MarketGenics' comprehensive research design framework ensures the delivery of accurate, reliable, and actionable market intelligence. Through the integration of multiple research approaches, rigorous validation processes, and expert analysis, we provide our clients with the insights needed to make informed strategic decisions and capitalize on market opportunities.

MarketGenics leverages a dedicated industry panel of experts and a comprehensive suite of paid databases to effectively collect, consolidate, and analyze market intelligence.
Our approach has consistently proven to be reliable and effective in generating accurate market insights, identifying key industry trends, and uncovering emerging business opportunities.
Through both primary and secondary research, we capture and analyze critical company-level data such as manufacturing footprints, including technical centers, R&D facilities, sales offices, and headquarters.
Our expert panel further enhances our ability to estimate market size for specific brands based on validated field-level intelligence.
Our data mining techniques incorporate both parametric and non-parametric methods, allowing for structured data collection, sorting, processing, and cleaning.
Demand projections are derived from large-scale data sets analyzed through proprietary algorithms, culminating in robust and reliable market sizing.
Research Approach
The bottom-up approach builds market estimates by starting with the smallest addressable market units and systematically aggregating them to create comprehensive market size projections.
This method begins with specific, granular data points and builds upward to create the complete market landscape.
Customer Analysis → Segmental Analysis → Geographical Analysis
The top-down approach starts with the broadest possible market data and systematically narrows it down through a series of filters and assumptions to arrive at specific market segments or opportunities.
This method begins with the big picture and works downward to increasingly specific market slices.
TAM → SAM → SOM


Research Methods
Desk / Secondary Research
While analysing the market, we extensively study secondary sources, directories, and databases to identify and collect information useful for this technical, market-oriented, and commercial report. Secondary sources that we utilize are not only the public sources, but it is a combination of Open Source, Associations, Paid Databases, MG Repository & Knowledgebase, and others.
- Company websites, annual reports, financial reports, broker reports, and investor presentations
- National government documents, statistical databases and reports
- News articles, press releases and web-casts specific to the companies operating in the market, Magazines, reports, and others
- We gather information from commercial data sources for deriving company specific data such as segmental revenue, share for geography, product revenue, and others
- Internal and external proprietary databases (industry-specific), relevant patent, and regulatory databases
- Governing Bodies, Government Organizations
- Relevant Authorities, Country-specific Associations for Industries
We also employ the model mapping approach to estimate the product level market data through the players' product portfolio
Primary Research
Primary research/ interviews is vital in analyzing the market. Most of the cases involves paid primary interviews. Primary sources include primary interviews through e-mail interactions, telephonic interviews, surveys as well as face-to-face interviews with the different stakeholders across the value chain including several industry experts.
| Type of Respondents | Number of Primaries |
|---|---|
| Tier 2/3 Suppliers | ~20 |
| Tier 1 Suppliers | ~25 |
| End-users | ~25 |
| Industry Expert/ Panel/ Consultant | ~30 |
| Total | ~100 |
MG Knowledgebase
• Repository of industry blog, newsletter and case studies
• Online platform covering detailed market reports, and company profiles
Forecasting Factors and Models
Forecasting Factors
- Historical Trends – Past market patterns, cycles, and major events that shaped how markets behave over time. Understanding past trends helps predict future behavior.
- Industry Factors – Specific characteristics of the industry like structure, regulations, and innovation cycles that affect market dynamics.
- Macroeconomic Factors – Economic conditions like GDP growth, inflation, and employment rates that affect how much money people have to spend.
- Demographic Factors – Population characteristics like age, income, and location that determine who can buy your product.
- Technology Factors – How quickly people adopt new technology and how much technology infrastructure exists.
- Regulatory Factors – Government rules, laws, and policies that can help or restrict market growth.
- Competitive Factors – Analyzing competition structure such as degree of competition and bargaining power of buyers and suppliers.
Forecasting Models / Techniques
Multiple Regression Analysis
- Identify and quantify factors that drive market changes
- Statistical modeling to establish relationships between market drivers and outcomes
Time Series Analysis – Seasonal Patterns
- Understand regular cyclical patterns in market demand
- Advanced statistical techniques to separate trend, seasonal, and irregular components
Time Series Analysis – Trend Analysis
- Identify underlying market growth patterns and momentum
- Statistical analysis of historical data to project future trends
Expert Opinion – Expert Interviews
- Gather deep industry insights and contextual understanding
- In-depth interviews with key industry stakeholders
Multi-Scenario Development
- Prepare for uncertainty by modeling different possible futures
- Creating optimistic, pessimistic, and most likely scenarios
Time Series Analysis – Moving Averages
- Sophisticated forecasting for complex time series data
- Auto-regressive integrated moving average models with seasonal components
Econometric Models
- Apply economic theory to market forecasting
- Sophisticated economic models that account for market interactions
Expert Opinion – Delphi Method
- Harness collective wisdom of industry experts
- Structured, multi-round expert consultation process
Monte Carlo Simulation
- Quantify uncertainty and probability distributions
- Thousands of simulations with varying input parameters
Research Analysis
Our research framework is built upon the fundamental principle of validating market intelligence from both demand and supply perspectives. This dual-sided approach ensures comprehensive market understanding and reduces the risk of single-source bias.
Demand-Side Analysis: We understand end-user/application behavior, preferences, and market needs along with the penetration of the product for specific application.
Supply-Side Analysis: We estimate overall market revenue, analyze the segmental share along with industry capacity, competitive landscape, and market structure.
Validation & Evaluation
Data triangulation is a validation technique that uses multiple methods, sources, or perspectives to examine the same research question, thereby increasing the credibility and reliability of research findings. In market research, triangulation serves as a quality assurance mechanism that helps identify and minimize bias, validate assumptions, and ensure accuracy in market estimates.
- Data Source Triangulation – Using multiple data sources to examine the same phenomenon
- Methodological Triangulation – Using multiple research methods to study the same research question
- Investigator Triangulation – Using multiple researchers or analysts to examine the same data
- Theoretical Triangulation – Using multiple theoretical perspectives to interpret the same data

Custom Market Research Services
We will customise the research for you, in case the report listed above does not meet your requirements.
Get 10% Free Customisation