Sustainable Chemicals Market Size, Share & Trends Analysis Report by Type (Bio-based Chemicals, Green Chemicals, Recycled-content Chemicals, CO₂-derived Chemicals, Others), Source/Feedstock, Distribution Channel, End-use Industry, and Geography (North America, Europe, Asia Pacific, Middle East, Africa, and South America) – Global Industry Data, Trends, and Forecasts, 2026–2035
Sustainable Chemicals Market Overview:
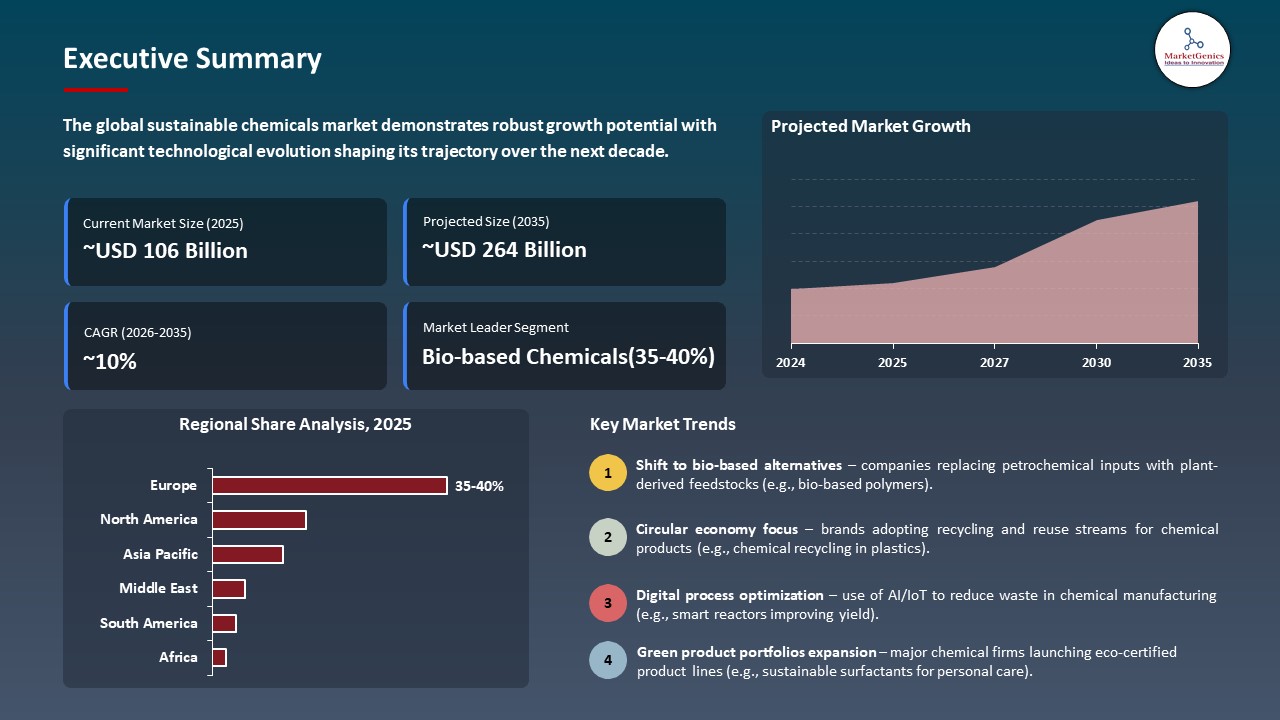
The global sustainable chemicals market is exhibiting strong growth, with an estimated value of USD 105.7 billion in 2025 and USD 264.4 billion by 2035, achieving a CAGR of 9.6%, during the forecast period.
|
|
|
Segmental Data Insights |
|
|
Demand Trends |
|
|
Competitive Landscape |
|
|
Strategic Development |
|
|
Future Outlook & Opportunities |
|
Sustainable Chemicals Market Size, Share, and Growth
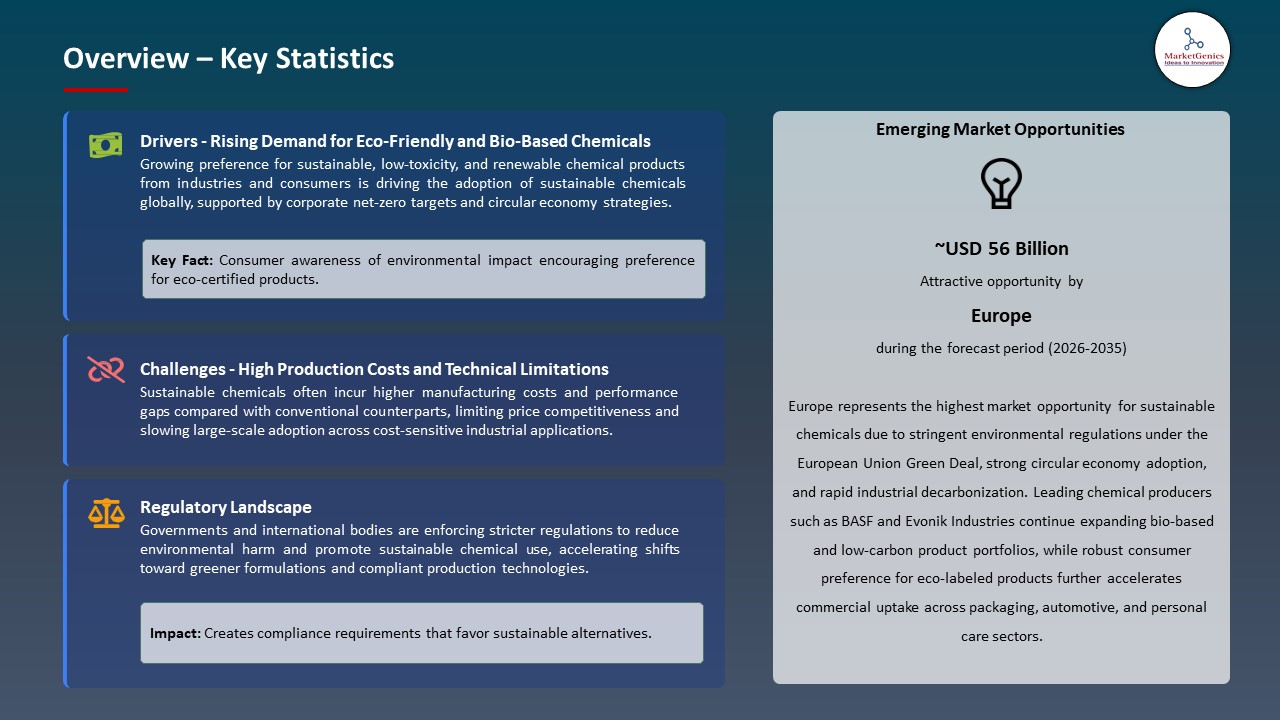
The global sustainable chemicals market is driven by stricter environmental regulations, corporate decarbonization commitments, rising consumer preference for low-toxicity products, advances in green chemistry, and growing adoption of circular economy practices across packaging, automotive, and consumer goods industries.
Adam Lindholm, Head of Sales and Business Development at Sekab added: “Our collaboration with Henkel demonstrates how fossil-free, bio-based chemicals can be integrated into existing value chains without compromising performance. This accelerates the transition towards a fossil-independent chemical industry. By working together along the value chain, we can bring scalable, sustainable raw materials to market and create tangible climate benefits.”
The growth of low-carbon and renewable raw materials into the formulations of core chemicals is driving the sustainable chemicals market, with major manufacturers developing certified sustainable alternatives to cut lifecycle emissions and attract customers with environmentally friendly views. For instance, in October 2025, LANXESS introduced a new ISCC PLUS‑certified version of its Additin RC 2515 lubricant additive, in which over 80 % of raw materials are sustainably sourced and independently traceable, reducing the product carbon footprint by about 34 % compared to its conventional counterpart.
Moreover, the increasing use of sustainable formulation technologies in a wide range of industries is driving the sustainable chemicals market by allowing manufacturers to produce chemicals products that are lower-emission, resource-efficient, and meet regulatory requirements and emerging customer sustainability demands. For instance, BASF exhibiting at industry conferences innovative sustainable polymer and coating materials, has emphasized its vision of rethinking production in the form of lower emissions and recycled materials in applications like automotive and building.
Key adjacent opportunities to the global sustainable chemicals market include the growth of bio-based polymers, eco-friendly coatings and paints, green surfactants for personal care and cleaning, renewable lubricants and additives, and recycled or circular feedstock chemicals. These areas enable diversification, innovation, and expansion into high-demand, environmentally conscious applications. The opportunities are facilitating the growth of the market through new sources of revenue, and by enabling sustainable product innovation in industries.
Sustainable Chemicals Market Dynamics and Trends
Driver: Expansion of Chemical Recycling and Circular Feedstock Integration
-
The growth of chemical recycling technologies and the use of circular feedstock approaches where wastes are reused to produce high value chemical feeds both stimulate the sustainable chemicals market, and decrease the use of virgin fossil resources, leading to closed loop production.
- The innovations of large chemical producers are realizing circular feedstocks and large-scale chemical recycling. For instance, in June 2025 Versalis opened its Hoop chemical recycling demonstration plant at its Mantua plant to use mixed plastic waste to produce recycled naphtha feed stock, which can be used to create new polymer to promote industrial circularity and reduce lifecycle emissions. The company has also initiated authorization for a large biorefinery and recycling complex in Priolo, Sicily, to upscale these capabilities.
- This driver is expanding circularity and resource efficiency and increasing the uptake of sustainable feeds models in chemical value chains.
Restraint: Complex Regulatory Compliance and Global Standards Alignment
-
The complexity of changing regulatory frameworks and the challenge of meeting the global standards of sustainability and chemical safety are major limitations to the sustainable chemicals market. Manufacturers must comply with stringent regulations, including the EU’s REACH legislation and emerging lifecycle reporting requirements, which vary across regions and necessitate robust compliance systems, meticulous data tracking, and validation protocols.
- The administrative and financial burden associated with global regulatory harmonization can slow product launches and divert R&D resources away from innovation. The small and middle chemical manufacturers, especially, might not be able to fulfill these complex requirements without a significant organizational framework. Consequently, the regulation complexity becomes one of the fundamental challenges, limiting the market growth and the pace, with which the more environmentally friendly technologies can be adopted, despite increasing demand of sustainable chemical solutions.
- This restraint is tempering market growth by increasing operational costs and compliance challenges across the value chain.
Opportunity: Bio‑Based and Waste‑Derived Sustainable Material Innovations
-
The attractive growth opportunity in the sustainable chemicals market involves the creation and commercialization of bio-based and waste-derived materials with the ability to deliver comparable performance to traditional chemicals, but with a substantial reduction in the environmental footprint. The solutions also allow manufacturers to substitute old-fashioned petrochemical-based plastics and additives with climate-positive ones to facilitate the goal of circularity and sustainability in value chains.
- In 2025, UBQ Materials expanded its product line with products like UBQ Masterbatch and UBQ ClimaPos, thermoplastic composites and additives that were made of mixed household waste. These innovations will allow companies to introduce sustainable materials into the current processes, which will reduce emissions in the lifecycle and help decarbonize in the automotive, construction, and consumer goods industries. These products support new income streams and enhance sustainability and market differentiation.
- This opportunity is increasing the use of low-impact chemical substitutes, boosting their market worth and leading to innovation that aims at sustainability.
Key Trend: Strategic Industry Collaboration for Sustainable Innovation Acceleration
-
The emergence of cross-industry alliances and collaborative innovation systems that speed up the creation and implementation of sustainable technology is a trend in the sustainable chemicals market. Major chemical producers, research centers, and startups are joining forces to view solutions together in the area of renewable feedstocks, reduction of emissions, and circularity.
- For instance, the Global Impact Coalition (GIC) is an alliance of companies including BASF, SABIC, Covestro, LG Chem, and Mitsubishi Chemical Group, which would promote initiatives such as automotive plastics circularity, plastic waste recycling, and polymer feedstock recovery. The partnerships contribute to the exchange of technical skills, risk sharing, and coordination of sustainability goals throughout supply chains, which allows more fast sustainable solutions on a large scale to be implemented.
- The trend has enhanced market innovation and scalability through the strategic collaboration and increased pace in use of sustainable chemical technologies.
Sustainable Chemicals Market Analysis and Segmental Data
Bio-based Chemicals Dominate Global Sustainable Chemicals Market
-
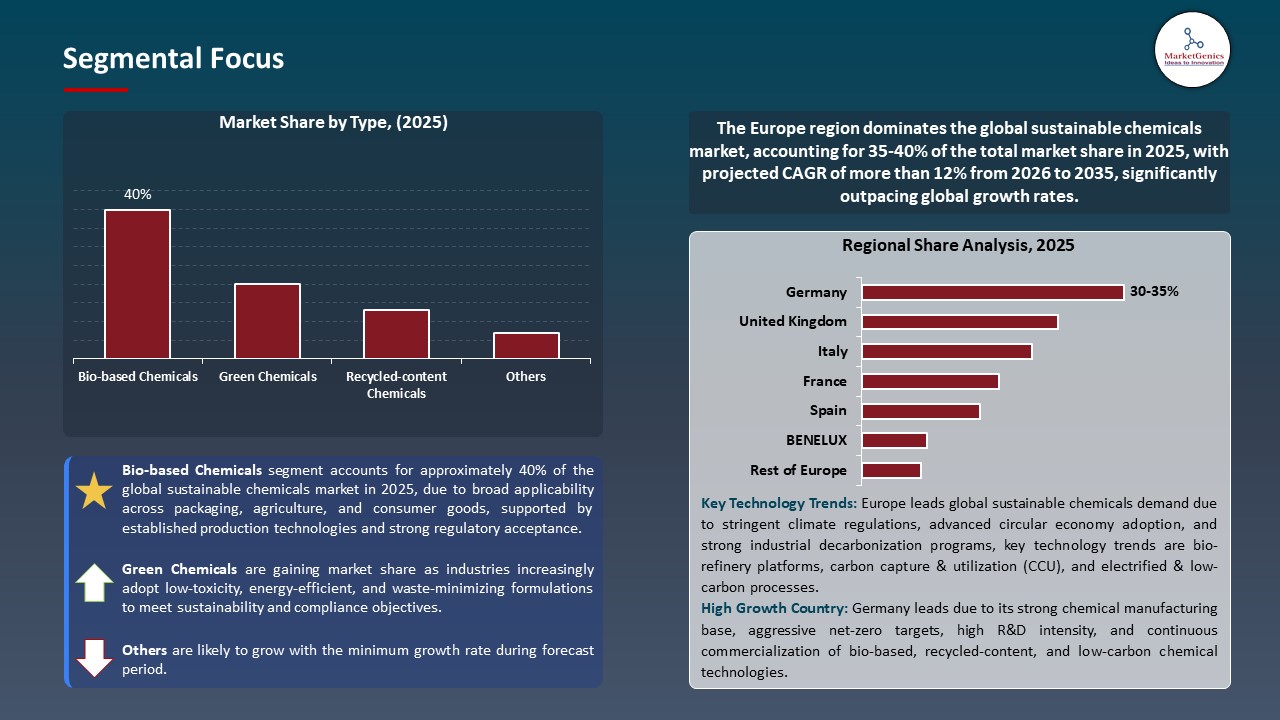
The bio-based chemicals segment dominates the global sustainable chemicals market because it is a renewable source, less harmful to the environment, and increasing in industrial needs. These biomass-derived, agricultural, and other biological feedstock-derived chemicals are alternative to the conventional petroleum-based products and can be adopted across the packaging, textile, automotive, and personal care industries in order to promote their implementation.
- For instance, in February 2026, Henkel partnered with Sekab to include bio-based raw materials including bio-based ethyl acetate into high-performance industrial adhesives, indicating how established producers are changing to renewable chemical feeds to meet their sustainability goals.
- This change to bio-based chemicals is speeding up a shift to a intended circular and low-carbon economy and making the economy more sustainable, less reliant on fossil resources, and more innovative in a variety of sectors of the industry.
Europe Leads Global Sustainable Chemicals Market Demand
-
Europe leads the sustainable chemicals market, due to the European Union with its all-inclusive regulatory frameworks based on the Green Deal and the Chemicals Strategy required reductions in harmful substances coupled with the promotion of circular economy has hastened the adoption of sustainable chemical products through manufacturing, packaging, and industrial sectors.
- Additionally, the major European chemical manufacturers are retaliating with tangible sustainability efforts. For instance, in January 2025, the division of BASF SE that deals with Performance Materials will start working on the renewable electricity only, which will become the main indicator of strategic change of the company to the direction of the operations of cleaner chemical producer and will strengthen the European demand to cleaner chemical production.
- These drivers are indicative of high structural endorsement by both the public policy and corporate sustainability agendas, which makes Europe the lead player of the sustainable chemicals market whilst defining the demand trends globally.
Sustainable Chemicals Market Ecosystem
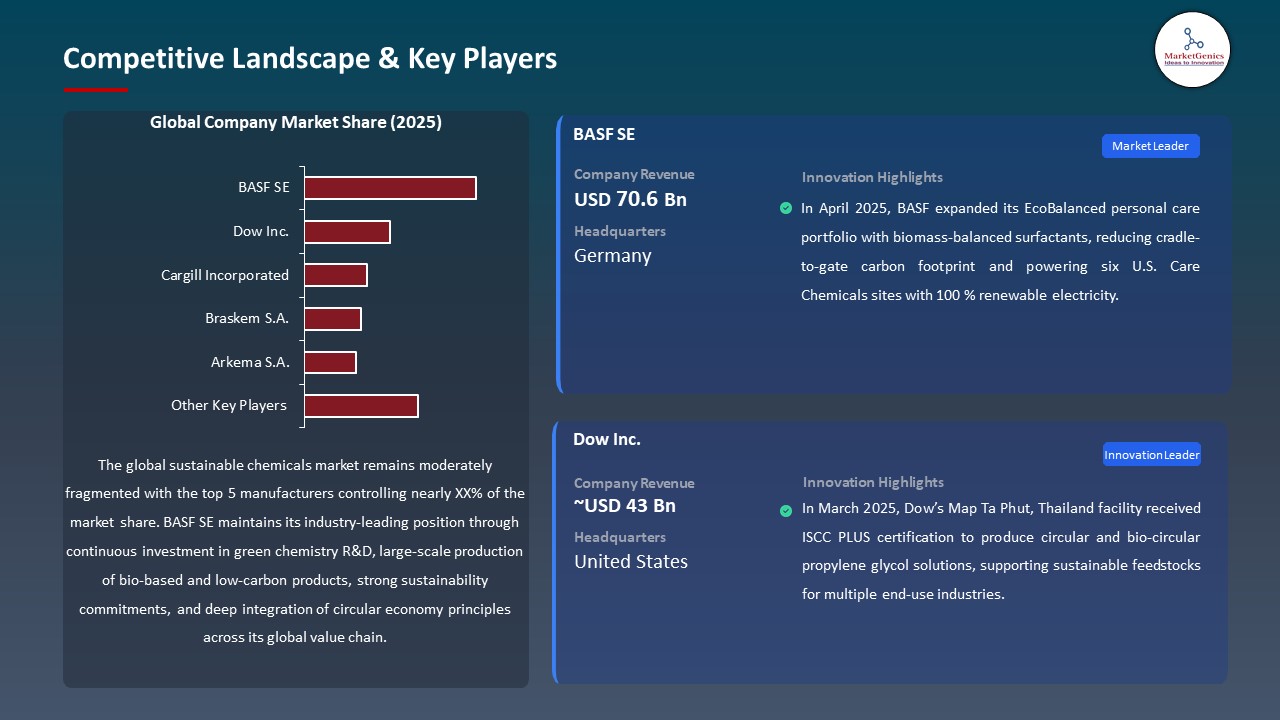
The global sustainable chemicals market is moderately fragmented, with leading players such as BASF SE, Dow Inc., Cargill Incorporated, Braskem S.A., and Arkema S.A. dominating through advanced technologies, large‑scale production capabilities, and strategic partnerships. By using innovative operations and sustainability models, these firms use new technologies to ensure that they have a competitive edge and shape the market.
The key players specialize in niche and specialized solutions that promote innovation and market development. For instance, the biodegradable polymer products of BASF and the renewable feedstock projects of Dow are specific products that focus on particular sustainability issues. Cargill’s portfolio of bio‑based chemicals and Braskem’s “green polyethylene” illustrate tailored technological solutions that differentiate their market positions.
Government agencies, research centers, and research and development organizations are extremely significant in improving the existing technologies. In March 2025 the U.S. Department of Energy proposed the support of enzymatic catalysis of biomass to high-value chemicals via an advanced catalytic reaction, to reduce energy use, and produce less CO₂ which should speed up commercialization of low-carbon chemical manufacture.
This initiative is poised to significantly accelerate the adoption of sustainable chemical production, enhancing efficiency, reducing carbon footprint, and strengthening the global transition toward low‑emission industrial practices.
 Recent Development and Strategic Overview:
- In April 2025, BASF broadened its EcoBalanced personal care portfolio through the introduction of biomass-balanced Dehyton PK 45 and KE UP surfactants, achieving lower cradle-to-gate carbon footprints and supporting operations at six U.S. Care Chemicals sites with 100% renewable electricity.
- In April 2025, Arkema S.A. commenced commercial production of bio-based specialty acrylic rheology additives in Europe, offering up to 30% renewable content and approximately 25% lower product carbon footprint, thereby strengthening sustainable solutions for coatings and adhesives applications.
Report Scope
|
Detail |
|
|
Market Size in 2025 |
USD 105.7 Bn |
|
Market Forecast Value in 2035 |
USD 264.4 Bn |
|
Growth Rate (CAGR) |
9.6% |
|
Forecast Period |
2026 – 2035 |
|
Historical Data Available for |
2021 – 2024 |
|
Market Size Units |
US$ Billion for Value |
|
Report Format |
Electronic (PDF) + Excel |
|
North America |
Europe |
Asia Pacific |
Middle East |
Africa |
South America |
|
|
|
|
|
|
|
Companies Covered |
|||||
|
|
|
|
|
|
Sustainable Chemicals Market Segmentation and Highlights
|
Segment |
Sub-segment |
|
Sustainable Chemicals Market, By Type |
|
|
Sustainable Chemicals Market, By Source/Feedstock |
|
|
Sustainable Chemicals Market, By Distribution Channel |
|
|
Sustainable Chemicals Market, By End-use Industry |
|
Frequently Asked Questions
Table of Contents
- 1. Research Methodology and Assumptions
- 1.1. Definitions
- 1.2. Research Design and Approach
- 1.3. Data Collection Methods
- 1.4. Base Estimates and Calculations
- 1.5. Forecasting Models
- 1.5.1. Key Forecast Factors & Impact Analysis
- 1.6. Secondary Research
- 1.6.1. Open Sources
- 1.6.2. Paid Databases
- 1.6.3. Associations
- 1.7. Primary Research
- 1.7.1. Primary Sources
- 1.7.2. Primary Interviews with Stakeholders across Ecosystem
- 2. Executive Summary
- 2.1. Global Sustainable Chemicals Market Outlook
- 2.1.1. Sustainable Chemicals Market Size (Value - US$ Bn), and Forecasts, 2021-2035
- 2.1.2. Compounded Annual Growth Rate Analysis
- 2.1.3. Growth Opportunity Analysis
- 2.1.4. Segmental Share Analysis
- 2.1.5. Geographical Share Analysis
- 2.2. Market Analysis and Facts
- 2.3. Supply-Demand Analysis
- 2.4. Competitive Benchmarking
- 2.5. Go-to- Market Strategy
- 2.5.1. Customer/ End-use Industry Assessment
- 2.5.2. Growth Opportunity Data, 2026-2035
- 2.5.2.1. Regional Data
- 2.5.2.2. Country Data
- 2.5.2.3. Segmental Data
- 2.5.3. Identification of Potential Market Spaces
- 2.5.4. GAP Analysis
- 2.5.5. Potential Attractive Price Points
- 2.5.6. Prevailing Market Risks & Challenges
- 2.5.7. Preferred Sales & Marketing Strategies
- 2.5.8. Key Recommendations and Analysis
- 2.5.9. A Way Forward
- 2.1. Global Sustainable Chemicals Market Outlook
- 3. Industry Data and Premium Insights
- 3.1. Global Chemicals & Materials Industry Overview, 2025
- 3.1.1. Chemicals & Materials Ecosystem Analysis
- 3.1.2. Key Trends for Chemicals & Materials Industry
- 3.1.3. Regional Distribution for Chemicals & Materials Industry
- 3.2. Supplier Customer Data
- 3.3. Technology Roadmap and Developments
- 3.4. Trade Analysis
- 3.4.1. Import & Export Analysis, 2025
- 3.4.2. Top Importing Countries
- 3.4.3. Top Exporting Countries
- 3.5. Trump Tariff Impact Analysis
- 3.5.1. Manufacturer
- 3.5.1.1. Based on the component & Raw material
- 3.5.2. Supply Chain
- 3.5.3. End Consumer
- 3.5.1. Manufacturer
- 3.6. Raw Material Analysis
- 3.1. Global Chemicals & Materials Industry Overview, 2025
- 4. Market Overview
- 4.1. Market Dynamics
- 4.1.1. Drivers
- 4.1.1.1. Stricter environmental regulations promoting low-carbon and bio-based chemicals
- 4.1.1.2. Growing corporate and consumer focus on sustainability and circular economy practices
- 4.1.1.3. Advancements in green chemistry and bio-based production technologies
- 4.1.2. Restraints
- 4.1.2.1. Higher production costs compared to conventional chemicals
- 4.1.2.2. Limited scalability and performance constraints in certain applications
- 4.1.1. Drivers
- 4.2. Key Trend Analysis
- 4.3. Regulatory Framework
- 4.3.1. Key Regulations, Norms, and Subsidies, by Key Countries
- 4.3.2. Tariffs and Standards
- 4.3.3. Impact Analysis of Regulations on the Market
- 4.4. Value Chain Analysis
- 4.4.1. Raw Material Suppliers
- 4.4.2. Manufacturers
- 4.4.3. Dealers/ Distributors
- 4.4.4. End-users/ Consumers
- 4.5. Porter’s Five Forces Analysis
- 4.6. PESTEL Analysis
- 4.7. Global Sustainable Chemicals Market Demand
- 4.7.1. Historical Market Size – in Value (US$ Bn), 2020-2024
- 4.7.2. Current and Future Market Size – in Value (US$ Bn), 2026–2035
- 4.7.2.1. Y-o-Y Growth Trends
- 4.7.2.2. Absolute $ Opportunity Assessment
- 4.1. Market Dynamics
- 5. Competition Landscape
- 5.1. Competition structure
- 5.1.1. Fragmented v/s consolidated
- 5.2. Company Share Analysis, 2025
- 5.2.1. Global Company Market Share
- 5.2.2. By Region
- 5.2.2.1. North America
- 5.2.2.2. Europe
- 5.2.2.3. Asia Pacific
- 5.2.2.4. Middle East
- 5.2.2.5. Africa
- 5.2.2.6. South America
- 5.3. Product Comparison Matrix
- 5.3.1. Specifications
- 5.3.2. Market Positioning
- 5.3.3. Pricing
- 5.1. Competition structure
- 6. Global Sustainable Chemicals Market Analysis, by Type
- 6.1. Key Segment Analysis
- 6.2. Sustainable Chemicals Market Size (Value - US$ Bn), Analysis, and Forecasts, by Type, 2021-2035
- 6.2.1. Bio-based Chemicals
- 6.2.1.1. Solvents
- 6.2.1.2. Polymers & Plastics
- 6.2.1.3. Coatings & Resins
- 6.2.1.4. Lubricants
- 6.2.1.5. Adhesives & Sealants
- 6.2.1.6. Others
- 6.2.2. Green Chemicals
- 6.2.2.1. Acids
- 6.2.2.2. Alcohols
- 6.2.2.3. Ketones & Aldehydes
- 6.2.2.4. Others
- 6.2.3. Recycled-content Chemicals
- 6.2.4. CO₂-derived Chemicals
- 6.2.5. Others
- 6.2.1. Bio-based Chemicals
- 7. Global Sustainable Chemicals Market Analysis, by Source/Feedstock
- 7.1. Key Segment Analysis
- 7.2. Sustainable Chemicals Market Size (Value - US$ Bn), Analysis, and Forecasts, by Source/Feedstock, 2021-2035
- 7.2.1. Biomass-based
- 7.2.2. Waste-based
- 7.2.3. CO₂ & Flue Gas-based
- 7.2.4. Renewable Hydrogen-based
- 7.2.5. Inorganic Sustainable Sources
- 8. Global Sustainable Chemicals Market Analysis, by Distribution Channel
- 8.1. Key Segment Analysis
- 8.2. Sustainable Chemicals Market Size (Value - US$ Bn), Analysis, and Forecasts, by Distribution Channel, 2021-2035
- 8.2.1. Direct Sales
- 8.2.2. Distributors & Wholesalers
- 8.2.3. Online B2B Platforms
- 8.2.4. Others
- 9. Global Sustainable Chemicals Market Analysis, by End-use Industry
- 9.1. Key Segment Analysis
- 9.2. Sustainable Chemicals Market Size (Value - US$ Bn), Analysis, and Forecasts, by End-use Industry, 2021-2035
- 9.2.1. Agriculture & Agrochemicals
- 9.2.2. Packaging
- 9.2.3. Automotive & Transportation
- 9.2.4. Construction & Infrastructure
- 9.2.5. Textile & Apparel
- 9.2.6. Personal Care & Cosmetics
- 9.2.7. Food & Beverage
- 9.2.8. Pharmaceuticals & Healthcare
- 9.2.9. Electronics & Semiconductors
- 9.2.10. Energy
- 9.2.11. Mining & Minerals Processing
- 9.2.12. Others
- 10. Global Sustainable Chemicals Market Analysis, by Region
- 10.1. Key Findings
- 10.2. Sustainable Chemicals Market Size (Value - US$ Bn), Analysis, and Forecasts, by Region, 2021-2035
- 10.2.1. North America
- 10.2.2. Europe
- 10.2.3. Asia Pacific
- 10.2.4. Middle East
- 10.2.5. Africa
- 10.2.6. South America
- 11. North America Sustainable Chemicals Market Analysis
- 11.1. Key Segment Analysis
- 11.2. Regional Snapshot
- 11.3. North America Sustainable Chemicals Market Size (Value - US$ Bn), Analysis, and Forecasts, 2021-2035
- 11.3.1. Type
- 11.3.2. Source/Feedstock
- 11.3.3. Distribution Channel
- 11.3.4. End-use Industry
- 11.3.5. Country
- 11.3.5.1. USA
- 11.3.5.2. Canada
- 11.3.5.3. Mexico
- 11.4. USA Sustainable Chemicals Market
- 11.4.1. Country Segmental Analysis
- 11.4.2. Type
- 11.4.3. Source/Feedstock
- 11.4.4. Distribution Channel
- 11.4.5. End-use Industry
- 11.5. Canada Sustainable Chemicals Market
- 11.5.1. Country Segmental Analysis
- 11.5.2. Type
- 11.5.3. Source/Feedstock
- 11.5.4. Distribution Channel
- 11.5.5. End-use Industry
- 11.6. Mexico Sustainable Chemicals Market
- 11.6.1. Country Segmental Analysis
- 11.6.2. Type
- 11.6.3. Source/Feedstock
- 11.6.4. Distribution Channel
- 11.6.5. End-use Industry
- 12. Europe Sustainable Chemicals Market Analysis
- 12.1. Key Segment Analysis
- 12.2. Regional Snapshot
- 12.3. Europe Sustainable Chemicals Market Size (Value - US$ Bn), Analysis, and Forecasts, 2021-2035
- 12.3.1. Type
- 12.3.2. Source/Feedstock
- 12.3.3. Distribution Channel
- 12.3.4. End-use Industry
- 12.3.5. Country
- 12.3.5.1. Germany
- 12.3.5.2. United Kingdom
- 12.3.5.3. France
- 12.3.5.4. Italy
- 12.3.5.5. Spain
- 12.3.5.6. Netherlands
- 12.3.5.7. Nordic Countries
- 12.3.5.8. Poland
- 12.3.5.9. Russia & CIS
- 12.3.5.10. Rest of Europe
- 12.4. Germany Sustainable Chemicals Market
- 12.4.1. Country Segmental Analysis
- 12.4.2. Type
- 12.4.3. Source/Feedstock
- 12.4.4. Distribution Channel
- 12.4.5. End-use Industry
- 12.5. United Kingdom Sustainable Chemicals Market
- 12.5.1. Country Segmental Analysis
- 12.5.2. Type
- 12.5.3. Source/Feedstock
- 12.5.4. Distribution Channel
- 12.5.5. End-use Industry
- 12.6. France Sustainable Chemicals Market
- 12.6.1. Country Segmental Analysis
- 12.6.2. Type
- 12.6.3. Source/Feedstock
- 12.6.4. Distribution Channel
- 12.6.5. End-use Industry
- 12.7. Italy Sustainable Chemicals Market
- 12.7.1. Country Segmental Analysis
- 12.7.2. Type
- 12.7.3. Source/Feedstock
- 12.7.4. Distribution Channel
- 12.7.5. End-use Industry
- 12.8. Spain Sustainable Chemicals Market
- 12.8.1. Country Segmental Analysis
- 12.8.2. Type
- 12.8.3. Source/Feedstock
- 12.8.4. Distribution Channel
- 12.8.5. End-use Industry
- 12.9. Netherlands Sustainable Chemicals Market
- 12.9.1. Country Segmental Analysis
- 12.9.2. Type
- 12.9.3. Source/Feedstock
- 12.9.4. Distribution Channel
- 12.9.5. End-use Industry
- 12.10. Nordic Countries Sustainable Chemicals Market
- 12.10.1. Country Segmental Analysis
- 12.10.2. Type
- 12.10.3. Source/Feedstock
- 12.10.4. Distribution Channel
- 12.10.5. End-use Industry
- 12.11. Poland Sustainable Chemicals Market
- 12.11.1. Country Segmental Analysis
- 12.11.2. Type
- 12.11.3. Source/Feedstock
- 12.11.4. Distribution Channel
- 12.11.5. End-use Industry
- 12.12. Russia & CIS Sustainable Chemicals Market
- 12.12.1. Country Segmental Analysis
- 12.12.2. Type
- 12.12.3. Source/Feedstock
- 12.12.4. Distribution Channel
- 12.12.5. End-use Industry
- 12.13. Rest of Europe Sustainable Chemicals Market
- 12.13.1. Country Segmental Analysis
- 12.13.2. Type
- 12.13.3. Source/Feedstock
- 12.13.4. Distribution Channel
- 12.13.5. End-use Industry
- 13. Asia Pacific Sustainable Chemicals Market Analysis
- 13.1. Key Segment Analysis
- 13.2. Regional Snapshot
- 13.3. Asia Pacific Sustainable Chemicals Market Size (Value - US$ Bn), Analysis, and Forecasts, 2021-2035
- 13.3.1. Type
- 13.3.2. Source/Feedstock
- 13.3.3. Distribution Channel
- 13.3.4. End-use Industry
- 13.3.5. Country
- 13.3.5.1. China
- 13.3.5.2. India
- 13.3.5.3. Japan
- 13.3.5.4. South Korea
- 13.3.5.5. Australia and New Zealand
- 13.3.5.6. Indonesia
- 13.3.5.7. Malaysia
- 13.3.5.8. Thailand
- 13.3.5.9. Vietnam
- 13.3.5.10. Rest of Asia Pacific
- 13.4. China Sustainable Chemicals Market
- 13.4.1. Country Segmental Analysis
- 13.4.2. Type
- 13.4.3. Source/Feedstock
- 13.4.4. Distribution Channel
- 13.4.5. End-use Industry
- 13.5. India Sustainable Chemicals Market
- 13.5.1. Country Segmental Analysis
- 13.5.2. Type
- 13.5.3. Source/Feedstock
- 13.5.4. Distribution Channel
- 13.5.5. End-use Industry
- 13.6. Japan Sustainable Chemicals Market
- 13.6.1. Country Segmental Analysis
- 13.6.2. Type
- 13.6.3. Source/Feedstock
- 13.6.4. Distribution Channel
- 13.6.5. End-use Industry
- 13.7. South Korea Sustainable Chemicals Market
- 13.7.1. Country Segmental Analysis
- 13.7.2. Type
- 13.7.3. Source/Feedstock
- 13.7.4. Distribution Channel
- 13.7.5. End-use Industry
- 13.8. Australia and New Zealand Sustainable Chemicals Market
- 13.8.1. Country Segmental Analysis
- 13.8.2. Type
- 13.8.3. Source/Feedstock
- 13.8.4. Distribution Channel
- 13.8.5. End-use Industry
- 13.9. Indonesia Sustainable Chemicals Market
- 13.9.1. Country Segmental Analysis
- 13.9.2. Type
- 13.9.3. Source/Feedstock
- 13.9.4. Distribution Channel
- 13.9.5. End-use Industry
- 13.10. Malaysia Sustainable Chemicals Market
- 13.10.1. Country Segmental Analysis
- 13.10.2. Type
- 13.10.3. Source/Feedstock
- 13.10.4. Distribution Channel
- 13.10.5. End-use Industry
- 13.11. Thailand Sustainable Chemicals Market
- 13.11.1. Country Segmental Analysis
- 13.11.2. Type
- 13.11.3. Source/Feedstock
- 13.11.4. Distribution Channel
- 13.11.5. End-use Industry
- 13.12. Vietnam Sustainable Chemicals Market
- 13.12.1. Country Segmental Analysis
- 13.12.2. Type
- 13.12.3. Source/Feedstock
- 13.12.4. Distribution Channel
- 13.12.5. End-use Industry
- 13.13. Rest of Asia Pacific Sustainable Chemicals Market
- 13.13.1. Country Segmental Analysis
- 13.13.2. Type
- 13.13.3. Source/Feedstock
- 13.13.4. Distribution Channel
- 13.13.5. End-use Industry
- 14. Middle East Sustainable Chemicals Market Analysis
- 14.1. Key Segment Analysis
- 14.2. Regional Snapshot
- 14.3. Middle East Sustainable Chemicals Market Size (Value - US$ Bn), Analysis, and Forecasts, 2021-2035
- 14.3.1. Type
- 14.3.2. Source/Feedstock
- 14.3.3. Distribution Channel
- 14.3.4. End-use Industry
- 14.3.5. Country
- 14.3.5.1. Turkey
- 14.3.5.2. UAE
- 14.3.5.3. Saudi Arabia
- 14.3.5.4. Israel
- 14.3.5.5. Rest of Middle East
- 14.4. Turkey Sustainable Chemicals Market
- 14.4.1. Country Segmental Analysis
- 14.4.2. Type
- 14.4.3. Source/Feedstock
- 14.4.4. Distribution Channel
- 14.4.5. End-use Industry
- 14.5. UAE Sustainable Chemicals Market
- 14.5.1. Country Segmental Analysis
- 14.5.2. Type
- 14.5.3. Source/Feedstock
- 14.5.4. Distribution Channel
- 14.5.5. End-use Industry
- 14.6. Saudi Arabia Sustainable Chemicals Market
- 14.6.1. Country Segmental Analysis
- 14.6.2. Type
- 14.6.3. Source/Feedstock
- 14.6.4. Distribution Channel
- 14.6.5. End-use Industry
- 14.7. Israel Sustainable Chemicals Market
- 14.7.1. Country Segmental Analysis
- 14.7.2. Type
- 14.7.3. Source/Feedstock
- 14.7.4. Distribution Channel
- 14.7.5. End-use Industry
- 14.8. Rest of Middle East Sustainable Chemicals Market
- 14.8.1. Country Segmental Analysis
- 14.8.2. Type
- 14.8.3. Source/Feedstock
- 14.8.4. Distribution Channel
- 14.8.5. End-use Industry
- 15. Africa Sustainable Chemicals Market Analysis
- 15.1. Key Segment Analysis
- 15.2. Regional Snapshot
- 15.3. Africa Sustainable Chemicals Market Size (Value - US$ Bn), Analysis, and Forecasts, 2021-2035
- 15.3.1. Type
- 15.3.2. Source/Feedstock
- 15.3.3. Distribution Channel
- 15.3.4. End-use Industry
- 15.3.5. Country
- 15.3.5.1. South Africa
- 15.3.5.2. Egypt
- 15.3.5.3. Nigeria
- 15.3.5.4. Algeria
- 15.3.5.5. Rest of Africa
- 15.4. South Africa Sustainable Chemicals Market
- 15.4.1. Country Segmental Analysis
- 15.4.2. Type
- 15.4.3. Source/Feedstock
- 15.4.4. Distribution Channel
- 15.4.5. End-use Industry
- 15.5. Egypt Sustainable Chemicals Market
- 15.5.1. Country Segmental Analysis
- 15.5.2. Type
- 15.5.3. Source/Feedstock
- 15.5.4. Distribution Channel
- 15.5.5. End-use Industry
- 15.6. Nigeria Sustainable Chemicals Market
- 15.6.1. Country Segmental Analysis
- 15.6.2. Type
- 15.6.3. Source/Feedstock
- 15.6.4. Distribution Channel
- 15.6.5. End-use Industry
- 15.7. Algeria Sustainable Chemicals Market
- 15.7.1. Country Segmental Analysis
- 15.7.2. Type
- 15.7.3. Source/Feedstock
- 15.7.4. Distribution Channel
- 15.7.5. End-use Industry
- 15.8. Rest of Africa Sustainable Chemicals Market
- 15.8.1. Country Segmental Analysis
- 15.8.2. Type
- 15.8.3. Source/Feedstock
- 15.8.4. Distribution Channel
- 15.8.5. End-use Industry
- 16. South America Sustainable Chemicals Market Analysis
- 16.1. Key Segment Analysis
- 16.2. Regional Snapshot
- 16.3. South America Sustainable Chemicals Market Size (Value - US$ Bn), Analysis, and Forecasts, 2021-2035
- 16.3.1. Type
- 16.3.2. Source/Feedstock
- 16.3.3. Distribution Channel
- 16.3.4. End-use Industry
- 16.3.5. Country
- 16.3.5.1. Brazil
- 16.3.5.2. Argentina
- 16.3.5.3. Rest of South America
- 16.4. Brazil Sustainable Chemicals Market
- 16.4.1. Country Segmental Analysis
- 16.4.2. Type
- 16.4.3. Source/Feedstock
- 16.4.4. Distribution Channel
- 16.4.5. End-use Industry
- 16.5. Argentina Sustainable Chemicals Market
- 16.5.1. Country Segmental Analysis
- 16.5.2. Type
- 16.5.3. Source/Feedstock
- 16.5.4. Distribution Channel
- 16.5.5. End-use Industry
- 16.6. Rest of South America Sustainable Chemicals Market
- 16.6.1. Country Segmental Analysis
- 16.6.2. Type
- 16.6.3. Source/Feedstock
- 16.6.4. Distribution Channel
- 16.6.5. End-use Industry
- 17. Key Players/ Company Profile
- 17.1. BASF SE
- 17.1.1. Company Details/ Overview
- 17.1.2. Company Financials
- 17.1.3. Key Customers and Competitors
- 17.1.4. Business/ Industry Portfolio
- 17.1.5. Product Portfolio/ Specification Details
- 17.1.6. Pricing Data
- 17.1.7. Strategic Overview
- 17.1.8. Recent Developments
- 17.2. Archer-Daniels-Midland Company
- 17.3. Arkema S.A.
- 17.4. Avantium N.V.
- 17.5. Bio-on S.p.A.
- 17.6. Braskem S.A.
- 17.7. Cargill Incorporated
- 17.8. Clariant AG
- 17.9. Corbion N.V.
- 17.10. Covestro AG
- 17.11. Croda International Plc
- 17.12. Dow Inc.
- 17.13. DSM-Firmenich AG
- 17.14. Eastman Chemical Company
- 17.15. Evonik Industries AG
- 17.16. Genomatica Inc.
- 17.17. NatureWorks LLC
- 17.18. Novamont S.p.A.
- 17.19. Solvay SA
- 17.20. Toray Industries Inc.
- 17.21. Other Key Players
- 17.1. BASF SE
Note* - This is just tentative list of players. While providing the report, we will cover more number of players based on their revenue and share for each geography
Research Design
Our research design integrates both demand-side and supply-side analysis through a balanced combination of primary and secondary research methodologies. By utilizing both bottom-up and top-down approaches alongside rigorous data triangulation methods, we deliver robust market intelligence that supports strategic decision-making.
MarketGenics' comprehensive research design framework ensures the delivery of accurate, reliable, and actionable market intelligence. Through the integration of multiple research approaches, rigorous validation processes, and expert analysis, we provide our clients with the insights needed to make informed strategic decisions and capitalize on market opportunities.

MarketGenics leverages a dedicated industry panel of experts and a comprehensive suite of paid databases to effectively collect, consolidate, and analyze market intelligence.
Our approach has consistently proven to be reliable and effective in generating accurate market insights, identifying key industry trends, and uncovering emerging business opportunities.
Through both primary and secondary research, we capture and analyze critical company-level data such as manufacturing footprints, including technical centers, R&D facilities, sales offices, and headquarters.
Our expert panel further enhances our ability to estimate market size for specific brands based on validated field-level intelligence.
Our data mining techniques incorporate both parametric and non-parametric methods, allowing for structured data collection, sorting, processing, and cleaning.
Demand projections are derived from large-scale data sets analyzed through proprietary algorithms, culminating in robust and reliable market sizing.
Research Approach
The bottom-up approach builds market estimates by starting with the smallest addressable market units and systematically aggregating them to create comprehensive market size projections.
This method begins with specific, granular data points and builds upward to create the complete market landscape.
Customer Analysis → Segmental Analysis → Geographical Analysis
The top-down approach starts with the broadest possible market data and systematically narrows it down through a series of filters and assumptions to arrive at specific market segments or opportunities.
This method begins with the big picture and works downward to increasingly specific market slices.
TAM → SAM → SOM


Research Methods
Desk / Secondary Research
While analysing the market, we extensively study secondary sources, directories, and databases to identify and collect information useful for this technical, market-oriented, and commercial report. Secondary sources that we utilize are not only the public sources, but it is a combination of Open Source, Associations, Paid Databases, MG Repository & Knowledgebase, and others.
- Company websites, annual reports, financial reports, broker reports, and investor presentations
- National government documents, statistical databases and reports
- News articles, press releases and web-casts specific to the companies operating in the market, Magazines, reports, and others
- We gather information from commercial data sources for deriving company specific data such as segmental revenue, share for geography, product revenue, and others
- Internal and external proprietary databases (industry-specific), relevant patent, and regulatory databases
- Governing Bodies, Government Organizations
- Relevant Authorities, Country-specific Associations for Industries
We also employ the model mapping approach to estimate the product level market data through the players' product portfolio
Primary Research
Primary research/ interviews is vital in analyzing the market. Most of the cases involves paid primary interviews. Primary sources include primary interviews through e-mail interactions, telephonic interviews, surveys as well as face-to-face interviews with the different stakeholders across the value chain including several industry experts.
| Type of Respondents | Number of Primaries |
|---|---|
| Tier 2/3 Suppliers | ~20 |
| Tier 1 Suppliers | ~25 |
| End-users | ~25 |
| Industry Expert/ Panel/ Consultant | ~30 |
| Total | ~100 |
MG Knowledgebase
• Repository of industry blog, newsletter and case studies
• Online platform covering detailed market reports, and company profiles
Forecasting Factors and Models
Forecasting Factors
- Historical Trends – Past market patterns, cycles, and major events that shaped how markets behave over time. Understanding past trends helps predict future behavior.
- Industry Factors – Specific characteristics of the industry like structure, regulations, and innovation cycles that affect market dynamics.
- Macroeconomic Factors – Economic conditions like GDP growth, inflation, and employment rates that affect how much money people have to spend.
- Demographic Factors – Population characteristics like age, income, and location that determine who can buy your product.
- Technology Factors – How quickly people adopt new technology and how much technology infrastructure exists.
- Regulatory Factors – Government rules, laws, and policies that can help or restrict market growth.
- Competitive Factors – Analyzing competition structure such as degree of competition and bargaining power of buyers and suppliers.
Forecasting Models / Techniques
Multiple Regression Analysis
- Identify and quantify factors that drive market changes
- Statistical modeling to establish relationships between market drivers and outcomes
Time Series Analysis – Seasonal Patterns
- Understand regular cyclical patterns in market demand
- Advanced statistical techniques to separate trend, seasonal, and irregular components
Time Series Analysis – Trend Analysis
- Identify underlying market growth patterns and momentum
- Statistical analysis of historical data to project future trends
Expert Opinion – Expert Interviews
- Gather deep industry insights and contextual understanding
- In-depth interviews with key industry stakeholders
Multi-Scenario Development
- Prepare for uncertainty by modeling different possible futures
- Creating optimistic, pessimistic, and most likely scenarios
Time Series Analysis – Moving Averages
- Sophisticated forecasting for complex time series data
- Auto-regressive integrated moving average models with seasonal components
Econometric Models
- Apply economic theory to market forecasting
- Sophisticated economic models that account for market interactions
Expert Opinion – Delphi Method
- Harness collective wisdom of industry experts
- Structured, multi-round expert consultation process
Monte Carlo Simulation
- Quantify uncertainty and probability distributions
- Thousands of simulations with varying input parameters
Research Analysis
Our research framework is built upon the fundamental principle of validating market intelligence from both demand and supply perspectives. This dual-sided approach ensures comprehensive market understanding and reduces the risk of single-source bias.
Demand-Side Analysis: We understand end-user/application behavior, preferences, and market needs along with the penetration of the product for specific application.
Supply-Side Analysis: We estimate overall market revenue, analyze the segmental share along with industry capacity, competitive landscape, and market structure.
Validation & Evaluation
Data triangulation is a validation technique that uses multiple methods, sources, or perspectives to examine the same research question, thereby increasing the credibility and reliability of research findings. In market research, triangulation serves as a quality assurance mechanism that helps identify and minimize bias, validate assumptions, and ensure accuracy in market estimates.
- Data Source Triangulation – Using multiple data sources to examine the same phenomenon
- Methodological Triangulation – Using multiple research methods to study the same research question
- Investigator Triangulation – Using multiple researchers or analysts to examine the same data
- Theoretical Triangulation – Using multiple theoretical perspectives to interpret the same data

Custom Market Research Services
We will customise the research for you, in case the report listed above does not meet your requirements.
Get 10% Free Customisation