Tantalum Market Size, Share & Trends Analysis Report by Product Type (Tantalum Metal, Tantalum Carbide, Tantalum Oxide, Tantalum Compounds), Form, Grade/Purity Level, Application, End-Use Industry, Distribution Channel, and Geography (North America, Europe, Asia Pacific, Middle East, Africa, and South America) – Global Industry Data, Trends, and Forecasts, 2026–2035
|
|
|
Segmental Data Insights |
|
|
Demand Trends |
|
|
Competitive Landscape |
|
|
Strategic Development |
|
|
Future Outlook & Opportunities |
|
Tantalum Market Size, Share, and Growth
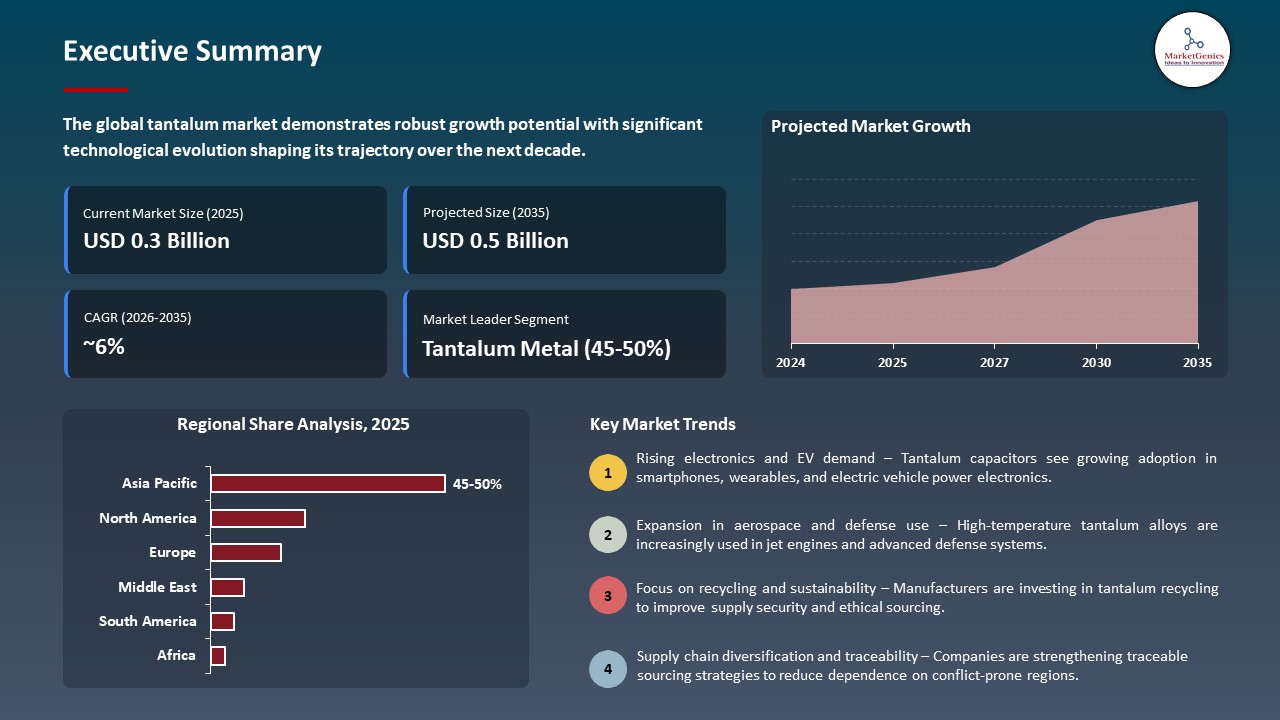
The global tantalum market is witnessing strong growth, valued at USD 0.3 billion in 2025 and projected to reach USD 0.5 billion by 2035, expanding at a CAGR of 5.7% during the forecast period. North America is the fastest-growing region in the tantalum market due to increasing investments in semiconductor manufacturing, rising demand from aerospace, defense, and medical device industries, expansion of electric vehicle production, and strong focus on supply-chain security, recycling, and domestic sourcing of critical minerals.
Dr Shane Keaveney, R&D Manager at Croom Medical, shared, “Tantalum has long been valued for its outstanding biointegration, corrosion resistance, and mechanical properties. With TALOS, we unlock these intrinsic qualities, allowing precise control over implant ductility and strength to closely match native bone”.
The tantalum market is significantly driven by the material's extensive use in the aerospace and defense sectors, where its high melting point, corrosion resistance, and hardness are essential properties. Metal finds extensive application in turbine blades, rocket nozzles, heat shields and high-reliability defense electronics that use extreme environments, which serves the requirements of the aircraft manufacturing, space exploration, and modernization programs of the defense programs.
The tantalum market has excellent growth potential in terms of development of processing and extraction technology. Electrochemical processing developments and better refining processes can increase metal recovery rates, waste reduction and minimize environmental impact. These advancements render hitherto non- economical or low grade tantalum resources economically viable, which provides support to the growth of supply, cost-efficiency and more sustainable manufacturing throughout the planetary tantalum value chain.
Key adjacent opportunities to the tantalum market include semiconductor components, advanced capacitors, medical implants, aerospace superalloys, and electric vehicle power electronics. These adjacent segments rely on tantalum’s high reliability, heat resistance, and corrosion stability. Expansion into adjacent applications enhances demand stability, supports premium pricing, and strengthens long-term growth potential for the tantalum market.
Tantalum Market Dynamics and Trends
Driver: Strong Demand in Electronics & Consumer Devices
-
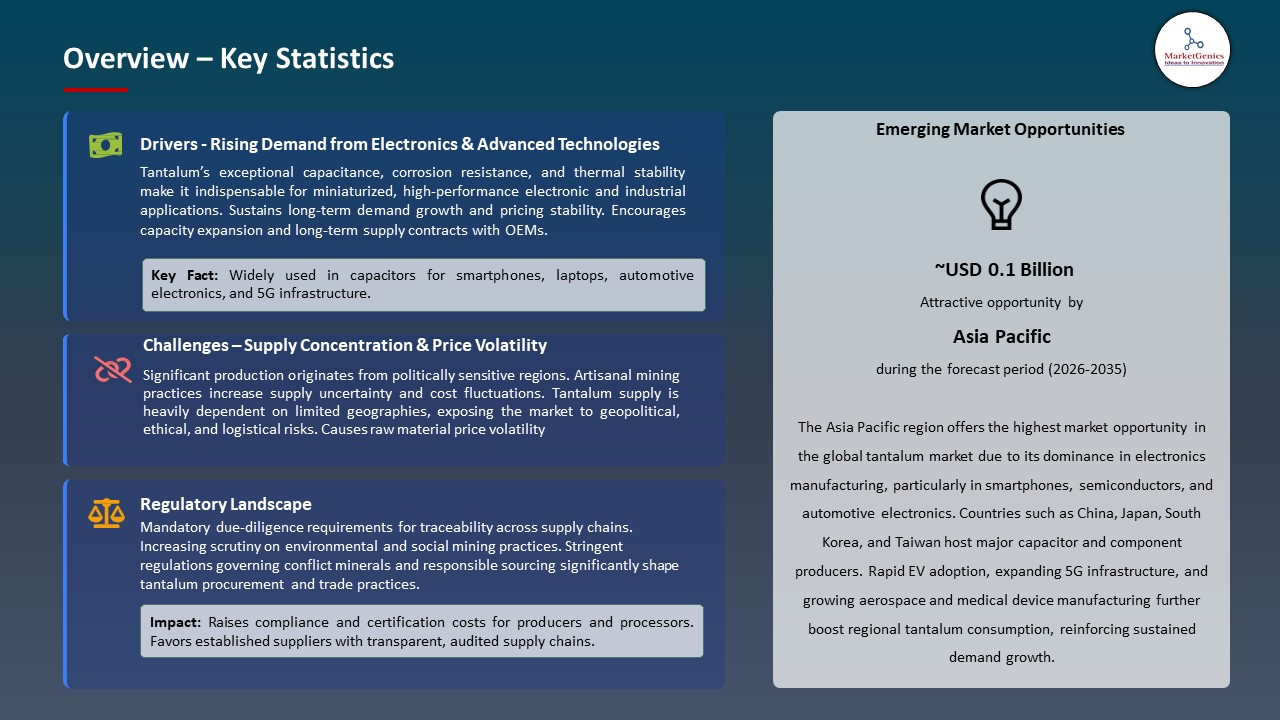
The tantalum market is highly motivated by the increasing demand in the electronics and consumer devices sector, in which tantalum-based capacitors are very important. These capacitors have a high capacitance-to-volume ratio, thermal stability, and long service life, which make them important in smartphones, laptops, tablets, wearables, and IoT devices.
- Ongoing miniaturization of devices and their growing functionality, spreading connected technologies demand compact and high-reliability parts, and tantalum is valuable in this regard. Moreover, further expansions in the 5G-capable devices and more sophisticated computing give further support to continued tantalum usage in the worldwide electronics value chain.
- Panasonic Industry Co., Ltd. started commercial manufacture of two models of Conductive Polymer Tantalum Solid Capacitors (POSCAP), having the lowest 3mm profile in the industry, to deliver high-output power over USB Type-C.
- These capacitors allow miniaturization and increased capabilities in laptops and tablets as well as other communication devices, which reveal growing need of high-performance tantalum devices in small electronics and motivates the development of the tantalum market worldwide.
Restraint: Price Volatility & Concentrated Supply
-
Price volatility and concentration in supply of tantalum in the market are major limitations to the tantalum market. Much of the world tantalum production is clustered in a small number of countries and more so in Central Africa, the Democratic Republic of Congo (DRC) and Rwanda.
- Political instability, civil unrests and uncertainties on regulations in these areas can interfere with mining activities, which results in sudden scarcity, unpredictable supply ones. These interruptions have a direct effect on the supply of tantalum to the downstream industries, such as electronics, aerospace, and automotive markets.
- Moreover, the supply is further constrained by export controls, trade restrictions, and transportation issues, which make the prices of raw materials to rise drastically. To manufacturers dependent on a constant flow of tantalum, such price fluctuations raise the cost of production, decreases profit margins and makes long-term planning and procurement difficult.
- The geopolitical and economic shocks in the market can affect geopolitical and economic elasticity, which, by creating a high dependency on limited sources, makes the market highly susceptible to such events, limiting the overall growth and investment of the market.
Opportunity: Healthcare & Medical Devices
-
The health and medical equipment is becoming an opportunity in the tantalum market owing to the fact that the metal has very good biocompatibility, corrosion resistance and stability. Surgical implants, prosthetics, orthopedic devices, and medical equipment applications have a broad application in the medical sector, where Tantalum is generally inert and thus safe and dependable over an extended period in the human body.
- The growth in demand of sophisticated medical implants, minimally invasive surgical instruments and sophisticated level of prosthetic products is what is pushing the use of tantalum in the medical industry. Moreover, the increasing international interest in enhancing patient outcomes, an aging population and rising healthcare expenditure is increasingly broadening the tantalum role in non-industrial uses into high-need medical and surgical technology.
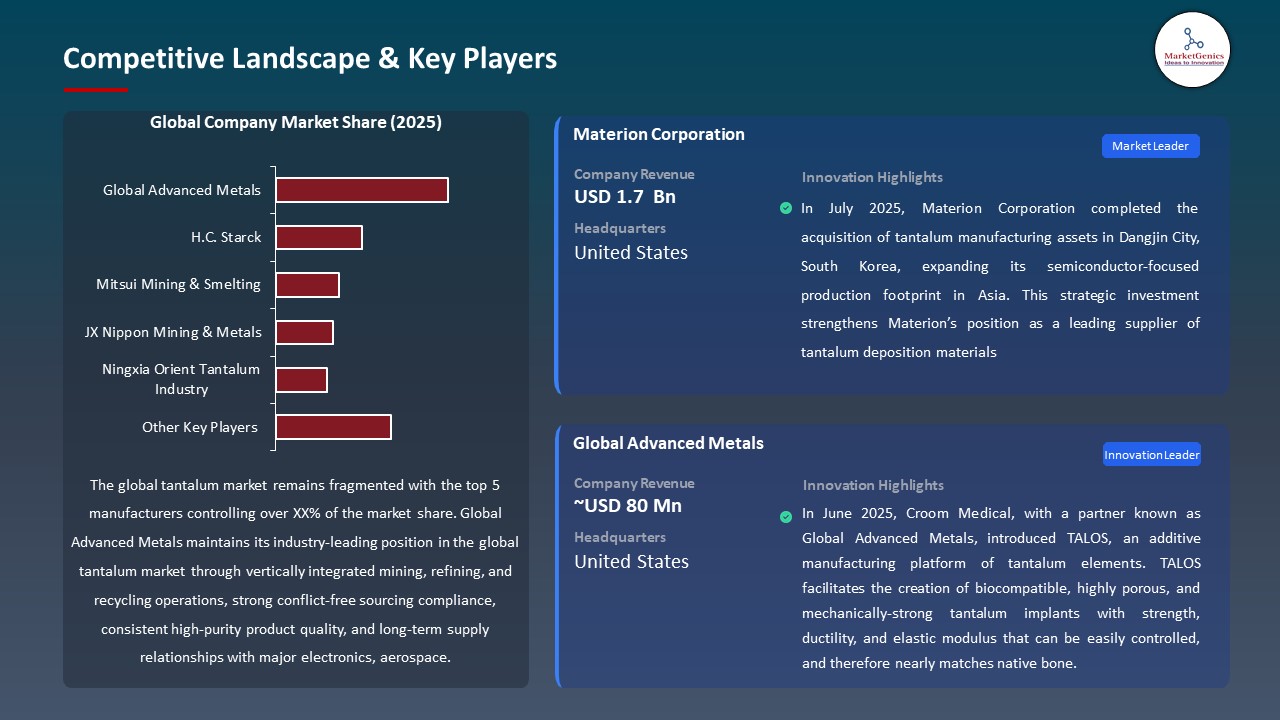
- In June 2025, Croom Medical, with a partner known as Global Advanced Metals, introduced TALOS, an additive manufacturing platform of tantalum elements. TALOS facilitates the creation of biocompatible, highly porous, and mechanically-strong tantalum implants with strength, ductility, and elastic modulus that can be easily controlled, and therefore nearly matches native bone.
- This development makes tantalum a key resource to innovation and development in the healthcare and medical device industry of the world market.
Key Trend: Increased Focus on Sustainability
-
The tantalum market is experiencing an increasing focus on sustainability, both influenced by environmental issues and regulatory pressures and the implementation of the principles of the circular economy. Recycling of tantalum in electronic waste, used devices, and industrial scrap is being considered a significant approach towards lessening the reliance on primary mining and guarantee a sustainable, ethical provision. Business entities are also looking to invest in closed loop recycling mechanisms, advancement of technologies, and recovery systems that will achieve maximum material efficiency with minimal environmental effects.
- In 2025, TANIOBIS Group has taken the sustainability of tantalum market to the next level by introducing a DIN ISO 14021-certified full circle recycling of tantalum-containing concentrates, oxides, chemicals, and metals. This method allows recovery of high-purity tantalum in many cycles, making this less harmful to the environment and allowing to uphold a circular economy.
- This trend aids in addressing ethical and ecological concerns connected to tantalum sourcing, while also promoting cost-effective production, aligning with corporate sustainability goals, and supporting the long-term viability of the global tantalum supply chain.
 Tantalum-Market Analysis and Segmental Data
Tantalum Metal Dominate Global Tantalum Market
-
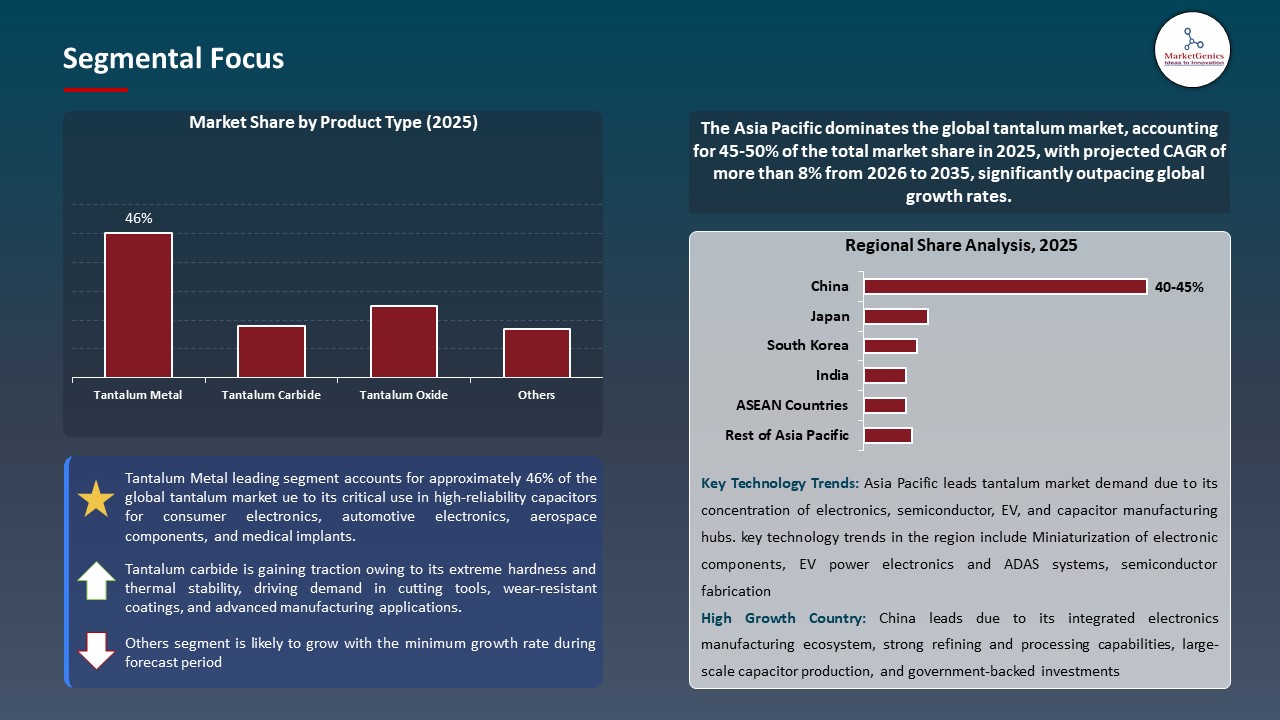
Tantalum metal dominates the global tantalum market as the leading segment due to its exceptional physical and chemical properties, including high melting point, superior corrosion resistance, and excellent electrical conductivity. These characteristics make it indispensable in manufacturing tantalum capacitors widely used in smartphones, laptops, automotive electronics, and 5G infrastructure.
- The metal is also essential in the aerospace and defense field, where it is needed to last at extreme temperatures, and in chemical processing equipment in corrosive environments. It also provides excellent biocompatibility which makes it useful in medical implants and surgery equipment, which further strengthens its long-lasting demand and leadership in the segment across the world.
- In 2025, ETM acquired the Penouta tin-tantalum-niobium mine in Spain which is the only developed asset of its kind in Europe, at a cost of 5.2 million Euros and a funding sum of A 10 million through a strategic placement to finance the acquisition. The relocation gives ETM a strong base in the tantalum metal market, which has access to a new critique minerals project, which is EU compliant, and has increased supply security.
- The tantalum metal has emerged as the world leader with its unrivaled performance characteristics and extensive, long term demand in electronics, aerospace, industrial and medical applications.
Asia Pacific Leads Global Tantalum Market Demand
-
Asia Pacific is the dominating region in the global tantalum market, which is mainly propelled by great electronics manufacturing environment. China, Japan, South Korea, and Taiwan are some of the most significant smartphone and laptop centres, tablet and 5G infrastructure, and data centres that are dependent on high-performance tantalum capacitors. The supremacy of the region is also supported by the rapid industrialization, high level of semiconductor manufacturing and the constant innovation in consumer and automotive electronics.
- The tantalum demand is also driven by increasing electric cars (EVs) and renewable energy technology implementation in Asia Pacific. Heat, corrosion, and electrical reliability of tantalum are increasingly found in EV power electronics, battery management systems and advanced automotive components. Also, Asia Pacific enjoys a cost-effective manufacturing, growing recycling as well as government policies that encourage investments in high-quality materials and technology.
- All these combines and make Asia Pacific the most powerful and fastest emerging tantalum market that takes the largest portion of the global demand.
Tantalum-Market Ecosystem
The global tantalum market is consolidated, with leading players including Global Advanced Metals, H.C. Starck, Mitsui Mining & Smelting, JX Nippon Mining & Metals, and Ningxia Orient Tantalum Industry. These companies maintain strong competitive positions through vertically integrated supply chains, access to high-quality tantalum ore and refined products, advanced processing technologies, and global distribution networks. Their strengths are further reinforced by long-standing relationships with electronics, aerospace, automotive, and medical device manufacturers, adherence to stringent environmental and conflict-free sourcing standards, and compliance with international regulatory frameworks.
The tantalum market value chain encompasses the extraction and refining of ore used to obtain tantalum, the extraction and refining into tantalum metal and powders, the creation into capacitors, electronic component or specialized industrial products, quality testing and certification, and its distribution to final product industries. Such after sale services as technical support, recycling solutions, and continuity management of supplies are very essential in ensuring long term relations with customers and in differentiating in the market.
The entry barriers are high because mining and processing regulations are complicated, special metallurgical skills are required, much investment is made in the modern refining plants, and connections with the down-grade electronics and industrial manufacturers are established. Continued innovation, such as high purity tantalum manufacturing, more efficient powder metallurgy processes, recycling, and sustainable sourcing are enhancing efficiency, quality of products, and security of supply, which are contributing to enduring adoption and product differentiation in the world tantalum market.
 Recent Development and Strategic Overview:
-
In July 2025, Materion Corporation completed the acquisition of tantalum manufacturing assets in Dangjin City, South Korea, expanding its semiconductor-focused production footprint in Asia. This strategic investment strengthens Materion’s position as a leading supplier of tantalum deposition materials and enhances its ability to serve Tier I global semiconductor customers, highlighting rising tantalum demand from advanced electronics and chip manufacturing applications.
- In January 2025, Volta Metals Ltd. confirmed high-grade tantalum mineralization at its newly acquired ZigZag Project in Ontario, with channel samples returning up to 457 ppm Ta alongside lithium, cesium, and gallium, highlighting strong potential for Ta-rich lithium pegmatites and reinforcing North America’s strategic tantalum exploration outlook.
Report Scope
|
Detail |
|
|
Market Size in 2025 |
USD 0.3 Bn |
|
Market Forecast Value in 2035 |
USD 0.5 Bn |
|
Growth Rate (CAGR) |
5.7% |
|
Forecast Period |
2026 – 2035 |
|
Historical Data Available for |
2021 – 2024 |
|
Market Size Units |
US$ Billion for Value Kilo Tons for Volume |
|
Report Format |
Electronic (PDF) + Excel |
|
North America |
Europe |
Asia Pacific |
Middle East |
Africa |
South America |
|
|
|
|
|
|
|
Companies Covered |
|||||
|
|
|
|
|
|
Tantalum-Market Segmentation and Highlights
|
Segment |
Sub-segment |
|
Tantalum Market, By Product Type |
|
|
Tantalum Market, By Form |
|
|
Tantalum Market, By Grade/Purity Level |
|
|
Tantalum Market, By Application |
|
|
Tantalum Market, By End-Use Industry |
|
|
Tantalum Market, By Distribution Channel |
|
Frequently Asked Questions
Table of Contents
- 1. Research Methodology and Assumptions
- 1.1. Definitions
- 1.2. Research Design and Approach
- 1.3. Data Collection Methods
- 1.4. Base Estimates and Calculations
- 1.5. Forecasting Models
- 1.5.1. Key Forecast Factors & Impact Analysis
- 1.6. Secondary Research
- 1.6.1. Open Sources
- 1.6.2. Paid Databases
- 1.6.3. Associations
- 1.7. Primary Research
- 1.7.1. Primary Sources
- 1.7.2. Primary Interviews with Stakeholders across Ecosystem
- 2. Executive Summary
- 2.1. Global Tantalum Market Outlook
- 2.1.1. Tantalum Market Size Volume (Kilo Tons) and Value (US$ Bn), and Forecasts, 2021-2035
- 2.1.2. Compounded Annual Growth Rate Analysis
- 2.1.3. Growth Opportunity Analysis
- 2.1.4. Segmental Share Analysis
- 2.1.5. Geographical Share Analysis
- 2.2. Market Analysis and Facts
- 2.3. Supply-Demand Analysis
- 2.4. Competitive Benchmarking
- 2.5. Go-to- Market Strategy
- 2.5.1. Customer/ End-use Industry Assessment
- 2.5.2. Growth Opportunity Data, 2026-2035
- 2.5.2.1. Regional Data
- 2.5.2.2. Country Data
- 2.5.2.3. Segmental Data
- 2.5.3. Identification of Potential Market Spaces
- 2.5.4. GAP Analysis
- 2.5.5. Potential Attractive Price Points
- 2.5.6. Prevailing Market Risks & Challenges
- 2.5.7. Preferred Sales & Marketing Strategies
- 2.5.8. Key Recommendations and Analysis
- 2.5.9. A Way Forward
- 2.1. Global Tantalum Market Outlook
- 3. Industry Data and Premium Insights
- 3.1. Global Chemicals & Materials Industry Overview, 2025
- 3.1.1. Chemicals & Materials Industry Ecosystem Analysis
- 3.1.2. Key Trends for Chemicals & Materials Industry
- 3.1.3. Regional Distribution for Chemicals & Materials Industry
- 3.2. Supplier Customer Data
- 3.3. Technology Roadmap and Developments
- 3.4. Trade Analysis
- 3.4.1. Import & Export Analysis, 2025
- 3.4.2. Top Importing Countries
- 3.4.3. Top Exporting Countries
- 3.5. Trump Tariff Impact Analysis
- 3.5.1. Manufacturer
- 3.5.1.1. Based on the component & Raw material
- 3.5.2. Supply Chain
- 3.5.3. End Consumer
- 3.5.1. Manufacturer
- 3.6. Raw Material Analysis
- 3.1. Global Chemicals & Materials Industry Overview, 2025
- 4. Market Overview
- 4.1. Market Dynamics
- 4.1.1. Drivers
- 4.1.1.1. Growing demand for tantalum capacitors in consumer electronics and advanced semiconductor applications
- 4.1.1.2. Increasing use of tantalum in medical devices and implants due to its biocompatibility and corrosion resistance
- 4.1.1.3. Rising adoption of high-temperature and corrosion-resistant alloys in aerospace and chemical processing industrie
- 4.1.2. Restraints
- 4.1.2.1. Limited and geographically concentrated tantalum ore supply leading to supply-chain risks
- 4.1.2.2. Price volatility and regulatory scrutiny related to conflict-mineral sourcing and compliance requirements
- 4.1.1. Drivers
- 4.2. Key Trend Analysis
- 4.3. Regulatory Framework
- 4.3.1. Key Regulations, Norms, and Subsidies, by Key Countries
- 4.3.2. Tariffs and Standards
- 4.3.3. Impact Analysis of Regulations on the Market
- 4.4. Value Chain Analysis
- 4.4.1. Raw Material Suppliers
- 4.4.2. Tantalum Processors
- 4.4.3. Component Manufacturers
- 4.4.4. Dealers/ Distributors
- 4.4.5. End-use industries
- 4.5. Cost Structure Analysis
- 4.6. Pricing Analysis
- 4.7. Porter’s Five Forces Analysis
- 4.8. PESTEL Analysis
- 4.9. Global Tantalum Market Demand
- 4.9.1. Historical Market Size – Volume (Kilo Tons) and Value (US$ Bn), 2020-2024
- 4.9.2. Current and Future Market Size – Volume (Kilo Tons) and Value (US$ Bn), 2026–2035
- 4.9.2.1. Y-o-Y Growth Trends
- 4.9.2.2. Absolute $ Opportunity Assessment
- 4.1. Market Dynamics
- 5. Competition Landscape
- 5.1. Competition structure
- 5.1.1. Fragmented v/s consolidated
- 5.2. Company Share Analysis, 2025
- 5.2.1. Global Company Market Share
- 5.2.2. By Region
- 5.2.2.1. North America
- 5.2.2.2. Europe
- 5.2.2.3. Asia Pacific
- 5.2.2.4. Middle East
- 5.2.2.5. Africa
- 5.2.2.6. South America
- 5.3. Product Comparison Matrix
- 5.3.1. Specifications
- 5.3.2. Market Positioning
- 5.3.3. Pricing
- 5.1. Competition structure
- 6. Global Tantalum Market Analysis, by Product Type
- 6.1. Key Segment Analysis
- 6.2. Tantalum Market Size Volume (Kilo Tons) and Value (US$ Bn), Analysis, and Forecasts, by Product Type, 2021-2035
- 6.2.1. Tantalum Metal
- 6.2.1.1. Pure Tantalum
- 6.2.1.2. Tantalum Alloys
- 6.2.1.2.1. Ta-W Alloys
- 6.2.1.2.2. Ta-Nb Alloys
- 6.2.1.2.3. Other Alloy Compositions
- 6.2.2. Tantalum Carbide
- 6.2.3. Tantalum Oxide
- 6.2.3.1. Tantalum Pentoxide (Ta2O5)
- 6.2.3.2. Other Oxide Forms
- 6.2.4. Tantalum Compounds
- 6.2.4.1. Tantalum Chloride
- 6.2.4.2. Tantalum Fluoride
- 6.2.4.3. Other Chemical Compounds
- 6.2.1. Tantalum Metal
- 7. Global Tantalum Market Analysis, by Form
- 7.1. Key Segment Analysis
- 7.2. Tantalum Market Size Volume (Kilo Tons) and Value (US$ Bn), Analysis, and Forecasts, by Form, 2021-2035
- 7.2.1. Powder
- 7.2.1.1. Capacitor Grade Powder
- 7.2.1.2. Metallurgical Grade Powder
- 7.2.1.3. High Purity Powder
- 7.2.2. Ingots and Bars
- 7.2.3. Wire
- 7.2.3.1. Fine Wire
- 7.2.3.2. Heavy Wire
- 7.2.4. Sheets and Foils
- 7.2.5. Rods and Tubes
- 7.2.6. Sputtering Targets
- 7.2.7. Other Fabricated Forms
- 7.2.1. Powder
- 8. Global Tantalum Market Analysis, by Grade/Purity Level
- 8.1. Key Segment Analysis
- 8.2. Tantalum Market Size Volume (Kilo Tons) and Value (US$ Bn), Analysis, and Forecasts, by Grade/Purity Level, 2021-2035
- 8.2.1. High Purity Grade (99.95%+)
- 8.2.2. Ultra-High Purity Grade (99.99%+)
- 8.2.3. Standard Industrial Grade
- 9. Global Tantalum Market Analysis, by Application
- 9.1. Key Segment Analysis
- 9.2. Tantalum Market Size (Volume (Kilo Tons) and Value (US$ Bn), Analysis, and Forecasts, by Application, 2021-2035
- 9.2.1. Capacitors
- 9.2.2. Superalloys and High-Temperature Alloys
- 9.2.3. Mill Products
- 9.2.4. Sputtering Targets
- 9.2.5. Chemical Processing Equipment
- 9.2.6. Medical Implants
- 9.2.7. Cutting Tools
- 9.2.8. Others
- 10. Global Tantalum Market Analysis, by End-Use Industry
- 10.1. Key Segment Analysis
- 10.2. Tantalum Market Size Volume (Kilo Tons) and Value (US$ Bn), Analysis, and Forecasts, by End-Use Industry, 2021-2035
- 10.2.1. Electronics
- 10.2.2. Aerospace & Defense
- 10.2.3. Medical & Healthcare
- 10.2.4. Chemical Processing
- 10.2.5. Automotive
- 10.2.6. Energy & Power Generation
- 10.2.7. Telecommunications
- 10.2.8. Industrial Manufacturing
- 10.2.9. Optical & Coating
- 10.2.10. Oil & Gas
- 10.2.11. Others
- 11. Global Tantalum Market Analysis, by Distribution Channel
- 11.1. Key Segment Analysis
- 11.2. Tantalum Market Size Volume (Kilo Tons) and Value (US$ Bn), Analysis, and Forecasts, by Distribution Channel, 2021-2035
- 11.2.1. Direct Sales/OEM
- 11.2.2. Distributors
- 11.2.3. Online Platforms
- 12. Global Tantalum Market Analysis and Forecasts, by Region
- 12.1. Key Findings
- 12.2. Tantalum Market Size Volume (Kilo Tons) and Value (US$ Bn), Analysis, and Forecasts, by Region, 2021-2035
- 12.2.1. North America
- 12.2.2. Europe
- 12.2.3. Asia Pacific
- 12.2.4. Middle East
- 12.2.5. Africa
- 12.2.6. South America
- 13. North America Tantalum Market Analysis
- 13.1. Key Segment Analysis
- 13.2. Regional Snapshot
- 13.3. North America Tantalum Market Size Volume (Kilo Tons) and Value (US$ Bn), Analysis, and Forecasts, 2021-2035
- 13.3.1. Product Type
- 13.3.2. Form
- 13.3.3. Grade/Purity Level
- 13.3.4. Application
- 13.3.5. End-Use Industry
- 13.3.6. Distribution Channel
- 13.3.7. Country
- 13.3.7.1. USA
- 13.3.7.2. Canada
- 13.3.7.3. Mexico
- 13.4. USA Tantalum Market
- 13.4.1. Country Segmental Analysis
- 13.4.2. Product Type
- 13.4.3. Form
- 13.4.4. Grade/Purity Level
- 13.4.5. Application
- 13.4.6. End-Use Industry
- 13.4.7. Distribution Channel
- 13.5. Canada Tantalum Market
- 13.5.1. Country Segmental Analysis
- 13.5.2. Product Type
- 13.5.3. Form
- 13.5.4. Grade/Purity Level
- 13.5.5. Application
- 13.5.6. End-Use Industry
- 13.5.7. Distribution Channel
- 13.6. Mexico Tantalum Market
- 13.6.1. Country Segmental Analysis
- 13.6.2. Product Type
- 13.6.3. Form
- 13.6.4. Grade/Purity Level
- 13.6.5. Application
- 13.6.6. End-Use Industry
- 13.6.7. Distribution Channel
- 14. Europe Tantalum Market Analysis
- 14.1. Key Segment Analysis
- 14.2. Regional Snapshot
- 14.3. Europe Tantalum Market Size Volume (Kilo Tons) and Value (US$ Bn), Analysis, and Forecasts, 2021-2035
- 14.3.1. Product Type
- 14.3.2. Form
- 14.3.3. Grade/Purity Level
- 14.3.4. Application
- 14.3.5. End-Use Industry
- 14.3.6. Distribution Channel
- 14.3.7. Country
- 14.3.7.1. Germany
- 14.3.7.2. United Kingdom
- 14.3.7.3. France
- 14.3.7.4. Italy
- 14.3.7.5. Spain
- 14.3.7.6. Netherlands
- 14.3.7.7. Nordic Countries
- 14.3.7.8. Poland
- 14.3.7.9. Russia & CIS
- 14.3.7.10. Rest of Europe
- 14.4. Germany Tantalum Market
- 14.4.1. Country Segmental Analysis
- 14.4.2. Product Type
- 14.4.3. Form
- 14.4.4. Grade/Purity Level
- 14.4.5. Application
- 14.4.6. End-Use Industry
- 14.4.7. Distribution Channel
- 14.5. United Kingdom Tantalum Market
- 14.5.1. Country Segmental Analysis
- 14.5.2. Product Type
- 14.5.3. Form
- 14.5.4. Grade/Purity Level
- 14.5.5. Application
- 14.5.6. End-Use Industry
- 14.5.7. Distribution Channel
- 14.6. France Tantalum Market
- 14.6.1. Country Segmental Analysis
- 14.6.2. Product Type
- 14.6.3. Form
- 14.6.4. Grade/Purity Level
- 14.6.5. Application
- 14.6.6. End-Use Industry
- 14.6.7. Distribution Channel
- 14.7. Italy Tantalum Market
- 14.7.1. Country Segmental Analysis
- 14.7.2. Product Type
- 14.7.3. Form
- 14.7.4. Grade/Purity Level
- 14.7.5. Application
- 14.7.6. End-Use Industry
- 14.7.7. Distribution Channel
- 14.8. Spain Tantalum Market
- 14.8.1. Country Segmental Analysis
- 14.8.2. Product Type
- 14.8.3. Form
- 14.8.4. Grade/Purity Level
- 14.8.5. Application
- 14.8.6. End-Use Industry
- 14.8.7. Distribution Channel
- 14.9. Netherlands Tantalum Market
- 14.9.1. Country Segmental Analysis
- 14.9.2. Product Type
- 14.9.3. Form
- 14.9.4. Grade/Purity Level
- 14.9.5. Application
- 14.9.6. End-Use Industry
- 14.9.7. Distribution Channel
- 14.10. Nordic Countries Tantalum Market
- 14.10.1. Country Segmental Analysis
- 14.10.2. Product Type
- 14.10.3. Form
- 14.10.4. Grade/Purity Level
- 14.10.5. Application
- 14.10.6. End-Use Industry
- 14.10.7. Distribution Channel
- 14.11. Poland Tantalum Market
- 14.11.1. Country Segmental Analysis
- 14.11.2. Product Type
- 14.11.3. Form
- 14.11.4. Grade/Purity Level
- 14.11.5. Application
- 14.11.6. End-Use Industry
- 14.11.7. Distribution Channel
- 14.12. Russia & CIS Tantalum Market
- 14.12.1. Country Segmental Analysis
- 14.12.2. Product Type
- 14.12.3. Form
- 14.12.4. Grade/Purity Level
- 14.12.5. Application
- 14.12.6. End-Use Industry
- 14.12.7. Distribution Channel
- 14.13. Rest of Europe Tantalum Market
- 14.13.1. Country Segmental Analysis
- 14.13.2. Product Type
- 14.13.3. Form
- 14.13.4. Grade/Purity Level
- 14.13.5. Application
- 14.13.6. End-Use Industry
- 14.13.7. Distribution Channel
- 15. Asia Pacific Tantalum Market Analysis
- 15.1. Key Segment Analysis
- 15.2. Regional Snapshot
- 15.3. Asia Pacific Tantalum Market Size Volume (Kilo Tons) and Value (US$ Bn), Analysis, and Forecasts, 2021-2035
- 15.3.1. Product Type
- 15.3.2. Form
- 15.3.3. Grade/Purity Level
- 15.3.4. Application
- 15.3.5. End-Use Industry
- 15.3.6. Distribution Channel
- 15.3.7. Country
- 15.3.7.1. China
- 15.3.7.2. India
- 15.3.7.3. Japan
- 15.3.7.4. South Korea
- 15.3.7.5. Australia and New Zealand
- 15.3.7.6. Indonesia
- 15.3.7.7. Malaysia
- 15.3.7.8. Thailand
- 15.3.7.9. Vietnam
- 15.3.7.10. Rest of Asia Pacific
- 15.4. China Tantalum Market
- 15.4.1. Country Segmental Analysis
- 15.4.2. Product Type
- 15.4.3. Form
- 15.4.4. Grade/Purity Level
- 15.4.5. Application
- 15.4.6. End-Use Industry
- 15.4.7. Distribution Channel
- 15.5. India Tantalum Market
- 15.5.1. Country Segmental Analysis
- 15.5.2. Product Type
- 15.5.3. Form
- 15.5.4. Grade/Purity Level
- 15.5.5. Application
- 15.5.6. End-Use Industry
- 15.5.7. Distribution Channel
- 15.6. Japan Tantalum Market
- 15.6.1. Country Segmental Analysis
- 15.6.2. Product Type
- 15.6.3. Form
- 15.6.4. Grade/Purity Level
- 15.6.5. Application
- 15.6.6. End-Use Industry
- 15.6.7. Distribution Channel
- 15.7. South Korea Tantalum Market
- 15.7.1. Country Segmental Analysis
- 15.7.2. Product Type
- 15.7.3. Form
- 15.7.4. Grade/Purity Level
- 15.7.5. Application
- 15.7.6. End-Use Industry
- 15.7.7. Distribution Channel
- 15.8. Australia and New Zealand Tantalum Market
- 15.8.1. Country Segmental Analysis
- 15.8.2. Product Type
- 15.8.3. Form
- 15.8.4. Grade/Purity Level
- 15.8.5. Application
- 15.8.6. End-Use Industry
- 15.8.7. Distribution Channel
- 15.9. Indonesia Tantalum Market
- 15.9.1. Country Segmental Analysis
- 15.9.2. Product Type
- 15.9.3. Form
- 15.9.4. Grade/Purity Level
- 15.9.5. Application
- 15.9.6. End-Use Industry
- 15.9.7. Distribution Channel
- 15.10. Malaysia Tantalum Market
- 15.10.1. Country Segmental Analysis
- 15.10.2. Product Type
- 15.10.3. Form
- 15.10.4. Grade/Purity Level
- 15.10.5. Application
- 15.10.6. End-Use Industry
- 15.10.7. Distribution Channel
- 15.11. Thailand Tantalum Market
- 15.11.1. Country Segmental Analysis
- 15.11.2. Product Type
- 15.11.3. Form
- 15.11.4. Grade/Purity Level
- 15.11.5. Application
- 15.11.6. End-Use Industry
- 15.11.7. Distribution Channel
- 15.12. Vietnam Tantalum Market
- 15.12.1. Country Segmental Analysis
- 15.12.2. Product Type
- 15.12.3. Form
- 15.12.4. Grade/Purity Level
- 15.12.5. Application
- 15.12.6. End-Use Industry
- 15.12.7. Distribution Channel
- 15.13. Rest of Asia Pacific Tantalum Market
- 15.13.1. Country Segmental Analysis
- 15.13.2. Product Type
- 15.13.3. Form
- 15.13.4. Grade/Purity Level
- 15.13.5. Application
- 15.13.6. End-Use Industry
- 15.13.7. Distribution Channel
- 16. Middle East Tantalum Market Analysis
- 16.1. Key Segment Analysis
- 16.2. Regional Snapshot
- 16.3. Middle East Tantalum Market Size Volume (Kilo Tons) and Value (US$ Bn), Analysis, and Forecasts, 2021-2035
- 16.3.1. Product Type
- 16.3.2. Form
- 16.3.3. Grade/Purity Level
- 16.3.4. Application
- 16.3.5. End-Use Industry
- 16.3.6. Distribution Channel
- 16.3.7. Country
- 16.3.7.1. Turkey
- 16.3.7.2. UAE
- 16.3.7.3. Saudi Arabia
- 16.3.7.4. Israel
- 16.3.7.5. Rest of Middle East
- 16.4. Turkey Tantalum Market
- 16.4.1. Country Segmental Analysis
- 16.4.2. Product Type
- 16.4.3. Form
- 16.4.4. Grade/Purity Level
- 16.4.5. Application
- 16.4.6. End-Use Industry
- 16.4.7. Distribution Channel
- 16.5. UAE Tantalum Market
- 16.5.1. Country Segmental Analysis
- 16.5.2. Product Type
- 16.5.3. Form
- 16.5.4. Grade/Purity Level
- 16.5.5. Application
- 16.5.6. End-Use Industry
- 16.5.7. Distribution Channel
- 16.6. Saudi Arabia Tantalum Market
- 16.6.1. Country Segmental Analysis
- 16.6.2. Product Type
- 16.6.3. Form
- 16.6.4. Grade/Purity Level
- 16.6.5. Application
- 16.6.6. End-Use Industry
- 16.6.7. Distribution Channel
- 16.7. Israel Tantalum Market
- 16.7.1. Country Segmental Analysis
- 16.7.2. Product Type
- 16.7.3. Form
- 16.7.4. Grade/Purity Level
- 16.7.5. Application
- 16.7.6. End-Use Industry
- 16.7.7. Distribution Channel
- 16.8. Rest of Middle East Tantalum Market
- 16.8.1. Country Segmental Analysis
- 16.8.2. Product Type
- 16.8.3. Form
- 16.8.4. Grade/Purity Level
- 16.8.5. Application
- 16.8.6. End-Use Industry
- 16.8.7. Distribution Channel
- 17. Africa Tantalum Market Analysis
- 17.1. Key Segment Analysis
- 17.2. Regional Snapshot
- 17.3. Africa Tantalum Market Size Volume (Kilo Tons) and Value (US$ Bn), Analysis, and Forecasts, 2021-2035
- 17.3.1. Product Type
- 17.3.2. Form
- 17.3.3. Grade/Purity Level
- 17.3.4. Application
- 17.3.5. End-Use Industry
- 17.3.6. Distribution Channel
- 17.3.7. Country
- 17.3.7.1. South Africa
- 17.3.7.2. Egypt
- 17.3.7.3. Nigeria
- 17.3.7.4. Algeria
- 17.3.7.5. Rest of Africa
- 17.4. South Africa Tantalum Market
- 17.4.1. Country Segmental Analysis
- 17.4.2. Product Type
- 17.4.3. Form
- 17.4.4. Grade/Purity Level
- 17.4.5. Application
- 17.4.6. End-Use Industry
- 17.4.7. Distribution Channel
- 17.5. Egypt Tantalum Market
- 17.5.1. Country Segmental Analysis
- 17.5.2. Product Type
- 17.5.3. Form
- 17.5.4. Grade/Purity Level
- 17.5.5. Application
- 17.5.6. End-Use Industry
- 17.5.7. Distribution Channel
- 17.6. Nigeria Tantalum Market
- 17.6.1. Country Segmental Analysis
- 17.6.2. Product Type
- 17.6.3. Form
- 17.6.4. Grade/Purity Level
- 17.6.5. Application
- 17.6.6. End-Use Industry
- 17.6.7. Distribution Channel
- 17.7. Algeria Tantalum Market
- 17.7.1. Country Segmental Analysis
- 17.7.2. Product Type
- 17.7.3. Form
- 17.7.4. Grade/Purity Level
- 17.7.5. Application
- 17.7.6. End-Use Industry
- 17.7.7. Distribution Channel
- 17.8. Rest of Africa Tantalum Market
- 17.8.1. Country Segmental Analysis
- 17.8.2. Product Type
- 17.8.3. Form
- 17.8.4. Grade/Purity Level
- 17.8.5. Application
- 17.8.6. End-Use Industry
- 17.8.7. Distribution Channel
- 18. South America Tantalum Market Analysis
- 18.1. Key Segment Analysis
- 18.2. Regional Snapshot
- 18.3. South America Tantalum Market Size Volume (Kilo Tons) and Value (US$ Bn), Analysis, and Forecasts, 2021-2035
- 18.3.1. Product Type
- 18.3.2. Form
- 18.3.3. Grade/Purity Level
- 18.3.4. Application
- 18.3.5. End-Use Industry
- 18.3.6. Distribution Channel
- 18.3.7. Country
- 18.3.7.1. Brazil
- 18.3.7.2. Argentina
- 18.3.7.3. Rest of South America
- 18.4. Brazil Tantalum Market
- 18.4.1. Country Segmental Analysis
- 18.4.2. Product Type
- 18.4.3. Form
- 18.4.4. Grade/Purity Level
- 18.4.5. Application
- 18.4.6. End-Use Industry
- 18.4.7. Distribution Channel
- 18.5. Argentina Tantalum Market
- 18.5.1. Country Segmental Analysis
- 18.5.2. Product Type
- 18.5.3. Form
- 18.5.4. Grade/Purity Level
- 18.5.5. Application
- 18.5.6. End-Use Industry
- 18.5.7. Distribution Channel
- 18.6. Rest of South America Tantalum Market
- 18.6.1. Country Segmental Analysis
- 18.6.2. Product Type
- 18.6.3. Form
- 18.6.4. Grade/Purity Level
- 18.6.5. Application
- 18.6.6. End-Use Industry
- 18.6.7. Distribution Channel
- 19. Key Players/ Company Profile
- 19.1. ABSCO Limited
- 19.1.1. Company Details/ Overview
- 19.1.2. Company Financials
- 19.1.3. Key Customers and Competitors
- 19.1.4. Business/ Industry Portfolio
- 19.1.5. Product Portfolio/ Specification Details
- 19.1.6. Pricing Data
- 19.1.7. Strategic Overview
- 19.1.8. Recent Developments
- 19.2. Advanced Metallurgical Group
- 19.3. Cabot Corporation
- 19.4. Changsha South Tantalum Niobium
- 19.5. COMETAL
- 19.6. Exotech Inc.
- 19.7. F&X Electro-Materials
- 19.8. Global Advanced Metals
- 19.9. H.C. Starck
- 19.10. Inframat Advanced Materials
- 19.11. Jiujiang Tanbre
- 19.12. JX Nippon Mining & Metals
- 19.13. Kennametal Inc.
- 19.14. Mitsui Mining & Smelting
- 19.15. Ningxia Non-Ferrous Metal Smeltery
- 19.16. Ningxia Orient Tantalum Industry
- 19.17. Plansee Group
- 19.18. QuantumClean
- 19.19. Solikamsk Magnesium Works
- 19.20. Stanford Advanced Materials
- 19.21. Taki Chemical
- 19.22. Ulba Metallurgical Plant
- 19.23. Other Key Players
- 19.1. ABSCO Limited
Note* - This is just tentative list of players. While providing the report, we will cover more number of players based on their revenue and share for each geography
Research Design
Our research design integrates both demand-side and supply-side analysis through a balanced combination of primary and secondary research methodologies. By utilizing both bottom-up and top-down approaches alongside rigorous data triangulation methods, we deliver robust market intelligence that supports strategic decision-making.
MarketGenics' comprehensive research design framework ensures the delivery of accurate, reliable, and actionable market intelligence. Through the integration of multiple research approaches, rigorous validation processes, and expert analysis, we provide our clients with the insights needed to make informed strategic decisions and capitalize on market opportunities.

MarketGenics leverages a dedicated industry panel of experts and a comprehensive suite of paid databases to effectively collect, consolidate, and analyze market intelligence.
Our approach has consistently proven to be reliable and effective in generating accurate market insights, identifying key industry trends, and uncovering emerging business opportunities.
Through both primary and secondary research, we capture and analyze critical company-level data such as manufacturing footprints, including technical centers, R&D facilities, sales offices, and headquarters.
Our expert panel further enhances our ability to estimate market size for specific brands based on validated field-level intelligence.
Our data mining techniques incorporate both parametric and non-parametric methods, allowing for structured data collection, sorting, processing, and cleaning.
Demand projections are derived from large-scale data sets analyzed through proprietary algorithms, culminating in robust and reliable market sizing.
Research Approach
The bottom-up approach builds market estimates by starting with the smallest addressable market units and systematically aggregating them to create comprehensive market size projections.
This method begins with specific, granular data points and builds upward to create the complete market landscape.
Customer Analysis → Segmental Analysis → Geographical Analysis
The top-down approach starts with the broadest possible market data and systematically narrows it down through a series of filters and assumptions to arrive at specific market segments or opportunities.
This method begins with the big picture and works downward to increasingly specific market slices.
TAM → SAM → SOM


Research Methods
Desk / Secondary Research
While analysing the market, we extensively study secondary sources, directories, and databases to identify and collect information useful for this technical, market-oriented, and commercial report. Secondary sources that we utilize are not only the public sources, but it is a combination of Open Source, Associations, Paid Databases, MG Repository & Knowledgebase, and others.
- Company websites, annual reports, financial reports, broker reports, and investor presentations
- National government documents, statistical databases and reports
- News articles, press releases and web-casts specific to the companies operating in the market, Magazines, reports, and others
- We gather information from commercial data sources for deriving company specific data such as segmental revenue, share for geography, product revenue, and others
- Internal and external proprietary databases (industry-specific), relevant patent, and regulatory databases
- Governing Bodies, Government Organizations
- Relevant Authorities, Country-specific Associations for Industries
We also employ the model mapping approach to estimate the product level market data through the players' product portfolio
Primary Research
Primary research/ interviews is vital in analyzing the market. Most of the cases involves paid primary interviews. Primary sources include primary interviews through e-mail interactions, telephonic interviews, surveys as well as face-to-face interviews with the different stakeholders across the value chain including several industry experts.
| Type of Respondents | Number of Primaries |
|---|---|
| Tier 2/3 Suppliers | ~20 |
| Tier 1 Suppliers | ~25 |
| End-users | ~25 |
| Industry Expert/ Panel/ Consultant | ~30 |
| Total | ~100 |
MG Knowledgebase
• Repository of industry blog, newsletter and case studies
• Online platform covering detailed market reports, and company profiles
Forecasting Factors and Models
Forecasting Factors
- Historical Trends – Past market patterns, cycles, and major events that shaped how markets behave over time. Understanding past trends helps predict future behavior.
- Industry Factors – Specific characteristics of the industry like structure, regulations, and innovation cycles that affect market dynamics.
- Macroeconomic Factors – Economic conditions like GDP growth, inflation, and employment rates that affect how much money people have to spend.
- Demographic Factors – Population characteristics like age, income, and location that determine who can buy your product.
- Technology Factors – How quickly people adopt new technology and how much technology infrastructure exists.
- Regulatory Factors – Government rules, laws, and policies that can help or restrict market growth.
- Competitive Factors – Analyzing competition structure such as degree of competition and bargaining power of buyers and suppliers.
Forecasting Models / Techniques
Multiple Regression Analysis
- Identify and quantify factors that drive market changes
- Statistical modeling to establish relationships between market drivers and outcomes
Time Series Analysis – Seasonal Patterns
- Understand regular cyclical patterns in market demand
- Advanced statistical techniques to separate trend, seasonal, and irregular components
Time Series Analysis – Trend Analysis
- Identify underlying market growth patterns and momentum
- Statistical analysis of historical data to project future trends
Expert Opinion – Expert Interviews
- Gather deep industry insights and contextual understanding
- In-depth interviews with key industry stakeholders
Multi-Scenario Development
- Prepare for uncertainty by modeling different possible futures
- Creating optimistic, pessimistic, and most likely scenarios
Time Series Analysis – Moving Averages
- Sophisticated forecasting for complex time series data
- Auto-regressive integrated moving average models with seasonal components
Econometric Models
- Apply economic theory to market forecasting
- Sophisticated economic models that account for market interactions
Expert Opinion – Delphi Method
- Harness collective wisdom of industry experts
- Structured, multi-round expert consultation process
Monte Carlo Simulation
- Quantify uncertainty and probability distributions
- Thousands of simulations with varying input parameters
Research Analysis
Our research framework is built upon the fundamental principle of validating market intelligence from both demand and supply perspectives. This dual-sided approach ensures comprehensive market understanding and reduces the risk of single-source bias.
Demand-Side Analysis: We understand end-user/application behavior, preferences, and market needs along with the penetration of the product for specific application.
Supply-Side Analysis: We estimate overall market revenue, analyze the segmental share along with industry capacity, competitive landscape, and market structure.
Validation & Evaluation
Data triangulation is a validation technique that uses multiple methods, sources, or perspectives to examine the same research question, thereby increasing the credibility and reliability of research findings. In market research, triangulation serves as a quality assurance mechanism that helps identify and minimize bias, validate assumptions, and ensure accuracy in market estimates.
- Data Source Triangulation – Using multiple data sources to examine the same phenomenon
- Methodological Triangulation – Using multiple research methods to study the same research question
- Investigator Triangulation – Using multiple researchers or analysts to examine the same data
- Theoretical Triangulation – Using multiple theoretical perspectives to interpret the same data

Custom Market Research Services
We will customise the research for you, in case the report listed above does not meet your requirements.
Get 10% Free Customisation