A2 Milk Market Size, Share, Growth Opportunity Analysis Report by Product Type (A2 Cow Milk, A2 Goat Milk, Blended A2 Milk, Others), Product Form, Fat Content, Packaging Type, Price Segment, Consumer Segment, Source Origin, End-User, Distribution Channel, and Geography (North America, Europe, Asia Pacific, Middle East, Africa, and South America) – Global Industry Data, Trends, and Forecasts, 2025–2035.
|
Market Structure & Evolution |
|
|
Segmental Data Insights |
|
|
Demand Trends |
|
|
Competitive Landscape |
|
|
Strategic Development |
|
|
Future Outlook & Opportunities |
|
A2 Milk Market Size, Share, and Growth
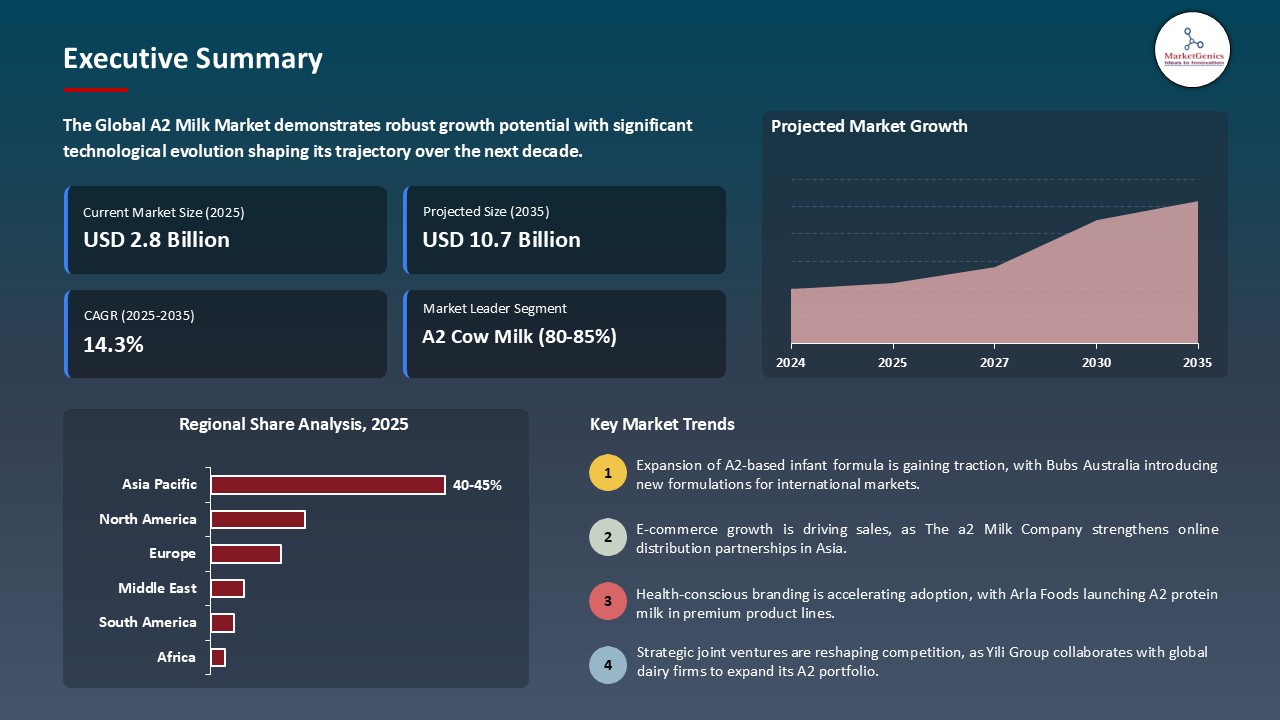
The global A2 milk market is projected to grow from USD 2.8 Billion in 2025 to USD 10.73 Billion by 2035, with a strong CAGR of 14.3% during the forecast period. The rise is fueled by increasing consumer demand for gut-friendly dairy alternatives and clean-label nutrition, especially among lactose-intolerant populations and health-focused consumers.
In 2025, The a2 Milk Company unveiled its advanced milk testing platform that integrates next-gen DNA sequencing to verify A2 beta-casein protein presence in dairy herds. This patented innovation, titled “Method and System for Accurate Identification of A2 Genotype in Bovine Milk,” aims to enhance traceability, transparency, and consumer trust. This move signals a strategic leap forward in premium dairy authentication and could redefine quality benchmarks in the global A2 milk segment.
Dairy producers are reconfiguring their herds through selective breeding and genetic screening to produce milk containing only the A2 beta-casein protein. For instance, in 2025, New Zealand-based Fonterra launched a nationwide herd conversion program with new genotyping options to follow immense demand from Asia and the Middle East for exports.
The requirement for transparent sourcing and non-GMO certifications has even led manufacturers to implement new digital traceability platforms that will continue to legitimize their brands among health-conscious purchasers. Various supply chain improvements, coupled with consumer research, are allowing A2 milk to differentiate itself from the rest of the dairy sector as a premium segment.
A2 Milk Market Dynamics and Trends
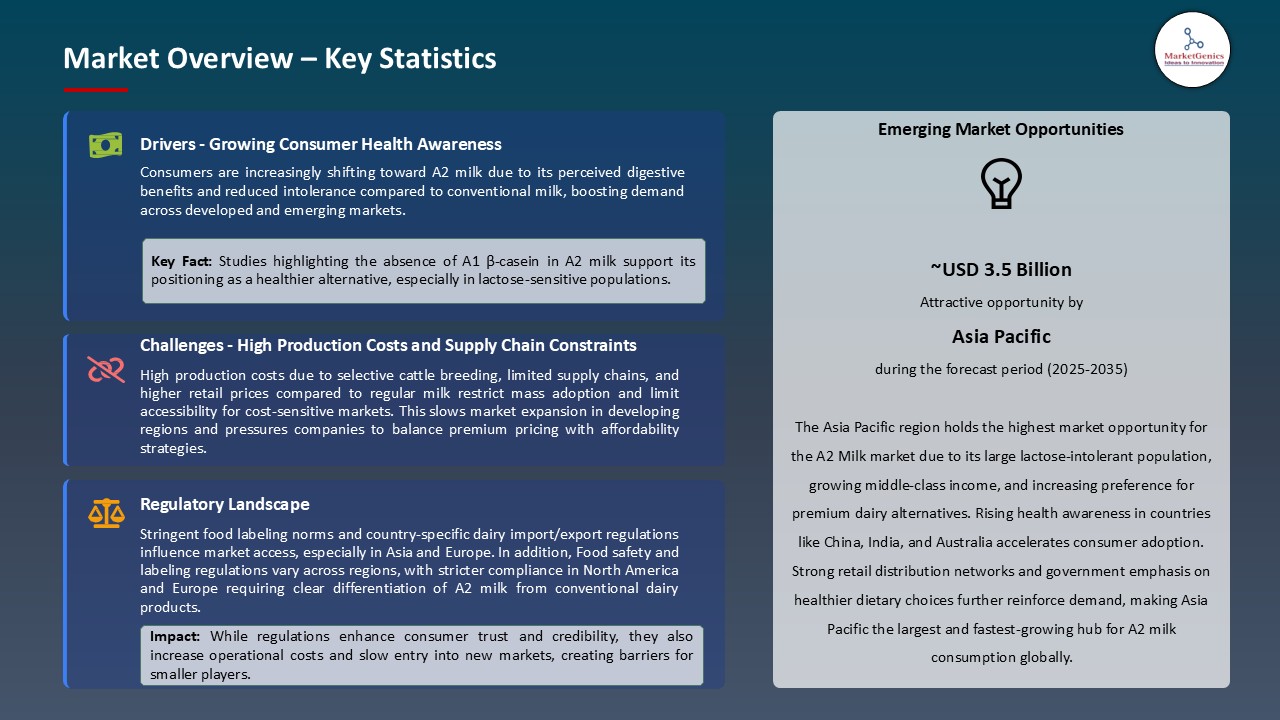
Driver: Rising Demand for Gut-Friendly and Allergen-Free Dairy
- Growth in consumer awareness of lactose intolerance and digestion difficulties related to milk, leading to heightened demand for A2 milk that has no A1 beta-casein protein which is linked to bloating and discomfort, is creating demand for A2 milk as a natural alternative to conventional milks that are appealing to both health conscious and sensitive consumers. For Instance, Germany's Müller group launched its dairy products that are exclusive to A2 only under the brand "Müller Pure Digest" and promoting it as an easier-to-digest solution for European consumers with mild dairy intolerance.
- Raising the shelf presence and speeding up cross-border demand, especially in the Asia-Pacific and North American regions, retailers and health-based platforms are promoting A2 milk as part of the gut-health categories. This is spurring dairy producers to adjust their practices and move more towards A2 cow herds and segregated processing lines.
Restraint: High Cost of Herd Transition and Product Segregation
- Transitioning traditional dairy farms to A2-only herds involves, carefully selecting breeding techniques, genetic testing and improving facilities which will be costly and time consuming to carry out. For instance, a mid-sized cooperative in Wisconsin reported a 3-year transition period to achieve full A2 compliance, during which production volumes and returns were inconsistent.
- The separation of collection, processing and even packaging lines creates, logistical and operational challenges for A2 milk, particularly more marginal dairy farmers and restricts more A2 producers from converting to A2 and ultimately slows the ability of the supply chain to scalable.
Opportunity: Growing Penetration in Plant-Based and Hybrid Dairy Segments
- With flexitarian and plant-forward diets surging in popularity worldwide, A2 milk is emerging as a natural fit for companies that will offer hybrid dairy options that combine animal and plant protein for better nutrition and improved digestibility. This is a huge opportunity for dairy companies to innovate with new drinkable yogurt, flavoured milk, and nutritional shake products utilising A2 milk as a premium offering.
- For example, in 2025, Danone launched a hybrid protein beverage line "Alpro Plus", which combined A2 milk with oat and almond bases to help calcium absorption and gut health, in France. Danone promoted Alpro Plus as an option for consumers who want to reduce dairy options. The successful distribution and selling of the products, in retail and pharmacy channels, demonstrated how A2 milk would open up a new premium dairy option opportunity in the dairy-alternative space. This will allow brands to generate better margins with A2 while also meeting a wider portion of the consumer market.
Key Trend: Functional Nutrition and Clean Label Transparency
- Consumers are increasingly looking for dairy products with functional traits such as digestive comfort, immune health, and muscle recovery while demanding ingredient transparency and minimal processing. A2 milk aligns with this trend as it offers a single-ingredient solution perceived as closer to natural and less likely to trigger intolerance. For Instance, in 2025, Horizon Organic came out with a new A2 line with certified organic and non-GMO certification. This product was taken up quickly in high-end health food stores, as well as online health and wellness retailers. The product was presented under the tagline, "Simple Protein. Better Comfort." This reinforces the clean label value and positions A2 milk at the conjunction of functionality and purity, which is the trend identifying dairy innovation in the future.
A2 Milk Market Analysis and Segmental Data
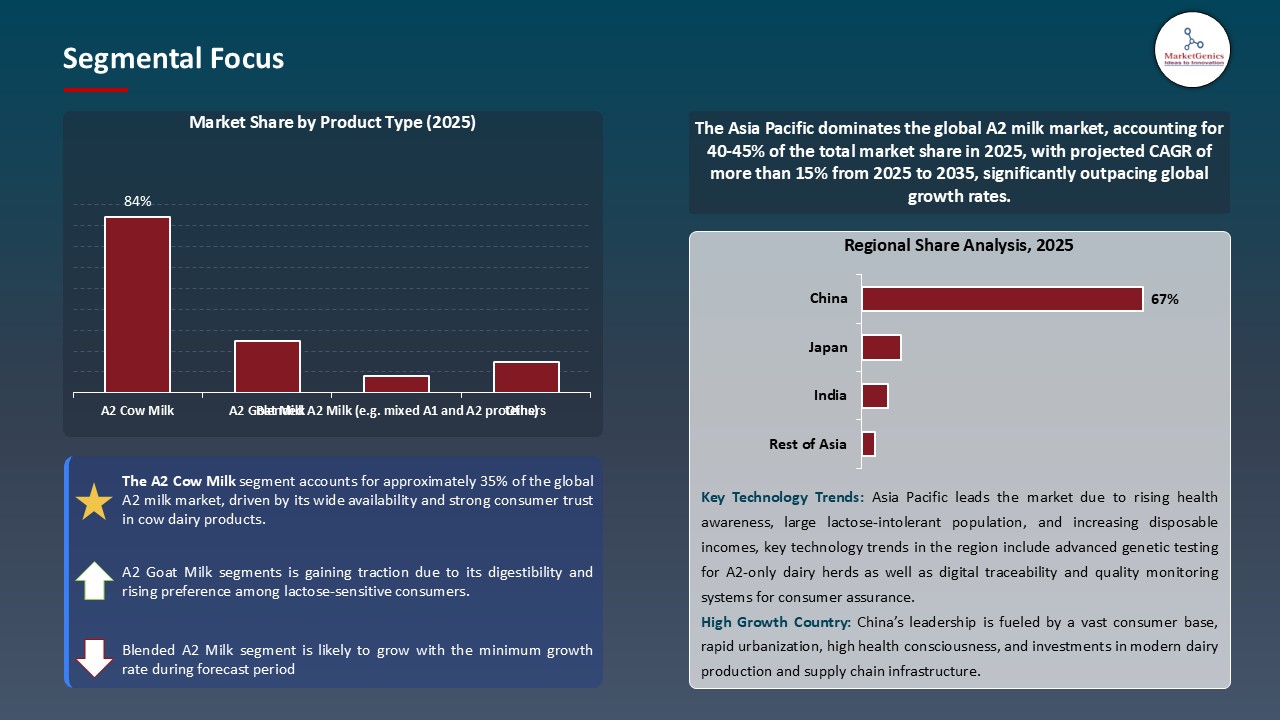
A2 Cow Milk holds majority share in A2 Milk Market
- A2 cow milk holds approximately 84% share in the A2 milk market driven by its strong acceptance as a premium, easy-to-digest dairy product. The segment benefits from consumer confidence and its ability to align with conventional consumption practices, especially in the milk-drinking cultures.
- Companies like China Modern Dairy and India’s Nandini Milk are building their A2 cow milk offerings through growing supermarket and health-oriented retail consumer demand. These brands are adding to rural sourcing and are implementing tamper-evident packaging to clearly improve safety and traceability.
Asia Pacific Dominates A2 Milk Market in 2025 and Beyond
- Asia Pacific continues to be the largest regional market by both volume and growth. This leadership position in the market is backed by a growing middle class with increasing incomes and growing awareness of the benefits of digestive health, as well as government support for raising indigenous cattle breed numbers.
- For Instance, Indian government started a public-private venture initiative with regional dairies to grow the production of only A2 milk for sale to increase potential sales in southern states. Other countries, such as China and Australia, are also seeing increased exports of A2 milk-based baby food and beverages, which further solidifying the region’s dominance in the A2 milk market.
A2 Milk Market Ecosystem
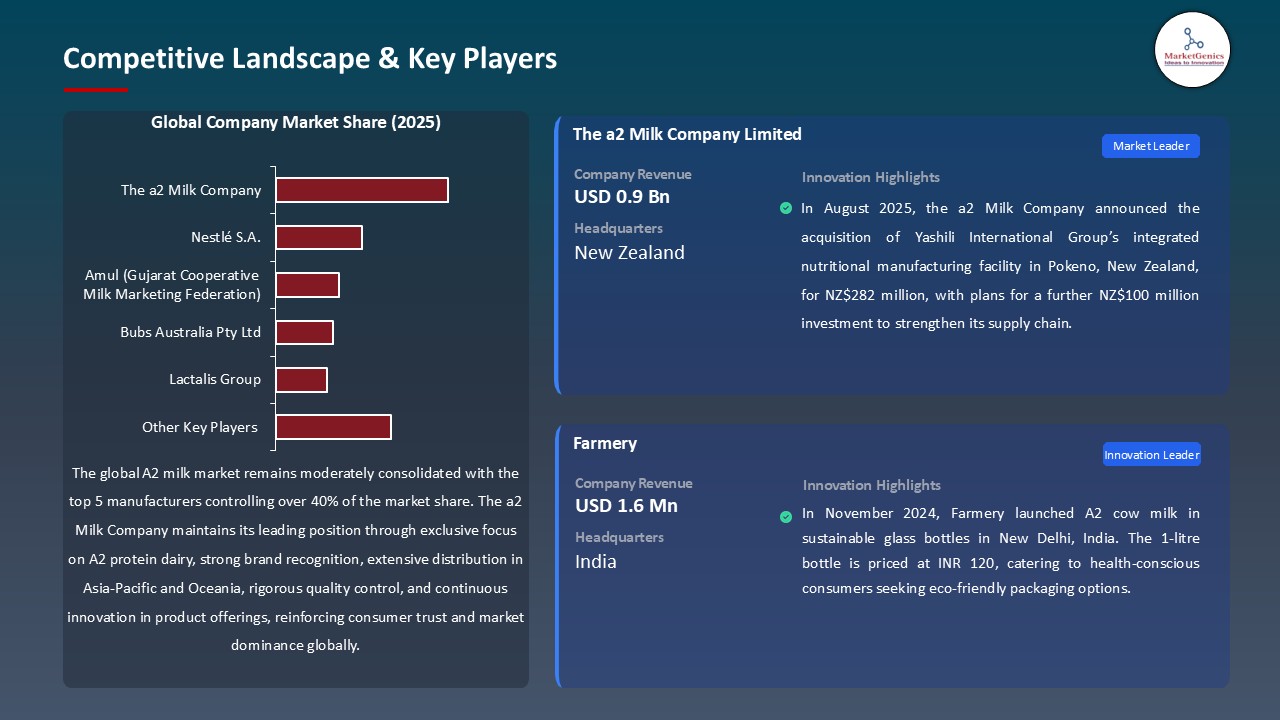
The A2 milk market is moderately consolidated (medium level) with Tier-1 players—The a2 Milk Company, Fonterra, Danone, Nestlé—dominating scale and distribution; Tier-2 firms such as Arla, Yili, Amul, FrieslandCampina hold regional strength; Tier-3 companies deliver niche or organic offerings. Buyer concentration is moderate-to-high as large retail chains and foodservice groups exert pricing pressure. Supplier concentration is moderate because widespread dairy supply exists but A2-specific herds and certified supply chains remain limited.
Recent Developments and Strategic Overview
- In 2024, Nestlé Australia expanded its A2 milk product line under the NAN SupremePro brand, introducing infant formula made exclusively with A2 beta-casein protein. This move aims to capture demand among parents looking for easier-to-digest milk options and builds on Nestlé’s growing investment in premium dairy solutions tailored for early childhood nutrition.
- In 2024, Valio Ltd., a Finnish dairy cooperative, partnered with local retailers in South Korea to launch fresh A2 milk offerings, targeting lactose-sensitive consumers in Asia. The initiative leverages Valio’s patented A2 cow selection process and is part of its strategy to increase exports from Northern Europe into high-growth APAC markets.
Report Scope
|
Attribute |
Detail |
|
Market Size in 2025 |
USD 2.8 Billion |
|
Market Forecast Value in 2035 |
USD 10.7 Billion |
|
Growth Rate (CAGR) |
14.3% |
|
Forecast Period |
2025 – 2035 |
|
Historical Data Available for |
2021 – 2025 |
|
Market Size Units |
US$ Billion for Value |
|
Report Format |
Electronic (PDF) + Excel |
|
Regions and Countries Covered |
|||||
|
North America |
Europe |
Asia Pacific |
Middle East |
Africa |
South America |
|
|
|
|
|
|
|
Companies Covered |
|||||
|
|
|
|
||
A2 Milk Market Segmentation and Highlights
|
Segment |
Sub-segment |
|
By Product Type |
|
|
By Product Form
|
|
|
By Fat Content
|
|
|
By Packaging Type |
|
|
By Price Segment
|
|
|
By Consumer Segment |
|
|
By Source Origin |
|
|
By End-User |
|
|
By Distribution Channel |
|
Frequently Asked Questions
Table of Contents
- 1. Research Methodology and Assumptions
- 1.1. Definitions
- 1.2. Research Design and Approach
- 1.3. Data Collection Methods
- 1.4. Base Estimates and Calculations
- 1.5. Forecasting Models
- 1.5.1. Key Forecast Factors & Impact Analysis
- 1.6. Secondary Research
- 1.6.1. Open Sources
- 1.6.2. Paid Databases
- 1.6.3. Associations
- 1.7. Primary Research
- 1.7.1. Primary Sources
- 1.7.2. Primary Interviews with Stakeholders across Ecosystem
- 2. Executive Summary
- 2.1. A2 Milk Market Outlook
- 2.1.1. A2 Milk Market Size in Value (US$ Billion), and Forecasts, 2021-2035
- 2.1.2. Compounded Annual Growth Rate Analysis
- 2.1.3. Growth Opportunity Analysis
- 2.1.4. Segmental Share Analysis
- 2.1.5. Geographical Share Analysis
- 2.2. Market Analysis and Facts
- 2.3. Supply-Demand Analysis
- 2.4. Competitive Benchmarking
- 2.5. Go-to- Market Strategy
- 2.5.1. Customer/ End-use Industry Assessment
- 2.5.2. Growth Opportunity Data, 2025-2035
- 2.5.2.1. Regional Data
- 2.5.2.2. Country Data
- 2.5.2.3. Segmental Data
- 2.5.3. Identification of Potential Market Spaces
- 2.5.4. GAP Analysis
- 2.5.5. Potential Attractive Price Points
- 2.5.6. Prevailing Market Risks & Challenges
- 2.5.7. Preferred Sales & Marketing Strategies
- 2.5.8. Key Recommendations and Analysis
- 2.5.9. A Way Forward
- 2.1. A2 Milk Market Outlook
- 3. Industry Data and Premium Insights
- 3.1. Global A2 Milk Industry Overview, 2025
- 3.1.1. Food & Beverages Industry Ecosystem Analysis
- 3.1.2. Key Trends for Food & Beverages Industry
- 3.1.3. Regional Distribution for Food & Beverages Industry
- 3.2. Supplier Customer Data
- 3.3. Source Roadmap and Developments
- 3.4. Trade Analysis
- 3.4.1. Import & Export Analysis, 2025
- 3.4.2. Top Importing Countries
- 3.4.3. Top Exporting Countries
- 3.5. Trump Tariff Impact Analysis
- 3.1. Global A2 Milk Industry Overview, 2025
- 4. Market Overview
- 4.1. Market Dynamics
- 4.1.1. Drivers
- 4.1.1.1. Rising demand from lactose-sensitive and health-conscious consumers
- 4.1.1.2. Growth of premium dairy retail in urban areas
- 4.1.2. Restraints
- 4.1.2.1. High production and certification costs
- 4.1.2.2. Low awareness in emerging markets
- 4.1.1. Drivers
- 4.2. Key Trend Analysis
- 4.3. Regulatory Framework
- 4.3.1. Key Regulations, Norms, and Subsidies, by Key Countries
- 4.3.2. Tariffs and Standards
- 4.3.3. Impact Analysis of Regulations on the Market
- 4.4. Value Chain Analysis
- 4.4.1. Manufacturers
- 4.4.2. Technology
- 4.4.3. End-users/ Customers
- 4.5. Cost Structure Analysis
- 4.5.1. Parameter’s Share for Cost Associated
- 4.5.2. COGP vs COGS
- 4.5.3. Profit Margin Analysis
- 4.6. Pricing Analysis
- 4.6.1. Regional Pricing Analysis
- 4.6.2. Segmental Pricing Trends
- 4.6.3. Factors Influencing Pricing
- 4.7. Porter’s Five Forces Analysis
- 4.8. PESTEL Analysis
- 4.9. A2 Milk Market Demand
- 4.9.1. Historical Market Size - in Value (US$ Billion), 2021-2024
- 4.9.2. Current and Future Market Size - in Value (US$ Billion), 2025–2035
- 4.9.2.1. Y-o-Y Growth Trends
- 4.9.2.2. Absolute $ Opportunity Assessment
- 4.1. Market Dynamics
- 5. Competition Landscape
- 5.1. Competition structure
- 5.1.1. Fragmented v/s consolidated
- 5.2. Company Share Analysis, 2025
- 5.2.1. Global Company Market Share
- 5.2.2. By Region
- 5.2.2.1. North America
- 5.2.2.2. Europe
- 5.2.2.3. Asia Pacific
- 5.2.2.4. Middle East
- 5.2.2.5. Africa
- 5.2.2.6. South America
- 5.3. Product Comparison Matrix
- 5.3.1. Specifications
- 5.3.2. Market Positioning
- 5.3.3. Pricing
- 5.1. Competition structure
- 6. A2 Milk Market Analysis, by Product Type
- 6.1. Key Segment Analysis
- 6.2. A2 Milk Market Size in Value (US$ Billion), Analysis, and Forecasts, by Product Type, 2021-2035
- A2 6.2.1. Cow Milk
- 6.2.2. A2 Goat Milk
- 6.2.3. Blended A2 Milk (e.g. mixed A1 and A2 proteins)
- 6.2.4. Others
- 7. A2 Milk Market Analysis, by Product Form
- 7.1. Key Segment Analysis
- 7.2. A2 Milk Market Size in Value (US$ Billion), Analysis, and Forecasts, by Product Form, 2021-2035
- 7.2.1. Liquid Milk (Fresh, UHT)
- 7.2.2. Powdered Milk (Full Cream, Skimmed, Infant Formula)
- 7.2.3. Others
- 8. A2 Milk Market Analysis, by Fat Content
- 8.1. Key Segment Analysis
- 8.2. A2 Milk Market Size in Value (US$ Billion), Analysis, and Forecasts, by Fat Content, 2021-2035
- 8.2.1. Full Cream
- 8.2.2. Semi-Skimmed
- 8.2.3. Skimmed
- 8.2.4. Others
- 9. A2 Milk Market Analysis, by Packaging Type
- 9.1. Key Segment Analysis
- 9.2. A2 Milk Market Size in Value (US$ Billion), Analysis, and Forecasts, by Packaging Type, 2021-2035
- 9.2.1. Tetra Pak Cartons
- 9.2.2. Bottles (Glass, Plastic)
- 9.2.3. Pouches
- 9.2.4. Sachets (Powdered Forms)
- 9.2.5. Others
- 10. A2 Milk Market Analysis, by Price Segment
- 10.1. Key Segment Analysis
- 10.2. A2 Milk Market Size in Value (US$ Billion), Analysis, and Forecasts, by Price Segment, 2021-2035
- 10.2.1. Value/ Budget (Mass‑market A2)
- 10.2.2. Premium (Organic, Branded A2)
- 10.2.3. Others
- 11. A2 Milk Market Analysis, by Consumer Segment
- 11.1. Key Segment Analysis
- 11.2. A2 Milk Market Size in Value (US$ Billion), Analysis, and Forecasts, by Consumer Segment, 2021-2035
- 11.2.1. Health-Conscious Consumers
- 11.2.2. Lactose-Sensitive Individuals
- 11.2.3. Parents (Infant & Toddler Nutrition)
- 11.2.4. Elderly Consumers
- 12. A2 Milk Market Analysis, by Source Origin
- 12.1. Key Segment Analysis
- 12.2. A2 Milk Market Size in Value (US$ Billion), Analysis, and Forecasts, by Source Origin, 2021-2035
- 12.2.1. Certified A2 Certified Herds
- 12.2.2. Non-Verified/Local Farm A2 Products
- 13. A2 Milk Market Analysis, by End-User
- 13.1. Key Segment Analysis
- 13.2. A2 Milk Market Size in Value (US$ Billion), Analysis, and Forecasts, by End-User, 2021-2035
- 13.2.1. Individual Consumers
- 13.2.2. Households
- 13.2.3. Foodservice Outlets (Cafés, Restaurants)
- 13.2.4. Institutional Buyers (Hospitals, Schools)
- 13.2.5. Others
- 14. A2 Milk Market Analysis, by Distribution Channel
- 14.1. Key Segment Analysis
- 14.2. A2 Milk Market Size in Value (US$ Billion), Analysis, and Forecasts, by Distribution Channel, 2021-2035
- 14.2.1. Supermarkets/ Hypermarkets
- 14.2.2. Convenience Stores
- 14.2.3. Online Retail
- 14.2.4. Specialty Health Food Stores
- 14.2.5. Direct-to-Consumer/Home Delivery
- 15. A2 Milk Market Analysis and Forecasts, by Region
- 15.1. Key Findings
- 15.2. A2 Milk Market Size in Value (US$ Billion), Analysis, and Forecasts, by Region, 2021-2035
- 15.2.1. North America
- 15.2.2. Europe
- 15.2.3. Asia Pacific
- 15.2.4. Middle East
- 15.2.5. Africa
- 15.2.6. South America
- 16. North America A2 Milk Market Analysis
- 16.1. Key Segment Analysis
- 16.2. Regional Snapshot
- 16.3. North America A2 Milk Market Size in Value (US$ Billion), Analysis, and Forecasts, 2021-2035
- 16.3.1. Product Type
- 16.3.2. Product Form
- 16.3.3. Fat Content
- 16.3.4. Packaging Type
- 16.3.5. Price Segment
- 16.3.6. Consumer Segment
- 16.3.7. Source Origin
- 16.3.8. End User
- 16.3.9. Distribution Channel
- 16.3.10. Country
-
- 16.3.10.1.1. USA
- 16.3.10.1.2. Canada
- 16.3.10.1.3. Mexico
-
- 16.4. USA A2 Milk Market
- 16.4.1. Country Segmental Analysis
- 16.4.2. Product Type
- 16.4.3. Product Form
- 16.4.4. Fat Content
- 16.4.5. Packaging Type
- 16.4.6. Price Segment
- 16.4.7. Consumer Segment
- 16.4.8. Source Origin
- 16.4.9. End User
- 16.4.10. Distribution Channel
- 16.5. Canada A2 Milk Market
- 16.5.1. Country Segmental Analysis
- 16.5.2. Product Type
- 16.5.3. Product Form
- 16.5.4. Fat Content
- 16.5.5. Packaging Type
- 16.5.6. Price Segment
- 16.5.7. Consumer Segment
- 16.5.8. Source Origin
- 16.5.9. End User
- 16.5.10. Distribution Channel
- 16.6. Mexico A2 Milk Market
- 16.6.1. Country Segmental Analysis
- 16.6.2. Product Type
- 16.6.3. Product Form
- 16.6.4. Fat Content
- 16.6.5. Packaging Type
- 16.6.6. Price Segment
- 16.6.7. Consumer Segment
- 16.6.8. Source Origin
- 16.6.9. End User
- 16.6.10. Distribution Channel
- 17. Europe A2 Milk Market Analysis
- 17.1. Key Segment Analysis
- 17.2. Regional Snapshot
- 17.3. Europe A2 Milk Market Size in Value (US$ Billion), Analysis, and Forecasts, 2021-2035
- 17.3.1. Product Type
- 17.3.2. Product Form
- 17.3.3. Fat Content
- 17.3.4. Packaging Type
- 17.3.5. Price Segment
- 17.3.6. Consumer Segment
- 17.3.7. Source Origin
- 17.3.8. End User
- 17.3.9. Distribution Channel
- 17.3.10. Country
- 17.3.10.1. Germany
- 17.3.10.2. United Kingdom
- 17.3.10.3. France
- 17.3.10.4. Italy
- 17.3.10.5. Spain
- 17.3.10.6. Netherlands
- 17.3.10.7. Nordic Countries
- 17.3.10.8. Poland
- 17.3.10.9. Russia & CIS
- 17.3.10.10. Rest of Europe
- 17.4. Germany A2 Milk Market
- 17.4.1. Country Segmental Analysis
- 17.4.2. Product Type
- 17.4.3. Product Form
- 17.4.4. Fat Content
- 17.4.5. Packaging Type
- 17.4.6. Price Segment
- 17.4.7. Consumer Segment
- 17.4.8. Source Origin
- 17.4.9. End User
- 17.4.10. Distribution Channel
- 17.5. United Kingdom A2 Milk Market
- 17.5.1. Country Segmental Analysis
- 17.5.2. Product Type
- 17.5.3. Product Form
- 17.5.4. Fat Content
- 17.5.5. Packaging Type
- 17.5.6. Price Segment
- 17.5.7. Consumer Segment
- 17.5.8. Source Origin
- 17.5.9. End User
- 17.5.10. Distribution Channel
- 17.6. France A2 Milk Market
- 17.6.1. Country Segmental Analysis
- 17.6.2. Product Type
- 17.6.3. Product Form
- 17.6.4. Fat Content
- 17.6.5. Packaging Type
- 17.6.6. Price Segment
- 17.6.7. Consumer Segment
- 17.6.8. Source Origin
- 17.6.9. End User
- 17.6.10. Distribution Channel
- 17.7. Italy A2 Milk Market
- 17.7.1. Country Segmental Analysis
- 17.7.2. Product Type
- 17.7.3. Product Form
- 17.7.4. Fat Content
- 17.7.5. Packaging Type
- 17.7.6. Price Segment
- 17.7.7. Consumer Segment
- 17.7.8. Source Origin
- 17.7.9. End User
- 17.7.10. Distribution Channel
- 17.8. Spain A2 Milk Market
- 17.8.1. Country Segmental Analysis
- 17.8.2. Product Type
- 17.8.3. Product Form
- 17.8.4. Fat Content
- 17.8.5. Packaging Type
- 17.8.6. Price Segment
- 17.8.7. Consumer Segment
- 17.8.8. Source Origin
- 17.8.9. End User
- 17.8.10. Distribution Channel
- 17.9. Netherlands A2 Milk Market
- 17.9.1. Country Segmental Analysis
- 17.9.2. Product Type
- 17.9.3. Product Form
- 17.9.4. Fat Content
- 17.9.5. Packaging Type
- 17.9.6. Price Segment
- 17.9.7. Consumer Segment
- 17.9.8. Source Origin
- 17.9.9. End User
- 17.9.10. Distribution Channel
- 17.10. Nordic Countries A2 Milk Market
- 17.10.1. Country Segmental Analysis
- 17.10.2. Product Type
- 17.10.3. Product Form
- 17.10.4. Fat Content
- 17.10.5. Packaging Type
- 17.10.6. Price Segment
- 17.10.7. Consumer Segment
- 17.10.8. Source Origin
- 17.10.9. End User
- 17.10.10. Distribution Channel
- 17.11. Poland A2 Milk Market
- 17.11.1. Country Segmental Analysis
- 17.11.2. Product Type
- 17.11.3. Product Form
- 17.11.4. Fat Content
- 17.11.5. Packaging Type
- 17.11.6. Price Segment
- 17.11.7. Consumer Segment
- 17.11.8. Source Origin
- 17.11.9. End User
- 17.11.10. Distribution Channel
- 17.12. Russia & CIS A2 Milk Market
- 17.12.1. Country Segmental Analysis
- 17.12.2. Product Type
- 17.12.3. Product Form
- 17.12.4. Fat Content
- 17.12.5. Packaging Type
- 17.12.6. Price Segment
- 17.12.7. Consumer Segment
- 17.12.8. Source Origin
- 17.12.9. End User
- 17.12.10. Distribution Channel
- 17.13. Rest of Europe A2 Milk Market
- 17.13.1. Country Segmental Analysis
- 17.13.2. Product Type
- 17.13.3. Product Form
- 17.13.4. Fat Content
- 17.13.5. Packaging Type
- 17.13.6. Price Segment
- 17.13.7. Consumer Segment
- 17.13.8. Source Origin
- 17.13.9. End User
- 17.13.10. Distribution Channel
- 18. Asia Pacific A2 Milk Market Analysis
- 18.1. Key Segment Analysis
- 18.2. Regional Snapshot
- 18.3. East Asia A2 Milk Market Size in Value (US$ Billion), and Forecasts, 2021-2035
- 18.3.1. Product Type
- 18.3.2. Product Form
- 18.3.3. Fat Content
- 18.3.4. Packaging Type
- 18.3.5. Price Segment
- 18.3.6. Consumer Segment
- 18.3.7. Source Origin
- 18.3.8. End User
- 18.3.9. Distribution Channel
- 18.3.10. Country
- 18.3.10.1. China
- 18.3.10.2. India
- 18.3.10.3. Japan
- 18.3.10.4. South Korea
- 18.3.10.5. Australia and New Zealand
- 18.3.10.6. Indonesia
- 18.3.10.7. Malaysia
- 18.3.10.8. Thailand
- 18.3.10.9. Vietnam
- 18.3.10.10. Rest of Asia Pacific
- 18.4. China A2 Milk Market
- 18.4.1. Country Segmental Analysis
- 18.4.2. Product Type
- 18.4.3. Product Form
- 18.4.4. Fat Content
- 18.4.5. Packaging Type
- 18.4.6. Price Segment
- 18.4.7. Consumer Segment
- 18.4.8. Source Origin
- 18.4.9. End User
- 18.4.10. Distribution Channel
- 18.5. India A2 Milk Market
- 18.5.1. Country Segmental Analysis
- 18.5.2. Product Type
- 18.5.3. Product Form
- 18.5.4. Fat Content
- 18.5.5. Packaging Type
- 18.5.6. Price Segment
- 18.5.7. Consumer Segment
- 18.5.8. Source Origin
- 18.5.9. End User
- 18.5.10. Distribution Channel
- 18.6. Japan A2 Milk Market
- 18.6.1. Country Segmental Analysis
- 18.6.2. Product Type
- 18.6.3. Product Form
- 18.6.4. Fat Content
- 18.6.5. Packaging Type
- 18.6.6. Price Segment
- 18.6.7. Consumer Segment
- 18.6.8. Source Origin
- 18.6.9. End User
- 18.6.10. Distribution Channel
- 18.7. South Korea A2 Milk Market
- 18.7.1. Country Segmental Analysis
- 18.7.2. Product Type
- 18.7.3. Product Form
- 18.7.4. Fat Content
- 18.7.5. Packaging Type
- 18.7.6. Price Segment
- 18.7.7. Consumer Segment
- 18.7.8. Source Origin
- 18.7.9. End User
- 18.7.10. Distribution Channel
- 18.8. Australia and New Zealand A2 Milk Market
- 18.8.1. Country Segmental Analysis
- 18.8.2. Product Type
- 18.8.3. Product Form
- 18.8.4. Fat Content
- 18.8.5. Packaging Type
- 18.8.6. Price Segment
- 18.8.7. Consumer Segment
- 18.8.8. Source Origin
- 18.8.9. End User
- 18.8.10. Distribution Channel
- 18.9. Indonesia A2 Milk Market
- 18.9.1. Country Segmental Analysis
- 18.9.2. Product Type
- 18.9.3. Product Form
- 18.9.4. Fat Content
- 18.9.5. Packaging Type
- 18.9.6. Price Segment
- 18.9.7. Consumer Segment
- 18.9.8. Source Origin
- 18.9.9. End User
- 18.9.10. Distribution Channel
- 18.10. Malaysia A2 Milk Market
- 18.10.1. Country Segmental Analysis
- 18.10.2. Product Type
- 18.10.3. Product Form
- 18.10.4. Fat Content
- 18.10.5. Packaging Type
- 18.10.6. Price Segment
- 18.10.7. Consumer Segment
- 18.10.8. Source Origin
- 18.10.9. End User
- 18.10.10. Distribution Channel
- 18.11. Thailand A2 Milk Market
- 18.11.1. Country Segmental Analysis
- 18.11.2. Product Type
- 18.11.3. Product Form
- 18.11.4. Fat Content
- 18.11.5. Packaging Type
- 18.11.6. Price Segment
- 18.11.7. Consumer Segment
- 18.11.8. Source Origin
- 18.11.9. End User
- 18.11.10. Distribution Channel
- 18.12. Vietnam A2 Milk Market
- 18.12.1. Country Segmental Analysis
- 18.12.2. Product Type
- 18.12.3. Product Form
- 18.12.4. Fat Content
- 18.12.5. Packaging Type
- 18.12.6. Price Segment
- 18.12.7. Consumer Segment
- 18.12.8. Source Origin
- 18.12.9. End User
- 18.12.10. Distribution Channel
- 18.13. Rest of Asia Pacific A2 Milk Market
- 18.13.1. Country Segmental Analysis
- 18.13.2. Product Type
- 18.13.3. Product Form
- 18.13.4. Fat Content
- 18.13.5. Packaging Type
- 18.13.6. Price Segment
- 18.13.7. Consumer Segment
- 18.13.8. Source Origin
- 18.13.9. End User
- 18.13.10. Distribution Channel
- 19. Middle East A2 Milk Market Analysis
- 19.1. Key Segment Analysis
- 19.2. Regional Snapshot
- 19.3. Middle East A2 Milk Market Size in Value (US$ Billion), Analysis, and Forecasts, 2021-2035
- 19.3.1. Product Type
- 19.3.2. Product Form
- 19.3.3. Fat Content
- 19.3.4. Packaging Type
- 19.3.5. Price Segment
- 19.3.6. Consumer Segment
- 19.3.7. Source Origin
- 19.3.8. End User
- 19.3.9. Distribution Channel
- 19.3.10. Country
- 19.3.10.1. Turkey
- 19.3.10.2. UAE
- 19.3.10.3. Saudi Arabia
- 19.3.10.4. Israel
- 19.3.10.5. Rest of Middle East
- 19.4. Turkey A2 Milk Market
- 19.4.1. Country Segmental Analysis
- 19.4.2. Product Type
- 19.4.3. Product Form
- 19.4.4. Fat Content
- 19.4.5. Packaging Type
- 19.4.6. Price Segment
- 19.4.7. Consumer Segment
- 19.4.8. Source Origin
- 19.4.9. End User
- 19.4.10. Distribution Channel
- 19.5. UAE A2 Milk Market
- 19.5.1. Country Segmental Analysis
- 19.5.2. Product Type
- 19.5.3. Product Form
- 19.5.4. Fat Content
- 19.5.5. Packaging Type
- 19.5.6. Price Segment
- 19.5.7. Consumer Segment
- 19.5.8. Source Origin
- 19.5.9. End User
- 19.5.10. Distribution Channel
- 19.6. Saudi Arabia A2 Milk Market
- 19.6.1. Country Segmental Analysis
- 19.6.2. Product Type
- 19.6.3. Product Form
- 19.6.4. Fat Content
- 19.6.5. Packaging Type
- 19.6.6. Price Segment
- 19.6.7. Consumer Segment
- 19.6.8. Source Origin
- 19.6.9. End User
- 19.6.10. Distribution Channel
- 19.7. Israel A2 Milk Market
- 19.7.1. Country Segmental Analysis
- 19.7.2. Product Type
- 19.7.3. Product Form
- 19.7.4. Fat Content
- 19.7.5. Packaging Type
- 19.7.6. Price Segment
- 19.7.7. Consumer Segment
- 19.7.8. Source Origin
- 19.7.9. End User
- 19.7.10. Distribution Channel
- 19.8. Rest of Middle East A2 Milk Market
- 19.8.1. Country Segmental Analysis
- 19.8.2. Product Type
- 19.8.3. Product Form
- 19.8.4. Fat Content
- 19.8.5. Packaging Type
- 19.8.6. Price Segment
- 19.8.7. Consumer Segment
- 19.8.8. Source Origin
- 19.8.9. End User
- 19.8.10. Distribution Channel
- 20. Africa A2 Milk Market Analysis
- 20.1. Key Segment Analysis
- 20.2. Regional Snapshot
- 20.3. Africa A2 Milk Market Size in Value (US$ Billion), Analysis, and Forecasts, 2021-2035
- 20.3.1. Product Type
- 20.3.2. Product Form
- 20.3.3. Fat Content
- 20.3.4. Packaging Type
- 20.3.5. Price Segment
- 20.3.6. Consumer Segment
- 20.3.7. Source Origin
- 20.3.8. End User
- 20.3.9. Distribution Channel
- 20.3.10. Country
- 20.3.10.1. South Africa
- 20.3.10.2. Egypt
- 20.3.10.3. Nigeria
- 20.3.10.4. Algeria
- 20.3.10.5. Rest of Africa
- 20.4. South Africa A2 Milk Market
- 20.4.1. Country Segmental Analysis
- 20.4.2. Product Type
- 20.4.3. Product Form
- 20.4.4. Fat Content
- 20.4.5. Packaging Type
- 20.4.6. Price Segment
- 20.4.7. Consumer Segment
- 20.4.8. Source Origin
- 20.4.9. End User
- 20.4.10. Distribution Channel
- 20.5. Egypt A2 Milk Market
- 20.5.1. Country Segmental Analysis
- 20.5.2. Product Type
- 20.5.3. Product Form
- 20.5.4. Fat Content
- 20.5.5. Packaging Type
- 20.5.6. Price Segment
- 20.5.7. Consumer Segment
- 20.5.8. Source Origin
- 20.5.9. End User
- 20.5.10. Distribution Channel
- 20.6. Nigeria A2 Milk Market
- 20.6.1. Country Segmental Analysis
- 20.6.2. Product Type
- 20.6.3. Product Form
- 20.6.4. Fat Content
- 20.6.5. Packaging Type
- 20.6.6. Price Segment
- 20.6.7. Consumer Segment
- 20.6.8. Source Origin
- 20.6.9. End User
- 20.6.10. Distribution Channel
- 20.7. Algeria A2 Milk Market
- 20.7.1. Country Segmental Analysis
- 20.7.2. Product Type
- 20.7.3. Product Form
- 20.7.4. Fat Content
- 20.7.5. Packaging Type
- 20.7.6. Price Segment
- 20.7.7. Consumer Segment
- 20.7.8. Source Origin
- 20.7.9. End User
- 20.7.10. Distribution Channel
- 20.8. Rest of Africa A2 Milk Market
- 20.8.1. Country Segmental Analysis
- 20.8.2. Product Type
- 20.8.3. Product Form
- 20.8.4. Fat Content
- 20.8.5. Packaging Type
- 20.8.6. Price Segment
- 20.8.7. Consumer Segment
- 20.8.8. Source Origin
- 20.8.9. End User
- 20.8.10. Distribution Channel
- 21. South America A2 Milk Market Analysis
- 21.1. Key Segment Analysis
- 21.2. Regional Snapshot
- 21.3. Central and South Africa A2 Milk Market Size in Value (US$ Billion), Analysis, and Forecasts, 2021-2035
- 21.3.1. Product Type
- 21.3.2. Product Form
- 21.3.3. Fat Content
- 21.3.4. Packaging Type
- 21.3.5. Price Segment
- 21.3.6. Consumer Segment
- 21.3.7. Source Origin
- 21.3.8. End User
- 21.3.9. Distribution Channel
- 21.3.10. Country
- 21.3.10.1. Brazil
- 21.3.10.2. Argentina
- 21.3.10.3. Rest of South America
- 21.4. Brazil A2 Milk Market
- 21.4.1. Country Segmental Analysis
- 21.4.2. Product Type
- 21.4.3. Product Form
- 21.4.4. Fat Content
- 21.4.5. Packaging Type
- 21.4.6. Price Segment
- 21.4.7. Consumer Segment
- 21.4.8. Source Origin
- 21.4.9. End User
- 21.4.10. Distribution Channel
- 21.5. Argentina A2 Milk Market
- 21.5.1. Country Segmental Analysis
- 21.5.2. Product Type
- 21.5.3. Product Form
- 21.5.4. Fat Content
- 21.5.5. Packaging Type
- 21.5.6. Price Segment
- 21.5.7. Consumer Segment
- 21.5.8. Source Origin
- 21.5.9. End User
- 21.5.10. Distribution Channel
- 21.6. Rest of South America A2 Milk Market
- 21.6.1. Country Segmental Analysis
- 21.6.2. Product Type
- 21.6.3. Product Form
- 21.6.4. Fat Content
- 21.6.5. Packaging Type
- 21.6.6. Price Segment
- 21.6.7. Consumer Segment
- 21.6.8. Source Origin
- 21.6.9. End User
- 21.6.10. Distribution Channel
- 22. Key Players/ Company Profile
- 22.1. Amul (Gujarat Cooperative Milk Marketing Federation)
- 22.1.1. Company Details/ Overview
- 22.1.2. Company Financials
- 22.1.3. Key Customers and Competitors
- 22.1.4. Business/ Industry Portfolio
- 22.1.5. Product Portfolio/ Specification Details
- 22.1.6. Pricing Data
- 22.1.7. Strategic Overview
- 22.1.8. Recent Developments
- 22.2. Arla Foods
- 22.3. Australian Dairy Farms Company
- 22.4. Bellamy’s Organic (China Mengniu Dairy)
- 22.5. Bubs Australia Pty Ltd
- 22.6. Danone S.A.
- 22.7. Devondale Murray Goulburn
- 22.8. Fonterra Co-operative Group
- 22.9. FrieslandCampina
- 22.10. Good Health Natural Products
- 22.11. Lactalis Group
- 22.12. Meiji Holdings Co., Ltd.
- 22.13. Murray Goulburn Co-operative Co.
- 22.14. Murray River Organics
- 22.15. Nestlé S.A.
- 22.16. Saputo Inc.
- 22.17. The a2 Milk Company
- 22.18. Tropicana Dairy Products Ltd.
- 22.19. Valio Ltd.
- 22.20. Yili Group
- 22.21. Other key Players
- 22.1. Amul (Gujarat Cooperative Milk Marketing Federation)
Note* - This is just tentative list of players. While providing the report, we will cover more number of players based on their revenue and share for each geography.
Research Design
Our research design integrates both demand-side and supply-side analysis through a balanced combination of primary and secondary research methodologies. By utilizing both bottom-up and top-down approaches alongside rigorous data triangulation methods, we deliver robust market intelligence that supports strategic decision-making.
MarketGenics' comprehensive research design framework ensures the delivery of accurate, reliable, and actionable market intelligence. Through the integration of multiple research approaches, rigorous validation processes, and expert analysis, we provide our clients with the insights needed to make informed strategic decisions and capitalize on market opportunities.

MarketGenics leverages a dedicated industry panel of experts and a comprehensive suite of paid databases to effectively collect, consolidate, and analyze market intelligence.
Our approach has consistently proven to be reliable and effective in generating accurate market insights, identifying key industry trends, and uncovering emerging business opportunities.
Through both primary and secondary research, we capture and analyze critical company-level data such as manufacturing footprints, including technical centers, R&D facilities, sales offices, and headquarters.
Our expert panel further enhances our ability to estimate market size for specific brands based on validated field-level intelligence.
Our data mining techniques incorporate both parametric and non-parametric methods, allowing for structured data collection, sorting, processing, and cleaning.
Demand projections are derived from large-scale data sets analyzed through proprietary algorithms, culminating in robust and reliable market sizing.
Research Approach
The bottom-up approach builds market estimates by starting with the smallest addressable market units and systematically aggregating them to create comprehensive market size projections.
This method begins with specific, granular data points and builds upward to create the complete market landscape.
Customer Analysis → Segmental Analysis → Geographical Analysis
The top-down approach starts with the broadest possible market data and systematically narrows it down through a series of filters and assumptions to arrive at specific market segments or opportunities.
This method begins with the big picture and works downward to increasingly specific market slices.
TAM → SAM → SOM


Research Methods
Desk / Secondary Research
While analysing the market, we extensively study secondary sources, directories, and databases to identify and collect information useful for this technical, market-oriented, and commercial report. Secondary sources that we utilize are not only the public sources, but it is a combination of Open Source, Associations, Paid Databases, MG Repository & Knowledgebase, and others.
- Company websites, annual reports, financial reports, broker reports, and investor presentations
- National government documents, statistical databases and reports
- News articles, press releases and web-casts specific to the companies operating in the market, Magazines, reports, and others
- We gather information from commercial data sources for deriving company specific data such as segmental revenue, share for geography, product revenue, and others
- Internal and external proprietary databases (industry-specific), relevant patent, and regulatory databases
- Governing Bodies, Government Organizations
- Relevant Authorities, Country-specific Associations for Industries
We also employ the model mapping approach to estimate the product level market data through the players' product portfolio
Primary Research
Primary research/ interviews is vital in analyzing the market. Most of the cases involves paid primary interviews. Primary sources include primary interviews through e-mail interactions, telephonic interviews, surveys as well as face-to-face interviews with the different stakeholders across the value chain including several industry experts.
| Type of Respondents | Number of Primaries |
|---|---|
| Tier 2/3 Suppliers | ~20 |
| Tier 1 Suppliers | ~25 |
| End-users | ~25 |
| Industry Expert/ Panel/ Consultant | ~30 |
| Total | ~100 |
MG Knowledgebase
• Repository of industry blog, newsletter and case studies
• Online platform covering detailed market reports, and company profiles
Forecasting Factors and Models
Forecasting Factors
- Historical Trends – Past market patterns, cycles, and major events that shaped how markets behave over time. Understanding past trends helps predict future behavior.
- Industry Factors – Specific characteristics of the industry like structure, regulations, and innovation cycles that affect market dynamics.
- Macroeconomic Factors – Economic conditions like GDP growth, inflation, and employment rates that affect how much money people have to spend.
- Demographic Factors – Population characteristics like age, income, and location that determine who can buy your product.
- Technology Factors – How quickly people adopt new technology and how much technology infrastructure exists.
- Regulatory Factors – Government rules, laws, and policies that can help or restrict market growth.
- Competitive Factors – Analyzing competition structure such as degree of competition and bargaining power of buyers and suppliers.
Forecasting Models / Techniques
Multiple Regression Analysis
- Identify and quantify factors that drive market changes
- Statistical modeling to establish relationships between market drivers and outcomes
Time Series Analysis – Seasonal Patterns
- Understand regular cyclical patterns in market demand
- Advanced statistical techniques to separate trend, seasonal, and irregular components
Time Series Analysis – Trend Analysis
- Identify underlying market growth patterns and momentum
- Statistical analysis of historical data to project future trends
Expert Opinion – Expert Interviews
- Gather deep industry insights and contextual understanding
- In-depth interviews with key industry stakeholders
Multi-Scenario Development
- Prepare for uncertainty by modeling different possible futures
- Creating optimistic, pessimistic, and most likely scenarios
Time Series Analysis – Moving Averages
- Sophisticated forecasting for complex time series data
- Auto-regressive integrated moving average models with seasonal components
Econometric Models
- Apply economic theory to market forecasting
- Sophisticated economic models that account for market interactions
Expert Opinion – Delphi Method
- Harness collective wisdom of industry experts
- Structured, multi-round expert consultation process
Monte Carlo Simulation
- Quantify uncertainty and probability distributions
- Thousands of simulations with varying input parameters
Research Analysis
Our research framework is built upon the fundamental principle of validating market intelligence from both demand and supply perspectives. This dual-sided approach ensures comprehensive market understanding and reduces the risk of single-source bias.
Demand-Side Analysis: We understand end-user/application behavior, preferences, and market needs along with the penetration of the product for specific application.
Supply-Side Analysis: We estimate overall market revenue, analyze the segmental share along with industry capacity, competitive landscape, and market structure.
Validation & Evaluation
Data triangulation is a validation technique that uses multiple methods, sources, or perspectives to examine the same research question, thereby increasing the credibility and reliability of research findings. In market research, triangulation serves as a quality assurance mechanism that helps identify and minimize bias, validate assumptions, and ensure accuracy in market estimates.
- Data Source Triangulation – Using multiple data sources to examine the same phenomenon
- Methodological Triangulation – Using multiple research methods to study the same research question
- Investigator Triangulation – Using multiple researchers or analysts to examine the same data
- Theoretical Triangulation – Using multiple theoretical perspectives to interpret the same data

Custom Market Research Services
We will customise the research for you, in case the report listed above does not meet your requirements.
Get 10% Free Customisation