Aerosol Cans Market Size, Share, Growth Opportunity Analysis Report by Can Type (Necked-in cans, Shaped cans, Straight wall cans, Bag-on-valve (BOV) cans, Others), Material, Product, Propellant, Aerosol Mechanism, Device, Node Size, End-user Industry, and Geography (North America, Europe, Asia Pacific, Middle East, Africa, and South America) – Global Industry Data, Trends, and Forecasts, 2025–2035
|
|
|
Segmental Data Insights |
|
|
Demand Trends |
|
|
Competitive Landscape |
|
|
Strategic Development |
|
|
Future Outlook & Opportunities |
|
Aerosol Cans Market Size, Share, and Growth
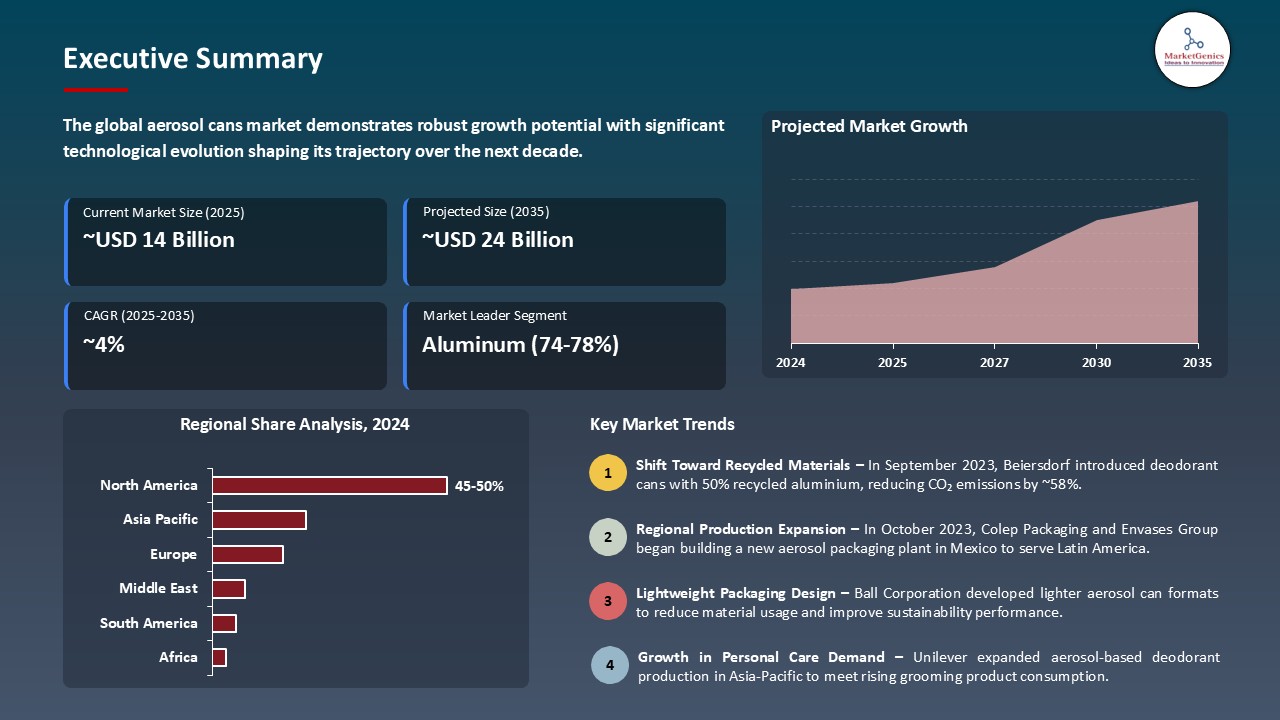
The global aerosol cans market is projected to grow from USD 14.4 Billion in 2025 to USD 24.0 Billion by 2035, with a strong CAGR of 4.7% during the forecast period. Increasing consumer interest in personal care, household, healthcare and automotive applications on account of convenience, portability and controlled dispensing features is one of the factors driving demand for Aerosol Cans. This momentum is also being driven by innovation focused on sustainability.
"Next-generation aerosol can technologies are reshaping product delivery by combining sustainability, design innovation, and functional performance. Lightweight aluminum formats, recyclable propellant systems, and barrier technologies are enabling brands to reduce environmental impact without compromising product integrity. As consumer demand shifts toward eco-friendly packaging, these advancements are becoming essential for meeting the evolving expectations in personal care, home care, and pharmaceutical applications."
For instance, Ball Corporation, acquired Tubex Industria E Comercio de Embalagens Ltda., in Brazil significantly expanding its manufacturing footprint and market engagement in South America. Additionally, the company has invested significantly in environmentally-friendly innovations, including its low-carbon aluminium Aerosol Cans produced with recycled metal as well as lighter cans produced using ReAl. This resulted lifting Ball's brand reputation, with higher sales volumes and market share.
These innovations enable brands to provide a more sustainable, eco-friendly and efficient aerosol solution that meets the evolving needs of environmentally-minded consumers.
Aerosol Cans Market Dynamics and Trends
Driver: Rising demand for sustainable and recyclable packaging in FMCG
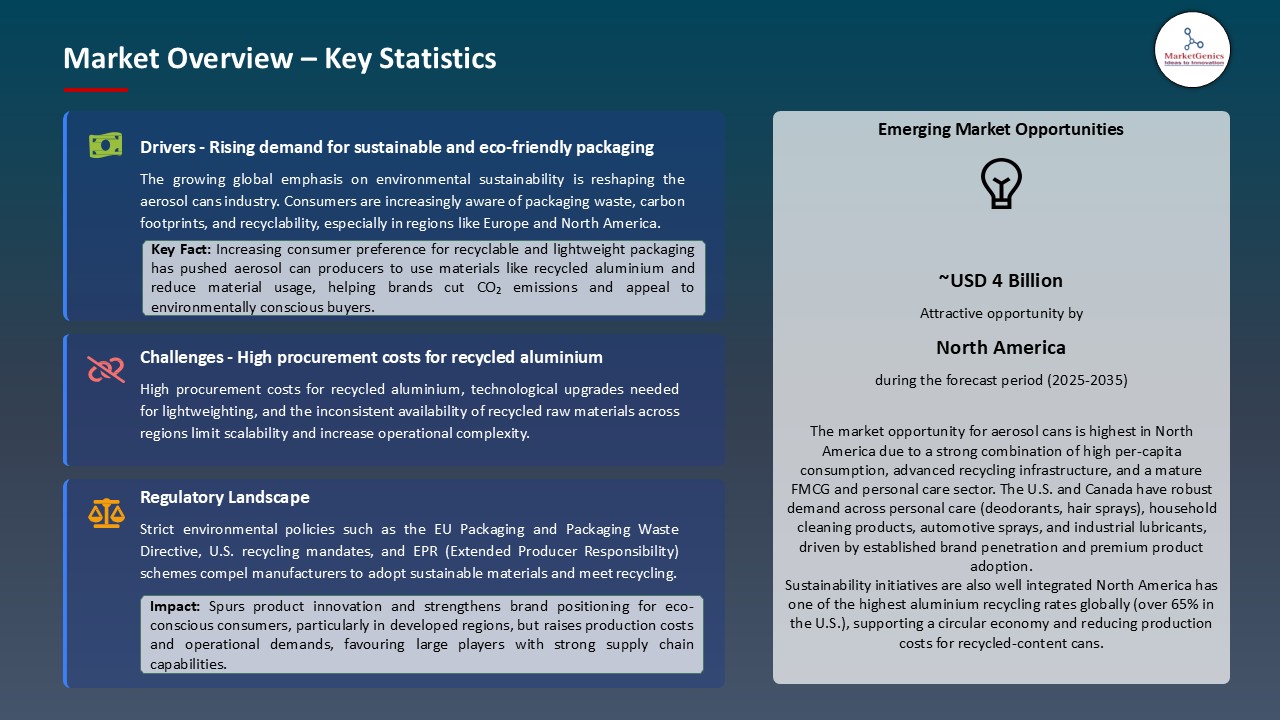
- The global push toward environmental sustainability is significantly driving the adoption of lightweight and recyclable Aerosol Cans. Large FMCG brands across personal care, home care and food categories are moving to aluminium and steel cans with high recycled content to meet corporate ESG objectives.
- For Instance, the global FMCG market leaders such as Unilever and P&G have aimed high, each committing to 100 % sustainable packaging, focusing on full recyclability and much higher levels of recycled content. This dedication often means an adoption of materials such as infinitely-reclaimable-without-compromise aluminium for their aerosols.
Driver: Innovation in dispensing technologies and safety standards
- Innovation in can design BoV, compressed gas and non-leaking valves are benefiting product safety, accurate dosing and shelf life. These developments address changing requirements in pharmaceuticals, medical devices and food-grade applications.
- For Instance, Plastipak Packaging, Introduced Spray PET Revolution, a 100% polymer aerosol which is fully recyclable thanks to its pioneering polymer valve which has been accepted to recycle on Eupropean and USA recycling platforms. This eliminates metal parts altogether, so the whole pack can be recycled in standard PET streams.
Restraint: High production costs and regulatory complexities
- Despite growing interest in sustainable aerosol packaging, the cost of manufacturing high-end aluminium and steel cans, such as those with low-GWP (global warming potential) propellants, multilayer coatings or bag-on-valve technology, is a major barrier. Specialized materials and safety‐certified filling lines raise the cost of capital investment, particularly for the small‐ and medium‐scale producers.
- For instance, setting up a compliant, high-speed aerosol can line with VOC and flammability controls can represent millions of dollars in capital expense and dictates by country-specific guidelines. These barriers restrict mass dissemination and development, and thus there is a need for economically viable production models and standardized safety regulations to encourage more market participation.
Opportunity: Expansion into Food Safety and Healthcare Applications
- Advancements in aerosol deliver systems are creating new opportunities for growth in food preservation products, pharmaceutical delivery and medical device applications. In these zones accurate dosing of the products has to be assured, long shelf life, and the use without risk of contamination.
- For Instance, in 2024, Amcor Limited Launched a recyclable nano enabled film designed to help dairy products last longer. This innovation has inherent good barrier to moisture, oxygen and freezer burn to fuel food preservation, and lower waste due to discoloration, off-flavour, freezer burn and spoilage. Their activities in active and intelligent packaging, such as including oxygen scavengers or freshness sensors, also help to ensure food safety throughout the entirety of the chain.
- In the medical industry, aerosol technology is growingly employed involving specific drug delivery systems and also in sterile applications such as for wound care sprays, pain relief, respiratory therapy etc. Bag-on-valve (BoV) solutions enable sterile, 360° dispensing and are well suited for delicate healthcare applications.
Key Trend: Shift Toward Sustainable and Smart Aerosol Packaging
- There is an increasing demand for environmentally-friendly products and intelligent dispensing systems in the aerosol packaging because of the regulations and policies besides requirements of consumer and more demanding environmental conditions. This transition involves incorporating low-GWP propellants, 100% recyclable aluminum cans, as well as digital traceability features such as QR-coded usage instructions, or authentication tags. These initiatives are improving the product transparency, user participation, and the environmental compliance.
- For instance, Hydrokem, developing smart aerosols with micro-sensors, dose counters, and RFID/Bluetooth features. Such developments support accurate product dosing, user interaction and provide accurate delivery in pharma, increasing user satisfaction and minimizing waste.
Aerosol Cans Market Analysis and Segmental Data
Aluminium holds majority share in Aerosol Cans Market
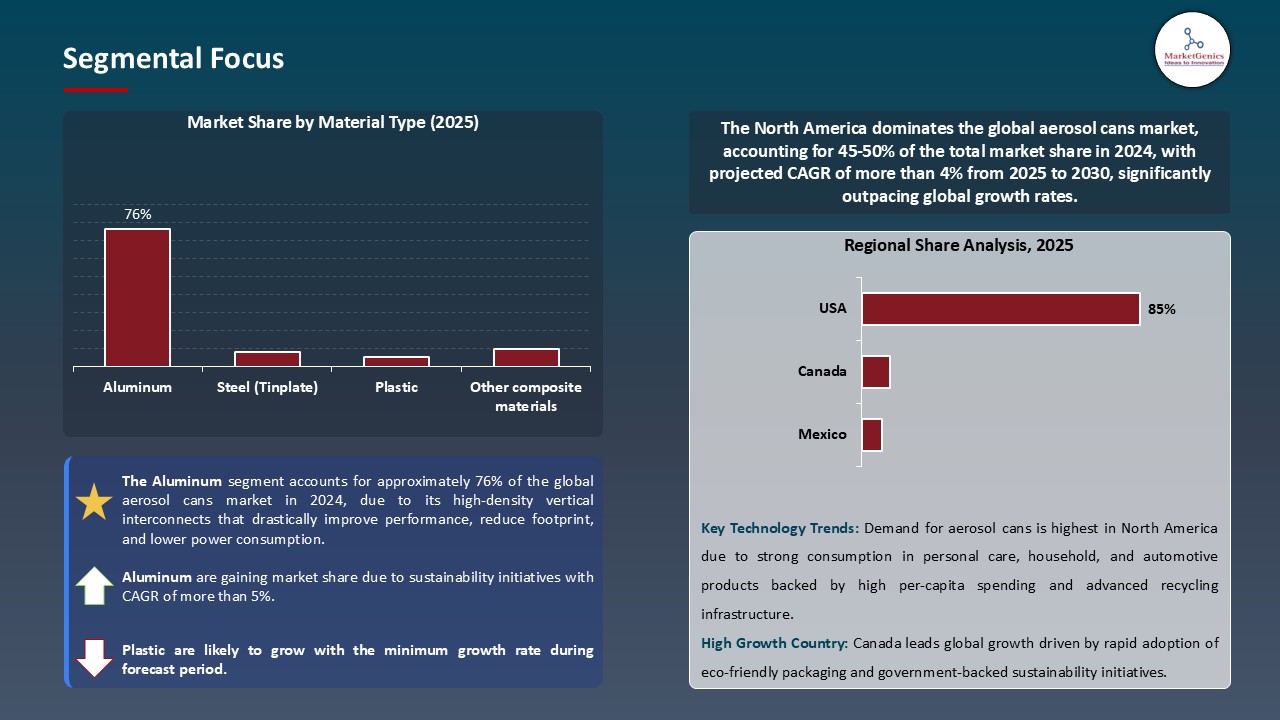
- Aluminium holds ~76% share in the aerosol cans market, owing to its high-density vertical interconnects that drastically improve performance, reduce footprint, and lower power consumption. These properties make it well-suited for high-volume uses in personal care, food and pharmaceuticals, where toasting durability, safety and sustainability are crucial.
- For instance, in March 2022, Ardagh released an aerosol can recycled aluminium in response to increased demand for sustainable packaging due to its lightweight, barrier strength, and infinite recyclability. These advancements help meet regulatory requirements, build brand equity or achieve environmental objective, making aluminium the material of choice until 2035 for both cost-effective and high performing packaging.
- Steel and alternative materials are emerging in specific segments but the overall industry is still dominated by aluminium, driven by its ability to offer new forms shapes, strong consumer appeal and closed-loop material recycling, supporting its role as the leader in the ecosystem of aerosol packaging.
North America Dominates Aerosol Cans Market in 2024 and Beyond
- North America is the largest regional market holding the share of ~47%, driven by strong demand across personal care, household, and healthcare sectors. Regional companies like such as Ball Corporation and Crown Holdings remain invested in the development of cutting-edge aluminium aerosol manufacturing as well as low-GWP propellant technologies that comply with a changing regulatory and brand sustainability agenda.
- Government policies driving circular economy best practices and investment into domestic production, it is strengthening further North America’s leadership. For Instance, Crown Holdings announced desire to completing major capacity expansion projects in North America for several metal packaging product categories, including Aerosol Cans and ends. These investments are supported by strong end-use market demand in personal care, household products and industrial applications in the region, as evidenced by robust demand and higher shipments for their metal packaging in North America.
Aerosol Cans Market Ecosystem
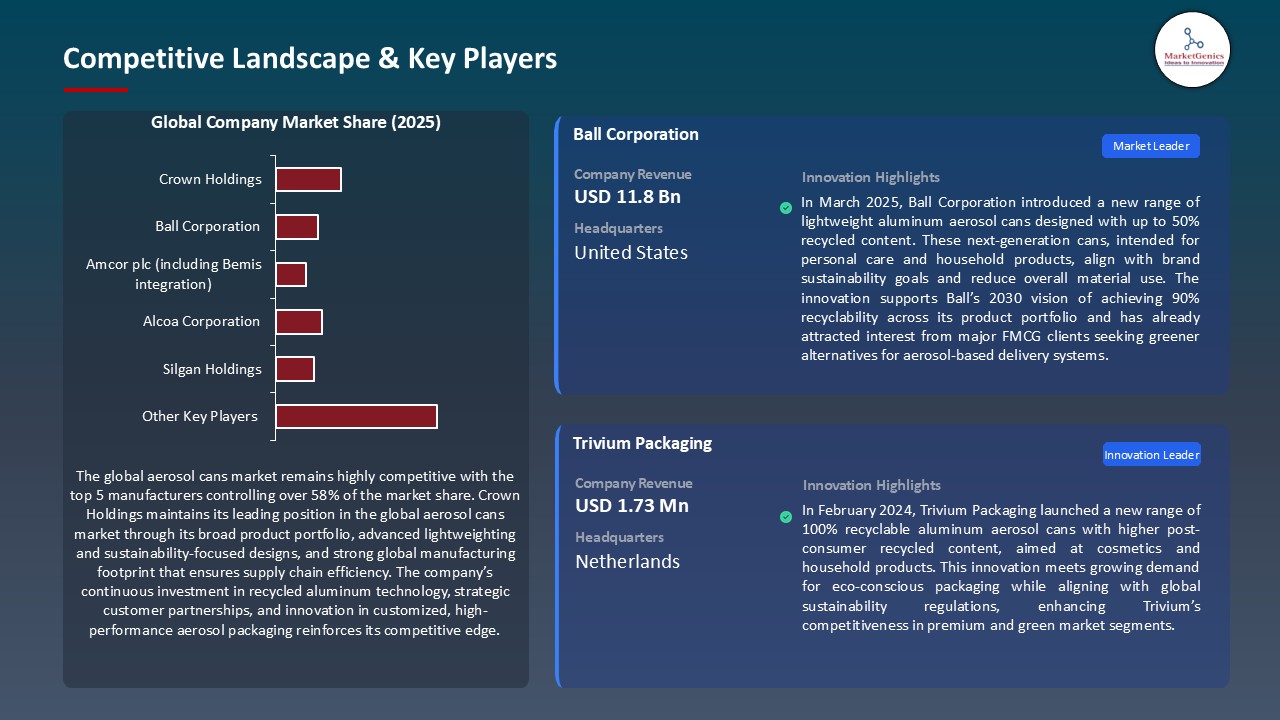
Key players in the global aerosol cans market include prominent companies such as Crown Holdings, Ball Corporation, Amcor plc (including Bemis integration), Alcoa Corporation, Silgan Holdings and Other Key Players.
The global aerosol cans market is moderately fragmented, with a medium to low concentration of key players across Tier 1 (e.g., Ball Corporation, Amcor plc, Crown Holdings), Tier 2 (e.g., Silgan Holdings, Can-Pack S.A., Constantia Flexibles), and Tier 3 firms (e.g., Arctic Can, Mylani Metal Cans). This ecosystem is characterized by diverse regional footprints and production capacities. Porter’s Five Forces analysis highlights moderate to high buyer power, due to multiple packaging alternatives, and moderate supplier power, given the dependence on raw materials like aluminum and steel, yet offset by global sourcing options.
Recent Developments and Strategic Overview
- In September 2023, Beiersdorf, the parent company of NIVEA, 8X4, and Hidrofugal, announced that all deodorant cans in their European assortment would contain at least 50% recycled aluminium and weigh 11.6% less. This action cut CO₂ emissions by approximately 58% for these materials. It obviously boosted Beiersdorf’s sustainability credentials, brand affinity and ability to compete in the eco-aware market.
- In October 2023, Colep Packaging and Envases Group signed a joint venture agreement to construct a new aerosol packaging plant in Mexico. The plant will have three production lines producing for Latin America. This expansion increases production capabilities, reduces transportation costs, and now positions both companies to gain additional market share across the region.
- In 2023, Alternative Packaging Solutions (APS) developed launched “twistMist” a reusable propellant-free aerosol system which received the U.S. Plastics Pact Sustainable Packaging Innovation Award. The system reduces CO₂ emissions up to 90% and no longer requires pressurized metal cans. It unlocks new business opportunities for sustainability-led brands looking for original and refilling packaging solutions.
Report Scope
|
Detail |
|
|
Market Size in 2025 |
USD 14.4 Bn |
|
Market Forecast Value in 2035 |
USD 24.0 Bn |
|
Growth Rate (CAGR) |
4.7% |
|
Forecast Period |
2025 – 2035 |
|
Historical Data Available for |
2021 – 2024 |
|
Market Size Units |
US$ Billion for Value Million Units for Volume |
|
Report Format |
Electronic (PDF) + Excel |
|
North America |
Europe |
Asia Pacific |
Middle East |
Africa |
South America |
|
|
|
|
|
|
|
Companies Covered |
|||||
|
|
|
|
|
|
Aerosol Cans Market Segmentation and Highlights
|
Segment |
Sub-segment |
|
By Can Type |
|
|
By Material
|
|
|
By Product Capacity
|
|
|
By Propellant Type |
|
|
By Aerosol Mechanism
|
|
|
By Distribution |
|
|
By End-User Industry |
|
Frequently Asked Questions
Table of Contents
- 1. Research Methodology and Assumptions
- 1.1. Definitions
- 1.2. Research Design and Approach
- 1.3. Data Collection Methods
- 1.4. Base Estimates and Calculations
- 1.5. Forecasting Models
- 1.5.1. Key Forecast Factors & Impact Analysis
- 1.6. Secondary Research
- 1.6.1. Open Sources
- 1.6.2. Paid Databases
- 1.6.3. Associations
- 1.7. Primary Research
- 1.7.1. Primary Sources
- 1.7.2. Primary Interviews with Stakeholders across Ecosystem
- 2. Executive Summary
- 2.1. Aerosol Cans Market Outlook
- 2.1.1. Aerosol Cans Market Size in Volume (Million Units) & Value (US$ Billion), and Forecasts, 2021-2035
- 2.1.2. Compounded Annual Growth Rate Analysis
- 2.1.3. Growth Opportunity Analysis
- 2.1.4. Segmental Share Analysis
- 2.1.5. Geographical Share Analysis
- 2.2. Market Analysis and Facts
- 2.3. Supply-Demand Analysis
- 2.4. Competitive Benchmarking
- 2.5. Go-to- Market Strategy
- 2.5.1. Customer/ End-use Industry Assessment
- 2.5.2. Growth Opportunity Data, 2025-2035
- 2.5.2.1. Regional Data
- 2.5.2.2. Country Data
- 2.5.2.3. Segmental Data
- 2.5.3. Identification of Potential Market Spaces
- 2.5.4. GAP Analysis
- 2.5.5. Potential Attractive Price Points
- 2.5.6. Prevailing Market Risks & Challenges
- 2.5.7. Preferred Sales & Marketing Strategies
- 2.5.8. Key Recommendations and Analysis
- 2.5.9. A Way Forward
- 2.1. Aerosol Cans Market Outlook
- 3. Industry Data and Premium Insights
- 3.1. Global Industry Overview, 2025
- 3.1.1. Industry Ecosystem Analysis
- 3.1.2. Key Trends for Packaging Industry
- 3.1.3. Regional Distribution for Industry
- 3.2. Supplier Customer Data
- 3.3. Source Roadmap and Developments
- 3.4. Trade Analysis
- 3.4.1. Import & Export Analysis, 2025
- 3.4.2. Top Importing Countries
- 3.4.3. Top Exporting Countries
- 3.5. Trump Tariff Impact Analysis
- 3.5.1. Manufacturer
- 3.5.2. Supply Chain/Distributor
- 3.5.3. End Consumer
- 3.1. Global Industry Overview, 2025
- 4. Market Overview
- 4.1. Market Dynamics
- 4.1.1. Drivers
- 4.1.1.1. Rising demand for convenience-based and hygienic packaging is pushing growth in the aerosol cans market
- 4.1.1.2. Expansion of personal care and household product categories is driving innovation in aerosol-based delivery systems
- 4.1.2. Restraints
- 4.1.2.1. Environmental concerns over propellants and metal waste are limiting widespread adoption
- 4.1.2.2. Volatility in raw material prices, such as aluminum and steel, continues to challenge manufacturers' profit margins
- 4.1.1. Drivers
- 4.2. Key Trend Analysis
- 4.3. Regulatory Framework
- 4.3.1. Key Regulations, Norms, and Subsidies, by Key Countries
- 4.3.2. Tariffs and Standards
- 4.3.3. Impact Analysis of Regulations on the Market
- 4.4. Value Chain Analysis
- 4.4.1. Material Suppliers
- 4.4.2. Aerosol Cans Manufacturers
- 4.4.3. Wholesalers/ Distributor
- 4.4.4. End-users/ Customers
- 4.5. Cost Structure Analysis
- 4.5.1. Parameter’s Share for Cost Associated
- 4.5.2. COGP vs COGS
- 4.5.3. Profit Margin Analysis
- 4.6. Pricing Analysis
- 4.6.1. Regional Pricing Analysis
- 4.6.2. Segmental Pricing Trends
- 4.6.3. Factors Influencing Pricing
- 4.7. Porter’s Five Forces Analysis
- 4.8. PESTEL Analysis
- 4.9. Aerosol Cans Market Demand
- 4.9.1. Historical Market Size - in Volume (Million Units) & Value (US$ Billion), 2021-2024
- 4.9.2. Current and Future Market Size - in Volume (Million Units) & Value (US$ Billion), 2025–2035
- 4.9.2.1. Y-o-Y Growth Trends
- 4.9.2.2. Absolute $ Opportunity Assessment
- 4.1. Market Dynamics
- 5. Competition Landscape
- 5.1. Competition structure
- 5.1.1. Fragmented v/s consolidated
- 5.2. Company Share Analysis, 2025
- 5.2.1. Global Company Market Share
- 5.2.2. By Region
- 5.2.2.1. North America
- 5.2.2.2. Europe
- 5.2.2.3. Asia Pacific
- 5.2.2.4. Middle East
- 5.2.2.5. Africa
- 5.2.2.6. South America
- 5.3. Product Comparison Matrix
- 5.3.1. Specifications
- 5.3.2. Market Positioning
- 5.3.3. Pricing
- 5.1. Competition structure
- 6. Aerosol Cans Market Analysis, by Can Type
- 6.1. Key Segment Analysis
- 6.2. Aerosol Cans Market Size in Volume (Million Units) & Value (US$ Billion), Analysis, and Forecasts, by Can Type, 2021-2035
- 6.2.1. Necked-in cans
- 6.2.2. Shaped cans
- 6.2.3. Straight wall cans
- 6.2.4. Bag-on-valve (BOV) cans
- 6.2.5. Others
- 7. Aerosol Cans Market Analysis, by Material
- 7.1. Key Segment Analysis
- 7.2. Aerosol Cans Market Size in Volume (Million Units) & Value (US$ Billion), Analysis, and Forecasts, by Material, 2021-2035
- 7.2.1. Aluminum
- 7.2.2. Steel (Tinplate)
- 7.2.3. Plastic
- 7.2.4. Other composite materials
- 8. Aerosol Cans Market Analysis, by Product Capacity
- 8.1. Key Segment Analysis
- 8.2. Aerosol Cans Market Size in Volume (Million Units) & Value (US$ Billion), Analysis, and Forecasts, by Product Capacity, 2021-2035
- 8.2.1. Less than 100 ml
- 8.2.2. 100 ml – 250 ml
- 8.2.3. 251 ml – 500 ml
- 8.2.4. More than 500 ml
- 9. Aerosol Cans Market Analysis, by Propellant Type
- 9.1. Key Segment Analysis
- 9.2. Aerosol Cans Market Size in Volume (Million Units) & Value (US$ Billion), Analysis, and Forecasts, by Propellant Type, 2021-2035
- 9.2.1. Compressed gas
- 9.2.2. Liquefied gas
- 9.2.3. Solvent-based propellants
- 9.2.4. Eco-friendly/organic propellants
- 9.2.5. Others
- 10. Aerosol Cans Market Analysis, by Aerosol Mechanism
- 10.1. Key Segment Analysis
- 10.2. Aerosol Cans Market Size in Volume (Million Units) & Value (US$ Billion), Analysis, and Forecasts, by Aerosol Mechanism, 2021-2035
- 10.2.1. Standard aerosol valve
- 10.2.2. Bag-on-valve system
- 10.2.3. Metered dose valve
- 10.2.4. Trigger-based aerosol
- 10.2.5. Others
- 11. Aerosol Cans Market Analysis, by End Use Industry
- 11.1. Key Segment Analysis
- 11.2. Aerosol Cans Market Size in Volume (Million Units) & Value (US$ Billion), Analysis, and Forecasts, by End Use Industry, 2021-2035
- 11.2.1. Personal care (e.g., deodorants, shaving foams)
- 11.2.2. Household care (e.g., air fresheners, cleaners)
- 11.2.3. Automotive (e.g., lubricants, polishes)
- 11.2.4. Industrial (e.g., paints, sprays, adhesives)
- 11.2.5. Healthcare (e.g., disinfectants, inhalers)
- 11.2.6. Food & beverages (e.g., whipped cream, oils)
- 11.2.7. Others
- 12. Aerosol Cans Market Analysis and Forecasts, by region
- 12.1. Key Findings
- 12.2. Aerosol Cans Market Size in Volume (Million Units) & Value (US$ Billion), Analysis, and Forecasts, by Region, 2021-2035
- 12.2.1. North America
- 12.2.2. Europe
- 12.2.3. Asia Pacific
- 12.2.4. Middle East
- 12.2.5. Africa
- 12.2.6. South America
- 13. North America Aerosol Cans Market Analysis
- 13.1. Key Segment Analysis
- 13.2. Regional Snapshot
- 13.3. North America Aerosol Cans Market Size in Volume (Million Units) & Value (US$ Billion), Analysis, and Forecasts, 2021-2035
- 13.3.1. Can Type
- 13.3.2. Material
- 13.3.3. Product
- 13.3.4. Propellant
- 13.3.5. Aerosol Mechanism
- 13.3.6. End Use Industry
- 13.3.7. Distribution
- 13.3.8. Country
-
- 13.3.8.1.1. USA
- 13.3.8.1.2. Canada
- 13.3.8.1.3. Mexico
-
- 13.4. USA Aerosol Cans Market
- 13.4.1. Country Segmental Analysis
- 13.4.2. Can Type
- 13.4.3. Material
- 13.4.4. Product
- 13.4.5. Propellant
- 13.4.6. Aerosol Mechanism
- 13.4.7. End Use Industry
- 13.4.8. Distribution
- 13.5. Canada Aerosol Cans Market
- 13.5.1. Country Segmental Analysis
- 13.5.2. Can Type
- 13.5.3. Material
- 13.5.4. Product
- 13.5.5. Propellant
- 13.5.6. Aerosol Mechanism
- 13.5.7. End Use Industry
- 13.5.8. Distribution
- 13.6. Mexico Aerosol Cans Market
- 13.6.1. Country Segmental Analysis
- 13.6.2. Can Type
- 13.6.3. Material
- 13.6.4. Product
- 13.6.5. Propellant
- 13.6.6. Aerosol Mechanism
- 13.6.7. End Use Industry
- 13.6.8. Distribution
- 14. Europe Aerosol Cans Market Analysis
- 14.1. Key Segment Analysis
- 14.2. Regional Snapshot
- 14.3. Europe Aerosol Cans Market Size in Volume (Million Units) & Value (US$ Billion), Analysis, and Forecasts, 2021-2035
- 14.3.1. Can Type
- 14.3.2. Material
- 14.3.3. Product
- 14.3.4. Propellant
- 14.3.5. Aerosol Mechanism
- 14.3.6. End Use Industry
- 14.3.7. Distribution
- 14.3.8. Country
- 14.3.8.1. Germany
- 14.3.8.2. United Kingdom
- 14.3.8.3. France
- 14.3.8.4. Italy
- 14.3.8.5. Spain
- 14.3.8.6. Netherlands
- 14.3.8.7. Nordic Countries
- 14.3.8.8. Poland
- 14.3.8.9. Russia & CIS
- 14.3.8.10. Rest of Europe
- 14.4. Germany Aerosol Cans Market
- 14.4.1. Country Segmental Analysis
- 14.4.2. Can Type
- 14.4.3. Material
- 14.4.4. Product
- 14.4.5. Propellant
- 14.4.6. Aerosol Mechanism
- 14.4.7. End Use Industry
- 14.4.8. Distribution
- 14.5. United Kingdom Aerosol Cans Market
- 14.5.1. Country Segmental Analysis
- 14.5.2. Can Type
- 14.5.3. Material
- 14.5.4. Product
- 14.5.5. Propellant
- 14.5.6. Aerosol Mechanism
- 14.5.7. End Use Industry
- 14.5.8. Distribution
- 14.6. France Aerosol Cans Market
- 14.6.1. Country Segmental Analysis
- 14.6.2. Can Type
- 14.6.3. Material
- 14.6.4. Product
- 14.6.5. Propellant
- 14.6.6. Aerosol Mechanism
- 14.6.7. End Use Industry
- 14.6.8. Distribution
- 14.7. Italy Aerosol Cans Market
- 14.7.1. Country Segmental Analysis
- 14.7.2. Can Type
- 14.7.3. Material
- 14.7.4. Product
- 14.7.5. Propellant
- 14.7.6. Aerosol Mechanism
- 14.7.7. End Use Industry
- 14.7.8. Distribution
- 14.8. Spain Aerosol Cans Market
- 14.8.1. Country Segmental Analysis
- 14.8.2. Can Type
- 14.8.3. Material
- 14.8.4. Product
- 14.8.5. Propellant
- 14.8.6. Aerosol Mechanism
- 14.8.7. End Use Industry
- 14.8.8. Distribution
- 14.9. Netherlands Aerosol Cans Market
- 14.9.1. Country Segmental Analysis
- 14.9.2. Can Type
- 14.9.3. Material
- 14.9.4. Product
- 14.9.5. Propellant
- 14.9.6. Aerosol Mechanism
- 14.9.7. End Use Industry
- 14.9.8. Distribution
- 14.10. Nordic Countries Aerosol Cans Market
- 14.10.1. Country Segmental Analysis
- 14.10.2. Can Type
- 14.10.3. Material
- 14.10.4. Product
- 14.10.5. Propellant
- 14.10.6. Aerosol Mechanism
- 14.10.7. End Use Industry
- 14.10.8. Distribution
- 14.11. Poland Aerosol Cans Market
- 14.11.1. Country Segmental Analysis
- 14.11.2. Can Type
- 14.11.3. Material
- 14.11.4. Product
- 14.11.5. Propellant
- 14.11.6. Aerosol Mechanism
- 14.11.7. End Use Industry
- 14.11.8. Distribution
- 14.12. Russia & CIS Aerosol Cans Market
- 14.12.1. Country Segmental Analysis
- 14.12.2. Can Type
- 14.12.3. Material
- 14.12.4. Product
- 14.12.5. Propellant
- 14.12.6. Aerosol Mechanism
- 14.12.7. End Use Industry
- 14.12.8. Distribution
- 14.13. Rest of Europe Aerosol Cans Market
- 14.13.1. Country Segmental Analysis
- 14.13.2. Can Type
- 14.13.3. Material
- 14.13.4. Product
- 14.13.5. Propellant
- 14.13.6. Aerosol Mechanism
- 14.13.7. End Use Industry
- 14.13.8. Distribution
- 15. Asia Pacific Aerosol Cans Market Analysis
- 15.1. Key Segment Analysis
- 15.2. Regional Snapshot
- 15.3. East Asia Aerosol Cans Market Size in Volume (Million Units) & Value (US$ Billion), and Forecasts, 2021-2035
- 15.3.1. Can Type
- 15.3.2. Material
- 15.3.3. Product
- 15.3.4. Propellant
- 15.3.5. Aerosol Mechanism
- 15.3.6. End Use Industry
- 15.3.7. Distribution
- 15.3.8. Country
- 15.3.8.1. China
- 15.3.8.2. India
- 15.3.8.3. Japan
- 15.3.8.4. South Korea
- 15.3.8.5. Australia and New Zealand
- 15.3.8.6. Indonesia
- 15.3.8.7. Malaysia
- 15.3.8.8. Thailand
- 15.3.8.9. Vietnam
- 15.3.8.10. Rest of Asia Pacific
- 15.4. China Aerosol Cans Market
- 15.4.1. Country Segmental Analysis
- 15.4.2. Can Type
- 15.4.3. Material
- 15.4.4. Product
- 15.4.5. Propellant
- 15.4.6. Aerosol Mechanism
- 15.4.7. End Use Industry
- 15.4.8. Distribution
- 15.5. India Aerosol Cans Market
- 15.5.1. Country Segmental Analysis
- 15.5.2. Can Type
- 15.5.3. Material
- 15.5.4. Product
- 15.5.5. Propellant
- 15.5.6. Aerosol Mechanism
- 15.5.7. End Use Industry
- 15.5.8. Distribution
- 15.6. Japan Aerosol Cans Market
- 15.6.1. Country Segmental Analysis
- 15.6.2. Can Type
- 15.6.3. Material
- 15.6.4. Product
- 15.6.5. Propellant
- 15.6.6. Aerosol Mechanism
- 15.6.7. End Use Industry
- 15.6.8. Distribution
- 15.7. South Korea Aerosol Cans Market
- 15.7.1. Country Segmental Analysis
- 15.7.2. Can Type
- 15.7.3. Material
- 15.7.4. Product
- 15.7.5. Propellant
- 15.7.6. Aerosol Mechanism
- 15.7.7. End Use Industry
- 15.7.8. Distribution
- 15.8. Australia and New Zealand Aerosol Cans Market
- 15.8.1. Country Segmental Analysis
- 15.8.2. Can Type
- 15.8.3. Material
- 15.8.4. Product
- 15.8.5. Propellant
- 15.8.6. Aerosol Mechanism
- 15.8.7. End Use Industry
- 15.8.8. Distribution
- 15.9. Indonesia Aerosol Cans Market
- 15.9.1. Country Segmental Analysis
- 15.9.2. Can Type
- 15.9.3. Material
- 15.9.4. Product
- 15.9.5. Propellant
- 15.9.6. Aerosol Mechanism
- 15.9.7. End Use Industry
- 15.9.8. Distribution
- 15.10. Malaysia Aerosol Cans Market
- 15.10.1. Country Segmental Analysis
- 15.10.2. Can Type
- 15.10.3. Material
- 15.10.4. Product
- 15.10.5. Propellant
- 15.10.6. Aerosol Mechanism
- 15.10.7. End Use Industry
- 15.10.8. Distribution
- 15.11. Thailand Aerosol Cans Market
- 15.11.1. Country Segmental Analysis
- 15.11.2. Can Type
- 15.11.3. Material
- 15.11.4. Product
- 15.11.5. Propellant
- 15.11.6. Aerosol Mechanism
- 15.11.7. End Use Industry
- 15.11.8. Distribution
- 15.12. Vietnam Aerosol Cans Market
- 15.12.1. Country Segmental Analysis
- 15.12.2. Can Type
- 15.12.3. Material
- 15.12.4. Product
- 15.12.5. Propellant
- 15.12.6. Aerosol Mechanism
- 15.12.7. End Use Industry
- 15.12.8. Distribution
- 15.13. Rest of Asia Pacific Aerosol Cans Market
- 15.13.1. Country Segmental Analysis
- 15.13.2. Can Type
- 15.13.3. Material
- 15.13.4. Product
- 15.13.5. Propellant
- 15.13.6. Aerosol Mechanism
- 15.13.7. End Use Industry
- 15.13.8. Distribution
- 16. Middle East Aerosol Cans Market Analysis
- 16.1. Key Segment Analysis
- 16.2. Regional Snapshot
- 16.3. Middle East Aerosol Cans Market Size in Volume (Million Units) & Value (US$ Billion), Analysis, and Forecasts, 2021-2035
- 16.3.1. Can Type
- 16.3.2. Material
- 16.3.3. Product
- 16.3.4. Propellant
- 16.3.5. Aerosol Mechanism
- 16.3.6. End Use Industry
- 16.3.7. Distribution
- 16.3.8. Country
- 16.3.8.1. Turkey
- 16.3.8.2. UAE
- 16.3.8.3. Saudi Arabia
- 16.3.8.4. Israel
- 16.3.8.5. Rest of Middle East
- 16.4. Turkey Aerosol Cans Market
- 16.4.1. Country Segmental Analysis
- 16.4.2. Can Type
- 16.4.3. Material
- 16.4.4. Product
- 16.4.5. Propellant
- 16.4.6. Aerosol Mechanism
- 16.4.7. End Use Industry
- 16.4.8. Distribution
- 16.5. UAE Aerosol Cans Market
- 16.5.1. Country Segmental Analysis
- 16.5.2. Can Type
- 16.5.3. Material
- 16.5.4. Product
- 16.5.5. Propellant
- 16.5.6. Aerosol Mechanism
- 16.5.7. End Use Industry
- 16.5.8. Distribution
- 16.6. Saudi Arabia Aerosol Cans Market
- 16.6.1. Country Segmental Analysis
- 16.6.2. Can Type
- 16.6.3. Material
- 16.6.4. Product
- 16.6.5. Propellant
- 16.6.6. Aerosol Mechanism
- 16.6.7. End Use Industry
- 16.6.8. Distribution
- 16.7. Israel Aerosol Cans Market
- 16.7.1. Country Segmental Analysis
- 16.7.2. Can Type
- 16.7.3. Material
- 16.7.4. Product
- 16.7.5. Propellant
- 16.7.6. Aerosol Mechanism
- 16.7.7. End Use Industry
- 16.7.8. Distribution
- 16.8. Rest of Middle East Aerosol Cans Market
- 16.8.1. Country Segmental Analysis
- 16.8.2. Can Type
- 16.8.3. Material
- 16.8.4. Product
- 16.8.5. Propellant
- 16.8.6. Aerosol Mechanism
- 16.8.7. End Use Industry
- 16.8.8. Distribution
- 17. Africa Aerosol Cans Market Analysis
- 17.1. Key Segment Analysis
- 17.2. Regional Snapshot
- 17.3. Africa Aerosol Cans Market Size in Volume (Million Units) & Value (US$ Billion), Analysis, and Forecasts, 2021-2035
- 17.3.1. Can Type
- 17.3.2. Material
- 17.3.3. Product
- 17.3.4. Propellant
- 17.3.5. Aerosol Mechanism
- 17.3.6. End Use Industry
- 17.3.7. Distribution
- 17.3.8. Country
- 17.3.8.1. South Africa
- 17.3.8.2. Egypt
- 17.3.8.3. Nigeria
- 17.3.8.4. Algeria
- 17.3.8.5. Rest of Africa
- 17.4. South Africa Aerosol Cans Market
- 17.4.1. Country Segmental Analysis
- 17.4.2. Can Type
- 17.4.3. Material
- 17.4.4. Product
- 17.4.5. Propellant
- 17.4.6. Aerosol Mechanism
- 17.4.7. End Use Industry
- 17.4.8. Distribution
- 17.5. Egypt Aerosol Cans Market
- 17.5.1. Country Segmental Analysis
- 17.5.2. Can Type
- 17.5.3. Material
- 17.5.4. Product
- 17.5.5. Propellant
- 17.5.6. Aerosol Mechanism
- 17.5.7. End Use Industry
- 17.5.8. Distribution
- 17.6. Nigeria Aerosol Cans Market
- 17.6.1. Country Segmental Analysis
- 17.6.2. Can Type
- 17.6.3. Material
- 17.6.4. Product
- 17.6.5. Propellant
- 17.6.6. Aerosol Mechanism
- 17.6.7. End Use Industry
- 17.6.8. Distribution
- 17.7. Algeria Aerosol Cans Market
- 17.7.1. Country Segmental Analysis
- 17.7.2. Can Type
- 17.7.3. Material
- 17.7.4. Product
- 17.7.5. Propellant
- 17.7.6. Aerosol Mechanism
- 17.7.7. End Use Industry
- 17.7.8. Distribution
- 17.8. Rest of Africa Aerosol Cans Market
- 17.8.1. Country Segmental Analysis
- 17.8.2. Can Type
- 17.8.3. Material
- 17.8.4. Product
- 17.8.5. Propellant
- 17.8.6. Aerosol Mechanism
- 17.8.7. End Use Industry
- 17.8.8. Distribution
- 18. South America Aerosol Cans Market Analysis
- 18.1. Key Segment Analysis
- 18.2. Regional Snapshot
- 18.3. Central and South Africa Aerosol Cans Market Size in Volume (Million Units) & Value (US$ Billion), Analysis, and Forecasts, 2021-2035
- 18.3.1. Country Segmental Analysis
- 18.3.2. Can Type
- 18.3.3. Material
- 18.3.4. Product
- 18.3.5. Propellant
- 18.3.6. Aerosol Mechanism
- 18.3.7. End Use Industry
- 18.3.8. Distribution
- 18.3.9. Country
- 18.3.9.1. Brazil
- 18.3.9.2. Argentina
- 18.3.9.3. Rest of South America
- 18.4. Brazil Aerosol Cans Market
- 18.4.1. Country Segmental Analysis
- 18.4.2. Can Type
- 18.4.3. Material
- 18.4.4. Product
- 18.4.5. Propellant
- 18.4.6. Aerosol Mechanism
- 18.4.7. End Use Industry
- 18.4.8. Distribution
- 18.5. Argentina Aerosol Cans Market
- 18.5.1. Country Segmental Analysis
- 18.5.2. Can Type
- 18.5.3. Material
- 18.5.4. Product
- 18.5.5. Propellant
- 18.5.6. Aerosol Mechanism
- 18.5.7. End Use Industry
- 18.5.8. Distribution
- 18.6. Rest of South America Aerosol Cans Market
- 18.6.1. Country Segmental Analysis
- 18.6.2. Can Type
- 18.6.3. Material
- 18.6.4. Product
- 18.6.5. Propellant
- 18.6.6. Aerosol Mechanism
- 18.6.7. End Use Industry
- 18.6.8. Distribution
- 19. Key Players/ Company Profile
- 19.1. Alcoa Corporation
- 19.1.1. Company Details/ Overview
- 19.1.2. Company Financials
- 19.1.3. Key Customers and Competitors
- 19.1.4. Business/ Industry Portfolio
- 19.1.5. Product Portfolio/ Specification Details
- 19.1.6. Pricing Data
- 19.1.7. Strategic Overview
- 19.1.8. Recent Developments
- 19.2. Amcor plc
- 19.3. Arctic Can
- 19.4. Ball Corporation
- 19.5. Bemis Company (acquired by Amcor)
- 19.6. Can-Pack S.A.
- 19.7. Changshu SL Packaging
- 19.8. Constantia Flexibles
- 19.9. CPMC Holdings
- 19.10. Crown Holdings
- 19.11. DS Smith Plc
- 19.12. Erca Group
- 19.13. Evergreen Packaging
- 19.14. Greif, Inc.
- 19.15. Mondi Group
- 19.16. Mylani Metal Cans (Berry Global)
- 19.17. Nampak Ltd.
- 19.18. Silgan Holdings
- 19.19. Silmet Packaging
- 19.20. TricorBraun
- 19.21. Other Key Players
- 19.1. Alcoa Corporation
Note* - This is just tentative list of players. While providing the report, we will cover more number of players based on their revenue and share for each geography.
Research Design
Our research design integrates both demand-side and supply-side analysis through a balanced combination of primary and secondary research methodologies. By utilizing both bottom-up and top-down approaches alongside rigorous data triangulation methods, we deliver robust market intelligence that supports strategic decision-making.
MarketGenics' comprehensive research design framework ensures the delivery of accurate, reliable, and actionable market intelligence. Through the integration of multiple research approaches, rigorous validation processes, and expert analysis, we provide our clients with the insights needed to make informed strategic decisions and capitalize on market opportunities.

MarketGenics leverages a dedicated industry panel of experts and a comprehensive suite of paid databases to effectively collect, consolidate, and analyze market intelligence.
Our approach has consistently proven to be reliable and effective in generating accurate market insights, identifying key industry trends, and uncovering emerging business opportunities.
Through both primary and secondary research, we capture and analyze critical company-level data such as manufacturing footprints, including technical centers, R&D facilities, sales offices, and headquarters.
Our expert panel further enhances our ability to estimate market size for specific brands based on validated field-level intelligence.
Our data mining techniques incorporate both parametric and non-parametric methods, allowing for structured data collection, sorting, processing, and cleaning.
Demand projections are derived from large-scale data sets analyzed through proprietary algorithms, culminating in robust and reliable market sizing.
Research Approach
The bottom-up approach builds market estimates by starting with the smallest addressable market units and systematically aggregating them to create comprehensive market size projections.
This method begins with specific, granular data points and builds upward to create the complete market landscape.
Customer Analysis → Segmental Analysis → Geographical Analysis
The top-down approach starts with the broadest possible market data and systematically narrows it down through a series of filters and assumptions to arrive at specific market segments or opportunities.
This method begins with the big picture and works downward to increasingly specific market slices.
TAM → SAM → SOM


Research Methods
Desk / Secondary Research
While analysing the market, we extensively study secondary sources, directories, and databases to identify and collect information useful for this technical, market-oriented, and commercial report. Secondary sources that we utilize are not only the public sources, but it is a combination of Open Source, Associations, Paid Databases, MG Repository & Knowledgebase, and others.
- Company websites, annual reports, financial reports, broker reports, and investor presentations
- National government documents, statistical databases and reports
- News articles, press releases and web-casts specific to the companies operating in the market, Magazines, reports, and others
- We gather information from commercial data sources for deriving company specific data such as segmental revenue, share for geography, product revenue, and others
- Internal and external proprietary databases (industry-specific), relevant patent, and regulatory databases
- Governing Bodies, Government Organizations
- Relevant Authorities, Country-specific Associations for Industries
We also employ the model mapping approach to estimate the product level market data through the players' product portfolio
Primary Research
Primary research/ interviews is vital in analyzing the market. Most of the cases involves paid primary interviews. Primary sources include primary interviews through e-mail interactions, telephonic interviews, surveys as well as face-to-face interviews with the different stakeholders across the value chain including several industry experts.
| Type of Respondents | Number of Primaries |
|---|---|
| Tier 2/3 Suppliers | ~20 |
| Tier 1 Suppliers | ~25 |
| End-users | ~25 |
| Industry Expert/ Panel/ Consultant | ~30 |
| Total | ~100 |
MG Knowledgebase
• Repository of industry blog, newsletter and case studies
• Online platform covering detailed market reports, and company profiles
Forecasting Factors and Models
Forecasting Factors
- Historical Trends – Past market patterns, cycles, and major events that shaped how markets behave over time. Understanding past trends helps predict future behavior.
- Industry Factors – Specific characteristics of the industry like structure, regulations, and innovation cycles that affect market dynamics.
- Macroeconomic Factors – Economic conditions like GDP growth, inflation, and employment rates that affect how much money people have to spend.
- Demographic Factors – Population characteristics like age, income, and location that determine who can buy your product.
- Technology Factors – How quickly people adopt new technology and how much technology infrastructure exists.
- Regulatory Factors – Government rules, laws, and policies that can help or restrict market growth.
- Competitive Factors – Analyzing competition structure such as degree of competition and bargaining power of buyers and suppliers.
Forecasting Models / Techniques
Multiple Regression Analysis
- Identify and quantify factors that drive market changes
- Statistical modeling to establish relationships between market drivers and outcomes
Time Series Analysis – Seasonal Patterns
- Understand regular cyclical patterns in market demand
- Advanced statistical techniques to separate trend, seasonal, and irregular components
Time Series Analysis – Trend Analysis
- Identify underlying market growth patterns and momentum
- Statistical analysis of historical data to project future trends
Expert Opinion – Expert Interviews
- Gather deep industry insights and contextual understanding
- In-depth interviews with key industry stakeholders
Multi-Scenario Development
- Prepare for uncertainty by modeling different possible futures
- Creating optimistic, pessimistic, and most likely scenarios
Time Series Analysis – Moving Averages
- Sophisticated forecasting for complex time series data
- Auto-regressive integrated moving average models with seasonal components
Econometric Models
- Apply economic theory to market forecasting
- Sophisticated economic models that account for market interactions
Expert Opinion – Delphi Method
- Harness collective wisdom of industry experts
- Structured, multi-round expert consultation process
Monte Carlo Simulation
- Quantify uncertainty and probability distributions
- Thousands of simulations with varying input parameters
Research Analysis
Our research framework is built upon the fundamental principle of validating market intelligence from both demand and supply perspectives. This dual-sided approach ensures comprehensive market understanding and reduces the risk of single-source bias.
Demand-Side Analysis: We understand end-user/application behavior, preferences, and market needs along with the penetration of the product for specific application.
Supply-Side Analysis: We estimate overall market revenue, analyze the segmental share along with industry capacity, competitive landscape, and market structure.
Validation & Evaluation
Data triangulation is a validation technique that uses multiple methods, sources, or perspectives to examine the same research question, thereby increasing the credibility and reliability of research findings. In market research, triangulation serves as a quality assurance mechanism that helps identify and minimize bias, validate assumptions, and ensure accuracy in market estimates.
- Data Source Triangulation – Using multiple data sources to examine the same phenomenon
- Methodological Triangulation – Using multiple research methods to study the same research question
- Investigator Triangulation – Using multiple researchers or analysts to examine the same data
- Theoretical Triangulation – Using multiple theoretical perspectives to interpret the same data

Custom Market Research Services
We will customise the research for you, in case the report listed above does not meet your requirements.
Get 10% Free Customisation