Alternative Dairy Products Market Size, Share & Trends Analysis Report by Product Type (Plant‑Based Milk, Plant‑Based Yogurt, Plant‑Based Cheese, Plant‑Based Butter & Spreads, Plant‑Based Ice Cream & Frozen Desserts, Plant‑Based Creamers, Plant‑Based Whey/Protein Alternatives, Others), Source/ Raw Material, Form, Packaging Type, Consumer Age Group, Application/Usage, Distribution Channel, and Geography (North America, Europe, Asia Pacific, Middle East, Africa, and South America) – Global Industry Data, Trends, and Forecasts, 2026–2035
|
|
|
Segmental Data Insights |
|
|
Demand Trends |
|
|
Competitive Landscape |
|
|
Strategic Development |
|
|
Future Outlook & Opportunities |
|
Alternative Dairy Products Market Size, Share, and Growth
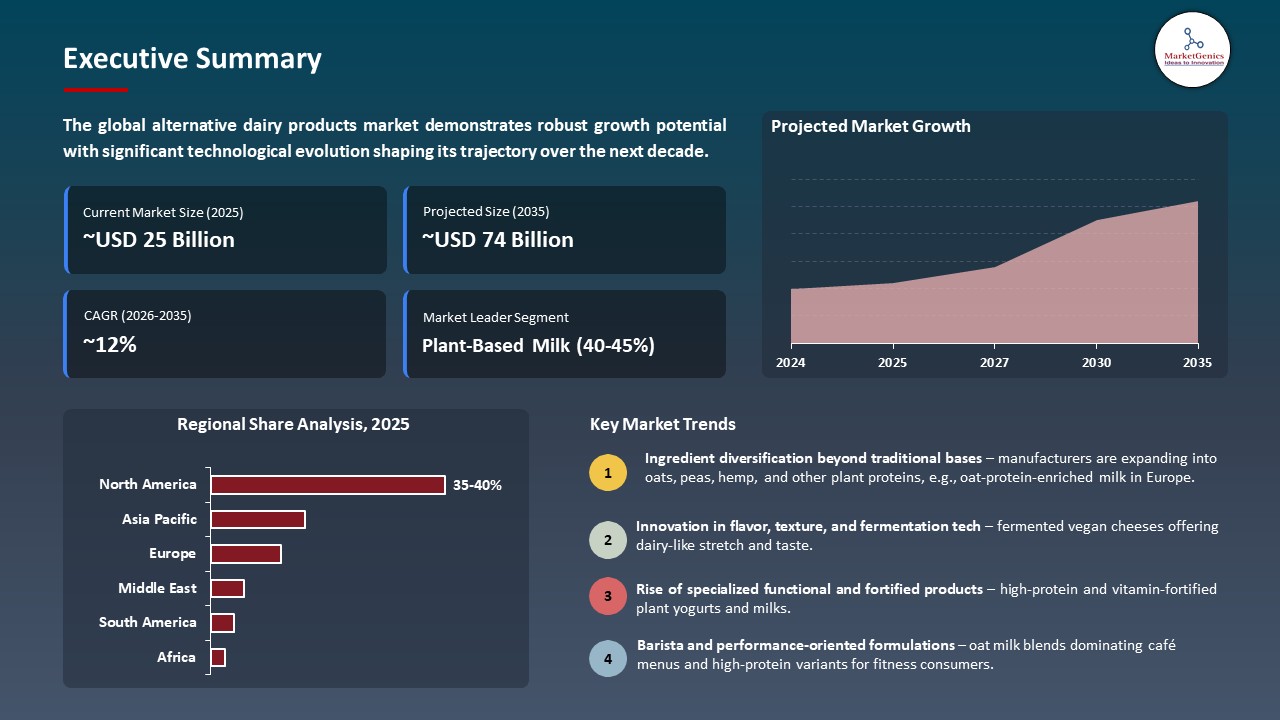
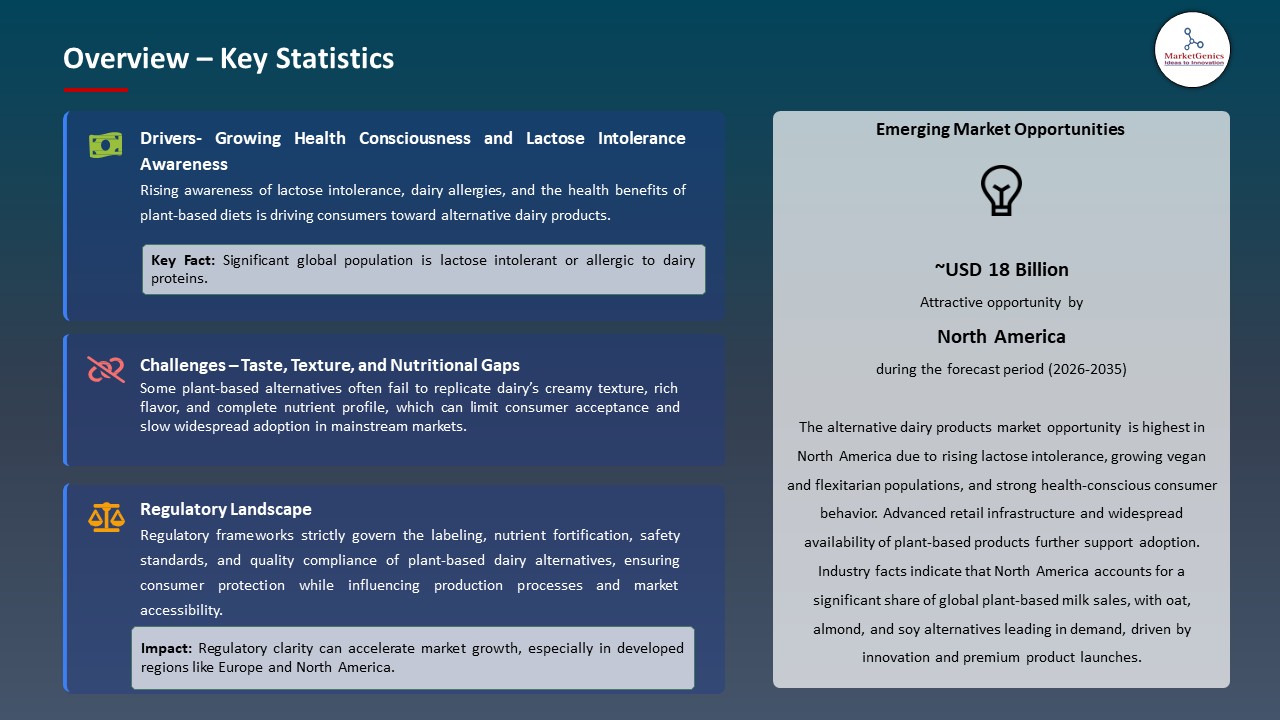
The global alternative dairy products market is exhibiting strong growth, with an estimated value of USD 24.5 billion in 2025 and USD 73.6 billion by 2035, achieving a CAGR of 11.6%, during the forecast period. The global alternative dairy products market is driven by rising health consciousness, lactose intolerance, environmental concerns, and growing consumer preference for plant-based, sustainable, and nutrient-rich dairy alternatives.
“At Oatly, we’re passionate about all things coffee, and naturally saw an opportunity to bring our expertise to the diverse and popular creamer category,” said Leah Hoxie, SVP of Innovation, Oatly North America. “As a company, we’re committed to converting cow’s milk drinkers into oatmilk buyers, so we’re excited to now offer fantastic, flavored creamers to people looking for a sweeter, more indulgent coffee experience. No matter consumers’ dietary preferences, it’s our hope that all coffee drinkers can agree with our belief that our new Oatly Creamers deliver superior taste and functionality - just like the rest of our oatmilk portfolio.”
The alternative dairy products market is being driven by high innovation in dairy-free proteins, as firms are producing unique, sustainable formulations to satisfy changing consumer demands. For instance, NewMoo which is applying plant molecular farming to make cheese alternatives by producing casein proteins to advance authenticity and texture of dairy-free products. This innovation increases the quality and authenticity of products, which increases consumer adoption of substitute dairy products.
Additionally, major brands are strategically building their alternative dairy lines to match the requirements of the health-conscious customer with high-protein, fortified and nutrient-fortified plant-based milk that fits the growing needs of nutritious and functional dairy substitutes. For instance, in November 2025, the French dairy giant Danone announced Silk Protein, a high-protein plant-based milk line that provides 50% more protein per serving to meet the ongoing demand of nutritious substitutes. This strategic diversification empowers brand presence, market growth and consumer adoption of nutrient rich alternative dairy products.
Key adjacent opportunities for the global alternative dairy products market include plant-based cheese, yogurt, and cream alternatives, lactose-free functional beverages, fortified protein drinks, dairy-free desserts, and innovative plant-based infant nutrition products. These opportunities capitalize on the growing trends on consumer health and sustainability, which allow brands to spread products and secure new sources of revenue. These opportunities increase market access and accelerated the growth of the larger plant-based dairy ecosystem.
Alternative Dairy Products Market Dynamics and Trends
Driver: Expansion of Product Innovation in Alternative Dairy Beverage Lines by Leading Brands
-
The innovation of products is a major growth driver in the alternative dairy products market since producers are adapting to changing consumer preferences in terms of taste, convenience and better nutritional content. For instance, in January 2026, Califia Farms unveiled Simple and Organic Soymilk, new plant-based creamers and coffee drinks, shows how the market is changing toward minimal-ingredient, high-protein plant alternatives that provide both functionality and high-sensory characteristics.
- This growth is a boost to Califia diversified portfolio of almond, oat, coconut, and soy products, which indicates strategic investments in formulation, texture, and flavor formula. The expanded portfolio allows the brands to appeal to new consumer groups such as lactose-intolerant, flexitarian, and sustainability-conscious consumers and increase both market presence in retail and foodservice markets. The constant product innovation strengthens the competitive difference, consumer interest, and sustainable and long-term development in the alternative dairy industry.
- This driver is increasing the product diversity and hastening mainstream adoption of alternative dairy products.
Restraint: Persistent Price Premium of Alternative Dairy Products Compared to Conventional Dairy
-
Alternative dairy products are often priced at a premium, as compared to traditional dairy products, even with growing consumer interest and demand, and can constrain its uptake by price-sensitive consumers and in highly competitive markets. The premium plant-based ingredients, superior production, certifications, and formulation investments cause high costs.
- This price discrepancy can discourage frequent/ bulk purchases especially in areas with lower disposable income or where traditional dairy is highly subsidized and established. Retailers can also give a preference to shelf space to lower priced conventional dairy, further diminishing the visibility and accessibility of the alternative dairy products. High costs compared to conventional dairy and large costs in comparison with innovation still remain barriers of high cost to large scale adoption and market growth.
- High prices limit adoption, reduce volume growth and limit penetration of cost sensitive markets.
Opportunity: Growth of Precision Fermentation and Cultured Dairy Proteins for Next‑Generation Alternatives
-
The key opportunity in the alternative dairy products market is the extensive adoption of precision fermentation and cultured dairy proteins which would allow it to produce products that are molecularly identical to traditional dairy but without the involvement of animals. For instance, Remilk is developing large-scale precision fermentation to manufacture animal-free milk proteins and is planning to launch cow-free milk products, including with Gad Dairy in 2025, which is a commercial trend towards lab-made dairy alternatives, which may be characterized as better tasting, healthier, and functional.
- These technologies reveal the unmet sensory and performance differences in plant-based products, making substitutes more attractive to the mainstream audience and food producers. With the change in regulatory frameworks and scale of production, new production types like animal-free cheese, yogurt, and ice cream will become available and take markets in the plant-based and traditional dairy industry.
- This opportunity expedites category growth through high-fidelity dairy options that can be embraced by additional consumers.
Key Trend: Rising Clean‑Label and Functional Formulations in Alternative Dairy Offerings
-
The alternative dairy products market is also becoming influenced by the need to find clean-label and functional formulations, which are made with a combination of natural and transparent ingredients, and with added benefits to their health. Ingredient vendors and product developers are developing to meet this consumer trend. For instance, Ingredion’s introduction of Novation Indulge 2940, a non‑GMO functional native corn starch, enables clean‑label plant‑based cheese and dairy alternatives by providing desired texture and stability without synthetic additives, aligning with clean‑label standards.
- Functional ingredients like this help manufacturers meet the dual demand for simplicity and performance in alternative dairy products, reducing the need for emulsifiers, gums, or other artificial components. The shift towards clean and natural ingredients as preferred by consumers and the trend of minimally processed ingredients keeps on pressuring the formulations chosen to satisfy the demand, making it a priority to focus on clean ingredients and improve sensory quality.
- This trend enhances product transparency and trust in the consumer, which leads to wider market adoption and high positioning.
 Alternative Dairy Products Market Analysis and Segmental Data
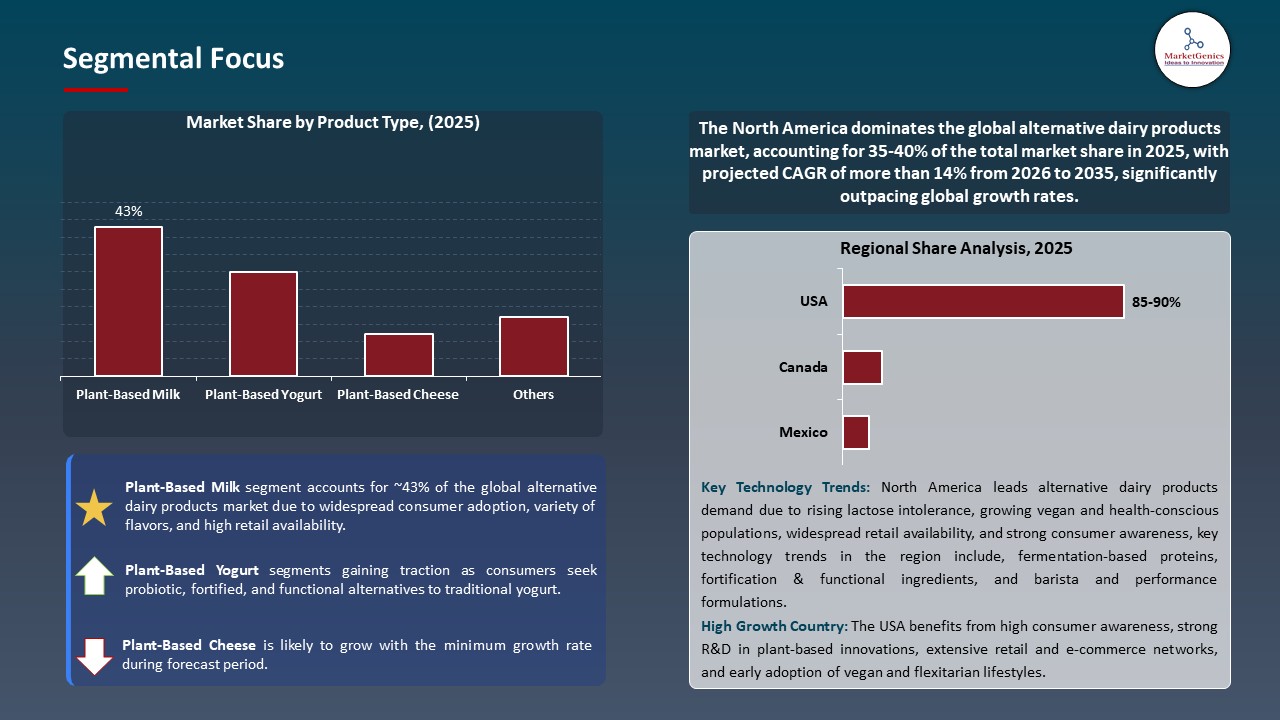
Plant‑Based Milk Dominate Global Alternative Dairy Products Market
-
The plant‑based milk segment dominates the global alternative dairy products market, as most consumers prefer lactose-free, sustainable, and multipurpose beverage products.
- Major food products companies have invested heavily in building plant-based milk portfolios to meet the different tastes and dietary needs. For instance, Danone Alpro and Silk brands continue to have broad product ranges of almond, soy, oat, and coconut milk, which bolster the market leadership in Europe and North America by adding fortified and flavoured versions of their products, which are preferred by health- and sustainability-conscious customers.
- This dominance is buttressed by good distribution channels and constant product innovation, which allow wide retail and foodservice access. Since consumer preference is shifting towards health and environmental factors, where consumers are abandoning traditional dairy and switching to plant-based dairy, plant-based milks continue to be the entry point and source of revenue in the larger category of alternative dairy.
- The effective work of plant-based milk contributes to the strengthening of the market and defines the priorities of the further development of the products.
North America Leads Global Alternative Dairy Products Market Demand
-
North America leads the alternative dairy products market is driven by a high level of consumer preference of the plant-based dairy alternatives because of their health, lactose intolerance, and sustainability advantages, with wide penetration of the retail stores, and availability of the products. For instance, in 2024 Califia Farms added new lactose-free, plant-based beverages and coffee creamers to its U.S. portfolio, which will support increased demand over lactose-free, clean-label offerings in mainstream grocery and foodservice stores. This growth is an indication of product innovation and consumer interaction in North America.
- Moreover, the large brands are expanding and product line diversification to consolidate their presence in North America. As an example, Danone North America has pushed its plant-based approach to launch Silk Protein and form a majority stake in the alternative dairy and functional beverage maker Kate Farms in the United States to expand its beverage offerings. This represents proactive investment to meet the rising consumer demand and increase category coverage in the area.
- These drivers are increasing the adoption of products and enhancing the leadership of North America in the global alternative dairy products market.
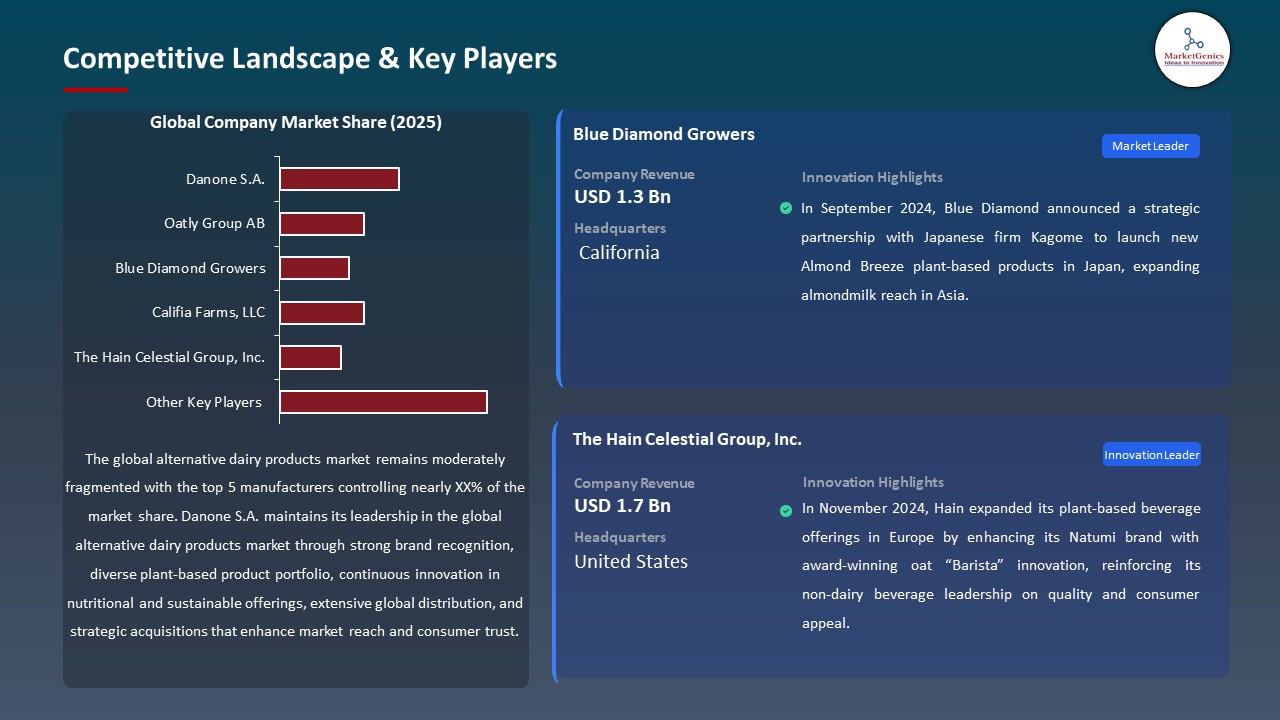
Alternative Dairy Products Market Ecosystem
The global alternative dairy products market is moderately fragmented, with leading players like Danone S.A., Oatly Group AB, Blue Diamond Growers, Califia Farms, and The Hain Celestial Group, Inc. dominating through strong brand equity, a large network of distribution, and hi-tech product solutions, which tap into the modern tendency of consumers to plant-based nutrition and sustainability.
Major players distinguish themselves with specialized solutions, Danone innovates with oat and almond-based yogurts and high-protein milks; Oatly focuses on oat-based barista and creamer offerings; Blue Diamond focuses on almond protein-based blends; Califia focuses on nutrient-enhanced beverages; and Hain Celestial focuses on clean-label formulations and increased innovation and portfolio.
Government bodies, research institutions, and industry advocates are also investing in alternative protein R&D; globally, public support for alternative protein research and commercialization reached significant levels in 2023, supporting infrastructure and innovation across the ecosystem. These collaborations accelerate technology adoption, enhance product quality, and expand market readiness.
 Recent Development and Strategic Overview:
-
In November 2025, Danone introduced Silk Protein, a plant-based milk beverage providing 13 g of complete plant protein, 3 g of fiber, and 50% less sugar compared to traditional dairy milk. The launch targets the growing demand for nutritious alternative dairy products, with a regional rollout in late 2025 and nationwide U.S. distribution scheduled for early 2026.
- In February 2024, Oatly strategically expanded its North American portfolio by introducing Oatmilk Creamers in four variants Sweet & Creamy, Vanilla, Caramel, and Mocha targeting enhanced plant-based coffee experiences and addressing growing consumer demand in the U.S. market.
Report Scope
|
Detail |
|
|
Market Size in 2025 |
USD 24.5 Bn |
|
Market Forecast Value in 2035 |
USD 73.6 Bn |
|
Growth Rate (CAGR) |
11.6% |
|
Forecast Period |
2026 – 2035 |
|
Historical Data Available for |
2021 – 2024 |
|
Market Size Units |
US$ Billion for Value |
|
Report Format |
Electronic (PDF) + Excel |
|
North America |
Europe |
Asia Pacific |
Middle East |
Africa |
South America |
|
|
|
|
|
|
|
Companies Covered |
|||||
|
|
|
|
|
|
Alternative Dairy Products Market Segmentation and Highlights
|
Segment |
Sub-segment |
|
Alternative Dairy Products Market, By Product Type |
|
|
Alternative Dairy Products Market, By Source/ Raw Material |
|
|
Alternative Dairy Products Market, By Form |
|
|
Alternative Dairy Products Market, By Packaging Type |
|
|
Alternative Dairy Products Market, By Consumer Age Group |
|
|
Alternative Dairy Products Market, By Application/Usage |
|
|
Alternative Dairy Products Market, By Distribution Channel |
|
Frequently Asked Questions
Table of Contents
- 1. Research Methodology and Assumptions
- 1.1. Definitions
- 1.2. Research Design and Approach
- 1.3. Data Collection Methods
- 1.4. Base Estimates and Calculations
- 1.5. Forecasting Models
- 1.5.1. Key Forecast Factors & Impact Analysis
- 1.6. Secondary Research
- 1.6.1. Open Sources
- 1.6.2. Paid Databases
- 1.6.3. Associations
- 1.7. Primary Research
- 1.7.1. Primary Sources
- 1.7.2. Primary Interviews with Stakeholders across Ecosystem
- 2. Executive Summary
- 2.1. Global Alternative Dairy Products Market Outlook
- 2.1.1. Alternative Dairy Products Market Size (Value - US$ Bn), and Forecasts, 2021-2035
- 2.1.2. Compounded Annual Growth Rate Analysis
- 2.1.3. Growth Opportunity Analysis
- 2.1.4. Segmental Share Analysis
- 2.1.5. Geographical Share Analysis
- 2.2. Market Analysis and Facts
- 2.3. Supply-Demand Analysis
- 2.4. Competitive Benchmarking
- 2.5. Go-to- Market Strategy
- 2.5.1. Customer/ End-use Industry Assessment
- 2.5.2. Growth Opportunity Data, 2026-2035
- 2.5.2.1. Regional Data
- 2.5.2.2. Country Data
- 2.5.2.3. Segmental Data
- 2.5.3. Identification of Potential Market Spaces
- 2.5.4. GAP Analysis
- 2.5.5. Potential Attractive Price Points
- 2.5.6. Prevailing Market Risks & Challenges
- 2.5.7. Preferred Sales & Marketing Strategies
- 2.5.8. Key Recommendations and Analysis
- 2.5.9. A Way Forward
- 2.1. Global Alternative Dairy Products Market Outlook
- 3. Industry Data and Premium Insights
- 3.1. Global Food & Beverages Industry Overview, 2025
- 3.1.1. Food & Beverages Ecosystem Analysis
- 3.1.2. Key Trends for Food & Beverages Industry
- 3.1.3. Regional Distribution for Food & Beverages Industry
- 3.2. Supplier Customer Data
- 3.3. Technology Roadmap and Developments
- 3.4. Trade Analysis
- 3.4.1. Import & Export Analysis, 2025
- 3.4.2. Top Importing Countries
- 3.4.3. Top Exporting Countries
- 3.5. Trump Tariff Impact Analysis
- 3.5.1. Manufacturer
- 3.5.1.1. Based on the component & Raw material
- 3.5.2. Supply Chain
- 3.5.3. End Consumer
- 3.5.1. Manufacturer
- 3.6. Raw Material Analysis
- 3.1. Global Food & Beverages Industry Overview, 2025
- 4. Market Overview
- 4.1. Market Dynamics
- 4.1.1. Drivers
- 4.1.1.1. Rising lactose intolerance and dairy allergy prevalence
- 4.1.1.2. Growing demand for plant-based, sustainable, and health-focused diets
- 4.1.1.3. Increasing adoption of vegan and flexitarian lifestyles
- 4.1.2. Restraints
- 4.1.2.1. Higher prices compared to conventional dairy products
- 4.1.2.2. Taste, texture, and nutritional equivalence challenges in some alternatives
- 4.1.1. Drivers
- 4.2. Key Trend Analysis
- 4.3. Regulatory Framework
- 4.3.1. Key Regulations, Norms, and Subsidies, by Key Countries
- 4.3.2. Tariffs and Standards
- 4.3.3. Impact Analysis of Regulations on the Market
- 4.4. Value Chain Analysis
- 4.4.1. Raw material sourcing
- 4.4.2. Manufacturing & packaging
- 4.4.3. Distribution & logistics
- 4.4.4. End consumers
- 4.5. Cost Structure Analysis
- 4.5.1. Parameter’s Share for Cost Associated
- 4.5.2. COGP vs COGS
- 4.5.3. Profit Margin Analysis
- 4.6. Pricing Analysis
- 4.6.1. Regional Pricing Analysis
- 4.6.2. Segmental Pricing Trends
- 4.6.3. Factors Influencing Pricing
- 4.7. Porter’s Five Forces Analysis
- 4.8. PESTEL Analysis
- 4.9. Global Alternative Dairy Products Market Demand
- 4.9.1. Historical Market Size – in Value (US$ Bn), 2020-2024
- 4.9.2. Current and Future Market Size – in Value (US$ Bn), 2026–2035
- 4.9.2.1. Y-o-Y Growth Trends
- 4.9.2.2. Absolute $ Opportunity Assessment
- 4.1. Market Dynamics
- 5. Competition Landscape
- 5.1. Competition structure
- 5.1.1. Fragmented v/s consolidated
- 5.2. Company Share Analysis, 2025
- 5.2.1. Global Company Market Share
- 5.2.2. By Region
- 5.2.2.1. North America
- 5.2.2.2. Europe
- 5.2.2.3. Asia Pacific
- 5.2.2.4. Middle East
- 5.2.2.5. Africa
- 5.2.2.6. South America
- 5.3. Product Comparison Matrix
- 5.3.1. Specifications
- 5.3.2. Market Positioning
- 5.3.3. Pricing
- 5.1. Competition structure
- 6. Global Alternative Dairy Products Market Analysis, by Product Type
- 6.1. Key Segment Analysis
- 6.2. Alternative Dairy Products Market Size (Value - US$ Bn), Analysis, and Forecasts, Product Type, 2021-2035
- 6.2.1. Plant‑Based Milk
- 6.2.2. Plant‑Based Yogurt
- 6.2.3. Plant‑Based Cheese
- 6.2.4. Plant‑Based Butter & Spreads
- 6.2.5. Plant‑Based Ice Cream & Frozen Desserts
- 6.2.6. Plant‑Based Creamers
- 6.2.7. Plant‑Based Whey/Protein Alternatives
- 6.2.8. Others
- 7. Global Alternative Dairy Products Market Analysis, by Source/ Raw Material
- 7.1. Key Segment Analysis
- 7.2. Alternative Dairy Products Market Size (Value - US$ Bn), Analysis, and Forecasts, by Source/ Raw Material, 2021-2035
- 7.2.1. Soy
- 7.2.2. Almond
- 7.2.3. Oat
- 7.2.4. Coconut
- 7.2.5. Rice
- 7.2.6. Pea
- 7.2.7. Cashew
- 7.2.8. Other Plant Sources
- 8. Global Alternative Dairy Products Market Analysis, by Form
- 8.1. Key Segment Analysis
- 8.2. Alternative Dairy Products Market Size (Value - US$ Bn), Analysis, and Forecasts, by Form, 2021-2035
- 8.2.1. Liquid
- 8.2.2. Powder
- 8.2.3. Frozen
- 8.2.4. Ready‑to‑Eat
- 8.2.5. Concentrate
- 8.2.6. Others
- 9. Global Alternative Dairy Products Market Analysis, by Packaging Type
- 9.1. Key Segment Analysis
- 9.2. Alternative Dairy Products Market Size (Value - US$ Bn), Analysis, and Forecasts, by Packaging Type, 2021-2035
- 9.2.1. Cartons
- 9.2.2. Bottles
- 9.2.3. Tetra Pak
- 9.2.4. Pouches
- 9.2.5. Cans
- 9.2.6. Others
- 10. Global Alternative Dairy Products Market Analysis, by Consumer Age Group
- 10.1. Key Segment Analysis
- 10.2. Alternative Dairy Products Market Size (Value - US$ Bn), Analysis, and Forecasts, by Consumer Age Group, 2021-2035
- 10.2.1. Children
- 10.2.2. Adults
- 10.2.3. Seniors
- 10.2.4. All Ages
- 11. Global Alternative Dairy Products Market Analysis, by Application/Usage
- 11.1. Key Segment Analysis
- 11.2. Alternative Dairy Products Market Size (Value - US$ Bn), Analysis, and Forecasts, by Application/Usage, 2021-2035
- 11.2.1. Home Consumption
- 11.2.2. Food Processing
- 11.2.3. Bakery & Confectionery
- 11.2.4. Beverages & Smoothies
- 11.2.5. Restaurants & Cafes
- 11.2.6. Functional Foods & Nutraceuticals
- 11.2.7. Others
- 12. Global Alternative Dairy Products Market Analysis, by Distribution Channel
- 12.1. Key Segment Analysis
- 12.2. Alternative Dairy Products Market Size (Value - US$ Bn), Analysis, and Forecasts, by Distribution Channel, 2021-2035
- 12.2.1. Supermarkets/Hypermarkets
- 12.2.2. Convenience Stores
- 12.2.3. Online Retail
- 12.2.4. Specialty Stores
- 12.2.5. Food Service Channels
- 12.2.6. Direct to Consumer
- 13. Global Alternative Dairy Products Market Analysis, by Region
- 13.1. Key Findings
- 13.2. Alternative Dairy Products Market Size (Value - US$ Mn), Analysis, and Forecasts, by Region, 2021-2035
- 13.2.1. North America
- 13.2.2. Europe
- 13.2.3. Asia Pacific
- 13.2.4. Middle East
- 13.2.5. Africa
- 13.2.6. South America
- 14. North America Alternative Dairy Products Market Analysis
- 14.1. Key Segment Analysis
- 14.2. Regional Snapshot
- 14.3. North America Alternative Dairy Products Market Size (Value - US$ Mn), Analysis, and Forecasts, 2021-2035
- 14.3.1. Product Type
- 14.3.2. Source/ Raw Material
- 14.3.3. Form
- 14.3.4. Packaging Type
- 14.3.5. Consumer Age Group
- 14.3.6. Application/Usage
- 14.3.7. Distribution Channel
- 14.3.8. Country
- 14.3.8.1. USA
- 14.3.8.2. Canada
- 14.3.8.3. Mexico
- 14.4. USA Alternative Dairy Products Market
- 14.4.1. Country Segmental Analysis
- 14.4.2. Product Type
- 14.4.3. Source/ Raw Material
- 14.4.4. Form
- 14.4.5. Packaging Type
- 14.4.6. Consumer Age Group
- 14.4.7. Application/Usage
- 14.4.8. Distribution Channel
- 14.5. Canada Alternative Dairy Products Market
- 14.5.1. Country Segmental Analysis
- 14.5.2. Product Type
- 14.5.3. Source/ Raw Material
- 14.5.4. Form
- 14.5.5. Packaging Type
- 14.5.6. Consumer Age Group
- 14.5.7. Application/Usage
- 14.5.8. Distribution Channel
- 14.6. Mexico Alternative Dairy Products Market
- 14.6.1. Country Segmental Analysis
- 14.6.2. Product Type
- 14.6.3. Source/ Raw Material
- 14.6.4. Form
- 14.6.5. Packaging Type
- 14.6.6. Consumer Age Group
- 14.6.7. Application/Usage
- 14.6.8. Distribution Channel
- 15. Europe Alternative Dairy Products Market Analysis
- 15.1. Key Segment Analysis
- 15.2. Regional Snapshot
- 15.3. Europe Alternative Dairy Products Market Size (Value - US$ Bn), Analysis, and Forecasts, 2021-2035
- 15.3.1. Product Type
- 15.3.2. Source/ Raw Material
- 15.3.3. Form
- 15.3.4. Packaging Type
- 15.3.5. Consumer Age Group
- 15.3.6. Application/Usage
- 15.3.7. Distribution Channel
- 15.3.8. Country
- 15.3.8.1. Germany
- 15.3.8.2. United Kingdom
- 15.3.8.3. France
- 15.3.8.4. Italy
- 15.3.8.5. Spain
- 15.3.8.6. Netherlands
- 15.3.8.7. Nordic Countries
- 15.3.8.8. Poland
- 15.3.8.9. Russia & CIS
- 15.3.8.10. Rest of Europe
- 15.4. Germany Alternative Dairy Products Market
- 15.4.1. Country Segmental Analysis
- 15.4.2. Product Type
- 15.4.3. Source/ Raw Material
- 15.4.4. Form
- 15.4.5. Packaging Type
- 15.4.6. Consumer Age Group
- 15.4.7. Application/Usage
- 15.4.8. Distribution Channel
- 15.5. United Kingdom Alternative Dairy Products Market
- 15.5.1. Country Segmental Analysis
- 15.5.2. Product Type
- 15.5.3. Source/ Raw Material
- 15.5.4. Form
- 15.5.5. Packaging Type
- 15.5.6. Consumer Age Group
- 15.5.7. Application/Usage
- 15.5.8. Distribution Channel
- 15.6. France Alternative Dairy Products Market
- 15.6.1. Country Segmental Analysis
- 15.6.2. Product Type
- 15.6.3. Source/ Raw Material
- 15.6.4. Form
- 15.6.5. Packaging Type
- 15.6.6. Consumer Age Group
- 15.6.7. Application/Usage
- 15.6.8. Distribution Channel
- 15.7. Italy Alternative Dairy Products Market
- 15.7.1. Country Segmental Analysis
- 15.7.2. Product Type
- 15.7.3. Source/ Raw Material
- 15.7.4. Form
- 15.7.5. Packaging Type
- 15.7.6. Consumer Age Group
- 15.7.7. Application/Usage
- 15.7.8. Distribution Channel
- 15.8. Spain Alternative Dairy Products Market
- 15.8.1. Country Segmental Analysis
- 15.8.2. Product Type
- 15.8.3. Source/ Raw Material
- 15.8.4. Form
- 15.8.5. Packaging Type
- 15.8.6. Consumer Age Group
- 15.8.7. Application/Usage
- 15.8.8. Distribution Channel
- 15.9. Netherlands Alternative Dairy Products Market
- 15.9.1. Country Segmental Analysis
- 15.9.2. Product Type
- 15.9.3. Source/ Raw Material
- 15.9.4. Form
- 15.9.5. Packaging Type
- 15.9.6. Consumer Age Group
- 15.9.7. Application/Usage
- 15.9.8. Distribution Channel
- 15.10. Nordic Countries Alternative Dairy Products Market
- 15.10.1. Country Segmental Analysis
- 15.10.2. Product Type
- 15.10.3. Source/ Raw Material
- 15.10.4. Form
- 15.10.5. Packaging Type
- 15.10.6. Consumer Age Group
- 15.10.7. Application/Usage
- 15.10.8. Distribution Channel
- 15.11. Poland Alternative Dairy Products Market
- 15.11.1. Country Segmental Analysis
- 15.11.2. Product Type
- 15.11.3. Source/ Raw Material
- 15.11.4. Form
- 15.11.5. Packaging Type
- 15.11.6. Consumer Age Group
- 15.11.7. Application/Usage
- 15.11.8. Distribution Channel
- 15.12. Russia & CIS Alternative Dairy Products Market
- 15.12.1. Country Segmental Analysis
- 15.12.2. Product Type
- 15.12.3. Source/ Raw Material
- 15.12.4. Form
- 15.12.5. Packaging Type
- 15.12.6. Consumer Age Group
- 15.12.7. Application/Usage
- 15.12.8. Distribution Channel
- 15.13. Rest of Europe Alternative Dairy Products Market
- 15.13.1. Country Segmental Analysis
- 15.13.2. Product Type
- 15.13.3. Source/ Raw Material
- 15.13.4. Form
- 15.13.5. Packaging Type
- 15.13.6. Consumer Age Group
- 15.13.7. Application/Usage
- 15.13.8. Distribution Channel
- 16. Asia Pacific Alternative Dairy Products Market Analysis
- 16.1. Key Segment Analysis
- 16.2. Regional Snapshot
- 16.3. Asia Pacific Alternative Dairy Products Market Size (Value - US$ Bn), Analysis, and Forecasts, 2021-2035
- 16.3.1. Product Type
- 16.3.2. Source/ Raw Material
- 16.3.3. Form
- 16.3.4. Packaging Type
- 16.3.5. Consumer Age Group
- 16.3.6. Application/Usage
- 16.3.7. Distribution Channel
- 16.3.8. Country
- 16.3.8.1. China
- 16.3.8.2. India
- 16.3.8.3. Japan
- 16.3.8.4. South Korea
- 16.3.8.5. Australia and New Zealand
- 16.3.8.6. Indonesia
- 16.3.8.7. Malaysia
- 16.3.8.8. Thailand
- 16.3.8.9. Vietnam
- 16.3.8.10. Rest of Asia Pacific
- 16.4. China Alternative Dairy Products Market
- 16.4.1. Country Segmental Analysis
- 16.4.2. Product Type
- 16.4.3. Source/ Raw Material
- 16.4.4. Form
- 16.4.5. Packaging Type
- 16.4.6. Consumer Age Group
- 16.4.7. Application/Usage
- 16.4.8. Distribution Channel
- 16.5. India Alternative Dairy Products Market
- 16.5.1. Country Segmental Analysis
- 16.5.2. Product Type
- 16.5.3. Source/ Raw Material
- 16.5.4. Form
- 16.5.5. Packaging Type
- 16.5.6. Consumer Age Group
- 16.5.7. Application/Usage
- 16.5.8. Distribution Channel
- 16.6. Japan Alternative Dairy Products Market
- 16.6.1. Country Segmental Analysis
- 16.6.2. Product Type
- 16.6.3. Source/ Raw Material
- 16.6.4. Form
- 16.6.5. Packaging Type
- 16.6.6. Consumer Age Group
- 16.6.7. Application/Usage
- 16.6.8. Distribution Channel
- 16.7. South Korea Alternative Dairy Products Market
- 16.7.1. Country Segmental Analysis
- 16.7.2. Product Type
- 16.7.3. Source/ Raw Material
- 16.7.4. Form
- 16.7.5. Packaging Type
- 16.7.6. Consumer Age Group
- 16.7.7. Application/Usage
- 16.7.8. Distribution Channel
- 16.8. Australia and New Zealand Alternative Dairy Products Market
- 16.8.1. Country Segmental Analysis
- 16.8.2. Product Type
- 16.8.3. Source/ Raw Material
- 16.8.4. Form
- 16.8.5. Packaging Type
- 16.8.6. Consumer Age Group
- 16.8.7. Application/Usage
- 16.8.8. Distribution Channel
- 16.9. Indonesia Alternative Dairy Products Market
- 16.9.1. Country Segmental Analysis
- 16.9.2. Product Type
- 16.9.3. Source/ Raw Material
- 16.9.4. Form
- 16.9.5. Packaging Type
- 16.9.6. Consumer Age Group
- 16.9.7. Application/Usage
- 16.9.8. Distribution Channel
- 16.10. Malaysia Alternative Dairy Products Market
- 16.10.1. Country Segmental Analysis
- 16.10.2. Product Type
- 16.10.3. Source/ Raw Material
- 16.10.4. Form
- 16.10.5. Packaging Type
- 16.10.6. Consumer Age Group
- 16.10.7. Application/Usage
- 16.10.8. Distribution Channel
- 16.11. Thailand Alternative Dairy Products Market
- 16.11.1. Country Segmental Analysis
- 16.11.2. Product Type
- 16.11.3. Source/ Raw Material
- 16.11.4. Form
- 16.11.5. Packaging Type
- 16.11.6. Consumer Age Group
- 16.11.7. Application/Usage
- 16.11.8. Distribution Channel
- 16.12. Vietnam Alternative Dairy Products Market
- 16.12.1. Country Segmental Analysis
- 16.12.2. Product Type
- 16.12.3. Source/ Raw Material
- 16.12.4. Form
- 16.12.5. Packaging Type
- 16.12.6. Consumer Age Group
- 16.12.7. Application/Usage
- 16.12.8. Distribution Channel
- 16.13. Rest of Asia Pacific Alternative Dairy Products Market
- 16.13.1. Country Segmental Analysis
- 16.13.2. Product Type
- 16.13.3. Source/ Raw Material
- 16.13.4. Form
- 16.13.5. Packaging Type
- 16.13.6. Consumer Age Group
- 16.13.7. Application/Usage
- 16.13.8. Distribution Channel
- 17. Middle East Alternative Dairy Products Market Analysis
- 17.1. Key Segment Analysis
- 17.2. Regional Snapshot
- 17.3. Middle East Alternative Dairy Products Market Size (Value - US$ Bn), Analysis, and Forecasts, 2021-2035
- 17.3.1. Product Type
- 17.3.2. Source/ Raw Material
- 17.3.3. Form
- 17.3.4. Packaging Type
- 17.3.5. Consumer Age Group
- 17.3.6. Application/Usage
- 17.3.7. Distribution Channel
- 17.3.8. Country
- 17.3.8.1. Turkey
- 17.3.8.2. UAE
- 17.3.8.3. Saudi Arabia
- 17.3.8.4. Israel
- 17.3.8.5. Rest of Middle East
- 17.4. Turkey Alternative Dairy Products Market
- 17.4.1. Country Segmental Analysis
- 17.4.2. Product Type
- 17.4.3. Source/ Raw Material
- 17.4.4. Form
- 17.4.5. Packaging Type
- 17.4.6. Consumer Age Group
- 17.4.7. Application/Usage
- 17.4.8. Distribution Channel
- 17.5. UAE Alternative Dairy Products Market
- 17.5.1. Country Segmental Analysis
- 17.5.2. Product Type
- 17.5.3. Source/ Raw Material
- 17.5.4. Form
- 17.5.5. Packaging Type
- 17.5.6. Consumer Age Group
- 17.5.7. Application/Usage
- 17.5.8. Distribution Channel
- 17.6. Saudi Arabia Alternative Dairy Products Market
- 17.6.1. Country Segmental Analysis
- 17.6.2. Product Type
- 17.6.3. Source/ Raw Material
- 17.6.4. Form
- 17.6.5. Packaging Type
- 17.6.6. Consumer Age Group
- 17.6.7. Application/Usage
- 17.6.8. Distribution Channel
- 17.7. Israel Alternative Dairy Products Market
- 17.7.1. Country Segmental Analysis
- 17.7.2. Product Type
- 17.7.3. Source/ Raw Material
- 17.7.4. Form
- 17.7.5. Packaging Type
- 17.7.6. Consumer Age Group
- 17.7.7. Application/Usage
- 17.7.8. Distribution Channel
- 17.8. Rest of Middle East Alternative Dairy Products Market
- 17.8.1. Country Segmental Analysis
- 17.8.2. Product Type
- 17.8.3. Source/ Raw Material
- 17.8.4. Form
- 17.8.5. Packaging Type
- 17.8.6. Consumer Age Group
- 17.8.7. Application/Usage
- 17.8.8. Distribution Channel
- 18. Africa Alternative Dairy Products Market Analysis
- 18.1. Key Segment Analysis
- 18.2. Regional Snapshot
- 18.3. Africa Alternative Dairy Products Market Size (Value - US$ Bn), Analysis, and Forecasts, 2021-2035
- 18.3.1. Product Type
- 18.3.2. Source/ Raw Material
- 18.3.3. Form
- 18.3.4. Packaging Type
- 18.3.5. Consumer Age Group
- 18.3.6. Application/Usage
- 18.3.7. Distribution Channel
- 18.3.8. Country
- 18.3.8.1. South Africa
- 18.3.8.2. Egypt
- 18.3.8.3. Nigeria
- 18.3.8.4. Algeria
- 18.3.8.5. Rest of Africa
- 18.4. South Africa Alternative Dairy Products Market
- 18.4.1. Country Segmental Analysis
- 18.4.2. Product Type
- 18.4.3. Source/ Raw Material
- 18.4.4. Form
- 18.4.5. Packaging Type
- 18.4.6. Consumer Age Group
- 18.4.7. Application/Usage
- 18.4.8. Distribution Channel
- 18.5. Egypt Alternative Dairy Products Market
- 18.5.1. Country Segmental Analysis
- 18.5.2. Product Type
- 18.5.3. Source/ Raw Material
- 18.5.4. Form
- 18.5.5. Packaging Type
- 18.5.6. Consumer Age Group
- 18.5.7. Application/Usage
- 18.5.8. Distribution Channel
- 18.6. Nigeria Alternative Dairy Products Market
- 18.6.1. Country Segmental Analysis
- 18.6.2. Product Type
- 18.6.3. Source/ Raw Material
- 18.6.4. Form
- 18.6.5. Packaging Type
- 18.6.6. Consumer Age Group
- 18.6.7. Application/Usage
- 18.6.8. Distribution Channel
- 18.7. Algeria Alternative Dairy Products Market
- 18.7.1. Country Segmental Analysis
- 18.7.2. Product Type
- 18.7.3. Source/ Raw Material
- 18.7.4. Form
- 18.7.5. Packaging Type
- 18.7.6. Consumer Age Group
- 18.7.7. Application/Usage
- 18.7.8. Distribution Channel
- 18.8. Rest of Africa Alternative Dairy Products Market
- 18.8.1. Country Segmental Analysis
- 18.8.2. Product Type
- 18.8.3. Source/ Raw Material
- 18.8.4. Form
- 18.8.5. Packaging Type
- 18.8.6. Consumer Age Group
- 18.8.7. Application/Usage
- 18.8.8. Distribution Channel
- 19. South America Alternative Dairy Products Market Analysis
- 19.1. Key Segment Analysis
- 19.2. Regional Snapshot
- 19.3. South America Alternative Dairy Products Market Size (Value - US$ Bn), Analysis, and Forecasts, 2021-2035
- 19.3.1. Product Type
- 19.3.2. Source/ Raw Material
- 19.3.3. Form
- 19.3.4. Packaging Type
- 19.3.5. Consumer Age Group
- 19.3.6. Application/Usage
- 19.3.7. Distribution Channel
- 19.3.8. Country
- 19.3.8.1. Brazil
- 19.3.8.2. Argentina
- 19.3.8.3. Rest of South America
- 19.4. Brazil Alternative Dairy Products Market
- 19.4.1. Country Segmental Analysis
- 19.4.2. Product Type
- 19.4.3. Source/ Raw Material
- 19.4.4. Form
- 19.4.5. Packaging Type
- 19.4.6. Consumer Age Group
- 19.4.7. Application/Usage
- 19.4.8. Distribution Channel
- 19.5. Argentina Alternative Dairy Products Market
- 19.5.1. Country Segmental Analysis
- 19.5.2. Product Type
- 19.5.3. Source/ Raw Material
- 19.5.4. Form
- 19.5.5. Packaging Type
- 19.5.6. Consumer Age Group
- 19.5.7. Application/Usage
- 19.5.8. Distribution Channel
- 19.6. Rest of South America Alternative Dairy Products Market
- 19.6.1. Country Segmental Analysis
- 19.6.2. Product Type
- 19.6.3. Source/ Raw Material
- 19.6.4. Form
- 19.6.5. Packaging Type
- 19.6.6. Consumer Age Group
- 19.6.7. Application/Usage
- 19.6.8. Distribution Channel
- 20. Key Players/ Company Profile
- 20.1. Archer Daniels Midland Company
- 20.1.1. Company Details/ Overview
- 20.1.2. Company Financials
- 20.1.3. Key Customers and Competitors
- 20.1.4. Business/ Industry Portfolio
- 20.1.5. Product Portfolio/ Specification Details
- 20.1.6. Pricing Data
- 20.1.7. Strategic Overview
- 20.1.8. Recent Developments
- 20.2. Blue Diamond Growers
- 20.3. Califia Farms, LLC
- 20.4. Danone S.A.
- 20.5. Elmhurst 1925, Inc.
- 20.6. Freedom Foods Group Limited
- 20.7. Good Karma Foods, Inc.
- 20.8. Lactalis Group
- 20.9. Miyoko’s Creamery, Inc.
- 20.10. Mondelez International, Inc.
- 20.11. Nestlé S.A.
- 20.12. Oatly Group AB
- 20.13. Perfect Day, Inc.
- 20.14. Ripple Foods, Inc.
- 20.15. SunOpta Inc.
- 20.16. The Hain Celestial Group, Inc.
- 20.17. The WhiteWave Foods Company
- 20.18. Vega
- 20.19. Other Key Players
- 20.1. Archer Daniels Midland Company
Note* - This is just tentative list of players. While providing the report, we will cover more number of players based on their revenue and share for each geography
Research Design
Our research design integrates both demand-side and supply-side analysis through a balanced combination of primary and secondary research methodologies. By utilizing both bottom-up and top-down approaches alongside rigorous data triangulation methods, we deliver robust market intelligence that supports strategic decision-making.
MarketGenics' comprehensive research design framework ensures the delivery of accurate, reliable, and actionable market intelligence. Through the integration of multiple research approaches, rigorous validation processes, and expert analysis, we provide our clients with the insights needed to make informed strategic decisions and capitalize on market opportunities.

MarketGenics leverages a dedicated industry panel of experts and a comprehensive suite of paid databases to effectively collect, consolidate, and analyze market intelligence.
Our approach has consistently proven to be reliable and effective in generating accurate market insights, identifying key industry trends, and uncovering emerging business opportunities.
Through both primary and secondary research, we capture and analyze critical company-level data such as manufacturing footprints, including technical centers, R&D facilities, sales offices, and headquarters.
Our expert panel further enhances our ability to estimate market size for specific brands based on validated field-level intelligence.
Our data mining techniques incorporate both parametric and non-parametric methods, allowing for structured data collection, sorting, processing, and cleaning.
Demand projections are derived from large-scale data sets analyzed through proprietary algorithms, culminating in robust and reliable market sizing.
Research Approach
The bottom-up approach builds market estimates by starting with the smallest addressable market units and systematically aggregating them to create comprehensive market size projections.
This method begins with specific, granular data points and builds upward to create the complete market landscape.
Customer Analysis → Segmental Analysis → Geographical Analysis
The top-down approach starts with the broadest possible market data and systematically narrows it down through a series of filters and assumptions to arrive at specific market segments or opportunities.
This method begins with the big picture and works downward to increasingly specific market slices.
TAM → SAM → SOM


Research Methods
Desk / Secondary Research
While analysing the market, we extensively study secondary sources, directories, and databases to identify and collect information useful for this technical, market-oriented, and commercial report. Secondary sources that we utilize are not only the public sources, but it is a combination of Open Source, Associations, Paid Databases, MG Repository & Knowledgebase, and others.
- Company websites, annual reports, financial reports, broker reports, and investor presentations
- National government documents, statistical databases and reports
- News articles, press releases and web-casts specific to the companies operating in the market, Magazines, reports, and others
- We gather information from commercial data sources for deriving company specific data such as segmental revenue, share for geography, product revenue, and others
- Internal and external proprietary databases (industry-specific), relevant patent, and regulatory databases
- Governing Bodies, Government Organizations
- Relevant Authorities, Country-specific Associations for Industries
We also employ the model mapping approach to estimate the product level market data through the players' product portfolio
Primary Research
Primary research/ interviews is vital in analyzing the market. Most of the cases involves paid primary interviews. Primary sources include primary interviews through e-mail interactions, telephonic interviews, surveys as well as face-to-face interviews with the different stakeholders across the value chain including several industry experts.
| Type of Respondents | Number of Primaries |
|---|---|
| Tier 2/3 Suppliers | ~20 |
| Tier 1 Suppliers | ~25 |
| End-users | ~25 |
| Industry Expert/ Panel/ Consultant | ~30 |
| Total | ~100 |
MG Knowledgebase
• Repository of industry blog, newsletter and case studies
• Online platform covering detailed market reports, and company profiles
Forecasting Factors and Models
Forecasting Factors
- Historical Trends – Past market patterns, cycles, and major events that shaped how markets behave over time. Understanding past trends helps predict future behavior.
- Industry Factors – Specific characteristics of the industry like structure, regulations, and innovation cycles that affect market dynamics.
- Macroeconomic Factors – Economic conditions like GDP growth, inflation, and employment rates that affect how much money people have to spend.
- Demographic Factors – Population characteristics like age, income, and location that determine who can buy your product.
- Technology Factors – How quickly people adopt new technology and how much technology infrastructure exists.
- Regulatory Factors – Government rules, laws, and policies that can help or restrict market growth.
- Competitive Factors – Analyzing competition structure such as degree of competition and bargaining power of buyers and suppliers.
Forecasting Models / Techniques
Multiple Regression Analysis
- Identify and quantify factors that drive market changes
- Statistical modeling to establish relationships between market drivers and outcomes
Time Series Analysis – Seasonal Patterns
- Understand regular cyclical patterns in market demand
- Advanced statistical techniques to separate trend, seasonal, and irregular components
Time Series Analysis – Trend Analysis
- Identify underlying market growth patterns and momentum
- Statistical analysis of historical data to project future trends
Expert Opinion – Expert Interviews
- Gather deep industry insights and contextual understanding
- In-depth interviews with key industry stakeholders
Multi-Scenario Development
- Prepare for uncertainty by modeling different possible futures
- Creating optimistic, pessimistic, and most likely scenarios
Time Series Analysis – Moving Averages
- Sophisticated forecasting for complex time series data
- Auto-regressive integrated moving average models with seasonal components
Econometric Models
- Apply economic theory to market forecasting
- Sophisticated economic models that account for market interactions
Expert Opinion – Delphi Method
- Harness collective wisdom of industry experts
- Structured, multi-round expert consultation process
Monte Carlo Simulation
- Quantify uncertainty and probability distributions
- Thousands of simulations with varying input parameters
Research Analysis
Our research framework is built upon the fundamental principle of validating market intelligence from both demand and supply perspectives. This dual-sided approach ensures comprehensive market understanding and reduces the risk of single-source bias.
Demand-Side Analysis: We understand end-user/application behavior, preferences, and market needs along with the penetration of the product for specific application.
Supply-Side Analysis: We estimate overall market revenue, analyze the segmental share along with industry capacity, competitive landscape, and market structure.
Validation & Evaluation
Data triangulation is a validation technique that uses multiple methods, sources, or perspectives to examine the same research question, thereby increasing the credibility and reliability of research findings. In market research, triangulation serves as a quality assurance mechanism that helps identify and minimize bias, validate assumptions, and ensure accuracy in market estimates.
- Data Source Triangulation – Using multiple data sources to examine the same phenomenon
- Methodological Triangulation – Using multiple research methods to study the same research question
- Investigator Triangulation – Using multiple researchers or analysts to examine the same data
- Theoretical Triangulation – Using multiple theoretical perspectives to interpret the same data

Custom Market Research Services
We will customise the research for you, in case the report listed above does not meet your requirements.
Get 10% Free Customisation