Aquafeed and Aquaculture Additives Market Size, Share & Trends Analysis Report by Product Type (Aquafeed, Aquaculture Additives), Ingredient Type, Species, Form, Distribution Channel, End-users, and Geography (North America, Europe, Asia Pacific, Middle East, Africa, and South America) – Global Industry Data, Trends, and Forecasts, 2026–2035
|
|
|
Segmental Data Insights |
|
|
Demand Trends |
|
|
Competitive Landscape |
|
|
Strategic Development |
|
|
Future Outlook & Opportunities |
|
Aquafeed and Aquaculture Additives Market Size, Share, and Growth
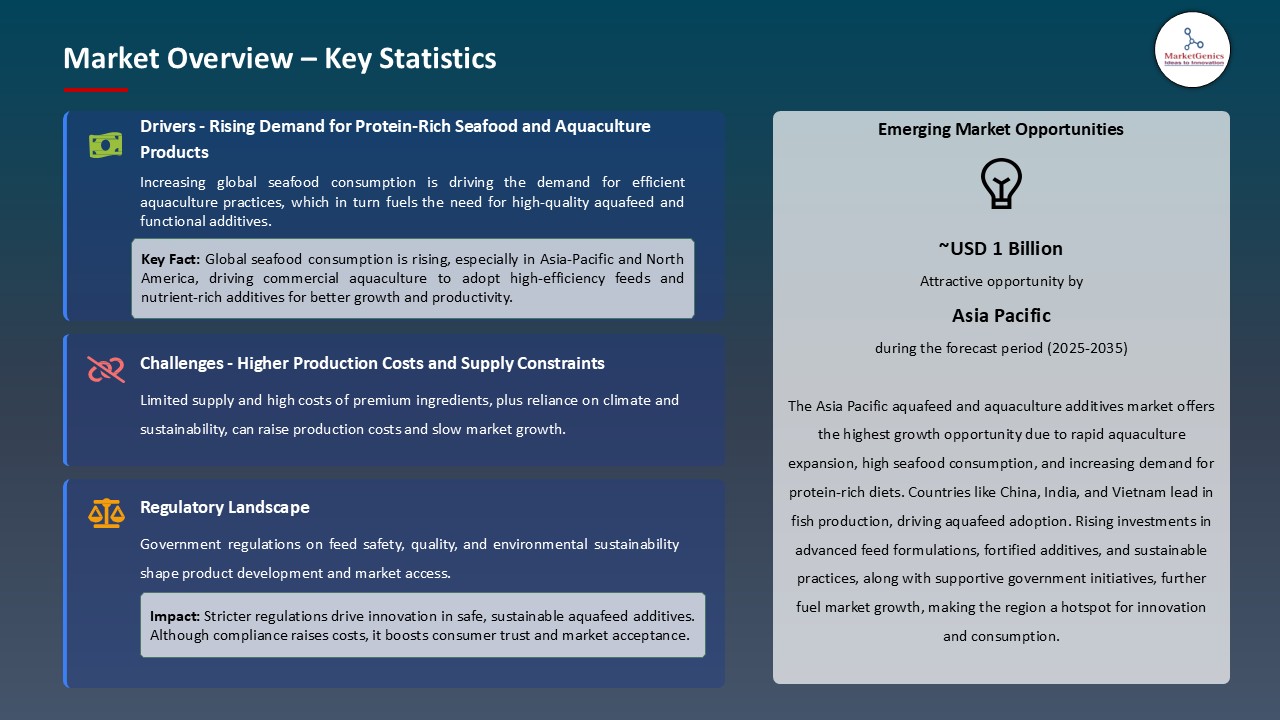
The global aquafeed and aquaculture additives market is experiencing robust growth, with its estimated value of USD 1.3 billion in the year 2025 and USD 2.2 billion by the period 2035, registering a CAGR of 5.6%, during the forecast period. Increase in the demand for seafood, aquaculture, and rising understanding of sustainable and high-quality feeds are increasing the global aquafeeds and aquaculture additives market.

Dr. Linda Jensen, Team Lead Health, Skretting, said that, “With Necto, we are harnessing the complexity of plants and combining this with years of experience in health research, to create a truly innovative diet. Necto is a holistic solution that supports fish health and resilience in an unprecedented way.
The rising demand of high quality, safe, and sustainable seafood worldwide is compelling aquafeed and aquaculture additive producers to invest in innovative formulations of feeds, accuracy in nutrition and innovation on protein sources. The production efficiency, nutrient utilization, and cost-effectiveness are being improved by the use of advanced technologies such as automated feed extrusion, enzyme formulation, and AI-driven feed optimization.
Strategic partnerships and regulatory promotion further provide ample of benefits in accelerated commercialization. For instance, in 2025, Loopworm (India) received a regulatory nod, in the form of an authorization granted by the Coastal Aquaculture Authority of India to incorporate their insect-based protein and fat products in aquaculture feeds as additives, attractants, and palatants, new business opportunities in the use of sustainable insect-derived inputs.
Increasing aquaculture production, consumer demand regarding the safety of seafood, and environmental sustainability issues are also leading to an growing utilization of alternative protein sources including insect meal, single cell protein sources, algae based ingredients, and hydrolyzed proteins to offer optimized nutrition to finfish, shrimp, and other aquatic animals. For instance, In September 2025, BioMar Group and Innovafeed, and Auchan Retail partnered to add insect meal into commercial shrimp feeds in Ecuador, proving that alternative source of proteins could be used in an aquaculture scale.
Adjacent market opportunities to the global aquafeed and aquaculture additives market include sustainable algae-based feed production, functional feed additives for fish health, precision aquaculture technologies, alternative protein sources such as insect meal, and aquaculture water treatment solutions. Diversification into adjacent markets amplifies value creation and long-term industry resilience.
Aquafeed and Aquaculture Additives Market Dynamics and Trends
Driver: Surging Global Seafood Demand and Declining Wild Fish Stocks
- The global aquafeed and aquaculture additives market is experiencing strong growth due to the growing global demand of seafood stimulated by the growing population and urbanization accompanied by the realization of the benefits of protein-based diets. With the current decline of the wild fish populations because of overfishing and environmental stressors, the aquaculture is becoming the key source of the production of the seafood.
- The manufacturers are using advanced feed formulations, nutrient optimization and sustainable sources of ingredients to increase the efficiency of aquaculture growth and to offset the growing supply gap in the global seafood production. For instance, in October 2025, Skretting introduced its new generation shrimp feeds called Lorica and Optiline containing new bio-active compounds and dependency on marine products will be minimized, which will result in healthier shrimp and a more sustainable system of production.
- These efforts enhances resiliency in the industry, consistent production of seafood, and increase profitability with value-added feed solutions in line with global sustainability objectives.
Restraint: Volatile Raw Material Costs and Fishmeal Supply Constraints
- The global aquafeed and aquaculture additives market is highly threatened by the unstable pricing of major raw materials as fishmeal, fish oil and speciality additives. The use of marine-based ingredients is highly dependent and feed manufacturers are prone to fluctuations of global fish catches, climatic conditions, and sustainability restrictions which have a direct effect on the cost of production.
- The volatility of prices in other sources like soy protein, corn and wheat also interferes with the cost stability and the margin control, particularly to the small and medium producers. Unstable supply and high freight expenses are also obstacles to stable supply of ingredients.
- All these factors increase the operational cost, reduce scalability and reduce the growth potential of the global aquafeed and aquaculture additives market.
Opportunity: Alternative Protein Sources and Novel Ingredient Innovation
- The global aquafeed and aquaculture additives market offers high growth potential with introduction of alternative protein sources like insect meal, single-cell protein, microalgae and plant-based concentrates. These alternative ingredients help to decrease the fishmeal addiction, enhance the nutrient proportion, and facilitate the sustainable development of aquaculture.
- The production of low-carbon, high-protein feed ingredients is being stimulated by the growing investments in insect rearing, microbial fermentation, and algae-farming. For instance, in March 2024, Volare and Skretting declared a commercial collaboration to encompass insect protein into aquafeed in salmon, an indicator of the shift towards sustainable feed innovation.
- These avenues enable circular economy practices, and environmental efficiency, which forms a high-growth opportunity for manufacturers while differentiating their products and meet the growing global demand of eco-optimal aquafeed and aquaculture additive solutions.
Key Trend: Functional Feed Additives and Precision Aquaculture Nutrition
- The global aquafeed and aquaculture additives market is directly moving toward the functional feed additives and precision nutrition solutions, to enhance the health and immunity of fish, and to enhance their feed efficiency. These solutions are also merging with biotechnology, enzyme engineering and data-based nutrition to further streamline growth performance and sustainability in aquaculture systems.
- The companies are targeting bioactive compounds, including probiotics, prebiotics, enzymes and compounds with high omega content, which support gut health and nutrient utilization to allow high performance and eco-efficient aquafeed formulations. Precision feeding of aquaculture, which is based on digital monitoring and AI-based formulation models, guarantees the optimization of feed to species, reduces waste, and enables traceable and sustainable production.
- This tendency is transforming product differentiation, reinforcing value-added feed solutions, and speeding up the transition process of more resilient and data-driven aquaculture practices worldwide.
Aquafeed-and-Aquaculture-Additives-Market Analysis and Segmental Data

Finfish Dominate Global Aquafeed and Aquaculture Additives Market
- The finfish segment leads the global aquafeed and aquaculture additives market due to its large production volume, diverse species, and uniform demand in both freshwater and marine aquaculture systems. Its scalability, good market familiarity, and versatility in diverse farming conditions make it the most commercially stable as well as technically advanced segment in the global aquafeed and aquaculture additives market.
- Major companies are also developing species-specific feed technologies in order to improve efficiency and environmental performance. For instance, in May 2024, Skretting presented its AmiNova concept of feed formulation to finfish, which uses an optimal digestible amino-acid profile to enhance its growth efficiency and reduce discharge of nitrogen and phosphorus to support sustainable aquaculture.
- The dominance is further consolidated by the strong consumption trends, in particular the one in Asia Pacific, and the increasing use of the high-performance formulations of feeds.
Asia Pacific Leads Global Aquafeed and Aquaculture Additives Market Demand
- The Asia Pacific leads global aquafeed and aquaculture additives market due to its huge aquaculture foundation, conducive climate, extensive coastlines and well-established seafood consumption culture. This leadership role is further strengthened by progressive government policies which place the aquaculture industry as a strategic contributor of food security and economic development.
- The region has high-tech manufacturing centers and innovation center throughout China, Japan and Thailand, which favour feed efficiency and domestic production. In April 2025, Skretting China introduced a new LifeStart in Zhuhai, using species-specific hatchery feeds, making Asia-Pacific a leader in the development of high-tech aquafeed.
- Favourable policies, increasing demand of exports and investments on sustainable feed technologies are also contributing to the growth. Governments are also facilitating the use of environmentally friendly aquaculture, better nutrition standards and research alliances in order to promote productivity.
- Asia Pacific region continues to be the global leader in sustainable aquaculture development, partly due to continued investment in technological innovation, high-quality aquafeed solutions, and advanced additive development.
Aquafeed-and-Aquaculture-Additives-Market Ecosystem
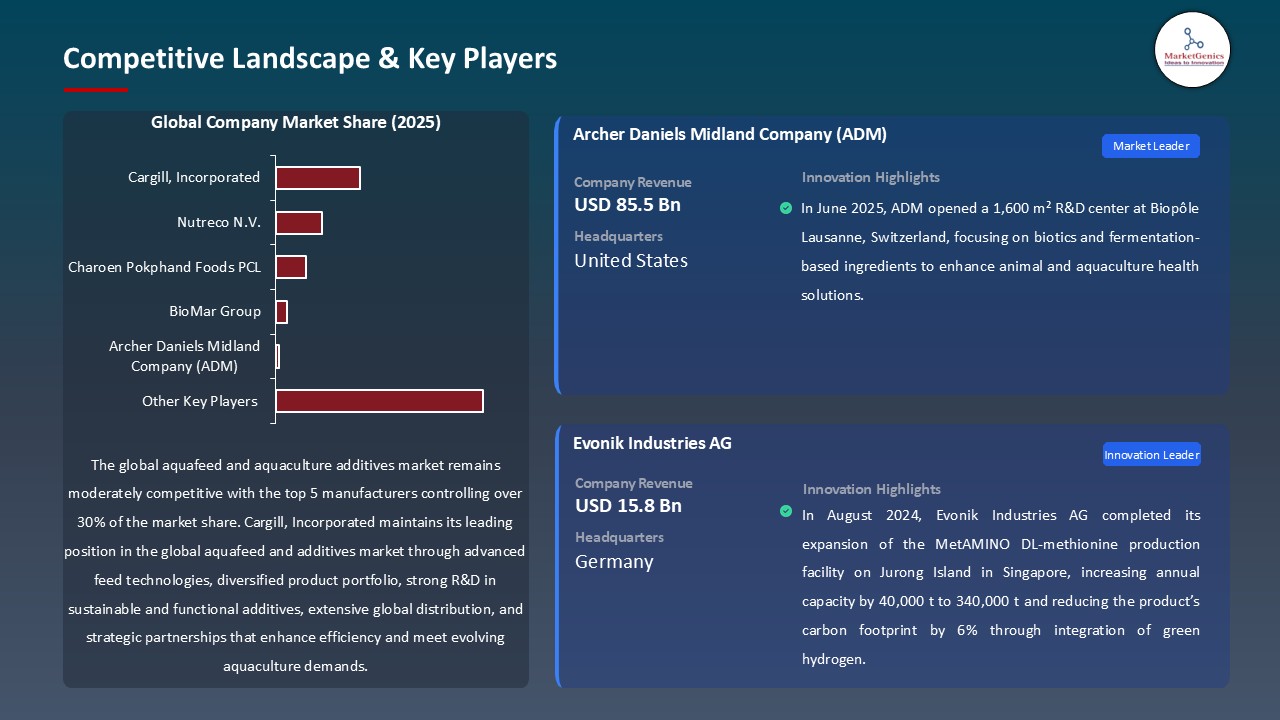
The aquafeed and aquaculture additives market is moderately fragmented with major companies controlling the largest market share due to modernized and worldwide technologies. The companies, including Cargill, Incorporated, Nutreco N.V., Charoen Pokphand Foods PCL, BioMar Group, and Archer Daniels Midland Company (ADM) are market leaders with a strong focus on state of the art feed processing technologies, precision nutrition, and integrated supply-chains to support large-scale aquaculture operations across the globe.
These key players also focus on niche or specialized solutions that will help them to speed up the innovation and make them unique in the market. For instance, Kemin has developed species-specific nutrition solutions to gut health and immune support in finfish, Alltech deploys microbial and enzyme enhanced feed additives in aquaculture, and Nutreco in its Skretting brand has developed species specific nutrition solutions to fish and shrimp. Similarly, BioMar also invests in sustainable raw materials and high performance formulations of feed and ADM is looking into diversifying ingredients both in the marine feed lines and in terrestrial feed lines.
Simultaneously, these manufactures are focusing on product diversification, portfolio growth and built-in solutions, Cargill and Alltech are expanding their additive portfolios to probiotics, enzymes, antioxidants and palatants BioMar is incorporating feed production, health service and traceability, Nutreco is providing feed and performance monitoring and digitalisation to enhance operational efficiency, productivity and sustainability.
Recent Development and Strategic Overview:
- In April 2025, Wittaya International Inc. and Maverick Innovation signed a Memorandum of Understanding to jointly accelerate the evaluation and commercialisation of feed ingredients and additives for aquaculture and poultry, combining Wittaya’s data-services with Maverick’s regional infrastructure in Bangladesh.
- In May 2025, BioMar Group declared that it had entered into a strategic alliance with Iceland based Födblandan ehf. To produce and supply the aquafeed on the improved production plant of Foturhardan in Reykjavik. The partnership will leverage BioMar international aquafeed capabilities and Fodarburlandan local production and distribution network, which will inevitably turn BioMar into the sole global feed technology company with a presence in Iceland and continue local supply chain resilience and sustainability.
Report Scope
|
Detail |
|
|
Market Size in 2025 |
USD 1.3 Bn |
|
Market Forecast Value in 2035 |
USD 2.2 Bn |
|
Growth Rate (CAGR) |
5.6% |
|
Forecast Period |
2026 – 2035 |
|
Historical Data Available for |
2021 – 2024 |
|
Market Size Units |
US$ Billion for Value Kilo Tons for Volume |
|
Report Format |
Electronic (PDF) + Excel |
|
North America |
Europe |
Asia Pacific |
Middle East |
Africa |
South America |
|
|
|
|
|
|
|
Companies Covered |
|||||
|
|
|
|
|
|
Aquafeed-and-Aquaculture-Additives-Market Segmentation and Highlights
|
Segment |
Sub-segment |
|
Aquafeed and Aquaculture Additives Market, By Product Type |
|
|
Aquafeed and Aquaculture Additives Market, By Ingredient Type |
|
|
Aquafeed and Aquaculture Additives Market, By Species |
|
|
Aquafeed and Aquaculture Additives Market, By Form |
|
|
Aquafeed and Aquaculture Additives Market, Distribution Channel |
|
|
Aquafeed and Aquaculture Additives Market, By End-users |
|
Frequently Asked Questions
Table of Contents
- 1. Research Methodology and Assumptions
- 1.1. Definitions
- 1.2. Research Design and Approach
- 1.3. Data Collection Methods
- 1.4. Base Estimates and Calculations
- 1.5. Forecasting Models
- 1.5.1. Key Forecast Factors & Impact Analysis
- 1.6. Secondary Research
- 1.6.1. Open Sources
- 1.6.2. Paid Databases
- 1.6.3. Associations
- 1.7. Primary Research
- 1.7.1. Primary Sources
- 1.7.2. Primary Interviews with Stakeholders across Ecosystem
- 2. Executive Summary
- 2.1. Global Aquafeed and Aquaculture Additives Market Outlook
- 2.1.1. Aquafeed and Aquaculture Additives Market Size (Volume - Kilo Tons and Value - US$ Bn), and Forecasts, 2021-2035
- 2.1.2. Compounded Annual Growth Rate Analysis
- 2.1.3. Growth Opportunity Analysis
- 2.1.4. Segmental Share Analysis
- 2.1.5. Geographical Share Analysis
- 2.2. Market Analysis and Facts
- 2.3. Supply-Demand Analysis
- 2.4. Competitive Benchmarking
- 2.5. Go-to- Market Strategy
- 2.5.1. Customer/ End-use Industry Assessment
- 2.5.2. Growth Opportunity Data, 2026-2035
- 2.5.2.1. Regional Data
- 2.5.2.2. Country Data
- 2.5.2.3. Segmental Data
- 2.5.3. Identification of Potential Market Spaces
- 2.5.4. GAP Analysis
- 2.5.5. Potential Attractive Price Points
- 2.5.6. Prevailing Market Risks & Challenges
- 2.5.7. Preferred Sales & Marketing Strategies
- 2.5.8. Key Recommendations and Analysis
- 2.5.9. A Way Forward
- 2.1. Global Aquafeed and Aquaculture Additives Market Outlook
- 3. Industry Data and Premium Insights
- 3.1. Global Aquafeed and Aquaculture Additives Industry Overview, 2025
- 3.1.1. Food & Beverages Industry Ecosystem Analysis
- 3.1.2. Key Trends for Food & Beverages Industry
- 3.1.3. Regional Distribution for Food & Beverages Industry
- 3.2. Supplier Customer Data
- 3.3. Technology Roadmap and Developments
- 3.4. Trade Analysis
- 3.4.1. Import & Export Analysis, 2025
- 3.4.2. Top Importing Countries
- 3.4.3. Top Exporting Countries
- 3.5. Trump Tariff Impact Analysis
- 3.5.1. Manufacturer
- 3.5.1.1. Based on the component & Raw material
- 3.5.2. Supply Chain
- 3.5.3. End Consumer
- 3.5.1. Manufacturer
- 3.6. Raw Material Analysis
- 3.1. Global Aquafeed and Aquaculture Additives Industry Overview, 2025
- 4. Market Overview
- 4.1. Market Dynamics
- 4.1.1. Drivers
- 4.1.1.1. Rising demand for protein-rich seafood and aquaculture products globally
- 4.1.1.2. Increasing adoption of specialized feed additives for growth, immunity, and disease prevention
- 4.1.1.3. Expansion of intensive and commercial aquaculture practices worldwide
- 4.1.2. Restraints
- 4.1.2.1. High cost of high-quality feed ingredients and additives
- 4.1.2.2. Stringent regulatory norms for feed safety and environmental impact
- 4.1.1. Drivers
- 4.2. Key Trend Analysis
- 4.3. Regulatory Framework
- 4.3.1. Key Regulations, Norms, and Subsidies, by Key Countries
- 4.3.2. Tariffs and Standards
- 4.3.3. Impact Analysis of Regulations on the Market
- 4.4. Value Chain Analysis
- 4.4.1. Raw Material Suppliers
- 4.4.2. Aquafeed and Aquaculture Additives Manufacturers
- 4.4.3. Dealers/ Distributors
- 4.4.4. End-Users/ Customers
- 4.5. Cost Structure Analysis
- 4.5.1. Parameter’s Share for Cost Associated
- 4.5.2. COGP vs COGS
- 4.5.3. Profit Margin Analysis
- 4.6. Pricing Analysis
- 4.6.1. Regional Pricing Analysis
- 4.6.2. Segmental Pricing Trends
- 4.6.3. Factors Influencing Pricing
- 4.7. Porter’s Five Forces Analysis
- 4.8. PESTEL Analysis
- 4.9. Global Aquafeed and Aquaculture Additives Market Demand
- 4.9.1. Historical Market Size – Volume (Kilo Tons) and Value (US$ Bn), 2020-2024
- 4.9.2. Current and Future Market Size – Volume (Kilo Tons) and Value (US$ Bn), 2026–2035
- 4.9.2.1. Y-o-Y Growth Trends
- 4.9.2.2. Absolute $ Opportunity Assessment
- 4.1. Market Dynamics
- 5. Competition Landscape
- 5.1. Competition structure
- 5.1.1. Fragmented v/s consolidated
- 5.2. Company Share Analysis, 2025
- 5.2.1. Global Company Market Share
- 5.2.2. By Region
- 5.2.2.1. North America
- 5.2.2.2. Europe
- 5.2.2.3. Asia Pacific
- 5.2.2.4. Middle East
- 5.2.2.5. Africa
- 5.2.2.6. South America
- 5.3. Product Comparison Matrix
- 5.3.1. Specifications
- 5.3.2. Market Positioning
- 5.3.3. Pricing
- 5.1. Competition structure
- 6. Global Aquafeed and Aquaculture Additives Market Analysis, by Product Type
- 6.1. Key Segment Analysis
- 6.2. Aquafeed and Aquaculture Additives Market Size (Volume - Kilo Tons and Value - US$ Bn), Analysis, and Forecasts, by Product Type, 2021-2035
- 6.2.1. Aquafeed
- 6.2.1.1. Starter Feed
- 6.2.1.2. Grower Feed
- 6.2.1.3. Finisher Feed
- 6.2.1.4. Breeder Feed
- 6.2.1.5. Others
- 6.2.2. Aquaculture Additives
- 6.2.2.1. Nutritional Additives
- 6.2.2.2. Medicinal Additives
- 6.2.2.3. Functional Additives
- 6.2.2.4. Pigment Additives
- 6.2.2.5. Others
- 6.2.1. Aquafeed
- 7. Global Aquafeed and Aquaculture Additives Market Analysis, by Ingredient Type
- 7.1. Key Segment Analysis
- 7.2. Aquafeed and Aquaculture Additives Market Size (Volume - Kilo Tons and Value - US$ Bn), Analysis, and Forecasts, by Ingredient Type, 2021-2035
- 7.2.1. Protein Sources
- 7.2.1.1. Fish Meal
- 7.2.1.2. Soybean Meal
- 7.2.1.3. Poultry Meal
- 7.2.1.4. Blood Meal
- 7.2.1.5. Insect Meal
- 7.2.1.6. Single Cell Protein
- 7.2.1.7. Others
- 7.2.2. Lipid Sources
- 7.2.2.1. Fish Oil
- 7.2.2.2. Vegetable Oils
- 7.2.2.3. Algal Oil
- 7.2.2.4. Others
- 7.2.3. Carbohydrate Sources
- 7.2.3.1. Wheat
- 7.2.3.2. Corn
- 7.2.3.3. Rice Bran
- 7.2.3.4. Others
- 7.2.4. Others
- 7.2.1. Protein Sources
- 8. Global Aquafeed and Aquaculture Additives Market Analysis, by Species
- 8.1. Key Segment Analysis
- 8.2. Aquafeed and Aquaculture Additives Market Size (Volume - Kilo Tons and Value - US$ Bn), Analysis, and Forecasts, by Species, 2021-2035
- 8.2.1. Finfish
- 8.2.2. Crustaceans
- 8.2.3. Mollusks
- 8.2.4. Others (Echinoderms, Aquatic Plants, etc.)
- 9. Global Aquafeed and Aquaculture Additives Market Analysis, by Form
- 9.1. Key Segment Analysis
- 9.2. Aquafeed and Aquaculture Additives Market Size (Volume - Kilo Tons and Value - US$ Bn), Analysis, and Forecasts, by Form, 2021-2035
- 9.2.1. Dry Feed
- 9.2.1.1. Pellets
- 9.2.1.2. Crumbles
- 9.2.1.3. Flakes
- 9.2.1.4. Granules
- 9.2.1.5. Others
- 9.2.2. Moist/Semi-Moist Feed
- 9.2.3. Liquid Feed
- 9.2.1. Dry Feed
- 10. Global Aquafeed and Aquaculture Additives Market Analysis, by Distribution Channel
- 10.1. Key Segment Analysis
- 10.2. Aquafeed and Aquaculture Additives Market Size (Volume - Kilo Tons and Value - US$ Bn), Analysis, and Forecasts, by Distribution Channel, 2021-2035
- 10.2.1. Direct Sales
- 10.2.2. Distributors
- 10.2.3. Retailers
- 10.2.4. Online Channels
- 11. Global Aquafeed and Aquaculture Additives Market Analysis, by End-users
- 11.1. Key Segment Analysis
- 11.2. Aquafeed and Aquaculture Additives Market Size (Volume - Kilo Tons and Value - US$ Bn), Analysis, and Forecasts, by End-users, 2021-2035
- 11.2.1. Commercial Aquaculture Farms
- 11.2.1.1. Large-Scale Fish Farming
- 11.2.1.2. Shrimp Farming
- 11.2.1.3. Integrated Multi-Trophic Aquaculture (IMTA)
- 11.2.1.4. Offshore Aquaculture
- 11.2.1.5. Hatchery Operations
- 11.2.1.6. Others
- 11.2.2. Small-Scale/Artisanal Aquaculture
- 11.2.2.1. Subsistence Farming
- 11.2.2.2. Community-Based Aquaculture
- 11.2.2.3. Backyard Fish Farming
- 11.2.2.4. Pond Culture Systems
- 11.2.2.5. Others
- 11.2.3. Ornamental Fish Industry
- 11.2.3.1. Tropical Fish Breeding
- 11.2.3.2. Koi Fish Farming
- 11.2.3.3. Aquarium Fish Production
- 11.2.3.4. Marine Ornamental Species
- 11.2.3.5. Others
- 11.2.4. Hatcheries & Nurseries
- 11.2.4.1. Seed Production
- 11.2.4.2. Larval Rearing
- 11.2.4.3. Fry Production
- 11.2.4.4. Fingerling Development
- 11.2.4.5. Others
- 11.2.5. Aquaponics Operations
- 11.2.6. Pharmaceutical & Nutraceutical Industry
- 11.2.7. Research & Development Institutions
- 11.2.1. Commercial Aquaculture Farms
- 12. Global Aquafeed and Aquaculture Additives Market Analysis and Forecasts, by Region
- 12.1. Key Findings
- 12.2. Aquafeed and Aquaculture Additives Market Size (Volume - Kilo Tons and Value - US$ Bn), Analysis, and Forecasts, by Region, 2021-2035
- 12.2.1. North America
- 12.2.2. Europe
- 12.2.3. Asia Pacific
- 12.2.4. Middle East
- 12.2.5. Africa
- 12.2.6. South America
- 13. North America Aquafeed and Aquaculture Additives Market Analysis
- 13.1. Key Segment Analysis
- 13.2. Regional Snapshot
- 13.3. North America Aquafeed and Aquaculture Additives Market Size Volume - Kilo Tons and Value - US$ Bn), Analysis, and Forecasts, 2021-2035
- 13.3.1. Product Type
- 13.3.2. Ingredient Type
- 13.3.3. Species
- 13.3.4. Form
- 13.3.5. Distribution Channel
- 13.3.6. End-users
- 13.3.7. Country
- 13.3.7.1. USA
- 13.3.7.2. Canada
- 13.3.7.3. Mexico
- 13.4. USA Aquafeed and Aquaculture Additives Market
- 13.4.1. Country Segmental Analysis
- 13.4.2. Product Type
- 13.4.3. Ingredient Type
- 13.4.4. Species
- 13.4.5. Form
- 13.4.6. Distribution Channel
- 13.4.7. End-users
- 13.5. Canada Aquafeed and Aquaculture Additives Market
- 13.5.1. Country Segmental Analysis
- 13.5.2. Product Type
- 13.5.3. Ingredient Type
- 13.5.4. Species
- 13.5.5. Form
- 13.5.6. Distribution Channel
- 13.5.7. End-users
- 13.6. Mexico Aquafeed and Aquaculture Additives Market
- 13.6.1. Country Segmental Analysis
- 13.6.2. Product Type
- 13.6.3. Ingredient Type
- 13.6.4. Species
- 13.6.5. Form
- 13.6.6. Distribution Channel
- 13.6.7. End-users
- 14. Europe Aquafeed and Aquaculture Additives Market Analysis
- 14.1. Key Segment Analysis
- 14.2. Regional Snapshot
- 14.3. Europe Aquafeed and Aquaculture Additives Market Size (Volume - Kilo Tons and Value - US$ Bn), Analysis, and Forecasts, 2021-2035
- 14.3.1. Product Type
- 14.3.2. Ingredient Type
- 14.3.3. Species
- 14.3.4. Form
- 14.3.5. Distribution Channel
- 14.3.6. End-users
- 14.3.7. Country
- 14.3.7.1. Germany
- 14.3.7.2. United Kingdom
- 14.3.7.3. France
- 14.3.7.4. Italy
- 14.3.7.5. Spain
- 14.3.7.6. Netherlands
- 14.3.7.7. Nordic Countries
- 14.3.7.8. Poland
- 14.3.7.9. Russia & CIS
- 14.3.7.10. Rest of Europe
- 14.4. Germany Aquafeed and Aquaculture Additives Market
- 14.4.1. Country Segmental Analysis
- 14.4.2. Product Type
- 14.4.3. Ingredient Type
- 14.4.4. Species
- 14.4.5. Form
- 14.4.6. Distribution Channel
- 14.4.7. End-users
- 14.5. United Kingdom Aquafeed and Aquaculture Additives Market
- 14.5.1. Country Segmental Analysis
- 14.5.2. Product Type
- 14.5.3. Ingredient Type
- 14.5.4. Species
- 14.5.5. Form
- 14.5.6. Distribution Channel
- 14.5.7. End-users
- 14.6. France Aquafeed and Aquaculture Additives Market
- 14.6.1. Country Segmental Analysis
- 14.6.2. Product Type
- 14.6.3. Ingredient Type
- 14.6.4. Species
- 14.6.5. Form
- 14.6.6. Distribution Channel
- 14.6.7. End-users
- 14.7. Italy Aquafeed and Aquaculture Additives Market
- 14.7.1. Country Segmental Analysis
- 14.7.2. Product Type
- 14.7.3. Ingredient Type
- 14.7.4. Species
- 14.7.5. Form
- 14.7.6. Distribution Channel
- 14.7.7. End-users
- 14.8. Spain Aquafeed and Aquaculture Additives Market
- 14.8.1. Country Segmental Analysis
- 14.8.2. Product Type
- 14.8.3. Ingredient Type
- 14.8.4. Species
- 14.8.5. Form
- 14.8.6. Distribution Channel
- 14.8.7. End-users
- 14.9. Netherlands Aquafeed and Aquaculture Additives Market
- 14.9.1. Country Segmental Analysis
- 14.9.2. Product Type
- 14.9.3. Ingredient Type
- 14.9.4. Species
- 14.9.5. Form
- 14.9.6. Distribution Channel
- 14.9.7. End-users
- 14.10. Nordic Countries Aquafeed and Aquaculture Additives Market
- 14.10.1. Country Segmental Analysis
- 14.10.2. Product Type
- 14.10.3. Ingredient Type
- 14.10.4. Species
- 14.10.5. Form
- 14.10.6. Distribution Channel
- 14.10.7. End-users
- 14.11. Poland Aquafeed and Aquaculture Additives Market
- 14.11.1. Country Segmental Analysis
- 14.11.2. Product Type
- 14.11.3. Ingredient Type
- 14.11.4. Species
- 14.11.5. Form
- 14.11.6. Distribution Channel
- 14.11.7. End-users
- 14.12. Russia & CIS Aquafeed and Aquaculture Additives Market
- 14.12.1. Country Segmental Analysis
- 14.12.2. Product Type
- 14.12.3. Ingredient Type
- 14.12.4. Species
- 14.12.5. Form
- 14.12.6. Distribution Channel
- 14.12.7. End-users
- 14.13. Rest of Europe Aquafeed and Aquaculture Additives Market
- 14.13.1. Country Segmental Analysis
- 14.13.2. Product Type
- 14.13.3. Ingredient Type
- 14.13.4. Species
- 14.13.5. Form
- 14.13.6. Distribution Channel
- 14.13.7. End-users
- 15. Asia Pacific Aquafeed and Aquaculture Additives Market Analysis
- 15.1. Key Segment Analysis
- 15.2. Regional Snapshot
- 15.3. Asia Aquafeed and Aquaculture Additives Market Size (Volume - Kilo Tons and Value - US$ Bn), Analysis, and Forecasts, 2021-2035
- 15.3.1. Product Type
- 15.3.2. Ingredient Type
- 15.3.3. Species
- 15.3.4. Form
- 15.3.5. Distribution Channel
- 15.3.6. End-users
- 15.3.7. Country
- 15.3.7.1. China
- 15.3.7.2. India
- 15.3.7.3. Japan
- 15.3.7.4. South Korea
- 15.3.7.5. Australia and New Zealand
- 15.3.7.6. Indonesia
- 15.3.7.7. Malaysia
- 15.3.7.8. Thailand
- 15.3.7.9. Vietnam
- 15.3.7.10. Rest of Asia Pacific
- 15.4. China Aquafeed and Aquaculture Additives Market
- 15.4.1. Country Segmental Analysis
- 15.4.2. Product Type
- 15.4.3. Ingredient Type
- 15.4.4. Species
- 15.4.5. Form
- 15.4.6. Distribution Channel
- 15.4.7. End-users
- 15.5. India Aquafeed and Aquaculture Additives Market
- 15.5.1. Country Segmental Analysis
- 15.5.2. Product Type
- 15.5.3. Ingredient Type
- 15.5.4. Species
- 15.5.5. Form
- 15.5.6. Distribution Channel
- 15.5.7. End-users
- 15.6. Japan Aquafeed and Aquaculture Additives Market
- 15.6.1. Country Segmental Analysis
- 15.6.2. Product Type
- 15.6.3. Ingredient Type
- 15.6.4. Species
- 15.6.5. Form
- 15.6.6. Distribution Channel
- 15.6.7. End-users
- 15.7. South Korea Aquafeed and Aquaculture Additives Market
- 15.7.1. Country Segmental Analysis
- 15.7.2. Product Type
- 15.7.3. Ingredient Type
- 15.7.4. Species
- 15.7.5. Form
- 15.7.6. Distribution Channel
- 15.7.7. End-users
- 15.8. Australia and New Zealand Aquafeed and Aquaculture Additives Market
- 15.8.1. Country Segmental Analysis
- 15.8.2. Product Type
- 15.8.3. Ingredient Type
- 15.8.4. Species
- 15.8.5. Form
- 15.8.6. Distribution Channel
- 15.8.7. End-users
- 15.9. Indonesia Aquafeed and Aquaculture Additives Market
- 15.9.1. Country Segmental Analysis
- 15.9.2. Product Type
- 15.9.3. Ingredient Type
- 15.9.4. Species
- 15.9.5. Form
- 15.9.6. Distribution Channel
- 15.9.7. End-users
- 15.10. Malaysia Aquafeed and Aquaculture Additives Market
- 15.10.1. Country Segmental Analysis
- 15.10.2. Product Type
- 15.10.3. Ingredient Type
- 15.10.4. Species
- 15.10.5. Form
- 15.10.6. Distribution Channel
- 15.10.7. End-users
- 15.11. Thailand Aquafeed and Aquaculture Additives Market
- 15.11.1. Country Segmental Analysis
- 15.11.2. Product Type
- 15.11.3. Ingredient Type
- 15.11.4. Species
- 15.11.5. Form
- 15.11.6. Distribution Channel
- 15.11.7. End-users
- 15.12. Vietnam Aquafeed and Aquaculture Additives Market
- 15.12.1. Country Segmental Analysis
- 15.12.2. Product Type
- 15.12.3. Ingredient Type
- 15.12.4. Species
- 15.12.5. Form
- 15.12.6. Distribution Channel
- 15.12.7. End-users
- 15.13. Rest of Asia Pacific Aquafeed and Aquaculture Additives Market
- 15.13.1. Country Segmental Analysis
- 15.13.2. Product Type
- 15.13.3. Ingredient Type
- 15.13.4. Species
- 15.13.5. Form
- 15.13.6. Distribution Channel
- 15.13.7. End-users
- 16. Middle East Aquafeed and Aquaculture Additives Market Analysis
- 16.1. Key Segment Analysis
- 16.2. Regional Snapshot
- 16.3. Middle East Aquafeed and Aquaculture Additives Market Size (Volume - Kilo Tons and Value - US$ Bn), Analysis, and Forecasts, 2021-2035
- 16.3.1. Product Type
- 16.3.2. Ingredient Type
- 16.3.3. Species
- 16.3.4. Form
- 16.3.5. Distribution Channel
- 16.3.6. End-users
- 16.3.7. Country
- 16.3.7.1. Turkey
- 16.3.7.2. UAE
- 16.3.7.3. Saudi Arabia
- 16.3.7.4. Israel
- 16.3.7.5. Rest of Middle East
- 16.4. Turkey Aquafeed and Aquaculture Additives Market
- 16.4.1. Country Segmental Analysis
- 16.4.2. Product Type
- 16.4.3. Ingredient Type
- 16.4.4. Species
- 16.4.5. Form
- 16.4.6. Distribution Channel
- 16.4.7. End-users
- 16.5. UAE Aquafeed and Aquaculture Additives Market
- 16.5.1. Country Segmental Analysis
- 16.5.2. Product Type
- 16.5.3. Ingredient Type
- 16.5.4. Species
- 16.5.5. Form
- 16.5.6. Distribution Channel
- 16.5.7. End-users
- 16.6. Saudi Arabia Aquafeed and Aquaculture Additives Market
- 16.6.1. Country Segmental Analysis
- 16.6.2. Product Type
- 16.6.3. Ingredient Type
- 16.6.4. Species
- 16.6.5. Form
- 16.6.6. Distribution Channel
- 16.6.7. End-users
- 16.7. Israel Aquafeed and Aquaculture Additives Market
- 16.7.1. Country Segmental Analysis
- 16.7.2. Product Type
- 16.7.3. Ingredient Type
- 16.7.4. Species
- 16.7.5. Form
- 16.7.6. Distribution Channel
- 16.7.7. End-users
- 16.8. Rest of Middle East Aquafeed and Aquaculture Additives Market
- 16.8.1. Country Segmental Analysis
- 16.8.2. Product Type
- 16.8.3. Ingredient Type
- 16.8.4. Species
- 16.8.5. Form
- 16.8.6. Distribution Channel
- 16.8.7. End-users
- 17. Africa Aquafeed and Aquaculture Additives Market Analysis
- 17.1. Key Segment Analysis
- 17.2. Regional Snapshot
- 17.3. Africa Aquafeed and Aquaculture Additives Market Size (Volume - Kilo Tons and Value - US$ Bn), Analysis, and Forecasts, 2021-2035
- 17.3.1. Product Type
- 17.3.2. Ingredient Type
- 17.3.3. Species
- 17.3.4. Form
- 17.3.5. Distribution Channel
- 17.3.6. End-users
- 17.3.7. Country
- 17.3.7.1. South Africa
- 17.3.7.2. Egypt
- 17.3.7.3. Nigeria
- 17.3.7.4. Algeria
- 17.3.7.5. Rest of Africa
- 17.4. South Africa Aquafeed and Aquaculture Additives Market
- 17.4.1. Country Segmental Analysis
- 17.4.2. Product Type
- 17.4.3. Ingredient Type
- 17.4.4. Species
- 17.4.5. Form
- 17.4.6. Distribution Channel
- 17.4.7. End-users
- 17.5. Egypt Aquafeed and Aquaculture Additives Market
- 17.5.1. Country Segmental Analysis
- 17.5.2. Product Type
- 17.5.3. Ingredient Type
- 17.5.4. Species
- 17.5.5. Form
- 17.5.6. Distribution Channel
- 17.5.7. End-users
- 17.6. Nigeria Aquafeed and Aquaculture Additives Market
- 17.6.1. Country Segmental Analysis
- 17.6.2. Product Type
- 17.6.3. Ingredient Type
- 17.6.4. Species
- 17.6.5. Form
- 17.6.6. Distribution Channel
- 17.6.7. End-users
- 17.7. Algeria Aquafeed and Aquaculture Additives Market
- 17.7.1. Country Segmental Analysis
- 17.7.2. Product Type
- 17.7.3. Ingredient Type
- 17.7.4. Species
- 17.7.5. Form
- 17.7.6. Distribution Channel
- 17.7.7. End-users
- 17.8. Rest of Africa Aquafeed and Aquaculture Additives Market
- 17.8.1. Country Segmental Analysis
- 17.8.2. Product Type
- 17.8.3. Ingredient Type
- 17.8.4. Species
- 17.8.5. Form
- 17.8.6. Distribution Channel
- 17.8.7. End-users
- 18. South America Aquafeed and Aquaculture Additives Market Analysis
- 18.1. Key Segment Analysis
- 18.2. Regional Snapshot
- 18.3. South America Aquafeed and Aquaculture Additives Market Size (Volume - Kilo Tons and Value - US$ Bn), Analysis, and Forecasts, 2021-2035
- 18.3.1. Product Type
- 18.3.2. Ingredient Type
- 18.3.3. Species
- 18.3.4. Form
- 18.3.5. Distribution Channel
- 18.3.6. End-users
- 18.3.7. Country
- 18.3.7.1. Brazil
- 18.3.7.2. Argentina
- 18.3.7.3. Rest of South America
- 18.4. Brazil Aquafeed and Aquaculture Additives Market
- 18.4.1. Country Segmental Analysis
- 18.4.2. Product Type
- 18.4.3. Ingredient Type
- 18.4.4. Species
- 18.4.5. Form
- 18.4.6. Distribution Channel
- 18.4.7. End-users
- 18.5. Argentina Aquafeed and Aquaculture Additives Market
- 18.5.1. Country Segmental Analysis
- 18.5.2. Product Type
- 18.5.3. Ingredient Type
- 18.5.4. Species
- 18.5.5. Form
- 18.5.6. Distribution Channel
- 18.5.7. End-users
- 18.6. Rest of South America Aquafeed and Aquaculture Additives Market
- 18.6.1. Country Segmental Analysis
- 18.6.2. Product Type
- 18.6.3. Ingredient Type
- 18.6.4. Species
- 18.6.5. Form
- 18.6.6. Distribution Channel
- 18.6.7. End-users
- 19. Key Players/ Company Profile
- 19.1. Aller Aqua A/S
- 19.1.1. Company Details/ Overview
- 19.1.2. Company Financials
- 19.1.3. Key Customers and Competitors
- 19.1.4. Business/ Industry Portfolio
- 19.1.5. Product Portfolio/ Specification Details
- 19.1.6. Pricing Data
- 19.1.7. Strategic Overview
- 19.1.8. Recent Developments
- 19.2. Alltech Inc.
- 19.3. Archer Daniels Midland Company (ADM)
- 19.4. Avanti Feeds Limited
- 19.5. Beneo GmbH
- 19.6. BioMar Group
- 19.7. Biomin Holding GmbH
- 19.8. Cargill, Incorporated
- 19.9. Charoen Pokphand Foods PCL
- 19.10. De Heus Animal Nutrition
- 19.11. Dibaq Acuicultura
- 19.12. Growel Feeds Pvt. Ltd.
- 19.13. Guangdong Evergreen Feed Industry Co., Ltd.
- 19.14. Kemin Industries, Inc.
- 19.15. Lallemand Inc.
- 19.16. Novus International, Inc.
- 19.17. Nutreco N.V.
- 19.18. Nutriad International NV
- 19.19. Olmix Group
- 19.20. Ridley Corporation Limited
- 19.21. Other Key Players
- 19.1. Aller Aqua A/S
Note* - This is just tentative list of players. While providing the report, we will cover more number of players based on their revenue and share for each geography
Research Design
Our research design integrates both demand-side and supply-side analysis through a balanced combination of primary and secondary research methodologies. By utilizing both bottom-up and top-down approaches alongside rigorous data triangulation methods, we deliver robust market intelligence that supports strategic decision-making.
MarketGenics' comprehensive research design framework ensures the delivery of accurate, reliable, and actionable market intelligence. Through the integration of multiple research approaches, rigorous validation processes, and expert analysis, we provide our clients with the insights needed to make informed strategic decisions and capitalize on market opportunities.

MarketGenics leverages a dedicated industry panel of experts and a comprehensive suite of paid databases to effectively collect, consolidate, and analyze market intelligence.
Our approach has consistently proven to be reliable and effective in generating accurate market insights, identifying key industry trends, and uncovering emerging business opportunities.
Through both primary and secondary research, we capture and analyze critical company-level data such as manufacturing footprints, including technical centers, R&D facilities, sales offices, and headquarters.
Our expert panel further enhances our ability to estimate market size for specific brands based on validated field-level intelligence.
Our data mining techniques incorporate both parametric and non-parametric methods, allowing for structured data collection, sorting, processing, and cleaning.
Demand projections are derived from large-scale data sets analyzed through proprietary algorithms, culminating in robust and reliable market sizing.
Research Approach
The bottom-up approach builds market estimates by starting with the smallest addressable market units and systematically aggregating them to create comprehensive market size projections.
This method begins with specific, granular data points and builds upward to create the complete market landscape.
Customer Analysis → Segmental Analysis → Geographical Analysis
The top-down approach starts with the broadest possible market data and systematically narrows it down through a series of filters and assumptions to arrive at specific market segments or opportunities.
This method begins with the big picture and works downward to increasingly specific market slices.
TAM → SAM → SOM


Research Methods
Desk / Secondary Research
While analysing the market, we extensively study secondary sources, directories, and databases to identify and collect information useful for this technical, market-oriented, and commercial report. Secondary sources that we utilize are not only the public sources, but it is a combination of Open Source, Associations, Paid Databases, MG Repository & Knowledgebase, and others.
- Company websites, annual reports, financial reports, broker reports, and investor presentations
- National government documents, statistical databases and reports
- News articles, press releases and web-casts specific to the companies operating in the market, Magazines, reports, and others
- We gather information from commercial data sources for deriving company specific data such as segmental revenue, share for geography, product revenue, and others
- Internal and external proprietary databases (industry-specific), relevant patent, and regulatory databases
- Governing Bodies, Government Organizations
- Relevant Authorities, Country-specific Associations for Industries
We also employ the model mapping approach to estimate the product level market data through the players' product portfolio
Primary Research
Primary research/ interviews is vital in analyzing the market. Most of the cases involves paid primary interviews. Primary sources include primary interviews through e-mail interactions, telephonic interviews, surveys as well as face-to-face interviews with the different stakeholders across the value chain including several industry experts.
| Type of Respondents | Number of Primaries |
|---|---|
| Tier 2/3 Suppliers | ~20 |
| Tier 1 Suppliers | ~25 |
| End-users | ~25 |
| Industry Expert/ Panel/ Consultant | ~30 |
| Total | ~100 |
MG Knowledgebase
• Repository of industry blog, newsletter and case studies
• Online platform covering detailed market reports, and company profiles
Forecasting Factors and Models
Forecasting Factors
- Historical Trends – Past market patterns, cycles, and major events that shaped how markets behave over time. Understanding past trends helps predict future behavior.
- Industry Factors – Specific characteristics of the industry like structure, regulations, and innovation cycles that affect market dynamics.
- Macroeconomic Factors – Economic conditions like GDP growth, inflation, and employment rates that affect how much money people have to spend.
- Demographic Factors – Population characteristics like age, income, and location that determine who can buy your product.
- Technology Factors – How quickly people adopt new technology and how much technology infrastructure exists.
- Regulatory Factors – Government rules, laws, and policies that can help or restrict market growth.
- Competitive Factors – Analyzing competition structure such as degree of competition and bargaining power of buyers and suppliers.
Forecasting Models / Techniques
Multiple Regression Analysis
- Identify and quantify factors that drive market changes
- Statistical modeling to establish relationships between market drivers and outcomes
Time Series Analysis – Seasonal Patterns
- Understand regular cyclical patterns in market demand
- Advanced statistical techniques to separate trend, seasonal, and irregular components
Time Series Analysis – Trend Analysis
- Identify underlying market growth patterns and momentum
- Statistical analysis of historical data to project future trends
Expert Opinion – Expert Interviews
- Gather deep industry insights and contextual understanding
- In-depth interviews with key industry stakeholders
Multi-Scenario Development
- Prepare for uncertainty by modeling different possible futures
- Creating optimistic, pessimistic, and most likely scenarios
Time Series Analysis – Moving Averages
- Sophisticated forecasting for complex time series data
- Auto-regressive integrated moving average models with seasonal components
Econometric Models
- Apply economic theory to market forecasting
- Sophisticated economic models that account for market interactions
Expert Opinion – Delphi Method
- Harness collective wisdom of industry experts
- Structured, multi-round expert consultation process
Monte Carlo Simulation
- Quantify uncertainty and probability distributions
- Thousands of simulations with varying input parameters
Research Analysis
Our research framework is built upon the fundamental principle of validating market intelligence from both demand and supply perspectives. This dual-sided approach ensures comprehensive market understanding and reduces the risk of single-source bias.
Demand-Side Analysis: We understand end-user/application behavior, preferences, and market needs along with the penetration of the product for specific application.
Supply-Side Analysis: We estimate overall market revenue, analyze the segmental share along with industry capacity, competitive landscape, and market structure.
Validation & Evaluation
Data triangulation is a validation technique that uses multiple methods, sources, or perspectives to examine the same research question, thereby increasing the credibility and reliability of research findings. In market research, triangulation serves as a quality assurance mechanism that helps identify and minimize bias, validate assumptions, and ensure accuracy in market estimates.
- Data Source Triangulation – Using multiple data sources to examine the same phenomenon
- Methodological Triangulation – Using multiple research methods to study the same research question
- Investigator Triangulation – Using multiple researchers or analysts to examine the same data
- Theoretical Triangulation – Using multiple theoretical perspectives to interpret the same data

Custom Market Research Services
We will customise the research for you, in case the report listed above does not meet your requirements.
Get 10% Free Customisation