Consumer Electronics Market Size, Share & Trends Analysis Report by Product Type (Audio & Video Equipment, Computing Devices, Mobile Devices, Home Appliances, Gaming Consoles & Accessories, Camera & Imaging Devices, Wearable Devices, Other Product Types), Technology, Consumer Demographics, End-users, Distribution Channel, Price Range, and Geography (North America, Europe, Asia Pacific, Middle East, Africa, and South America) – Global Industry Data, Trends, and Forecasts, 2026–2035
|
|
|
Segmental Data Insights |
|
|
Demand Trends |
|
|
Competitive Landscape |
|
|
Strategic Development |
|
|
Future Outlook & Opportunities |
|
Consumer Electronics Market Size, Share, and Growth
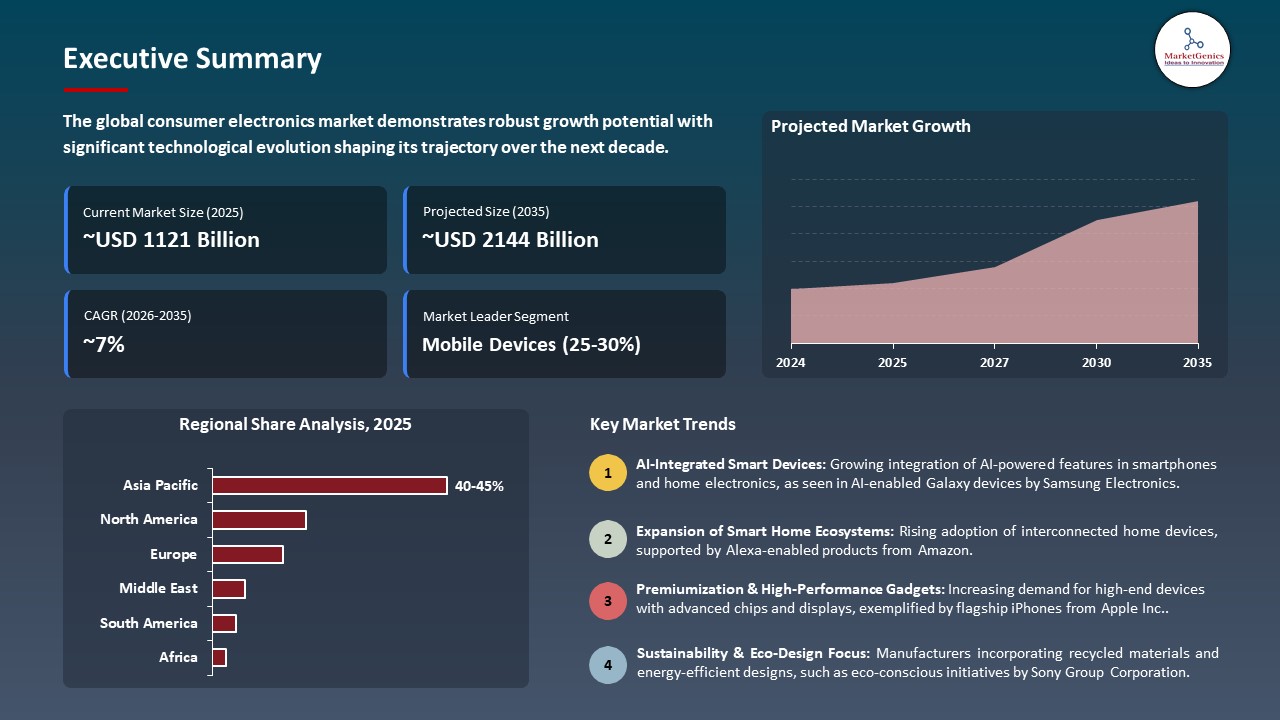
The global consumer electronics market is exhibiting strong growth, with an estimated value of USD 1120.9 billion in 2025 and USD 2143.9 billion by 2035, achieving a CAGR of 6.7%, during the forecast period. The global consumer electronics market is driven by rapid technological advancements, increasing adoption of smart and connected devices, and rising consumer preference for high-performance digital lifestyles.
Mr. Brian Jung- Director Media Entertainment Solution (MS) - LG Electronics India, said, “At LG, we believe the future of television lies in personalization powered by intelligence. With our 2025 OLEDevo and QNEDevo line-up, we are not just introducing new TVs, we are introducing smarter companions that understand our users, adapt to their preferences, and elevate their everyday experiences. Backed by our upgraded Alpha AI processor, this new range reflects our commitment to innovation and customer-centric design.”
The high pace of innovation in foldable and next-generation mobile devices is driving the consumer electronics market, with manufacturers constantly broadening the form-factor opportunities to ensure the ongoing fulfillment of consumer expectations and attention of technology-oriented users. For instance, in December 2025, Samsung Electronics has launched a new smartphone called Galaxy Z, which has a triple-fold design that can be extended to a tablet-like monitor. The next-generation and foldable devices innovation leads to consumer adoption, premium pricing, and competitiveness in the market.
Additionally, immersion wearable technologies, which seamlessly incorporate digital experiences into daily life, are driving the consumer electronics market by improving utility, convenience, and user engagement. For instance, in September 2025, Meta Platforms released its Meta Ray-Ban Display smart glasses the first consumer-ready smart glasses with a high-resolution display by the company indicating the rising demand by advanced augmented reality and AI-enhanced electronics. The immersive wearable technologies lead to the growth of the market, leading to the high demand of the premium products and increasing the pace of engagement of the consumers to the next-level electronics.
The global consumer electronics market offers adjacent opportunities in smart home devices, wearable health technology, augmented and virtual reality (AR/VR), electric vehicle infotainment systems, and IoT-enabled industrial electronics. These segments also take advantage of the convergence of technology and the increased use of digital products, allowing manufacturers of electronics to diversify their products, acquire new sources of revenue and enhance integration of the ecosystem. The growth into the adjacent technology driven markets will increase the revenue possibilities, foster innovation and increase long term competitive advantage in consumer electronics.
Consumer Electronics Market Dynamics and Trends
Driver: Expansion of AI‑Integrated Connected Ecosystems Enhancing Device Value
-
The adoption of AI-enabled connected ecosystems, in which tech firms use AI to provide highly personalized, seamless, and intuitive experiences across mobile devices, wearables, computing hardware, and smart home solutions, is driving the consumer electronics market.
- The transformation of the industry of isolated products to AI-powered systems that make operations more streamlined, improve performance and create deeper engagement with consumers. For instance, Samsung Electronics announced its Galaxy S26 line, Galaxy Buds4, Galaxy Book6 and Galaxy Tab S11 as part of its extended Galaxy AI ecosystem in March 2026. The showcased AI features were predictive of the user needs, increased productivity and delivered a consistent cross-device experience.
- The implementation of AI within the framework of device ecosystems supports product differentiation, stimulates the use of multiple devices, and leads to the growth of the market by improving interaction with the user and ecosystem lock-in.
Restraint: Global Memory and Component Supply Constraints Limiting Production
-
Continued limitations of memory and key parts in consumer electronics have the potential to limit capacity, raise the cost of input, and slow down product introductions.
- The overgrowth in the number of AI-enabled devices and the need to use high-performance computers is shifting the DRAM and NAND flash to enterprise applications, which causes supply bottlenecks in consumer electronics and requires prepayment of commitments to secure stock.
- These supply constraints are concentrated in component networks, though they have ripple effects such as delayed introduction of products, limited inventory, and end consumer price inflation.
- Shortages in critical components constrain manufacturing output, impede innovation cycles, and may slow overall market growth by limiting the availability of consumer electronics products.
Opportunity: Growth of Next‑Generation Immersive Display Technologies
-
Critical expansion in the consumer electronics market includes the usage and commercialization of subsequent generation immersive displays technology, which improves the engagement of the user and introduces a new application. In December 2025, Samsung Electronics enlarged its Micro RGB TV collection in 2026, including ultra-large and high-end models with more color accuracy, intelligent processing, and stunning visual displays.
- The display technologies are advanced and serve growing demand of immersive viewing experience as a result of streaming, gaming and digital signage use. The success of companies in consumer electronics in attracting premium consumers and expanding into other related categories like commercial immersive solutions and digital signage through continuous innovation in display quality, form factors and performance.
- Advancements in immersive display technologies expand product lines, and grow high-end markets, and enhance user experience, thus ensuring revenue differentiation and market development.
Key Trend: Increasing Adoption of AI‑Driven Manufacturing for Operational Efficiency
-
The increasing popularity of AI-driven manufacturing is a recent trend in the consumer electronics industry, with businesses increasingly incorporating artificial intelligence into their production processes to enhance efficiency, quality, and responsiveness. In March 2026, Samsung Electronics presented a long-term plan to go to AI-Driven Factories by 2030 by operating digital twins, AI agents, and real-time data analytics throughout the value chain, including material logistics, production and quality control.
- Introducing AI into the whole manufacturing processes, companies are planning to accomplish self-reliant operations, reduce the number of defects and optimize the use of resources, and improve throughput. This tendency emphasizes the increasing contribution of digital technologies to the production process and assists manufacturers with the elimination of supply chain failures, reduction of lead times, and the production of complex goods on a large scale.
- AI-related production will enhance operation resiliency, cost reduction, and responsiveness to market demands, thus, competitive placement.
 Consumer Electronics Market Analysis and Segmental Data
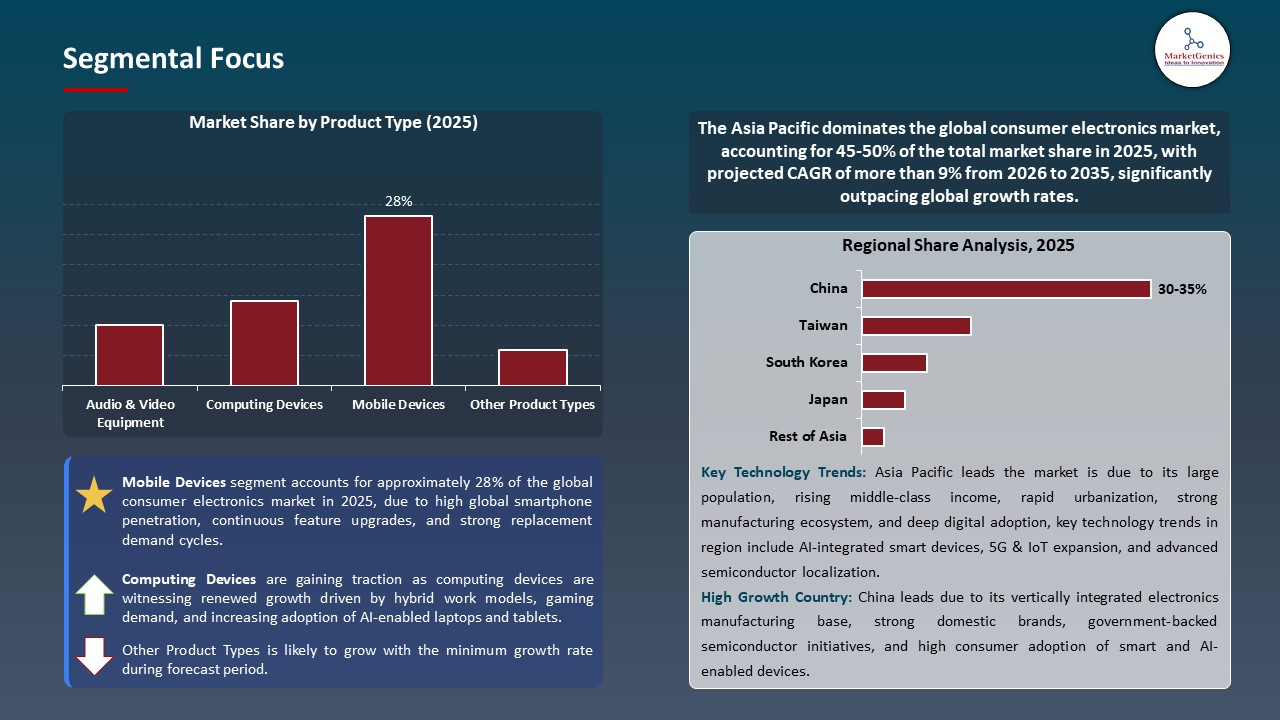
Mobile Devices Dominate Global Consumer Electronics Market
-
The mobile devices segment dominates the global consumer electronics market is driven by sustained demand for connectivity, digital services, and multifunctional computing. This dominance is further evidenced by continued growth in global smartphone shipments, which reached an estimated 1.26 billion units in 2025, with leading brands such as Apple and Samsung collectively capturing significant market share.
- From a corporate performance perspective, Apple Inc. reported record quarterly revenue in early 2026, with iPhone sales contributing the highest revenue to the company’s total quarterly results demonstrating the sustained commercial importance of mobile devices within the broader consumer electronics industry.
- Mobile devices remain central to industry growth, reflecting their indispensable role in everyday consumer technology use.
Asia Pacific Leads Global Consumer Electronics Market Demand
-
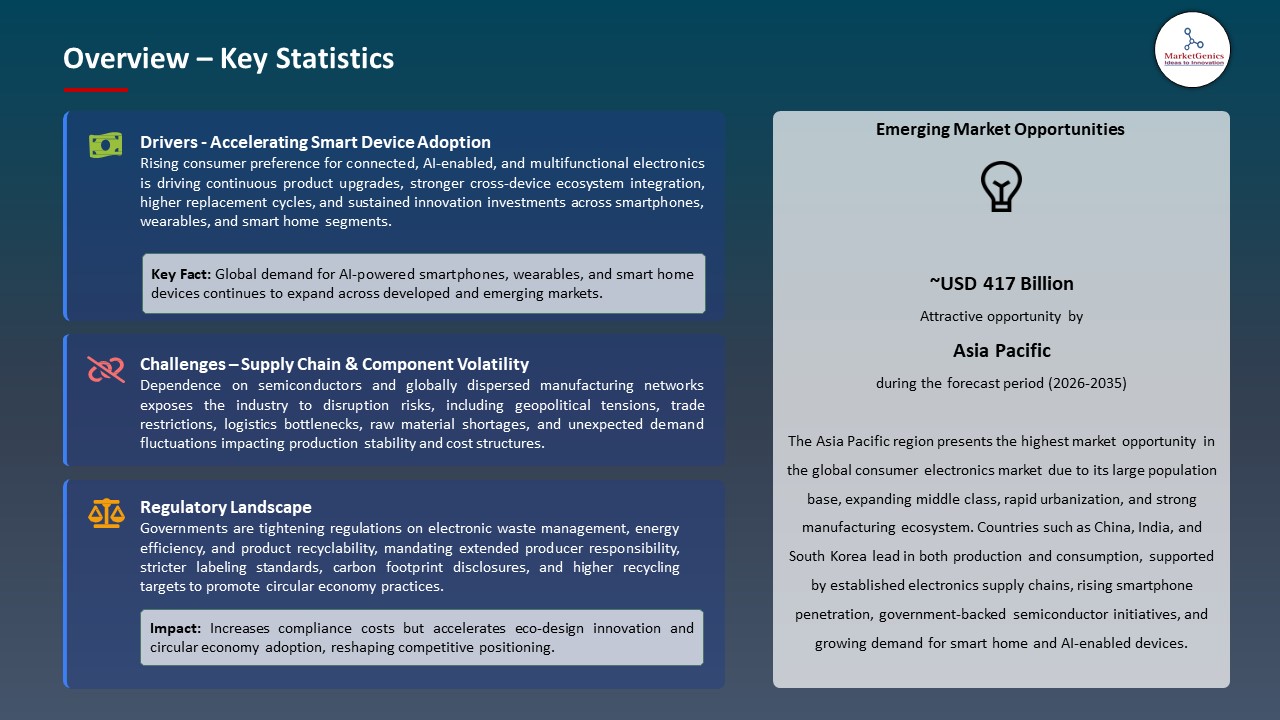
Asia Pacific leads the Consumer Electronics market is fueled by the urbanization and growing middle class in China, India, Southeast Asia and other countries are spending more income on smartphones, smart TVs and connected devices. This population trend increases the pressure of consumer electronics in all price ranges; both low-cost products and high-end products.
- Moreover, major consumer electronics producers are also aggressive in marketing to Asia Pacific customers and expanding region-specific operations. For instance, Samsung Electronics states that Asia Pacific has remained the top seller of its portable consumer electronics, especially smartphones and related devices that show good regional market demand and strengthen its strategic relevance in the profile of the Samsung world sales.
- These dynamics make Asia Pacific a key growth engine to the global consumer electronics marker which has been fueled by consumption patterns and production capabilities.
Consumer Electronics Market Ecosystem
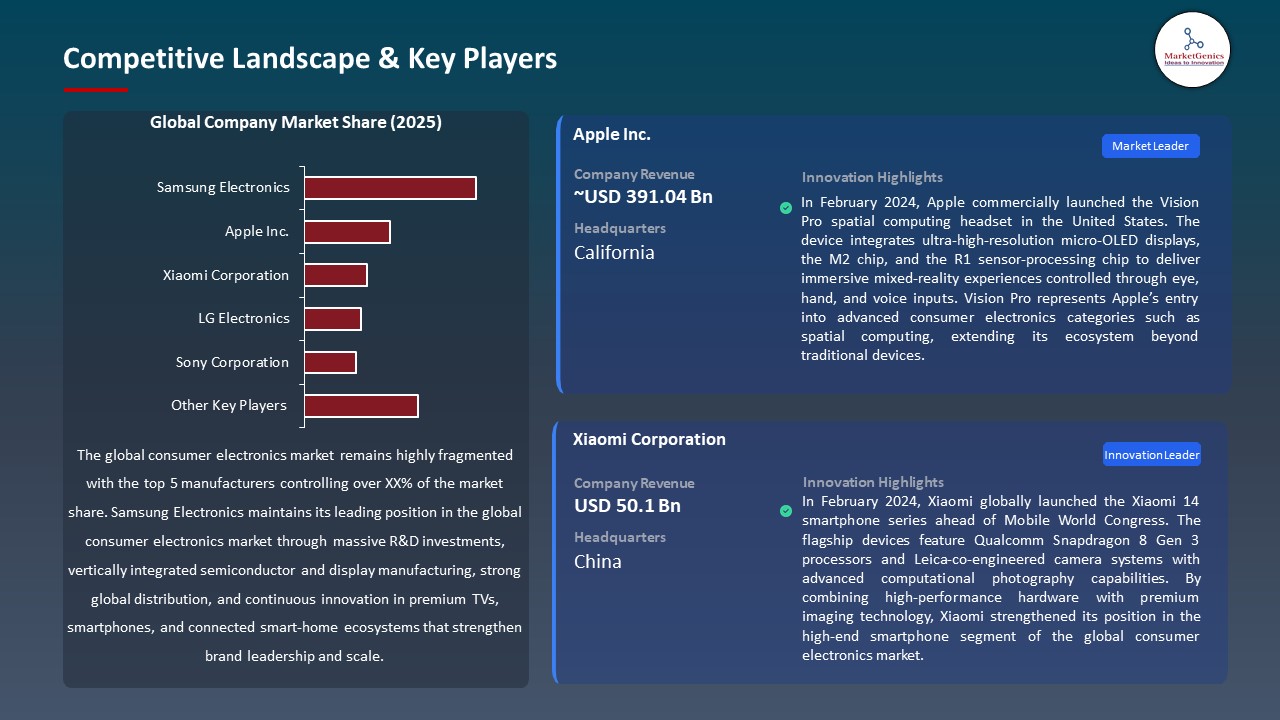
The global consumer electronics market is highly fragmented, with leading companies such as Samsung Electronics, Apple Inc., Xiaomi Corporation, LG Electronics, and Sony Corporation dominating with the advanced semiconductor design technology, artificial intelligence devices, high quality display technologies, and the large network of distribution globally. These firms use single-source hardware-software ecosystems and sustained R&D investment to sustain competitive advantages and scale in high-value consumer electronics segments.
The major players in the market have been interested in specialized technology and niche technology that will hasten product differentiation and technological development. An example is Samsung with higher OLED and QLED displays and smart TVs based on AI and Apple with highly integrated products using proprietary silicon and spatial computing systems. Xiaomi supports its presence by high-performance and relatively affordable smartphones and smart home devices that are IoT-enabled, whereas LG concentrates on the next generation OLED displays and smart home appliances. Sony, in the meantime, incorporates imaging sensors, game consoles and immersive entertainment technology to assist high-performance consumer electronics ecosystems.
These innovation-based strategies enhance competitive differentiation, increased pace of technological adoption and the upgrading of products in an ongoing manner, thus broadening the consumer demand globally and long term growth in the consumer electronics market.
 Recent Development and Strategic Overview:
-
In July 2025, LG launched its next-generation OLED evo and QNED evo smart TV lineup powered by the Alpha AI Processor Gen2. The new TVs integrate AI-based picture and sound personalization, improved brightness algorithms, and upgraded webOS features to deliver tailored viewing experiences. This launch strengthens LG’s competitiveness in premium AI-enabled televisions and reinforces its leadership in OLED display technology.
- In January 2025, Samsung introduced its AI-powered Neo QLED 8K TV lineup featuring Vision AI technology. The flagship TV integrates the NQ8 AI Gen3 processor with features such as AI upscaling, adaptive sound, and real-time content analysis, transforming televisions into intelligent entertainment hubs. This launch reinforced Samsung’s leadership in premium display innovation and AI-driven home entertainment ecosystems.
Report Scope
|
Detail |
|
|
Market Size in 2025 |
USD 1120.9 Bn |
|
Market Forecast Value in 2035 |
USD 2143.9 Bn |
|
Growth Rate (CAGR) |
6.7% |
|
Forecast Period |
2026 – 2035 |
|
Historical Data Available for |
2021 – 2024 |
|
Market Size Units |
US$ Billion for Value Thousand Units for Volume |
|
Report Format |
Electronic (PDF) + Excel |
|
North America |
Europe |
Asia Pacific |
Middle East |
Africa |
South America |
|
|
|
|
|
|
|
Companies Covered |
|||||
|
|
|
|
|
|
Consumer Electronics Market Segmentation and Highlights
|
Segment |
Sub-segment |
|
Consumer Electronics Market, By Product Type |
|
|
Consumer Electronics Market, By Technology |
|
|
Consumer Electronics Market, By Consumer Demographics |
|
|
Consumer Electronics Market, By End-users |
|
|
Consumer Electronics Market, By Distribution Channel |
|
|
Consumer Electronics Market, By Price Range |
|
Frequently Asked Questions
Table of Contents
- 1. Research Methodology and Assumptions
- 1.1. Definitions
- 1.2. Research Design and Approach
- 1.3. Data Collection Methods
- 1.4. Base Estimates and Calculations
- 1.5. Forecasting Models
- 1.5.1. Key Forecast Factors & Impact Analysis
- 1.6. Secondary Research
- 1.6.1. Open Sources
- 1.6.2. Paid Databases
- 1.6.3. Associations
- 1.7. Primary Research
- 1.7.1. Primary Sources
- 1.7.2. Primary Interviews with Stakeholders across Ecosystem
- 2. Executive Summary
- 2.1. Global Consumer Electronics Market Outlook
- 2.1.1. Consumer Electronics Market Size (Volume - Thousand Units and Value - US$ Bn), and Forecasts, 2021-2035
- 2.1.2. Compounded Annual Growth Rate Analysis
- 2.1.3. Growth Opportunity Analysis
- 2.1.4. Segmental Share Analysis
- 2.1.5. Geographical Share Analysis
- 2.2. Market Analysis and Facts
- 2.3. Supply-Demand Analysis
- 2.4. Competitive Benchmarking
- 2.5. Go-to- Market Strategy
- 2.5.1. Customer/ End-use Industry Assessment
- 2.5.2. Growth Opportunity Data, 2026-2035
- 2.5.2.1. Regional Data
- 2.5.2.2. Country Data
- 2.5.2.3. Segmental Data
- 2.5.3. Identification of Potential Market Spaces
- 2.5.4. GAP Analysis
- 2.5.5. Potential Attractive Price Points
- 2.5.6. Prevailing Market Risks & Challenges
- 2.5.7. Preferred Sales & Marketing Strategies
- 2.5.8. Key Recommendations and Analysis
- 2.5.9. A Way Forward
- 2.1. Global Consumer Electronics Market Outlook
- 3. Industry Data and Premium Insights
- 3.1. Global Consumer Goods & Services Industry Overview, 2025
- 3.1.1. Consumer Goods & Services Ecosystem Analysis
- 3.1.2. Key Trends for Consumer Goods & Services Industry
- 3.1.3. Regional Distribution for Consumer Goods & Services Industry
- 3.2. Supplier Customer Data
- 3.3. Technology Roadmap and Developments
- 3.4. Trade Analysis
- 3.4.1. Import & Export Analysis, 2025
- 3.4.2. Top Importing Countries
- 3.4.3. Top Exporting Countries
- 3.5. Trump Tariff Impact Analysis
- 3.5.1. Manufacturer
- 3.5.1.1. Based on the component & Raw material
- 3.5.2. Supply Chain
- 3.5.3. End Consumer
- 3.5.1. Manufacturer
- 3.6. Raw Material Analysis
- 3.1. Global Consumer Goods & Services Industry Overview, 2025
- 4. Market Overview
- 4.1. Market Dynamics
- 4.1.1. Drivers
- 4.1.1.1. Rapid technological advancements including AI, IoT, 5G, and smart connectivity integration
- 4.1.1.2. Rising disposable income and growing urban middle-class population in emerging economies
- 4.1.1.3. Increasing consumer demand for smart, portable, and multifunctional electronic devices
- 4.1.2. Restraints
- 4.1.2.1. Short product life cycles leading to rapid obsolescence and high replacement pressure
- 4.1.2.2. Supply chain disruptions and semiconductor/component shortages impacting production and pricing
- 4.1.1. Drivers
- 4.2. Key Trend Analysis
- 4.3. Regulatory Framework
- 4.3.1. Key Regulations, Norms, and Subsidies, by Key Countries
- 4.3.2. Tariffs and Standards
- 4.3.3. Impact Analysis of Regulations on the Market
- 4.4. Value Chain Analysis
- 4.4.1. Component Suppliers
- 4.4.2. Manufacturers
- 4.4.3. Distribution & Logistics
- 4.4.4. End-users/ Customers
- 4.5. Cost Structure Analysis
- 4.5.1. Parameter’s Share for Cost Associated
- 4.5.2. COGP vs COGS
- 4.5.3. Profit Margin Analysis
- 4.6. Pricing Analysis
- 4.6.1. Regional Pricing Analysis
- 4.6.2. Segmental Pricing Trends
- 4.6.3. Factors Influencing Pricing
- 4.7. Porter’s Five Forces Analysis
- 4.8. PESTEL Analysis
- 4.9. Global Consumer Electronics Market Demand
- 4.9.1. Historical Market Size – in Volume (Thousand Units) and Value (US$ Bn), 2020-2024
- 4.9.2. Current and Future Market Size – in Volume (Thousand Units) and Value (US$ Bn), 2026–2035
- 4.9.2.1. Y-o-Y Growth Trends
- 4.9.2.2. Absolute $ Opportunity Assessment
- 4.1. Market Dynamics
- 5. Competition Landscape
- 5.1. Competition structure
- 5.1.1. Fragmented v/s consolidated
- 5.2. Company Share Analysis, 2025
- 5.2.1. Global Company Market Share
- 5.2.2. By Region
- 5.2.2.1. North America
- 5.2.2.2. Europe
- 5.2.2.3. Asia Pacific
- 5.2.2.4. Middle East
- 5.2.2.5. Africa
- 5.2.2.6. South America
- 5.3. Product Comparison Matrix
- 5.3.1. Specifications
- 5.3.2. Market Positioning
- 5.3.3. Pricing
- 5.1. Competition structure
- 6. Global Consumer Electronics Market Analysis, by Product Type
- 6.1. Key Segment Analysis
- 6.2. Consumer Electronics Market Size (Volume - Thousand Units and Value - US$ Bn), Analysis, and Forecasts, by Product Type, 2021-2035
- 6.2.1. Audio & Video Equipment
- 6.2.1.1. Televisions
- 6.2.1.1.1. LED TV
- 6.2.1.1.2. OLED TV
- 6.2.1.1.3. QLED TV
- 6.2.1.1.4. Smart TV
- 6.2.1.1.5. 4K/8K TV
- 6.2.1.1.6. Others
- 6.2.1.2. Home Theater Systems
- 6.2.1.3. Soundbars
- 6.2.1.4. Headphones & Earphones
- 6.2.1.4.1. Wired Headphones
- 6.2.1.4.2. Wireless Headphones
- 6.2.1.4.3. True Wireless Earbuds
- 6.2.1.4.4. Gaming Headsets
- 6.2.1.4.5. Others
- 6.2.1.5. Portable Speakers
- 6.2.1.6. Home Audio Systems
- 6.2.1.7. Others
- 6.2.1.1. Televisions
- 6.2.2. Computing Devices
- 6.2.2.1. Laptops
- 6.2.2.1.1. Traditional Laptops
- 6.2.2.1.2. Gaming Laptops
- 6.2.2.1.3. Business Laptops
- 6.2.2.1.4. 2-in-1 Laptops
- 6.2.2.1.5. Others
- 6.2.2.2. Desktop Computers
- 6.2.2.3. Tablets
- 6.2.2.3.1. iPad/iOS Tablets
- 6.2.2.3.2. Android Tablets
- 6.2.2.3.3. Windows Tablets
- 6.2.2.4. E-Readers
- 6.2.2.5. Others
- 6.2.2.1. Laptops
- 6.2.3. Mobile Devices
- 6.2.3.1. Smartphones
- 6.2.3.1.1. Budget Smartphones
- 6.2.3.1.2. Mid-range Smartphones
- 6.2.3.1.3. Premium Smartphones
- 6.2.3.1.4. Foldable Smartphones
- 6.2.3.2. Feature Phones
- 6.2.3.3. Others
- 6.2.3.1. Smartphones
- 6.2.4. Home Appliances
- 6.2.4.1. Smart Home Appliances
- 6.2.4.1.1. Smart Refrigerators
- 6.2.4.1.2. Smart Washing Machines
- 6.2.4.1.3. Smart Air Conditioners
- 6.2.4.1.4. Smart Vacuum Cleaners
- 6.2.4.1.5. Others
- 6.2.4.2. Kitchen Appliances
- 6.2.4.2.1. Microwaves
- 6.2.4.2.2. Coffee Makers
- 6.2.4.2.3. Blenders
- 6.2.4.2.4. Air Fryers
- 6.2.4.2.5. Others
- 6.2.4.3. Personal Care Appliances
- 6.2.4.3.1. Hair Dryers
- 6.2.4.3.2. Electric Shavers
- 6.2.4.3.3. Electric Toothbrushes
- 6.2.4.3.4. Others
- 6.2.4.1. Smart Home Appliances
- 6.2.5. Gaming Consoles & Accessories
- 6.2.5.1. Home Gaming Consoles
- 6.2.5.2. Handheld Gaming Consoles
- 6.2.5.3. VR Gaming Systems
- 6.2.5.4. Others
- 6.2.6. Camera & Imaging Devices
- 6.2.6.1. Digital Cameras
- 6.2.6.1.1. DSLR Cameras
- 6.2.6.1.2. Mirrorless Cameras
- 6.2.6.1.3. Action Cameras
- 6.2.6.2. Camcorders
- 6.2.6.3. Drones with Cameras
- 6.2.6.4. Others
- 6.2.6.1. Digital Cameras
- 6.2.7. Wearable Devices
- 6.2.7.1. Smartwatches
- 6.2.7.2. Fitness Bands
- 6.2.7.3. Smart Glasses
- 6.2.7.4. Health Monitoring Devices
- 6.2.7.5. Others
- 6.2.8. Other Product Types
- 6.2.1. Audio & Video Equipment
- 7. Global Consumer Electronics Market Analysis, by Technology
- 7.1. Key Segment Analysis
- 7.2. Consumer Electronics Market Size (Volume - Thousand Units and Value - US$ Bn), Analysis, and Forecasts, by Technology, 2021-2035
- 7.2.1. Artificial Intelligence (AI) Enabled
- 7.2.2. Internet of Things (IoT) Connected
- 7.2.3. 5G Enabled
- 7.2.4. Wi-Fi 6/6E Compatible
- 7.2.5. Bluetooth 5.0 and Above
- 7.2.6. Voice Assistant Integrated
- 7.2.7. Gesture Control
- 7.2.8. Biometric Authentication
- 7.2.9. Touchscreen
- 7.2.10. AR/VR/MR Enables
- 7.2.11. Wireless Charging
- 7.2.12. Others
- 8. Global Consumer Electronics Market Analysis, by Consumer Demographics
- 8.1. Key Segment Analysis
- 8.2. Consumer Electronics Market Size (Volume - Thousand Units and Value - US$ Bn), Analysis, and Forecasts, by Consumer Demographics, 2021-2035
- 8.2.1. Age Group
- 8.2.1.1. Children (0-12 years)
- 8.2.1.2. Teenagers (13-19 years)
- 8.2.1.3. Young Adults (20-35 years)
- 8.2.1.4. Middle-aged Adults (36-55 years)
- 8.2.1.5. Seniors (55+ years)
- 8.2.2. Income Level
- 8.2.2.1. Low Income
- 8.2.2.2. Middle Income
- 8.2.2.3. High Income
- 8.2.1. Age Group
- 9. Global Consumer Electronics Market Analysis, by End-users
- 9.1. Key Segment Analysis
- 9.2. Consumer Electronics Market Size (Volume - Thousand Units and Value - US$ Bn), Analysis, and Forecasts, by End-users, 2021-2035
- 9.2.1. Residential/Household
- 9.2.1.1. Individual Consumers
- 9.2.1.2. Families
- 9.2.1.3. Smart Homes
- 9.2.2. Commercial
- 9.2.2.1. Retail Stores
- 9.2.2.2. Restaurants & Cafes
- 9.2.2.3. Hotels & Hospitality
- 9.2.2.4. Corporate Offices
- 9.2.2.5. Small & Medium Enterprises (SMEs)
- 9.2.2.6. Large Enterprises
- 9.2.2.7. Others
- 9.2.3. Healthcare
- 9.2.4. Education
- 9.2.5. Entertainment & Media
- 9.2.6. Industrial
- 9.2.6.1. Manufacturing Facilities
- 9.2.6.2. Warehouses
- 9.2.6.3. Construction Sites
- 9.2.6.4. Others
- 9.2.7. Government & Public Sector
- 9.2.8. Transportation
- 9.2.8.1. Airlines
- 9.2.8.2. Railways
- 9.2.8.3. Public Transit
- 9.2.9. Banking & Finance
- 9.2.10. Others
- 9.2.1. Residential/Household
- 10. Global Consumer Electronics Market Analysis, by Distribution Channel
- 10.1. Key Segment Analysis
- 10.2. Consumer Electronics Market Size (Volume - Thousand Units and Value - US$ Bn), Analysis, and Forecasts, by Distribution Channel, 2021-2035
- 10.2.1. Online
- 10.2.1.1. E-commerce Platforms
- 10.2.1.2. Brand Websites
- 10.2.1.3. Social Commerce
- 10.2.1.4. Others
- 10.2.2. Offline
- 10.2.2.1. Hypermarkets & Supermarkets
- 10.2.2.2. Specialty Electronics Stores
- 10.2.2.3. Brand Retail Stores
- 10.2.2.4. Multi-Brand Outlets
- 10.2.2.5. Department Stores
- 10.2.2.6. Others
- 10.2.1. Online
- 11. Global Consumer Electronics Market Analysis, by Price Range
- 11.1. Key Segment Analysis
- 11.2. Consumer Electronics Market Size (Volume - Thousand Units and Value - US$ Bn), Analysis, and Forecasts, by Price Range, 2021-2035
- 11.2.1. Up to US$ 300
- 11.2.2. US$ 300 - US$ 1000
- 11.2.3. Above US$ 1000
- 12. Global Consumer Electronics Market Analysis, by Region
- 12.1. Key Findings
- 12.2. Consumer Electronics Market Size (Volume - Thousand Units and Value - US$ Bn), Analysis, and Forecasts, by Region, 2021-2035
- 12.2.1. North America
- 12.2.2. Europe
- 12.2.3. Asia Pacific
- 12.2.4. Middle East
- 12.2.5. Africa
- 12.2.6. South America
- 13. North America Consumer Electronics Market Analysis
- 13.1. Key Segment Analysis
- 13.2. Regional Snapshot
- 13.3. North America Consumer Electronics Market Size (Volume - Thousand Units and Value - US$ Bn), Analysis, and Forecasts, 2021-2035
- 13.3.1. Product Type
- 13.3.2. Technology
- 13.3.3. Consumer Demographics
- 13.3.4. End-users
- 13.3.5. Distribution Channel
- 13.3.6. Price Range
- 13.3.7. Country
- 13.3.7.1. USA
- 13.3.7.2. Canada
- 13.3.7.3. Mexico
- 13.4. USA Consumer Electronics Market
- 13.4.1. Country Segmental Analysis
- 13.4.2. Product Type
- 13.4.3. Technology
- 13.4.4. Consumer Demographics
- 13.4.5. End-users
- 13.4.6. Distribution Channel
- 13.4.7. Price Range
- 13.5. Canada Consumer Electronics Market
- 13.5.1. Country Segmental Analysis
- 13.5.2. Product Type
- 13.5.3. Technology
- 13.5.4. Consumer Demographics
- 13.5.5. End-users
- 13.5.6. Distribution Channel
- 13.5.7. Price Range
- 13.6. Mexico Consumer Electronics Market
- 13.6.1. Country Segmental Analysis
- 13.6.2. Product Type
- 13.6.3. Technology
- 13.6.4. Consumer Demographics
- 13.6.5. End-users
- 13.6.6. Distribution Channel
- 13.6.7. Price Range
- 14. Europe Consumer Electronics Market Analysis
- 14.1. Key Segment Analysis
- 14.2. Regional Snapshot
- 14.3. Europe Consumer Electronics Market Size (Volume - Thousand Units and Value - US$ Bn), Analysis, and Forecasts, 2021-2035
- 14.3.1. Product Type
- 14.3.2. Technology
- 14.3.3. Consumer Demographics
- 14.3.4. End-users
- 14.3.5. Distribution Channel
- 14.3.6. Price Range
- 14.3.7. Country
- 14.3.7.1. Germany
- 14.3.7.2. United Kingdom
- 14.3.7.3. France
- 14.3.7.4. Italy
- 14.3.7.5. Spain
- 14.3.7.6. Netherlands
- 14.3.7.7. Nordic Countries
- 14.3.7.8. Poland
- 14.3.7.9. Russia & CIS
- 14.3.7.10. Rest of Europe
- 14.4. Germany Consumer Electronics Market
- 14.4.1. Country Segmental Analysis
- 14.4.2. Product Type
- 14.4.3. Technology
- 14.4.4. Consumer Demographics
- 14.4.5. End-users
- 14.4.6. Distribution Channel
- 14.4.7. Price Range
- 14.5. United Kingdom Consumer Electronics Market
- 14.5.1. Country Segmental Analysis
- 14.5.2. Product Type
- 14.5.3. Technology
- 14.5.4. Consumer Demographics
- 14.5.5. End-users
- 14.5.6. Distribution Channel
- 14.5.7. Price Range
- 14.6. France Consumer Electronics Market
- 14.6.1. Country Segmental Analysis
- 14.6.2. Product Type
- 14.6.3. Technology
- 14.6.4. Consumer Demographics
- 14.6.5. End-users
- 14.6.6. Distribution Channel
- 14.6.7. Price Range
- 14.7. Italy Consumer Electronics Market
- 14.7.1. Country Segmental Analysis
- 14.7.2. Product Type
- 14.7.3. Technology
- 14.7.4. Consumer Demographics
- 14.7.5. End-users
- 14.7.6. Distribution Channel
- 14.7.7. Price Range
- 14.8. Spain Consumer Electronics Market
- 14.8.1. Country Segmental Analysis
- 14.8.2. Product Type
- 14.8.3. Technology
- 14.8.4. Consumer Demographics
- 14.8.5. End-users
- 14.8.6. Distribution Channel
- 14.8.7. Price Range
- 14.9. Netherlands Consumer Electronics Market
- 14.9.1. Country Segmental Analysis
- 14.9.2. Product Type
- 14.9.3. Technology
- 14.9.4. Consumer Demographics
- 14.9.5. End-users
- 14.9.6. Distribution Channel
- 14.9.7. Price Range
- 14.10. Nordic Countries Consumer Electronics Market
- 14.10.1. Country Segmental Analysis
- 14.10.2. Product Type
- 14.10.3. Technology
- 14.10.4. Consumer Demographics
- 14.10.5. End-users
- 14.10.6. Distribution Channel
- 14.10.7. Price Range
- 14.11. Poland Consumer Electronics Market
- 14.11.1. Country Segmental Analysis
- 14.11.2. Product Type
- 14.11.3. Technology
- 14.11.4. Consumer Demographics
- 14.11.5. End-users
- 14.11.6. Distribution Channel
- 14.11.7. Price Range
- 14.12. Russia & CIS Consumer Electronics Market
- 14.12.1. Country Segmental Analysis
- 14.12.2. Product Type
- 14.12.3. Technology
- 14.12.4. Consumer Demographics
- 14.12.5. End-users
- 14.12.6. Distribution Channel
- 14.12.7. Price Range
- 14.13. Rest of Europe Consumer Electronics Market
- 14.13.1. Country Segmental Analysis
- 14.13.2. Product Type
- 14.13.3. Technology
- 14.13.4. Consumer Demographics
- 14.13.5. End-users
- 14.13.6. Distribution Channel
- 14.13.7. Price Range
- 15. Asia Pacific Consumer Electronics Market Analysis
- 15.1. Key Segment Analysis
- 15.2. Regional Snapshot
- 15.3. Asia Pacific Consumer Electronics Market Size (Volume - Thousand Units and Value - US$ Bn), Analysis, and Forecasts, 2021-2035
- 15.3.1. Product Type
- 15.3.2. Technology
- 15.3.3. Consumer Demographics
- 15.3.4. End-users
- 15.3.5. Distribution Channel
- 15.3.6. Price Range
- 15.3.7. Country
- 15.3.7.1. China
- 15.3.7.2. India
- 15.3.7.3. Japan
- 15.3.7.4. South Korea
- 15.3.7.5. Australia and New Zealand
- 15.3.7.6. Indonesia
- 15.3.7.7. Malaysia
- 15.3.7.8. Thailand
- 15.3.7.9. Vietnam
- 15.3.7.10. Rest of Asia Pacific
- 15.4. China Consumer Electronics Market
- 15.4.1. Country Segmental Analysis
- 15.4.2. Product Type
- 15.4.3. Technology
- 15.4.4. Consumer Demographics
- 15.4.5. End-users
- 15.4.6. Distribution Channel
- 15.4.7. Price Range
- 15.5. India Consumer Electronics Market
- 15.5.1. Country Segmental Analysis
- 15.5.2. Product Type
- 15.5.3. Technology
- 15.5.4. Consumer Demographics
- 15.5.5. End-users
- 15.5.6. Distribution Channel
- 15.5.7. Price Range
- 15.6. Japan Consumer Electronics Market
- 15.6.1. Country Segmental Analysis
- 15.6.2. Product Type
- 15.6.3. Technology
- 15.6.4. Consumer Demographics
- 15.6.5. End-users
- 15.6.6. Distribution Channel
- 15.6.7. Price Range
- 15.7. South Korea Consumer Electronics Market
- 15.7.1. Country Segmental Analysis
- 15.7.2. Product Type
- 15.7.3. Technology
- 15.7.4. Consumer Demographics
- 15.7.5. End-users
- 15.7.6. Distribution Channel
- 15.7.7. Price Range
- 15.8. Australia and New Zealand Consumer Electronics Market
- 15.8.1. Country Segmental Analysis
- 15.8.2. Product Type
- 15.8.3. Technology
- 15.8.4. Consumer Demographics
- 15.8.5. End-users
- 15.8.6. Distribution Channel
- 15.8.7. Price Range
- 15.9. Indonesia Consumer Electronics Market
- 15.9.1. Country Segmental Analysis
- 15.9.2. Product Type
- 15.9.3. Technology
- 15.9.4. Consumer Demographics
- 15.9.5. End-users
- 15.9.6. Distribution Channel
- 15.9.7. Price Range
- 15.10. Malaysia Consumer Electronics Market
- 15.10.1. Country Segmental Analysis
- 15.10.2. Product Type
- 15.10.3. Technology
- 15.10.4. Consumer Demographics
- 15.10.5. End-users
- 15.10.6. Distribution Channel
- 15.10.7. Price Range
- 15.11. Thailand Consumer Electronics Market
- 15.11.1. Country Segmental Analysis
- 15.11.2. Product Type
- 15.11.3. Technology
- 15.11.4. Consumer Demographics
- 15.11.5. End-users
- 15.11.6. Distribution Channel
- 15.11.7. Price Range
- 15.12. Vietnam Consumer Electronics Market
- 15.12.1. Country Segmental Analysis
- 15.12.2. Product Type
- 15.12.3. Technology
- 15.12.4. Consumer Demographics
- 15.12.5. End-users
- 15.12.6. Distribution Channel
- 15.12.7. Price Range
- 15.13. Rest of Asia Pacific Consumer Electronics Market
- 15.13.1. Country Segmental Analysis
- 15.13.2. Product Type
- 15.13.3. Technology
- 15.13.4. Consumer Demographics
- 15.13.5. End-users
- 15.13.6. Distribution Channel
- 15.13.7. Price Range
- 16. Middle East Consumer Electronics Market Analysis
- 16.1. Key Segment Analysis
- 16.2. Regional Snapshot
- 16.3. Middle East Consumer Electronics Market Size (Volume - Thousand Units and Value - US$ Bn), Analysis, and Forecasts, 2021-2035
- 16.3.1. Product Type
- 16.3.2. Technology
- 16.3.3. Consumer Demographics
- 16.3.4. End-users
- 16.3.5. Distribution Channel
- 16.3.6. Price Range
- 16.3.7. Country
- 16.3.7.1. Turkey
- 16.3.7.2. UAE
- 16.3.7.3. Saudi Arabia
- 16.3.7.4. Israel
- 16.3.7.5. Rest of Middle East
- 16.4. Turkey Consumer Electronics Market
- 16.4.1. Country Segmental Analysis
- 16.4.2. Product Type
- 16.4.3. Technology
- 16.4.4. Consumer Demographics
- 16.4.5. End-users
- 16.4.6. Distribution Channel
- 16.4.7. Price Range
- 16.5. UAE Consumer Electronics Market
- 16.5.1. Country Segmental Analysis
- 16.5.2. Product Type
- 16.5.3. Technology
- 16.5.4. Consumer Demographics
- 16.5.5. End-users
- 16.5.6. Distribution Channel
- 16.5.7. Price Range
- 16.6. Saudi Arabia Consumer Electronics Market
- 16.6.1. Country Segmental Analysis
- 16.6.2. Product Type
- 16.6.3. Technology
- 16.6.4. Consumer Demographics
- 16.6.5. End-users
- 16.6.6. Distribution Channel
- 16.6.7. Price Range
- 16.7. Israel Consumer Electronics Market
- 16.7.1. Country Segmental Analysis
- 16.7.2. Product Type
- 16.7.3. Technology
- 16.7.4. Consumer Demographics
- 16.7.5. End-users
- 16.7.6. Distribution Channel
- 16.7.7. Price Range
- 16.8. Rest of Middle East Consumer Electronics Market
- 16.8.1. Country Segmental Analysis
- 16.8.2. Product Type
- 16.8.3. Technology
- 16.8.4. Consumer Demographics
- 16.8.5. End-users
- 16.8.6. Distribution Channel
- 16.8.7. Price Range
- 17. Africa Consumer Electronics Market Analysis
- 17.1. Key Segment Analysis
- 17.2. Regional Snapshot
- 17.3. Africa Consumer Electronics Market Size (Volume - Thousand Units and Value - US$ Bn), Analysis, and Forecasts, 2021-2035
- 17.3.1. Product Type
- 17.3.2. Technology
- 17.3.3. Consumer Demographics
- 17.3.4. End-users
- 17.3.5. Distribution Channel
- 17.3.6. Price Range
- 17.3.7. Country
- 17.3.7.1. South Africa
- 17.3.7.2. Egypt
- 17.3.7.3. Nigeria
- 17.3.7.4. Algeria
- 17.3.7.5. Rest of Africa
- 17.4. South Africa Consumer Electronics Market
- 17.4.1. Country Segmental Analysis
- 17.4.2. Product Type
- 17.4.3. Technology
- 17.4.4. Consumer Demographics
- 17.4.5. End-users
- 17.4.6. Distribution Channel
- 17.4.7. Price Range
- 17.5. Egypt Consumer Electronics Market
- 17.5.1. Country Segmental Analysis
- 17.5.2. Product Type
- 17.5.3. Technology
- 17.5.4. Consumer Demographics
- 17.5.5. End-users
- 17.5.6. Distribution Channel
- 17.5.7. Price Range
- 17.6. Nigeria Consumer Electronics Market
- 17.6.1. Country Segmental Analysis
- 17.6.2. Product Type
- 17.6.3. Technology
- 17.6.4. Consumer Demographics
- 17.6.5. End-users
- 17.6.6. Distribution Channel
- 17.6.7. Price Range
- 17.7. Algeria Consumer Electronics Market
- 17.7.1. Country Segmental Analysis
- 17.7.2. Product Type
- 17.7.3. Technology
- 17.7.4. Consumer Demographics
- 17.7.5. End-users
- 17.7.6. Distribution Channel
- 17.7.7. Price Range
- 17.8. Rest of Africa Consumer Electronics Market
- 17.8.1. Country Segmental Analysis
- 17.8.2. Product Type
- 17.8.3. Technology
- 17.8.4. Consumer Demographics
- 17.8.5. End-users
- 17.8.6. Distribution Channel
- 17.8.7. Price Range
- 18. South America Consumer Electronics Market Analysis
- 18.1. Key Segment Analysis
- 18.2. Regional Snapshot
- 18.3. South America Consumer Electronics Market Size (Volume - Thousand Units and Value - US$ Bn), Analysis, and Forecasts, 2021-2035
- 18.3.1. Product Type
- 18.3.2. Technology
- 18.3.3. Consumer Demographics
- 18.3.4. End-users
- 18.3.5. Distribution Channel
- 18.3.6. Price Range
- 18.3.7. Country
- 18.3.7.1. Brazil
- 18.3.7.2. Argentina
- 18.3.7.3. Rest of South America
- 18.4. Brazil Consumer Electronics Market
- 18.4.1. Country Segmental Analysis
- 18.4.2. Product Type
- 18.4.3. Technology
- 18.4.4. Consumer Demographics
- 18.4.5. End-users
- 18.4.6. Distribution Channel
- 18.4.7. Price Range
- 18.5. Argentina Consumer Electronics Market
- 18.5.1. Country Segmental Analysis
- 18.5.2. Product Type
- 18.5.3. Technology
- 18.5.4. Consumer Demographics
- 18.5.5. End-users
- 18.5.6. Distribution Channel
- 18.5.7. Price Range
- 18.6. Rest of South America Consumer Electronics Market
- 18.6.1. Country Segmental Analysis
- 18.6.2. Product Type
- 18.6.3. Technology
- 18.6.4. Consumer Demographics
- 18.6.5. End-users
- 18.6.6. Distribution Channel
- 18.6.7. Price Range
- 19. Key Players/ Company Profile
- 19.1. Amazon.com Inc.
- 19.1.1. Company Details/ Overview
- 19.1.2. Company Financials
- 19.1.3. Key Customers and Competitors
- 19.1.4. Business/ Industry Portfolio
- 19.1.5. Product Portfolio/ Specification Details
- 19.1.6. Pricing Data
- 19.1.7. Strategic Overview
- 19.1.8. Recent Developments
- 19.2. Apple Inc.
- 19.3. ASUS
- 19.4. Canon Inc.
- 19.5. Dell Technologies
- 19.6. Electrolux AB
- 19.7. Haier Group
- 19.8. HP Inc.
- 19.9. Huawei Technologies
- 19.10. Lenovo Group
- 19.11. LG Electronics
- 19.12. Nikon Corporation
- 19.13. Panasonic Corporation
- 19.14. Philips
- 19.15. Samsung Electronics
- 19.16. Sharp Corporation
- 19.17. Sony Corporation
- 19.18. Toshiba Corporation
- 19.19. Whirlpool Corporation
- 19.20. Xiaomi Corporation
- 19.21. Other Key Players
- 19.1. Amazon.com Inc.
Note* - This is just tentative list of players. While providing the report, we will cover more number of players based on their revenue and share for each geography
Research Design
Our research design integrates both demand-side and supply-side analysis through a balanced combination of primary and secondary research methodologies. By utilizing both bottom-up and top-down approaches alongside rigorous data triangulation methods, we deliver robust market intelligence that supports strategic decision-making.
MarketGenics' comprehensive research design framework ensures the delivery of accurate, reliable, and actionable market intelligence. Through the integration of multiple research approaches, rigorous validation processes, and expert analysis, we provide our clients with the insights needed to make informed strategic decisions and capitalize on market opportunities.

MarketGenics leverages a dedicated industry panel of experts and a comprehensive suite of paid databases to effectively collect, consolidate, and analyze market intelligence.
Our approach has consistently proven to be reliable and effective in generating accurate market insights, identifying key industry trends, and uncovering emerging business opportunities.
Through both primary and secondary research, we capture and analyze critical company-level data such as manufacturing footprints, including technical centers, R&D facilities, sales offices, and headquarters.
Our expert panel further enhances our ability to estimate market size for specific brands based on validated field-level intelligence.
Our data mining techniques incorporate both parametric and non-parametric methods, allowing for structured data collection, sorting, processing, and cleaning.
Demand projections are derived from large-scale data sets analyzed through proprietary algorithms, culminating in robust and reliable market sizing.
Research Approach
The bottom-up approach builds market estimates by starting with the smallest addressable market units and systematically aggregating them to create comprehensive market size projections.
This method begins with specific, granular data points and builds upward to create the complete market landscape.
Customer Analysis → Segmental Analysis → Geographical Analysis
The top-down approach starts with the broadest possible market data and systematically narrows it down through a series of filters and assumptions to arrive at specific market segments or opportunities.
This method begins with the big picture and works downward to increasingly specific market slices.
TAM → SAM → SOM


Research Methods
Desk / Secondary Research
While analysing the market, we extensively study secondary sources, directories, and databases to identify and collect information useful for this technical, market-oriented, and commercial report. Secondary sources that we utilize are not only the public sources, but it is a combination of Open Source, Associations, Paid Databases, MG Repository & Knowledgebase, and others.
- Company websites, annual reports, financial reports, broker reports, and investor presentations
- National government documents, statistical databases and reports
- News articles, press releases and web-casts specific to the companies operating in the market, Magazines, reports, and others
- We gather information from commercial data sources for deriving company specific data such as segmental revenue, share for geography, product revenue, and others
- Internal and external proprietary databases (industry-specific), relevant patent, and regulatory databases
- Governing Bodies, Government Organizations
- Relevant Authorities, Country-specific Associations for Industries
We also employ the model mapping approach to estimate the product level market data through the players' product portfolio
Primary Research
Primary research/ interviews is vital in analyzing the market. Most of the cases involves paid primary interviews. Primary sources include primary interviews through e-mail interactions, telephonic interviews, surveys as well as face-to-face interviews with the different stakeholders across the value chain including several industry experts.
| Type of Respondents | Number of Primaries |
|---|---|
| Tier 2/3 Suppliers | ~20 |
| Tier 1 Suppliers | ~25 |
| End-users | ~25 |
| Industry Expert/ Panel/ Consultant | ~30 |
| Total | ~100 |
MG Knowledgebase
• Repository of industry blog, newsletter and case studies
• Online platform covering detailed market reports, and company profiles
Forecasting Factors and Models
Forecasting Factors
- Historical Trends – Past market patterns, cycles, and major events that shaped how markets behave over time. Understanding past trends helps predict future behavior.
- Industry Factors – Specific characteristics of the industry like structure, regulations, and innovation cycles that affect market dynamics.
- Macroeconomic Factors – Economic conditions like GDP growth, inflation, and employment rates that affect how much money people have to spend.
- Demographic Factors – Population characteristics like age, income, and location that determine who can buy your product.
- Technology Factors – How quickly people adopt new technology and how much technology infrastructure exists.
- Regulatory Factors – Government rules, laws, and policies that can help or restrict market growth.
- Competitive Factors – Analyzing competition structure such as degree of competition and bargaining power of buyers and suppliers.
Forecasting Models / Techniques
Multiple Regression Analysis
- Identify and quantify factors that drive market changes
- Statistical modeling to establish relationships between market drivers and outcomes
Time Series Analysis – Seasonal Patterns
- Understand regular cyclical patterns in market demand
- Advanced statistical techniques to separate trend, seasonal, and irregular components
Time Series Analysis – Trend Analysis
- Identify underlying market growth patterns and momentum
- Statistical analysis of historical data to project future trends
Expert Opinion – Expert Interviews
- Gather deep industry insights and contextual understanding
- In-depth interviews with key industry stakeholders
Multi-Scenario Development
- Prepare for uncertainty by modeling different possible futures
- Creating optimistic, pessimistic, and most likely scenarios
Time Series Analysis – Moving Averages
- Sophisticated forecasting for complex time series data
- Auto-regressive integrated moving average models with seasonal components
Econometric Models
- Apply economic theory to market forecasting
- Sophisticated economic models that account for market interactions
Expert Opinion – Delphi Method
- Harness collective wisdom of industry experts
- Structured, multi-round expert consultation process
Monte Carlo Simulation
- Quantify uncertainty and probability distributions
- Thousands of simulations with varying input parameters
Research Analysis
Our research framework is built upon the fundamental principle of validating market intelligence from both demand and supply perspectives. This dual-sided approach ensures comprehensive market understanding and reduces the risk of single-source bias.
Demand-Side Analysis: We understand end-user/application behavior, preferences, and market needs along with the penetration of the product for specific application.
Supply-Side Analysis: We estimate overall market revenue, analyze the segmental share along with industry capacity, competitive landscape, and market structure.
Validation & Evaluation
Data triangulation is a validation technique that uses multiple methods, sources, or perspectives to examine the same research question, thereby increasing the credibility and reliability of research findings. In market research, triangulation serves as a quality assurance mechanism that helps identify and minimize bias, validate assumptions, and ensure accuracy in market estimates.
- Data Source Triangulation – Using multiple data sources to examine the same phenomenon
- Methodological Triangulation – Using multiple research methods to study the same research question
- Investigator Triangulation – Using multiple researchers or analysts to examine the same data
- Theoretical Triangulation – Using multiple theoretical perspectives to interpret the same data

Custom Market Research Services
We will customise the research for you, in case the report listed above does not meet your requirements.
Get 10% Free Customisation