Smart Lighting Market Size, Share & Trends Analysis Report by Product Type (Smart Light Bulbs, Smart Light Luminaires, Smart Switches and Dimmers, Smart Light Strips, Smart Outdoor Lighting, Smart Emergency Lighting, Others), Technology, Light Source, Offering, Sales Channel, Application, Control System, End-users, and Geography (North America, Europe, Asia Pacific, Middle East, Africa, and South America) – Global Industry Data, Trends, and Forecasts, 2026–2035
|
|
|
Segmental Data Insights |
|
|
Demand Trends |
|
|
Competitive Landscape |
|
|
Strategic Development |
|
|
Future Outlook & Opportunities |
|
Smart Lighting Market Size, Share, and Growth
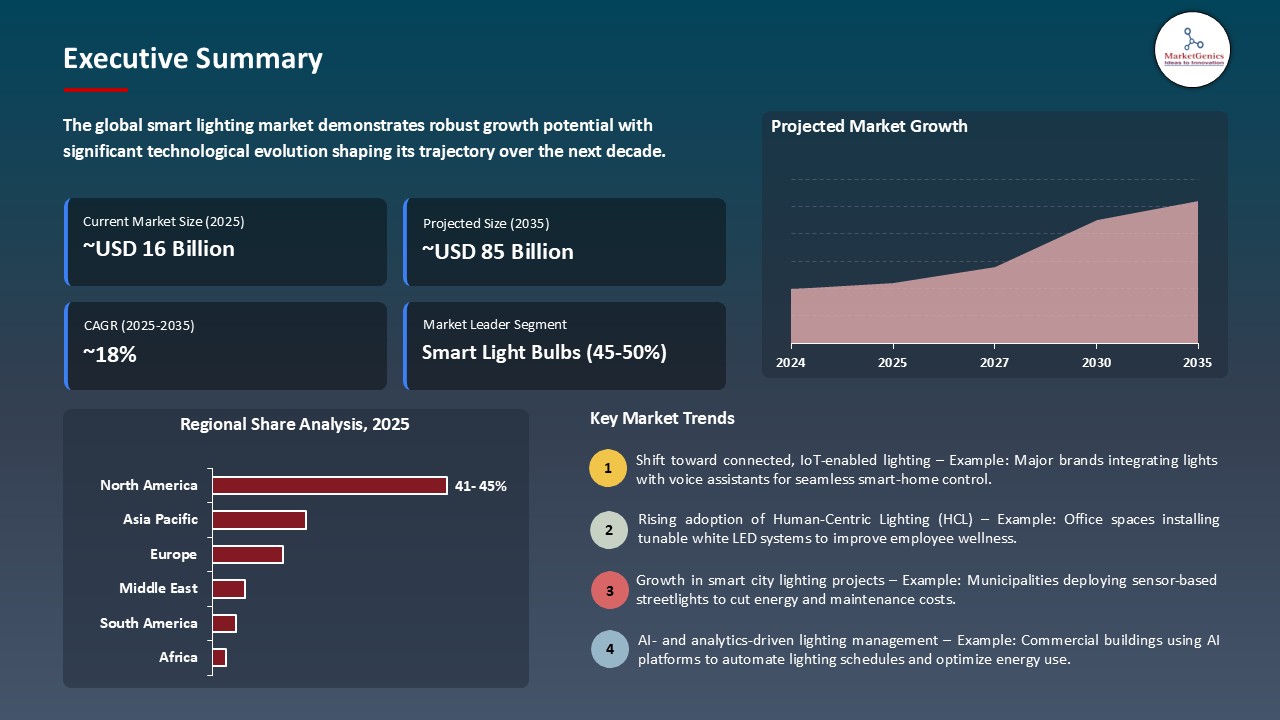
The global smart lighting market is experiencing robust growth, with its estimated value of USD 16.3 billion in the year 2025 and USD 84.6 billion by 2035, registering a CAGR of 17.9%, during the forecast period. The global smart lighting market is growing because of increased use of IoT- and AI-enabled solutions to achieve energy efficiency and integrate smart buildings. Consumer and business demands are on the rise through innovations in adaptive controls, interconnected devices, and user focused solutions.
Christopher Knowlton, CEO of the IALD (International Association of Lighting Designers), has entered into a partnership with the DALI Alliance, said,
"This partnership is about ensuring designers have access to the tools, training, and standards they need to deliver exceptional results. By working with the DALI Alliance, we’re helping to close the gap between evolving control technologies and real-world design practice."
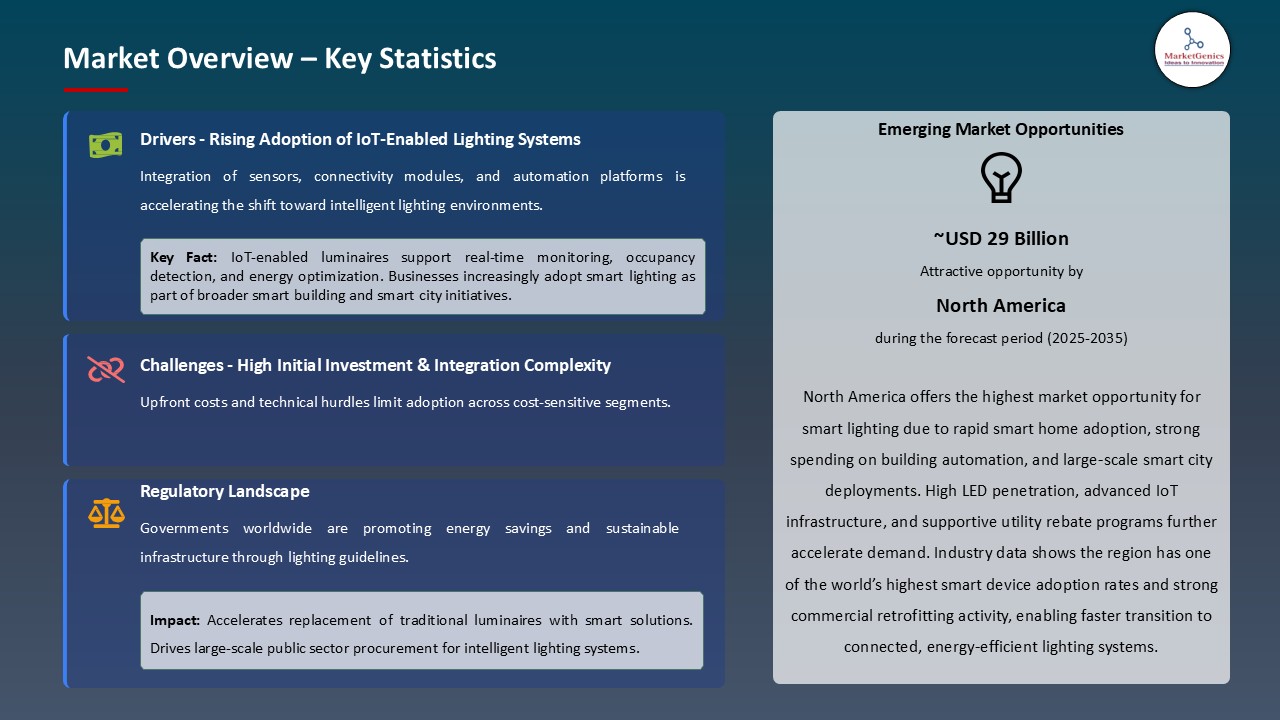
IoT platforms and smart building solutions are becoming more and more popular in driving the global smart lighting market. Reduction of the LED prices, increasing consumer consciousness of power conservation, and the need to connect systems is hastening the transition to traditional lighting to smart, adjustable systems. Such systems provide dynamic control, real-time and linking to larger building management platforms, making them more efficient and sustainable.
The applications are extending past basic illumination with the use of technological advances. The adaptive lighting and multi-zone control options, as well as wellness-oriented color temperature changes are improving the user experience and making lighting one of the core aspects of smart building ecosystems. In 2025, Cree Lighting has extended its SmartCast Intelligence Platform to convert PoE-connected fixtures into IoT-based analytics networks, which optimize energy consumption and space usage, and illustrates how lighting is increasingly integrated with intelligent building management.
Adjacent opportunities to grow include human-centric lighting, which optimizes biological rhythms, the LiFi motion of transmitting data over visible light and the use of UV-C disinfection of healthcare and office settings. Interoperability with wireless network, health promotional functionalities and energy management systems are still expanding the scope and value of smart lighting solutions around the world.
Smart Lighting Market Dynamics and Trends
Driver: Energy Efficiency Mandates and Sustainability Initiatives
- Smart lighting is being encouraged by global policies that ensure energy conservation and the reduction of carbon emission in the residential, commercial and municipal areas. The policies to eliminate inefficient lighting, the incentives of LED and intelligent system is also a great economic and environmental reason, and commercial operators are under more of pressure to comply with the sustainability approved ratings and prove a quantifiable energy savings rate.
- Fabrics and municipalities are moving towards connected lighting systems that provide real-time, adjustable controls, and long-term operational savings and efficacy, thus they are the focus of sustainability programs and rule compliance. In 2025, Genlyte Solutions of Signify implemented linked LED streetlight in Washington, D.C., realizing a 82 percent decrease in energy utilization and sustaining urban sustainability and the well-being of its inhabitants. The project brings out the benefits of smart and networked lighting systems that offer real energy savings and efficiencies in operation, which justifies their use in the municipal and corporate implementations.
- Utility rebates, ESCO financing, and adaptive street and building lighting solutions also lower the retrofit costs up front, and allow predictive maintenance and occupancy-based control. This policy, incentive and quantifiable energy efficiency convergence is continuing to drive the demand of smart lighting in all market segmentation.
Restraint: High Initial Investment and Installation Complexity
- The high initial costs are a major barrier to the adoption of smart lighting market. These systems are comprehensive and entail the use of sensors, controls, gateways and software, which are very expensive when compared to traditional lighting systems. This may discourage small businesses and low end residential shoppers as the perceived payback period might be excessively long even with possible long-term energy benefits and operation efficiencies.
- Complexity of installation is another limiting factor to adoption. Several intelligent lighting systems need professional skills in wiring, network installation, and integration with the existing building infrastructure. Older electrical systems may require reconfiguration to accommodate smart switches and controls, which introduces the costs of additional labor and complexity of the project.
- Interoperability and compatibility with the platform are also problematic. The competing communication protocols, as well as smart home ecosystems also introduce uncertainty regarding the obsolescence of the system or vendor lock-in. All these technical and financial restrictions hamper penetration of cost-restrictive residential and smaller commercial sectors, retarding market expansion overall as much as advanced lighting penetration is sought.
Opportunity: Integration with Advanced Building Management Systems
- The opportunities of the integration of smart lighting with building automation and IoT are prospects with great growth potential, beyond the value of illumination. The modern systems are intelligent sensors that deliver occupancy information, environmental and location services that aid the HVAC, security, space management, and occupant wellness. This versatile feature improves the working productivity and reduced energy consumption, in addition to the overall work and living output.
- Lighting is becoming considered as one of the basic infrastructure of intelligent buildings that can be smoothly integrated with other building management and information systems, alongside connected residential devices such as smart baby monitor platforms that rely on adaptive lighting for safety, comfort, and sleep-cycle optimization. For instance, in 2024, Tuya Smart presented its Building Energy Management System (BEMS) at Light + Building and integrated IoT, Bluetooth Mesh lighting, and AI to offer energy-efficient and automated buildings. The platform facilitates an adaptable environmental regulation, real-time tracking, and prescient analysis to maximize space, energy consumption, and human comfort.
- Smart lighting expands market prospects in facilities management, IT networks, and occupant experience solutions, leading to high-value implementations and a stronger economic case for intelligent buildings.
Key Trend: Human-Centric and Wellness-Focused Lighting Design
- Smart lighting is now being tailored more with the aim of supporting human health and wellbeing and not just being a source of illumination. Human-Centric Lighting (HCL) is a kind of dynamic lighting technology that can change the color temperature and intensity during the day to correspond to the circadian rhythms and enhance focus, mood, and sleep quality in home settings, offices, educational institutions, and healthcare facilities.
- Innovation proceeds on with new product introductions. As an example, June 2025, Adayo launched its Human-Centric Lighting product, which regulates the temperature and brightness of the light depending on biological requirements, helping to be alert in the daytime and to relax at evening. This proves the increased tendency towards wellness-driven lighting that incorporates intelligent automation with functional health purposes.
- Manufacturers are also incorporating analytics and smart scheduling in order to maximize the lighting to occupants. The capability to develop adaptive scenes, customized light profiles, and insights based on the data is provided by advanced control, cloud-based monitoring, and the possibility to integrate with smart-home platforms, and the privacy-oriented solutions allow the safe processing of user data.
Smart Lighting Market Analysis and Segmental Data
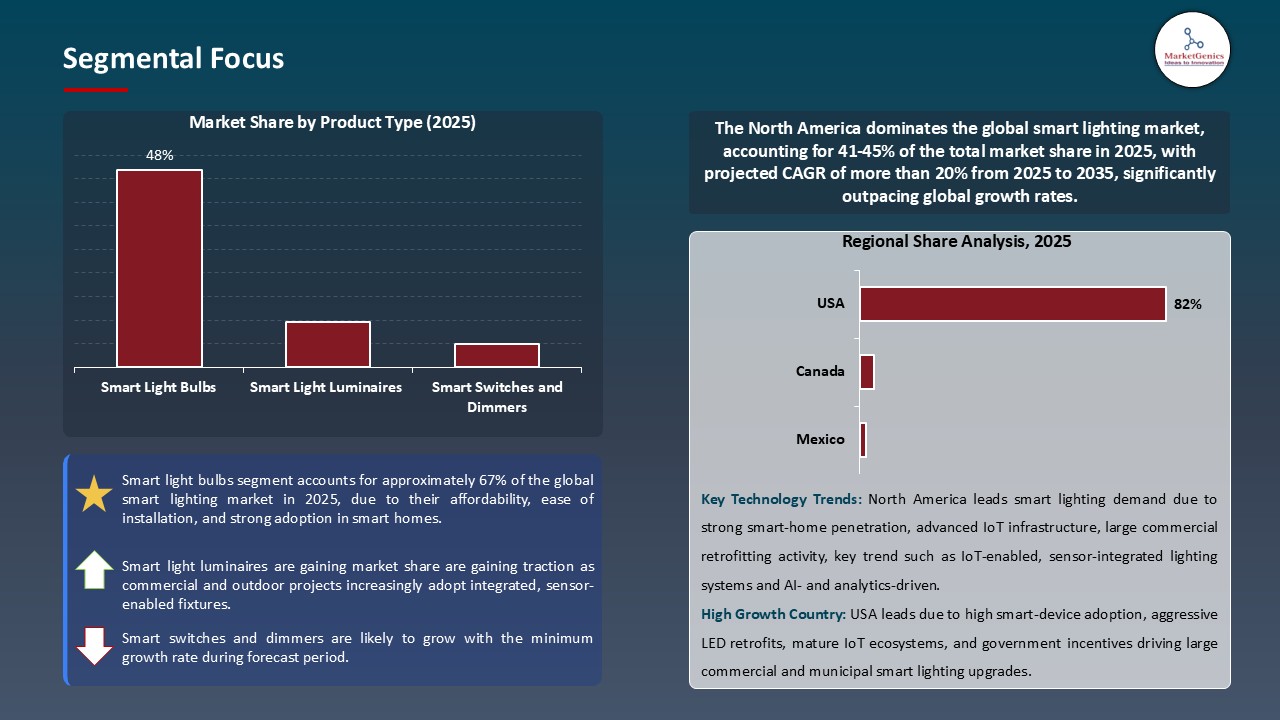
Smart Light Bulbs Dominate Global Smart Lighting Market
- The smart light bulb segment leads the global smart lighting market because of the demand of energy-saving, personalizable, and connected lighting products. Color temperature control, dimming, scheduling, and voice assistant integration give additional features, which increase convenience, saving energy, and user experience.
- The segment has been subjected to sustained innovation. For instance, September 2025, Signify released a huge update to its Philips Hue system, incorporating the Essential system (A19, BR30 bulbs and GU10, and strip lights), and the updated strip light offering with ultra-bright OmniGlow, and long-lasting Festavia string lights that could be used outdoors. These products enable Matter over Thread connectivity, enabling easy connectivity of the ecosystem and offering easy access to new and existing smart lighting products.
- Falling LED costs, ubiquitous internet connectivity and rising levels of smart home adoption all remain crucial to growth. The automation with AI, the customized light scene, the ability to synchronize entertainment, and the coordination of multiple devices contribute to the superiority and attractiveness of the segment in the global market.
North America Leads Global Smart Lighting Market Demand
- The global smart lighting market in North America is technologically progressive and early adopting in the world because of a high rate of smart home adoption, extensive building automation infrastructure, and intensive investment in research and development by manufacturers in the region. The US and Canada are particularly highly adopted in both residential and commercial segments with wide distribution channels, development of skilled installation labor force, and consumer knowledge on connected home technologies.
- The growth of smart home integration and automated solutions has led to the introduction of multifunctional devices and ecosystem-based products at CES 2025, Lutron introduced Caseta smart shades (roller and honeycomb types) which are compatible with the Caseta smart lighting ecosystem. These intelligent curtains and window blinds allow to manage natural and artificial light through the Lutron app, voice assistants, or in-wall controls, which indicates a high level of demand in North America to combine multitasking tools and whole-home automation.
- The area has the advantage of building codes, utility incentives and a heavy emphasis on energy efficiency, and the North American leadership in high-end smart lighting has led to innovation and provided significant domestic market in all industries.
Smart-Lighting-Market Ecosystem
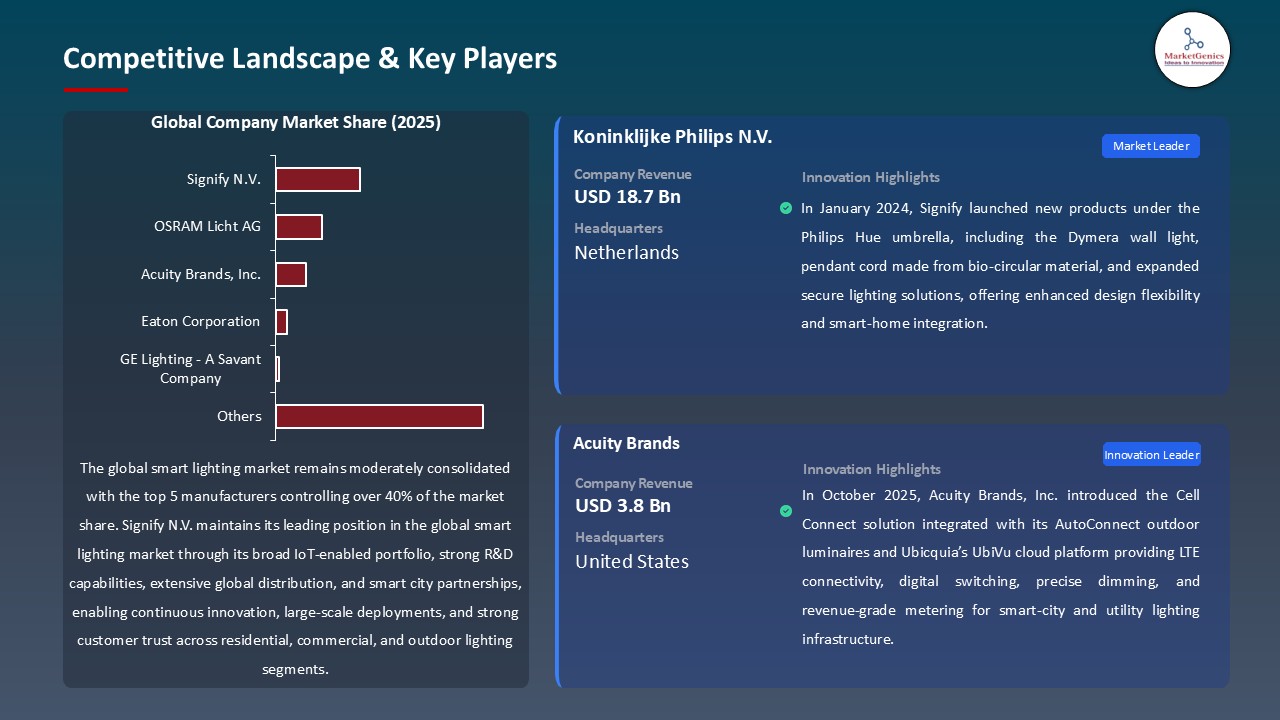
The global smart lighting market is highly consolidated with major actors including Signify N.V., OSRAM Licht AG, Acuity Brands, Eaton Corporation, and GE Lighting (a Savant company) ruling the market with a wide range of products, a customary network of distribution, and a software base. Secondary competitors are interested in niche applications, direct-to-consumer services, and strategic technology alliances, whereas smaller regional competitors and new IoT firms work with private-label or specialized services.
The market value chain includes the manufacturing of LED components, driver electronics and control hardware, the implementation of wireless communication protocols, cloud-based software platforms, the development of mobile applications, and the professional installation services. A company with vertical integration of hardware and software space, and strategic alliances with smart home platforms, voice assistants and vendors of building management systems gains substantial competitive strength.
The incorporation of a security camera experience into Philips Hue fixtures by Signify exemplifies the wisdom of looking past the conventional lighting into related smart home uses. The ecosystem model is a better customer lock-in strategy, creates a recurring revenue stream with cloud subscriptions and premium features, and delivers ongoing innovation in the connectivity protocols, AI-assisted algorithms, and application-specific solutions. Ownership platforms and smooth integration are also major market leader distinguishing factors in ensuring technology and operational advantage.
Recent Development and Strategic Overview:
- In September 2025, Signify brand Philips Hue introduced the new Hue Bridge Pro, supporting 150 lights and 50 accessories and has motion-aware capabilities. They also launched an affordable new user product line called Essential, redesigned indoor and outdoor LED strip lights, added video doorbell and chime under Hue Secure, and added integrations with voice assistants and entertainment systems such as Sonos and LG TVs.
- In January 2025, LIFX, together with its parent company Feit Electric, announced four next-generation light products at CES, such a Smart 120-color-zones Oval SuperColor Ceiling Light and a 26 addressable-zone Luna Smart Lamp with built-in physical buttons to control the devices offline to fit perfectly into the smart-home ecosystem.
Report Scope
|
Detail |
|
|
Market Size in 2025 |
USD 16.3 Bn |
|
Market Forecast Value in 2035 |
USD 84.6 Bn |
|
Growth Rate (CAGR) |
17.9% |
|
Forecast Period |
2026 – 2035 |
|
Historical Data Available for |
2021 – 2024 |
|
Market Size Units |
US$ Billion for Value Million Units for Volume |
|
Report Format |
Electronic (PDF) + Excel |
|
North America |
Europe |
Asia Pacific |
Middle East |
Africa |
South America |
|
|
|
|
|
|
|
Companies Covered |
|||||
|
|
|
|
|
|
Smart-Lighting-Market Segmentation and Highlights
|
Segment |
Sub-segment |
|
Smart Lighting Market, By Product Type |
|
|
Smart Lighting Market, By Technology |
|
|
Smart Lighting Market, By Light Source |
|
|
Smart Lighting Market, By Offering |
|
|
Smart Lighting Market, Sales Channel |
|
|
Smart Lighting Market, By Application |
|
|
Smart Lighting Market, By Control System |
|
|
Smart Lighting Market, By End-users |
|
Frequently Asked Questions
Table of Contents
- 1. Research Methodology and Assumptions
- 1.1. Definitions
- 1.2. Research Design and Approach
- 1.3. Data Collection Methods
- 1.4. Base Estimates and Calculations
- 1.5. Forecasting Models
- 1.5.1. Key Forecast Factors & Impact Analysis
- 1.6. Secondary Research
- 1.6.1. Open Sources
- 1.6.2. Paid Databases
- 1.6.3. Associations
- 1.7. Primary Research
- 1.7.1. Primary Sources
- 1.7.2. Primary Interviews with Stakeholders across Ecosystem
- 2. Executive Summary
- 2.1. Global Smart Lighting Market Outlook
- 2.1.1. Smart Lighting Market Size Volume (Million Units) and Value (US$ Bn), and Forecasts, 2021-2035
- 2.1.2. Compounded Annual Growth Rate Analysis
- 2.1.3. Growth Opportunity Analysis
- 2.1.4. Segmental Share Analysis
- 2.1.5. Geographical Share Analysis
- 2.2. Market Analysis and Facts
- 2.3. Supply-Demand Analysis
- 2.4. Competitive Benchmarking
- 2.5. Go-to- Market Strategy
- 2.5.1. Customer/ End-use Industry Assessment
- 2.5.2. Growth Opportunity Data, 2026-2035
- 2.5.2.1. Regional Data
- 2.5.2.2. Country Data
- 2.5.2.3. Segmental Data
- 2.5.3. Identification of Potential Market Spaces
- 2.5.4. GAP Analysis
- 2.5.5. Potential Attractive Price Points
- 2.5.6. Prevailing Market Risks & Challenges
- 2.5.7. Preferred Sales & Marketing Strategies
- 2.5.8. Key Recommendations and Analysis
- 2.5.9. A Way Forward
- 2.1. Global Smart Lighting Market Outlook
- 3. Industry Data and Premium Insights
- 3.1. Global Consumer Goods & Services Industry Overview, 2025
- 3.1.1. Consumer Goods & Services Industry Ecosystem Analysis
- 3.1.2. Key Trends for Consumer Goods & Services Industry
- 3.1.3. Regional Distribution for Consumer Goods & Services Industry
- 3.2. Supplier Customer Data
- 3.3. Technology Roadmap and Developments
- 3.4. Trade Analysis
- 3.4.1. Import & Export Analysis, 2025
- 3.4.2. Top Importing Countries
- 3.4.3. Top Exporting Countries
- 3.5. Trump Tariff Impact Analysis
- 3.5.1. Manufacturer
- 3.5.1.1. Based on the component & Raw material
- 3.5.2. Supply Chain
- 3.5.3. End Consumer
- 3.5.1. Manufacturer
- 3.6. Raw Material Analysis
- 3.1. Global Consumer Goods & Services Industry Overview, 2025
- 4. Market Overview
- 4.1. Market Dynamics
- 4.1.1. Drivers
- 4.1.1.1. Energy-efficiency and cost-saving through LED + intelligent controls.
- 4.1.1.2. Growing adoption of IoT and smart home/building automation.
- 4.1.1.3. Government regulations and incentives for energy conservation and smart grids.
- 4.1.2. Restraints
- 4.1.2.1. High upfront installation and integration costs.
- 4.1.2.2. Interoperability/security concerns and fragmented standards.
- 4.1.1. Drivers
- 4.2. Key Trend Analysis
- 4.3. Regulatory Framework
- 4.3.1. Key Regulations, Norms, and Subsidies, by Key Countries
- 4.3.2. Tariffs and Standards
- 4.3.3. Impact Analysis of Regulations on the Market
- 4.4. Value Chain Analysis
- 4.4.1. Component Suppliers
- 4.4.2. Manufacturing
- 4.4.3. Distribution
- 4.4.4. End-Use
- 4.5. Cost Structure Analysis
- 4.5.1. Parameter’s Share for Cost Associated
- 4.5.2. COGP vs COGS
- 4.5.3. Profit Margin Analysis
- 4.6. Pricing Analysis
- 4.6.1. Regional Pricing Analysis
- 4.6.2. Segmental Pricing Trends
- 4.6.3. Factors Influencing Pricing
- 4.7. Porter’s Five Forces Analysis
- 4.8. PESTEL Analysis
- 4.9. Global Smart Lighting Market Demand
- 4.9.1. Historical Market Size – Volume (Million Units) and Value (US$ Bn), 2020-2024
- 4.9.2. Current and Future Market Size – Volume (Million Units) and Value (US$ Bn), 2026–2035
- 4.9.2.1. Y-o-Y Growth Trends
- 4.9.2.2. Absolute $ Opportunity Assessment
- 4.1. Market Dynamics
- 5. Competition Landscape
- 5.1. Competition structure
- 5.1.1. Fragmented v/s consolidated
- 5.2. Company Share Analysis, 2025
- 5.2.1. Global Company Market Share
- 5.2.2. By Region
- 5.2.2.1. North America
- 5.2.2.2. Europe
- 5.2.2.3. Asia Pacific
- 5.2.2.4. Middle East
- 5.2.2.5. Africa
- 5.2.2.6. South America
- 5.3. Product Comparison Matrix
- 5.3.1. Specifications
- 5.3.2. Market Positioning
- 5.3.3. Pricing
- 5.1. Competition structure
- 6. Global Smart Lighting Market Analysis, by Product Type
- 6.1. Key Segment Analysis
- 6.2. Smart Lighting Market Size Volume (Million Units) and Value (US$ Bn), Analysis, and Forecasts, by Product Type, 2021-2035
- 6.2.1. Smart Light Bulbs
- 6.2.1.1. LED Smart Bulbs
- 6.2.1.2. CFL Smart Bulbs
- 6.2.1.3. Halogen Smart Bulbs
- 6.2.1.4. Others
- 6.2.2. Smart Light Luminaires
- 6.2.2.1. Recessed Lighting
- 6.2.2.2. Track Lighting
- 6.2.2.3. Pendant Lights
- 6.2.2.4. Chandeliers
- 6.2.2.5. Others
- 6.2.3. Smart Switches and Dimmers
- 6.2.4. Smart Light Strips
- 6.2.5. Smart Outdoor Lighting
- 6.2.6. Smart Emergency Lighting
- 6.2.7. Others
- 6.2.1. Smart Light Bulbs
- 7. Global Smart Lighting Market Analysis, by Technology
- 7.1. Key Segment Analysis
- 7.2. Smart Lighting Market Size Volume (Million Units) and Value (US$ Bn), Analysis, and Forecasts, by Technology, 2021-2035
- 7.2.1. Wireless Technology
- 7.2.1.1. Wi-Fi
- 7.2.1.2. Bluetooth
- 7.2.1.3. Zigbee
- 7.2.1.4. Z-Wave
- 7.2.1.5. Thread
- 7.2.1.6. EnOcean
- 7.2.1.7. Others
- 7.2.2. Wired Technology
- 7.2.2.1. Power over Ethernet (PoE)
- 7.2.2.2. Digital Addressable Lighting Interface (DALI)
- 7.2.2.3. KNX
- 7.2.2.4. Others
- 7.2.1. Wireless Technology
- 8. Global Smart Lighting Market Analysis, by Light Source
- 8.1. Key Segment Analysis
- 8.2. Smart Lighting Market Size Volume (Million Units) and Value (US$ Bn), Analysis, and Forecasts, by Light Source, 2021-2035
- 8.2.1. LED (Light Emitting Diode)
- 8.2.2. Fluorescent
- 8.2.3. Halogen
- 8.2.4. High-Intensity Discharge (HID)
- 8.2.5. Others
- 9. Global Smart Lighting Market Analysis, by Offering
- 9.1. Key Segment Analysis
- 9.2. Smart Lighting Market Size Volume (Million Units) and Value (US$ Bn), Analysis, and Forecasts, by Offering, 2021-2035
- 9.2.1. Hardware
- 9.2.1.1. Lights & Luminaires
- 9.2.1.2. Lighting Controls
- 9.2.1.3. Relays & Switches
- 9.2.1.4. Gateways
- 9.2.1.5. Sensors
- 9.2.1.6. Others
- 9.2.2. Software
- 9.2.2.1. Local/On-Premise
- 9.2.2.2. Cloud-Based
- 9.2.3. Services
- 9.2.3.1. Design & Engineering
- 9.2.3.2. Installation
- 9.2.3.3. Post-Installation
- 9.2.1. Hardware
- 10. Global Smart Lighting Market Analysis, by Sales Channel
- 10.1. Key Segment Analysis
- 10.2. Smart Lighting Market Size Volume (Million Units) and Value (US$ Bn), Analysis, and Forecasts, by Sales Channel, 2021-2035
- 10.2.1. Direct Sales
- 10.2.2. Distributors
- 10.2.3. Online Retail
- 10.2.4. Offline Retail
- 10.2.4.1. Specialty Stores
- 10.2.4.2. Hypermarkets/Supermarkets
- 10.2.4.3. Hardware Stores
- 10.2.4.4. Others
- 11. Global Smart Lighting Market Analysis, by Application
- 11.1. Key Segment Analysis
- 11.2. Smart Lighting Market Size Volume (Million Units) and Value (US$ Bn), Analysis, and Forecasts, by Application, 2021-2035
- 11.2.1. Indoor Lighting
- 11.2.1.1. General Lighting
- 11.2.1.2. Task Lighting
- 11.2.1.3. Accent Lighting
- 11.2.1.4. Ambient Lighting
- 11.2.1.5. Others
- 11.2.2. Outdoor Lighting
- 11.2.2.1. Street Lighting
- 11.2.2.2. Architectural Lighting
- 11.2.2.3. Landscape Lighting
- 11.2.2.4. Security Lighting
- 11.2.2.5. Others
- 11.2.1. Indoor Lighting
- 12. Global Smart Lighting Market Analysis, by Control System
- 12.1. Key Segment Analysis
- 12.2. Smart Lighting Market Size Volume (Million Units) and Value (US$ Bn), Analysis, and Forecasts, by Control System, 2021-2035
- 12.2.1. Standalone
- 12.2.2. Integrated Systems
- 12.2.3. Centralized Control
- 12.2.4. Distributed Control
- 13. Global Smart Lighting Market Analysis, by End-users
- 13.1. Key Segment Analysis
- 13.2. Smart Lighting Market Size Volume (Million Units) and Value (US$ Bn), Analysis, and Forecasts, by End-users, 2021-2035
- 13.2.1. Residential
- 13.2.1.1. Living Rooms
- 13.2.1.2. Bedrooms
- 13.2.1.3. Kitchens
- 13.2.1.4. Outdoor/Gardens
- 13.2.1.5. Garages
- 13.2.1.6. Others
- 13.2.2. Commercial
- 13.2.2.1. Offices
- 13.2.2.2. Retail Stores
- 13.2.2.3. Hospitality
- 13.2.2.4. Healthcare Facilities
- 13.2.2.5. Educational Institutions
- 13.2.2.6. Shopping Malls
- 13.2.2.7. Others
- 13.2.3. Industrial
- 13.2.3.1. Manufacturing Facilities
- 13.2.3.2. Warehouses
- 13.2.3.3. Production Lines
- 13.2.3.4. Storage Areas
- 13.2.3.5. Others
- 13.2.4. Outdoor/Public Spaces
- 13.2.4.1. Street & Highway Lighting
- 13.2.4.2. Parks & Recreational Areas
- 13.2.4.3. Parking Lots & Garages
- 13.2.4.4. Stadiums & Sports Facilities
- 13.2.4.5. Public Transport Stations
- 13.2.4.6. Others
- 13.2.5. Infrastructure
- 13.2.5.1. Smart Cities
- 13.2.5.2. Airports
- 13.2.5.3. Railway Stations
- 13.2.5.4. Bridges & Tunnels
- 13.2.6. Other End-users
- 13.2.1. Residential
- 14. Global Smart Lighting Market Analysis and Forecasts, by Region
- 14.1. Key Findings
- 14.2. Smart Lighting Market Size Volume (Million Units) and Value (US$ Bn), Analysis, and Forecasts, by Region, 2021-2035
- 14.2.1. North America
- 14.2.2. Europe
- 14.2.3. Asia Pacific
- 14.2.4. Middle East
- 14.2.5. Africa
- 14.2.6. South America
- 15. North America Smart Lighting Market Analysis
- 15.1. Key Segment Analysis
- 15.2. Regional Snapshot
- 15.3. North America Smart Lighting Market Size- Volume (Thousand units) and Value (US$ Bn), Analysis, and Forecasts, 2021-2035
- 15.3.1. Product Type
- 15.3.2. Technology
- 15.3.3. Light Source
- 15.3.4. Offering
- 15.3.5. Sales Channel
- 15.3.6. Application
- 15.3.7. Control System
- 15.3.8. End-users
- 15.3.9. Country
- 15.3.9.1. USA
- 15.3.9.2. Canada
- 15.3.9.3. Mexico
- 15.4. USA Smart Lighting Market
- 15.4.1. Country Segmental Analysis
- 15.4.2. Product Type
- 15.4.3. Technology
- 15.4.4. Light Source
- 15.4.5. Offering
- 15.4.6. Sales Channel
- 15.4.7. Application
- 15.4.8. Control System
- 15.4.9. End-users
- 15.5. Canada Smart Lighting Market
- 15.5.1. Country Segmental Analysis
- 15.5.2. Product Type
- 15.5.3. Technology
- 15.5.4. Light Source
- 15.5.5. Offering
- 15.5.6. Sales Channel
- 15.5.7. Application
- 15.5.8. Control System
- 15.5.9. End-users
- 15.6. Mexico Smart Lighting Market
- 15.6.1. Country Segmental Analysis
- 15.6.2. Product Type
- 15.6.3. Technology
- 15.6.4. Light Source
- 15.6.5. Offering
- 15.6.6. Sales Channel
- 15.6.7. Application
- 15.6.8. Control System
- 15.6.9. End-users
- 16. Europe Smart Lighting Market Analysis
- 16.1. Key Segment Analysis
- 16.2. Regional Snapshot
- 16.3. Europe Smart Lighting Market Size Volume (Million Units) and Value (US$ Bn), Analysis, and Forecasts, 2021-2035
- 16.3.1. Product Type
- 16.3.2. Technology
- 16.3.3. Light Source
- 16.3.4. Offering
- 16.3.5. Sales Channel
- 16.3.6. Application
- 16.3.7. Control System
- 16.3.8. End-users
- 16.3.9. Country
- 16.3.9.1. Germany
- 16.3.9.2. United Kingdom
- 16.3.9.3. France
- 16.3.9.4. Italy
- 16.3.9.5. Spain
- 16.3.9.6. Netherlands
- 16.3.9.7. Nordic Countries
- 16.3.9.8. Poland
- 16.3.9.9. Russia & CIS
- 16.3.9.10. Rest of Europe
- 16.4. Germany Smart Lighting Market
- 16.4.1. Country Segmental Analysis
- 16.4.2. Product Type
- 16.4.3. Technology
- 16.4.4. Light Source
- 16.4.5. Offering
- 16.4.6. Sales Channel
- 16.4.7. Application
- 16.4.8. Control System
- 16.4.9. End-users
- 16.5. United Kingdom Smart Lighting Market
- 16.5.1. Country Segmental Analysis
- 16.5.2. Product Type
- 16.5.3. Technology
- 16.5.4. Light Source
- 16.5.5. Offering
- 16.5.6. Sales Channel
- 16.5.7. Application
- 16.5.8. Control System
- 16.5.9. End-users
- 16.6. France Smart Lighting Market
- 16.6.1. Country Segmental Analysis
- 16.6.2. Product Type
- 16.6.3. Technology
- 16.6.4. Light Source
- 16.6.5. Offering
- 16.6.6. Sales Channel
- 16.6.7. Application
- 16.6.8. Control System
- 16.6.9. End-users
- 16.7. Italy Smart Lighting Market
- 16.7.1. Country Segmental Analysis
- 16.7.2. Product Type
- 16.7.3. Technology
- 16.7.4. Light Source
- 16.7.5. Offering
- 16.7.6. Sales Channel
- 16.7.7. Application
- 16.7.8. Control System
- 16.7.9. End-users
- 16.8. Spain Smart Lighting Market
- 16.8.1. Country Segmental Analysis
- 16.8.2. Product Type
- 16.8.3. Technology
- 16.8.4. Light Source
- 16.8.5. Offering
- 16.8.6. Sales Channel
- 16.8.7. Application
- 16.8.8. Control System
- 16.8.9. End-users
- 16.9. Netherlands Smart Lighting Market
- 16.9.1. Country Segmental Analysis
- 16.9.2. Product Type
- 16.9.3. Technology
- 16.9.4. Light Source
- 16.9.5. Offering
- 16.9.6. Sales Channel
- 16.9.7. Application
- 16.9.8. Control System
- 16.9.9. End-users
- 16.10. Nordic Countries Smart Lighting Market
- 16.10.1. Country Segmental Analysis
- 16.10.2. Product Type
- 16.10.3. Technology
- 16.10.4. Light Source
- 16.10.5. Offering
- 16.10.6. Sales Channel
- 16.10.7. Application
- 16.10.8. Control System
- 16.10.9. End-users
- 16.11. Poland Smart Lighting Market
- 16.11.1. Country Segmental Analysis
- 16.11.2. Product Type
- 16.11.3. Technology
- 16.11.4. Light Source
- 16.11.5. Offering
- 16.11.6. Sales Channel
- 16.11.7. Application
- 16.11.8. Control System
- 16.11.9. End-users
- 16.12. Russia & CIS Smart Lighting Market
- 16.12.1. Country Segmental Analysis
- 16.12.2. Product Type
- 16.12.3. Technology
- 16.12.4. Light Source
- 16.12.5. Offering
- 16.12.6. Sales Channel
- 16.12.7. Application
- 16.12.8. Control System
- 16.12.9. End-users
- 16.13. Rest of Europe Smart Lighting Market
- 16.13.1. Country Segmental Analysis
- 16.13.2. Product Type
- 16.13.3. Technology
- 16.13.4. Light Source
- 16.13.5. Offering
- 16.13.6. Sales Channel
- 16.13.7. Application
- 16.13.8. Control System
- 16.13.9. End-users
- 17. Asia Pacific Smart Lighting Market Analysis
- 17.1. Key Segment Analysis
- 17.2. Regional Snapshot
- 17.3. Asia Pacific Smart Lighting Market Size Volume (Million Units) and Value (US$ Bn), Analysis, and Forecasts, 2021-2035
- 17.3.1. Product Type
- 17.3.2. Technology
- 17.3.3. Light Source
- 17.3.4. Offering
- 17.3.5. Sales Channel
- 17.3.6. Application
- 17.3.7. Control System
- 17.3.8. End-users
- 17.3.9. Country
- 17.3.9.1. China
- 17.3.9.2. India
- 17.3.9.3. Japan
- 17.3.9.4. South Korea
- 17.3.9.5. Australia and New Zealand
- 17.3.9.6. Indonesia
- 17.3.9.7. Malaysia
- 17.3.9.8. Thailand
- 17.3.9.9. Vietnam
- 17.3.9.10. Rest of Asia Pacific
- 17.4. China Smart Lighting Market
- 17.4.1. Country Segmental Analysis
- 17.4.2. Product Type
- 17.4.3. Technology
- 17.4.4. Light Source
- 17.4.5. Offering
- 17.4.6. Sales Channel
- 17.4.7. Application
- 17.4.8. Control System
- 17.4.9. End-users
- 17.5. India Smart Lighting Market
- 17.5.1. Country Segmental Analysis
- 17.5.2. Product Type
- 17.5.3. Technology
- 17.5.4. Light Source
- 17.5.5. Offering
- 17.5.6. Sales Channel
- 17.5.7. Application
- 17.5.8. Control System
- 17.5.9. End-users
- 17.6. Japan Smart Lighting Market
- 17.6.1. Country Segmental Analysis
- 17.6.2. Product Type
- 17.6.3. Technology
- 17.6.4. Light Source
- 17.6.5. Offering
- 17.6.6. Sales Channel
- 17.6.7. Application
- 17.6.8. Control System
- 17.6.9. End-users
- 17.7. South Korea Smart Lighting Market
- 17.7.1. Country Segmental Analysis
- 17.7.2. Product Type
- 17.7.3. Technology
- 17.7.4. Light Source
- 17.7.5. Offering
- 17.7.6. Sales Channel
- 17.7.7. Application
- 17.7.8. Control System
- 17.7.9. End-users
- 17.8. Australia and New Zealand Smart Lighting Market
- 17.8.1. Country Segmental Analysis
- 17.8.2. Product Type
- 17.8.3. Technology
- 17.8.4. Light Source
- 17.8.5. Offering
- 17.8.6. Sales Channel
- 17.8.7. Application
- 17.8.8. Control System
- 17.8.9. End-users
- 17.9. Indonesia Smart Lighting Market
- 17.9.1. Country Segmental Analysis
- 17.9.2. Product Type
- 17.9.3. Technology
- 17.9.4. Light Source
- 17.9.5. Offering
- 17.9.6. Sales Channel
- 17.9.7. Application
- 17.9.8. Control System
- 17.9.9. End-users
- 17.10. Malaysia Smart Lighting Market
- 17.10.1. Country Segmental Analysis
- 17.10.2. Product Type
- 17.10.3. Technology
- 17.10.4. Light Source
- 17.10.5. Offering
- 17.10.6. Sales Channel
- 17.10.7. Application
- 17.10.8. Control System
- 17.10.9. End-users
- 17.11. Thailand Smart Lighting Market
- 17.11.1. Country Segmental Analysis
- 17.11.2. Product Type
- 17.11.3. Technology
- 17.11.4. Light Source
- 17.11.5. Offering
- 17.11.6. Sales Channel
- 17.11.7. Application
- 17.11.8. Control System
- 17.11.9. End-users
- 17.12. Vietnam Smart Lighting Market
- 17.12.1. Country Segmental Analysis
- 17.12.2. Product Type
- 17.12.3. Technology
- 17.12.4. Light Source
- 17.12.5. Offering
- 17.12.6. Sales Channel
- 17.12.7. Application
- 17.12.8. Control System
- 17.12.9. End-users
- 17.13. Rest of Asia Pacific Smart Lighting Market
- 17.13.1. Country Segmental Analysis
- 17.13.2. Product Type
- 17.13.3. Technology
- 17.13.4. Light Source
- 17.13.5. Offering
- 17.13.6. Sales Channel
- 17.13.7. Application
- 17.13.8. Control System
- 17.13.9. End-users
- 18. Middle East Smart Lighting Market Analysis
- 18.1. Key Segment Analysis
- 18.2. Regional Snapshot
- 18.3. Middle East Smart Lighting Market Size Volume (Million Units) and Value (US$ Bn), Analysis, and Forecasts, 2021-2035
- 18.3.1. Product Type
- 18.3.2. Technology
- 18.3.3. Light Source
- 18.3.4. Offering
- 18.3.5. Sales Channel
- 18.3.6. Application
- 18.3.7. Control System
- 18.3.8. End-users
- 18.3.9. Country
- 18.3.9.1. Turkey
- 18.3.9.2. UAE
- 18.3.9.3. Saudi Arabia
- 18.3.9.4. Israel
- 18.3.9.5. Rest of Middle East
- 18.4. Turkey Smart Lighting Market
- 18.4.1. Country Segmental Analysis
- 18.4.2. Product Type
- 18.4.3. Technology
- 18.4.4. Light Source
- 18.4.5. Offering
- 18.4.6. Sales Channel
- 18.4.7. Application
- 18.4.8. Control System
- 18.4.9. End-users
- 18.5. UAE Smart Lighting Market
- 18.5.1. Country Segmental Analysis
- 18.5.2. Product Type
- 18.5.3. Technology
- 18.5.4. Light Source
- 18.5.5. Offering
- 18.5.6. Sales Channel
- 18.5.7. Application
- 18.5.8. Control System
- 18.5.9. End-users
- 18.6. Saudi Arabia Smart Lighting Market
- 18.6.1. Country Segmental Analysis
- 18.6.2. Product Type
- 18.6.3. Technology
- 18.6.4. Light Source
- 18.6.5. Offering
- 18.6.6. Sales Channel
- 18.6.7. Application
- 18.6.8. Control System
- 18.6.9. End-users
- 18.7. Israel Smart Lighting Market
- 18.7.1. Country Segmental Analysis
- 18.7.2. Product Type
- 18.7.3. Technology
- 18.7.4. Light Source
- 18.7.5. Offering
- 18.7.6. Sales Channel
- 18.7.7. Application
- 18.7.8. Control System
- 18.7.9. End-users
- 18.8. Rest of Middle East Smart Lighting Market
- 18.8.1. Country Segmental Analysis
- 18.8.2. Product Type
- 18.8.3. Technology
- 18.8.4. Light Source
- 18.8.5. Offering
- 18.8.6. Sales Channel
- 18.8.7. Application
- 18.8.8. Control System
- 18.8.9. End-users
- 19. Africa Smart Lighting Market Analysis
- 19.1. Key Segment Analysis
- 19.2. Regional Snapshot
- 19.3. Africa Smart Lighting Market Size Volume (Million Units) and Value (US$ Bn), Analysis, and Forecasts, 2021-2035
- 19.3.1. Product Type
- 19.3.2. Technology
- 19.3.3. Light Source
- 19.3.4. Offering
- 19.3.5. Sales Channel
- 19.3.6. Application
- 19.3.7. Control System
- 19.3.8. End-users
- 19.3.9. Country
- 19.3.9.1. South Africa
- 19.3.9.2. Egypt
- 19.3.9.3. Nigeria
- 19.3.9.4. Algeria
- 19.3.9.5. Rest of Africa
- 19.4. South Africa Smart Lighting Market
- 19.4.1. Country Segmental Analysis
- 19.4.2. Product Type
- 19.4.3. Technology
- 19.4.4. Light Source
- 19.4.5. Offering
- 19.4.6. Sales Channel
- 19.4.7. Application
- 19.4.8. Control System
- 19.4.9. End-users
- 19.5. Egypt Smart Lighting Market
- 19.5.1. Country Segmental Analysis
- 19.5.2. Product Type
- 19.5.3. Technology
- 19.5.4. Light Source
- 19.5.5. Offering
- 19.5.6. Sales Channel
- 19.5.7. Application
- 19.5.8. Control System
- 19.5.9. End-users
- 19.6. Nigeria Smart Lighting Market
- 19.6.1. Country Segmental Analysis
- 19.6.2. Product Type
- 19.6.3. Technology
- 19.6.4. Light Source
- 19.6.5. Offering
- 19.6.6. Sales Channel
- 19.6.7. Application
- 19.6.8. Control System
- 19.6.9. End-users
- 19.7. Algeria Smart Lighting Market
- 19.7.1. Country Segmental Analysis
- 19.7.2. Product Type
- 19.7.3. Technology
- 19.7.4. Light Source
- 19.7.5. Offering
- 19.7.6. Sales Channel
- 19.7.7. Application
- 19.7.8. Control System
- 19.7.9. End-users
- 19.8. Rest of Africa Smart Lighting Market
- 19.8.1. Country Segmental Analysis
- 19.8.2. Product Type
- 19.8.3. Technology
- 19.8.4. Light Source
- 19.8.5. Offering
- 19.8.6. Sales Channel
- 19.8.7. Application
- 19.8.8. Control System
- 19.8.9. End-users
- 20. South America Smart Lighting Market Analysis
- 20.1. Key Segment Analysis
- 20.2. Regional Snapshot
- 20.3. South America Smart Lighting Market Size Volume (Million Units) and Value (US$ Bn), Analysis, and Forecasts, 2021-2035
- 20.3.1. Product Type
- 20.3.2. Technology
- 20.3.3. Light Source
- 20.3.4. Offering
- 20.3.5. Sales Channel
- 20.3.6. Application
- 20.3.7. Control System
- 20.3.8. End-users
- 20.3.9. Country
- 20.3.9.1. Brazil
- 20.3.9.2. Argentina
- 20.3.9.3. Rest of South America
- 20.4. Brazil Smart Lighting Market
- 20.4.1. Country Segmental Analysis
- 20.4.2. Product Type
- 20.4.3. Technology
- 20.4.4. Light Source
- 20.4.5. Offering
- 20.4.6. Sales Channel
- 20.4.7. Application
- 20.4.8. Control System
- 20.4.9. End-users
- 20.5. Argentina Smart Lighting Market
- 20.5.1. Country Segmental Analysis
- 20.5.2. Product Type
- 20.5.3. Technology
- 20.5.4. Light Source
- 20.5.5. Offering
- 20.5.6. Sales Channel
- 20.5.7. Application
- 20.5.8. Control System
- 20.5.9. End-users
- 20.6. Rest of South America Smart Lighting Market
- 20.6.1. Country Segmental Analysis
- 20.6.2. Product Type
- 20.6.3. Technology
- 20.6.4. Light Source
- 20.6.5. Offering
- 20.6.6. Sales Channel
- 20.6.7. Application
- 20.6.8. Control System
- 20.6.9. End-users
- 21. Key Players/ Company Profile
- 21.1. Acuity Brands, Inc.
- 21.1.1. Company Details/ Overview
- 21.1.2. Company Financials
- 21.1.3. Key Customers and Competitors
- 21.1.4. Business/ Industry Portfolio
- 21.1.5. Product Portfolio/ Specification Details
- 21.1.6. Pricing Data
- 21.1.7. Strategic Overview
- 21.1.8. Recent Developments
- 21.2. Cree, Inc.
- 21.3. Digital Lumens, Inc.
- 21.4. Eaton Corporation
- 21.5. GE Lighting - A Savant Company
- 21.6. Havells India Ltd.
- 21.7. Honeywell International Inc.
- 21.8. Hubbell Incorporated
- 21.9. Legrand S.A.
- 21.10. Leviton Manufacturing Co., Inc.
- 21.11. LG Electronics Inc.
- 21.12. Lutron Electronics Co., Inc.
- 21.13. OSRAM Licht AG
- 21.14. Savant Systems LLC
- 21.15. Schneider Electric SE
- 21.16. Signify N.V.
- 21.17. Syska LED Lights
- 21.18. TP-Link Systems Inc.
- 21.19. Wipro Lighting
- 21.20. Zumtobel Group AG
- 21.21. Other Key Players
- 21.1. Acuity Brands, Inc.
Note* - This is just tentative list of players. While providing the report, we will cover more number of players based on their revenue and share for each geography
Research Design
Our research design integrates both demand-side and supply-side analysis through a balanced combination of primary and secondary research methodologies. By utilizing both bottom-up and top-down approaches alongside rigorous data triangulation methods, we deliver robust market intelligence that supports strategic decision-making.
MarketGenics' comprehensive research design framework ensures the delivery of accurate, reliable, and actionable market intelligence. Through the integration of multiple research approaches, rigorous validation processes, and expert analysis, we provide our clients with the insights needed to make informed strategic decisions and capitalize on market opportunities.

MarketGenics leverages a dedicated industry panel of experts and a comprehensive suite of paid databases to effectively collect, consolidate, and analyze market intelligence.
Our approach has consistently proven to be reliable and effective in generating accurate market insights, identifying key industry trends, and uncovering emerging business opportunities.
Through both primary and secondary research, we capture and analyze critical company-level data such as manufacturing footprints, including technical centers, R&D facilities, sales offices, and headquarters.
Our expert panel further enhances our ability to estimate market size for specific brands based on validated field-level intelligence.
Our data mining techniques incorporate both parametric and non-parametric methods, allowing for structured data collection, sorting, processing, and cleaning.
Demand projections are derived from large-scale data sets analyzed through proprietary algorithms, culminating in robust and reliable market sizing.
Research Approach
The bottom-up approach builds market estimates by starting with the smallest addressable market units and systematically aggregating them to create comprehensive market size projections.
This method begins with specific, granular data points and builds upward to create the complete market landscape.
Customer Analysis → Segmental Analysis → Geographical Analysis
The top-down approach starts with the broadest possible market data and systematically narrows it down through a series of filters and assumptions to arrive at specific market segments or opportunities.
This method begins with the big picture and works downward to increasingly specific market slices.
TAM → SAM → SOM


Research Methods
Desk / Secondary Research
While analysing the market, we extensively study secondary sources, directories, and databases to identify and collect information useful for this technical, market-oriented, and commercial report. Secondary sources that we utilize are not only the public sources, but it is a combination of Open Source, Associations, Paid Databases, MG Repository & Knowledgebase, and others.
- Company websites, annual reports, financial reports, broker reports, and investor presentations
- National government documents, statistical databases and reports
- News articles, press releases and web-casts specific to the companies operating in the market, Magazines, reports, and others
- We gather information from commercial data sources for deriving company specific data such as segmental revenue, share for geography, product revenue, and others
- Internal and external proprietary databases (industry-specific), relevant patent, and regulatory databases
- Governing Bodies, Government Organizations
- Relevant Authorities, Country-specific Associations for Industries
We also employ the model mapping approach to estimate the product level market data through the players' product portfolio
Primary Research
Primary research/ interviews is vital in analyzing the market. Most of the cases involves paid primary interviews. Primary sources include primary interviews through e-mail interactions, telephonic interviews, surveys as well as face-to-face interviews with the different stakeholders across the value chain including several industry experts.
| Type of Respondents | Number of Primaries |
|---|---|
| Tier 2/3 Suppliers | ~20 |
| Tier 1 Suppliers | ~25 |
| End-users | ~25 |
| Industry Expert/ Panel/ Consultant | ~30 |
| Total | ~100 |
MG Knowledgebase
• Repository of industry blog, newsletter and case studies
• Online platform covering detailed market reports, and company profiles
Forecasting Factors and Models
Forecasting Factors
- Historical Trends – Past market patterns, cycles, and major events that shaped how markets behave over time. Understanding past trends helps predict future behavior.
- Industry Factors – Specific characteristics of the industry like structure, regulations, and innovation cycles that affect market dynamics.
- Macroeconomic Factors – Economic conditions like GDP growth, inflation, and employment rates that affect how much money people have to spend.
- Demographic Factors – Population characteristics like age, income, and location that determine who can buy your product.
- Technology Factors – How quickly people adopt new technology and how much technology infrastructure exists.
- Regulatory Factors – Government rules, laws, and policies that can help or restrict market growth.
- Competitive Factors – Analyzing competition structure such as degree of competition and bargaining power of buyers and suppliers.
Forecasting Models / Techniques
Multiple Regression Analysis
- Identify and quantify factors that drive market changes
- Statistical modeling to establish relationships between market drivers and outcomes
Time Series Analysis – Seasonal Patterns
- Understand regular cyclical patterns in market demand
- Advanced statistical techniques to separate trend, seasonal, and irregular components
Time Series Analysis – Trend Analysis
- Identify underlying market growth patterns and momentum
- Statistical analysis of historical data to project future trends
Expert Opinion – Expert Interviews
- Gather deep industry insights and contextual understanding
- In-depth interviews with key industry stakeholders
Multi-Scenario Development
- Prepare for uncertainty by modeling different possible futures
- Creating optimistic, pessimistic, and most likely scenarios
Time Series Analysis – Moving Averages
- Sophisticated forecasting for complex time series data
- Auto-regressive integrated moving average models with seasonal components
Econometric Models
- Apply economic theory to market forecasting
- Sophisticated economic models that account for market interactions
Expert Opinion – Delphi Method
- Harness collective wisdom of industry experts
- Structured, multi-round expert consultation process
Monte Carlo Simulation
- Quantify uncertainty and probability distributions
- Thousands of simulations with varying input parameters
Research Analysis
Our research framework is built upon the fundamental principle of validating market intelligence from both demand and supply perspectives. This dual-sided approach ensures comprehensive market understanding and reduces the risk of single-source bias.
Demand-Side Analysis: We understand end-user/application behavior, preferences, and market needs along with the penetration of the product for specific application.
Supply-Side Analysis: We estimate overall market revenue, analyze the segmental share along with industry capacity, competitive landscape, and market structure.
Validation & Evaluation
Data triangulation is a validation technique that uses multiple methods, sources, or perspectives to examine the same research question, thereby increasing the credibility and reliability of research findings. In market research, triangulation serves as a quality assurance mechanism that helps identify and minimize bias, validate assumptions, and ensure accuracy in market estimates.
- Data Source Triangulation – Using multiple data sources to examine the same phenomenon
- Methodological Triangulation – Using multiple research methods to study the same research question
- Investigator Triangulation – Using multiple researchers or analysts to examine the same data
- Theoretical Triangulation – Using multiple theoretical perspectives to interpret the same data

Custom Market Research Services
We will customise the research for you, in case the report listed above does not meet your requirements.
Get 10% Free Customisation