Crop Monitoring Market Size, Share & Trends Analysis Report by Offering Type (Hardware Solutions, Software Solutions, Services), Technology Type, Connectivity, Application, Application Method, End-use, and Geography (North America, Europe, Asia Pacific, Middle East, Africa, and South America) – Global Industry Data, Trends, and Forecasts, 2026–2035
|
|
|
Segmental Data Insights |
|
|
Demand Trends |
|
|
Competitive Landscape |
|
|
Strategic Development |
|
|
Future Outlook & Opportunities |
|
Crop Monitoring Market Size, Share, and Growth
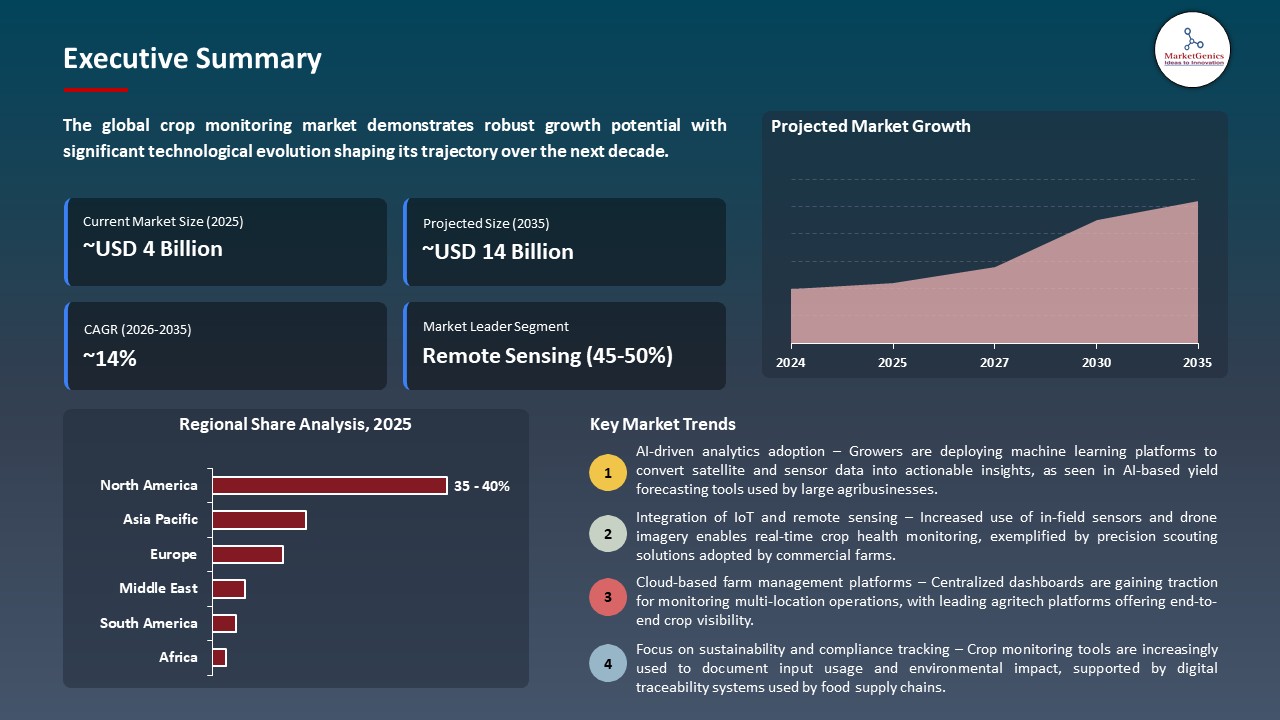
The global crop monitoring market is witnessing strong growth, valued at USD 3.7 billion in 2025 and projected to reach ~USD 14 billion by 2035, expanding at a CAGR of 14.2% during the forecast period. The crop monitoring market is an independent AI-driven IoT-sensing and real-time data analytics system, which makes it possible to monitor crops in real-time, optimize the process of applying resources, quickly adapt to the changes in the environment, and reduce the use of labor without demonstrating operational risks on farms.
Dr. Shai Sela, Chief Scientist at Agmatix, said, The most critical element in any AI model is the quality of the data driving it. By harmonizing and enriching SCN field trial data through our platform, we can ensure consistent, reliable outputs – regardless of region, soil type or cropping conditions. It’s a novel approach that dramatically increases the model’s predictive power, putting actionable insights directly into the hands of growers.
Crop monitoring is a fast-evolving market facilitated by the incorporation of connected and autonomous farm technologies that improve productivity and resource utilization and allow making data-driven decisions. Farm management is changing with AI-controlled crop sensors, drone cameras, and precision monitoring platforms to enable large-scale farms to monitor soil, water, and crop conditions with a low amount of labor and less operational hazards.
State-of-the-art technologies, like IoT-based sensors, edge computing, satellite imagery, predictive analytics, etc., allow real-time monitoring of the environmental and crop situation. Location-specific, automated interventions enhance quality of yields, resource allocation and wastage of inputs. They are using machine learning models that utilize high-resolution satellite and drone data, and predict the health of crops, the timing and method of planting crops, and their yield after harvest, which guarantees accurate farm management.
The adjacent opportunities in autonomous harvesting, robotic weeding, autonomous control of nutrients and pests, and farm to market supply chain integration are making operations more scalable, reducing costs, and increasing sustainability indicators. The market has become one of the enablers of sustainable, high-efficiency, and technology-driven agriculture in the world with the development of modular, cloud-based, and interoperable systems to monitor crops.
 Crop Monitoring Market Dynamics and Trends
Driver: Growing demand for real‑time crop insights and actionable intelligence
-
The increasing worldwide food demand, diminishing agricultural area, and climate change are compelling farmers and agribusiness to embrace innovative crop surveillance technologies that can offer real-time and continuous information to maximize output, utilization and sustainable production.
- The contemporary crop surveillance systems are becoming more and more competent to carry out field assessments in details, such as plant health analysis, nutrients condition mapping, and detection of pests, allowing the application of accurate and timely interventions to achieve the most out of productivity.
- Crop Monitoring technologies enhance real-time monitoring, resource management, and operational efficiency, enabling farms to make rapid and evidence-based decisions and fulfill the increased requirements of food supply without wasting resources and harming the environment.
Restraint: High implementation costs and limited connectivity infrastructure
-
Advanced crop monitoring systems, such as AI-enabled drones, autonomous tractors, IoT sensor networks, edge computing devices, and integrated software platforms, require high capitalization that restricts their use over traditional methods of monitoring.
- Ongoing operation costs, including cloud analytics subscriptions, software support, data storage, and operator training also add to the cost, and only large commercial operations can afford to deploy it to large scale since small and mid-sized farms are not likely to have the resources.
- The lack of rural broadband, patchy network coverage and lack of skilled workers present further deployment barriers especially in the developing regions where digital infrastructure is least developed.
Opportunity: Integration of edge AI and multi‑sensor fusion technologies
-
Crop monitoring multisensors crop stress detection, disease prevention, and optimal input management Multisensors Crop monitoring platforms with edge AI are generating major opportunities in the global crop monitoring market by providing real time predictive analytics on crop stress detection, disease prevention, and optimal input control.
- State-of-the-art machine-learning models running on the edge enable autonomous and real-time decisions. For instance, in November 2025, scientists of UCLouvain created a transformer-based AI model that is able to combine Sentinel-1 SAR and Sentinel-2 optical data into a unified system to provide near-real-time crop tracking and early warning in all-weather conditions, complementing yield estimation and field-level decision-making processes worldwide.
- Edge AI and multi-sensor fusion: This set of technology can be used to create quicker, scalable, and actionable crop insights that can enhance yield, operational efficiency, and decision-making in farms of any scale around the world.
Key Trend: Convergence of multi‑source remote sensing with predictive analytics
-
The combination of satellite visualization, UAV/drone data, field sensors using the IoT, and AI-based predictive models becomes a significant developmental trend in the Crop Monitoring market in the world.
- Machine-learning analytics are also used more to obtain field-level, real-time insights. As an example, in January 2026, Taranis and SiFly introduced a Field Validation Program to scale an aerial crop intelligence.
- Multi-source analytics powered by AI will allow cultivating insights with more speed and scale, enhancing the yield and productivity of farms of any size.
Crop Monitoring Market Analysis and Segmental Data
Remote Sensing Dominate Global Crop Monitoring Market
-
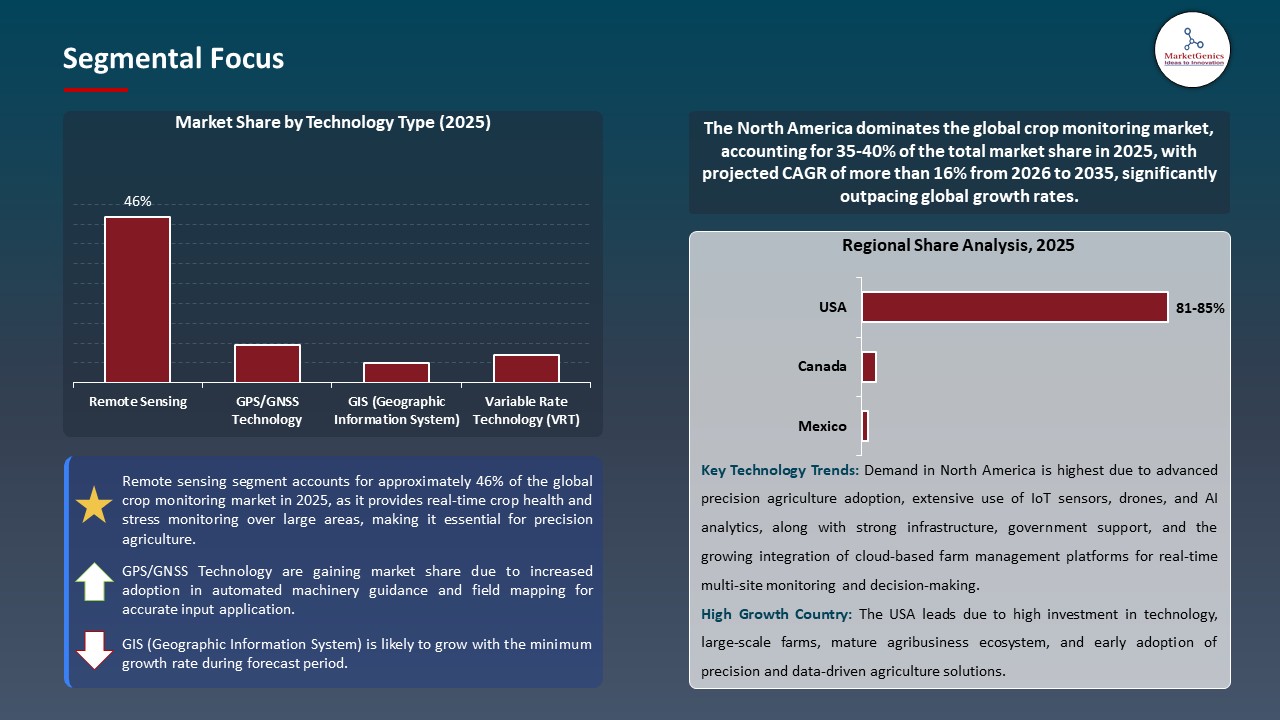
Remote sensing holds the leading position in the global crop monitoring market, with agritech solution vendors, satellite data agencies, and cloud platforms investing in AI-enabled IoT infrastructure that brings drones, satellite imagery, field sensors, and cloud analytics together to offer real-time crop health, crop growth monitoring, and soil conditions information to the global market.
- Platform interoperability and modular architectures are improving the degree of operational efficiency. For instance, in November 2024, Sentera Inc. unveiled its AI-Driven Remote Sensing Drone Suite, which is the combination of multispectral drone imaging, machine learning, and cloud-based analytics, which identify stress, nutrient deficiencies, and pest epidemics on crops and substantially enhance the effectiveness of decision-making and farm productivity.
- This industry leadership through crop monitoring is reinforced by the ability to upgrade faster and easy integration.
North America Leads Global Crop Monitoring Market Demand
-
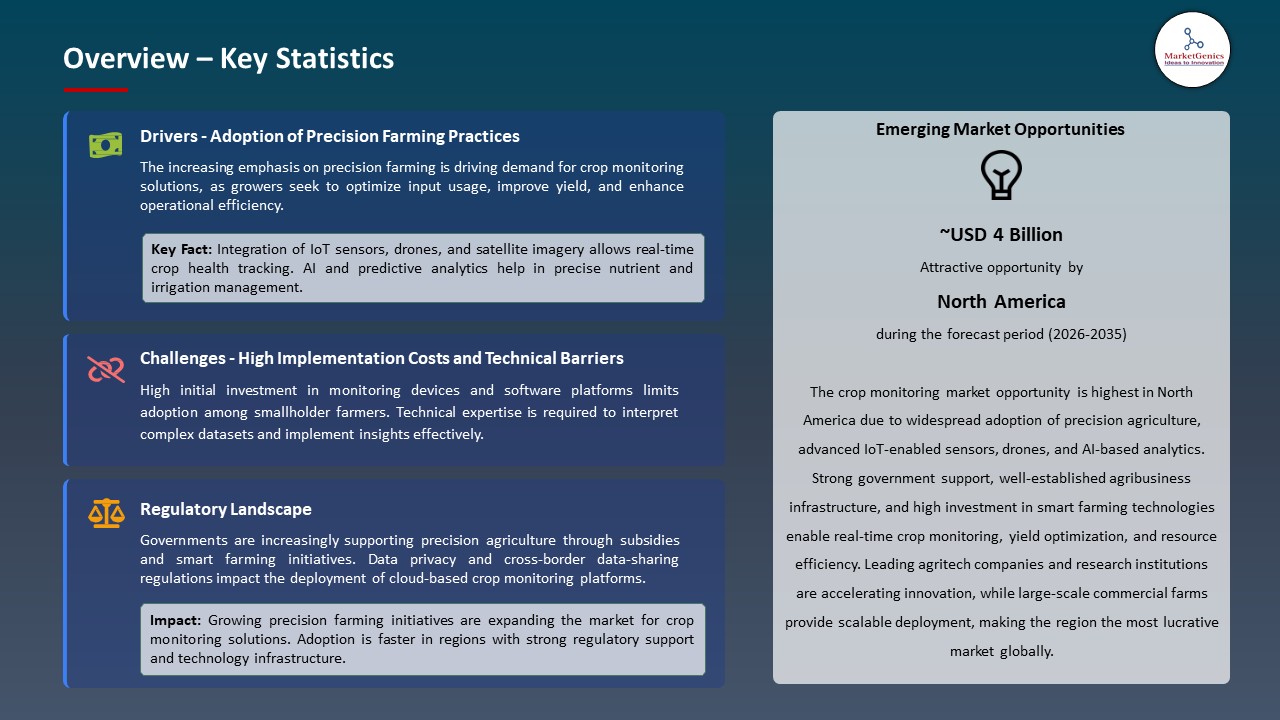
North America is a leading region in the global crop monitoring market, supported by large-scale commercial farming operations, early adoption of precision agriculture technologies, and widespread deployment of satellite imaging, IoT-enabled sensors, drones, and AI-driven analytics to improve crop productivity and resource efficiency.
- Digital crop monitoring adoption is accelerating across the region, driven by increasing use of real-time field monitoring platforms, predictive analytics, and data-driven decision-support systems that enable optimized input application, early stress detection, and yield forecasting.
- Strong R&D investment, advanced digital infrastructure, and supportive precision-agriculture policies continue to reinforce North America’s leadership in technology-driven crop monitoring adoption.
Crop Monitoring Market Ecosystem
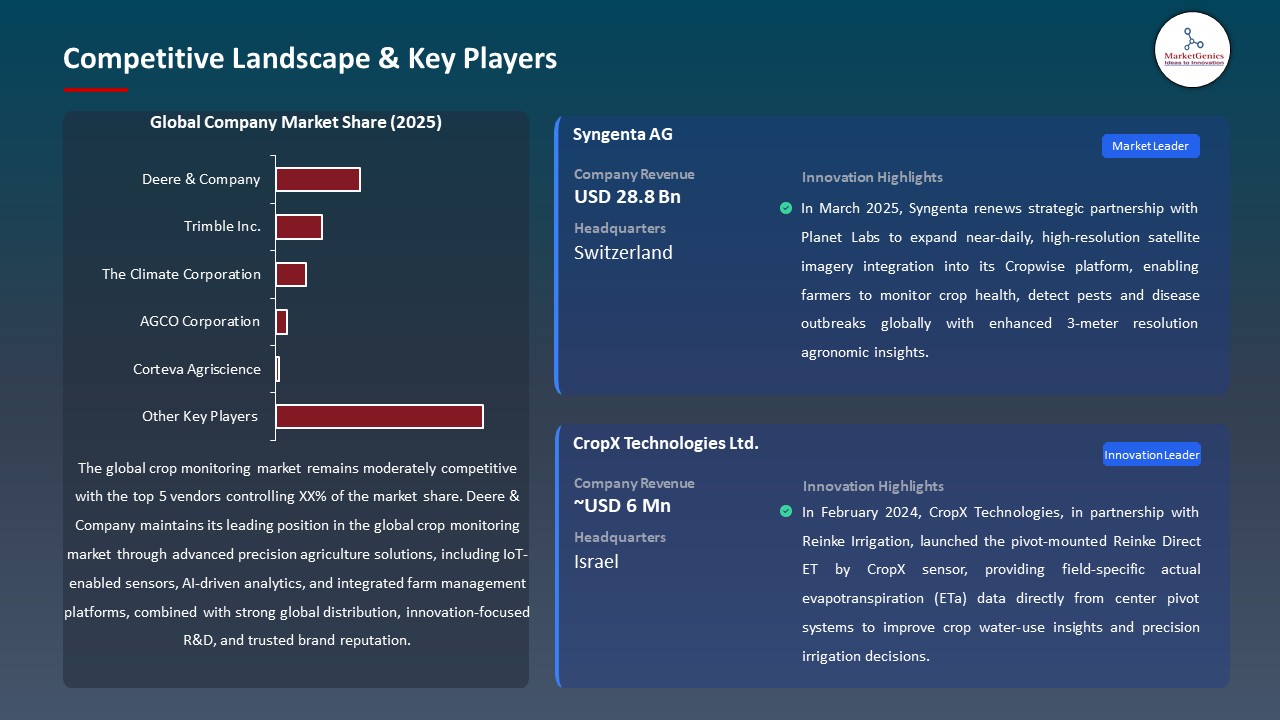
The crop monitoring market is moderately consolidated, and the level of competition is on AI-based crop analytics, satellite and drone-based monitoring, IoT-enabled field sensors, and integrated farm management solutions. The existence of Deere and Company, Trimble Inc. The Climate Corporation, AGCO Corporation and Corteva Agriscience have a significant market share based on delivery of whole crop production cycle and soil environment, weather patterns and farm operations through end-to-end crop monitoring ecosystems that combine linked machinery, remote sensing packages, decision software, and real-time crop intelligence based on data.
These firms focus on high-value and specialized crop monitoring solutions in order to make sure that they lead with technology. Deere & Company is investing in AI-enabled field monitoring, machine vision, connected equipment analytics built in with precision planting and harvesting; Trimble Inc. is marketing GPS-guided automation, satellite-based crop analytics, and digital field management solutions to enhance operational efficiency; The Climate Corporation is developing advanced digital agronomy by integrating weather intelligence, field-level crop modeling, and predictive analytics in its Climate FieldView ecosystem; AGCO Corporation is enhancing smart farming capabilities through connected machinery, sensor-based crop health monitoring, and integrated data platforms; and Corteva Agriscience is rein.
Sustainability-based policies on farming, governmental efforts to digitalize agriculture, and government-business partnerships with research centers and agri-technology startups are driving faster innovation in crop monitoring technologies, predictive analytics, remote sensing, and climate-resilient farming methods. These ecosystem processes contribute to competitive differentiation, scale deployment of technology, and speedier adoption and implementation of enhanced crop monitoring systems, which place the global Crop Monitoring market in perspective to meet the increasing food demand, enhance resource utilization, and sustain agricultural output.
 Recent Development and Strategic Overview
-
In November 2025, Syngenta introduced the Cropwise Open Platform and made its AI-driven Cropwise digital agriculture platform available to third-party developers globally to co-innovate and develop next-generation tools on its platform.
- In March 2025, BASF announced a strategic collaboration with Agmatix to develop an advanced AI-driven digital solution for soybean cyst nematode (SCN) detection and prediction one of the most damaging threats to soybean yields.
Report Scope
|
Detail |
|
|
Market Size in 2025 |
USD 3.7 Bn |
|
Market Forecast Value in 2035 |
~USD 14 Bn |
|
Growth Rate (CAGR) |
14.2% |
|
Forecast Period |
2026 – 2035 |
|
Historical Data Available for |
2021 – 2024 |
|
Market Size Units |
US$ Billion for Value |
|
Report Format |
Electronic (PDF) + Excel |
|
North America |
Europe |
Asia Pacific |
Middle East |
Africa |
South America |
|
|
|
|
|
|
|
Companies Covered |
|||||
|
|
|
|
|
|
Crop Monitoring Market Segmentation and Highlights
|
Segment |
Sub-segment |
|
Crop Monitoring Market, By Offering Type |
|
|
Crop Monitoring Market, By Technology Type |
|
|
Crop Monitoring Market, By Connectivity |
|
|
Crop Monitoring Market, By Application |
|
|
Crop Monitoring Market, By Application Method |
|
|
Crop Monitoring Market, By End-use |
|
Frequently Asked Questions
Table of Contents
- 1. Research Methodology and Assumptions
- 1.1. Definitions
- 1.2. Research Design and Approach
- 1.3. Data Collection Methods
- 1.4. Base Estimates and Calculations
- 1.5. Forecasting Models
- 1.5.1. Key Forecast Factors & Impact Analysis
- 1.6. Secondary Research
- 1.6.1. Open Sources
- 1.6.2. Paid Databases
- 1.6.3. Associations
- 1.7. Primary Research
- 1.7.1. Primary Sources
- 1.7.2. Primary Interviews with Stakeholders across Ecosystem
- 2. Executive Summary
- 2.1. Global Crop Monitoring Market Outlook
- 2.1.1. Crop Monitoring Market Size (Value - US$ Bn), and Forecasts, 2021-2035
- 2.1.2. Compounded Annual Growth Rate Analysis
- 2.1.3. Growth Opportunity Analysis
- 2.1.4. Segmental Share Analysis
- 2.1.5. Geographical Share Analysis
- 2.2. Market Analysis and Facts
- 2.3. Supply-Demand Analysis
- 2.4. Competitive Benchmarking
- 2.5. Go-to- Market Strategy
- 2.5.1. Customer/ End-use Industry Assessment
- 2.5.2. Growth Opportunity Data, 2026-2035
- 2.5.2.1. Regional Data
- 2.5.2.2. Country Data
- 2.5.2.3. Segmental Data
- 2.5.3. Identification of Potential Market Spaces
- 2.5.4. GAP Analysis
- 2.5.5. Potential Attractive Price Points
- 2.5.6. Prevailing Market Risks & Challenges
- 2.5.7. Preferred Sales & Marketing Strategies
- 2.5.8. Key Recommendations and Analysis
- 2.5.9. A Way Forward
- 2.1. Global Crop Monitoring Market Outlook
- 3. Industry Data and Premium Insights
- 3.1. Global Agriculture Industry Overview, 2025
- 3.1.1. Agriculture Industry Ecosystem Analysis
- 3.1.2. Key Trends for Agriculture Industry
- 3.1.3. Regional Distribution for Agriculture Industry
- 3.2. Supplier Customer Data
- 3.3. Technology Roadmap and Developments
- 3.4. Trade Analysis
- 3.4.1. Import & Export Analysis, 2025
- 3.4.2. Top Importing Countries
- 3.4.3. Top Exporting Countries
- 3.5. Trump Tariff Impact Analysis
- 3.5.1. Manufacturer
- 3.5.1.1. Based on the component & Raw material
- 3.5.2. Supply Chain
- 3.5.3. End Consumer
- 3.5.1. Manufacturer
- 3.6. Raw Material Analysis
- 3.1. Global Agriculture Industry Overview, 2025
- 4. Market Overview
- 4.1. Market Dynamics
- 4.1.1. Drivers
- 4.1.1.1. Increasing use of data-driven farm planning and yield forecasting tools to improve production accuracy and reduce operational uncertainty
- 4.1.1.2. Rising demand for automated monitoring and decision support across crop, livestock, and input management to enhance productivity and consistency
- 4.1.1.3. Growing focus on traceability, quality assurance, and compliance monitoring across agricultural value chains supported by AI-enabled analytics
- 4.1.2. Restraints
- 4.1.2.1. Limited digital readiness and availability of skilled personnel required to deploy, manage, and interpret AI-based agricultural systems
- 4.1.2.2. Integration complexity arising from fragmented farm infrastructure and lack of standardized data formats across agricultural operations
- 4.1.1. Drivers
- 4.2. Key Trend Analysis
- 4.3. Regulatory Framework
- 4.3.1. Key Regulations, Norms, and Subsidies, by Key Countries
- 4.3.2. Tariffs and Standards
- 4.3.3. Impact Analysis of Regulations on the Market
- 4.4. Value Chain Analysis
- 4.5. Porter’s Five Forces Analysis
- 4.6. PESTEL Analysis
- 4.7. Global Crop Monitoring Market Demand
- 4.7.1. Historical Market Size – Value (US$ Bn), 2020-2024
- 4.7.2. Current and Future Market Size – Value (US$ Bn), 2026–2035
- 4.7.2.1. Y-o-Y Growth Trends
- 4.7.2.2. Absolute $ Opportunity Assessment
- 4.1. Market Dynamics
- 5. Competition Landscape
- 5.1. Competition structure
- 5.1.1. Fragmented v/s consolidated
- 5.2. Company Share Analysis, 2025
- 5.2.1. Global Company Market Share
- 5.2.2. By Region
- 5.2.2.1. North America
- 5.2.2.2. Europe
- 5.2.2.3. Asia Pacific
- 5.2.2.4. Middle East
- 5.2.2.5. Africa
- 5.2.2.6. South America
- 5.3. Product Comparison Matrix
- 5.3.1. Specifications
- 5.3.2. Market Positioning
- 5.3.3. Pricing
- 5.1. Competition structure
- 6. Global Crop Monitoring Market Analysis, by Offering Type
- 6.1. Key Segment Analysis
- 6.2. Crop Monitoring Market Size (Value - US$ Bn), Analysis, and Forecasts, by Offering Type, 2021-2035
- 6.2.1. Hardware Solutions
- 6.2.1.1. Sensors
- 6.2.1.1.1. Soil Sensors
- 6.2.1.1.1.1. Moisture Sensors
- 6.2.1.1.1.2. pH Sensors
- 6.2.1.1.1.3. Temperature Sensors
- 6.2.1.1.1.4. Nutrient Sensors
- 6.2.1.1.1.5. Others
- 6.2.1.1.2. Optical Sensors
- 6.2.1.1.2.1. Multispectral Sensors
- 6.2.1.1.2.2. Hyperspectral Sensors
- 6.2.1.1.2.3. RGB Cameras
- 6.2.1.1.2.4. Thermal Sensors
- 6.2.1.1.2.5. Others
- 6.2.1.1.3. Weather Sensors
- 6.2.1.1.4. Location Sensors
- 6.2.1.1.5. Water Flow Sensors
- 6.2.1.1.6. Electrochemical Sensors
- 6.2.1.1.7. Other Sensors
- 6.2.1.1.1. Soil Sensors
- 6.2.1.2. Drones/UAVs
- 6.2.1.3. GPS Devices
- 6.2.1.4. Weather Stations
- 6.2.1.5. Irrigation Controllers
- 6.2.1.6. Data Loggers
- 6.2.1.7. Displays & Control Units
- 6.2.1.8. Cameras & Imaging Equipment
- 6.2.1.9. Others
- 6.2.1.1. Sensors
- 6.2.2. Software Solutions
- 6.2.2.1. Farm Management Software
- 6.2.2.2. Analytics Platforms
- 6.2.2.3. Mobile Applications
- 6.2.2.4. Cloud-based Platforms
- 6.2.2.5. Others
- 6.2.3. Services
- 6.2.3.1. Consulting Services
- 6.2.3.2. System Integration
- 6.2.3.3. Maintenance & Support
- 6.2.3.4. Training Services
- 6.2.3.5. Others
- 6.2.1. Hardware Solutions
- 7. Global Crop Monitoring Market Analysis, by Technology Type
- 7.1. Key Segment Analysis
- 7.2. Crop Monitoring Market Size (Value - US$ Bn), Analysis, and Forecasts, by Technology Type, 2021-2035
- 7.2.1. Remote Sensing
- 7.2.1.1. Satellite-Based Monitoring
- 7.2.1.2. Aerial/Drone-Based Monitoring
- 7.2.1.3. Ground-Based Sensors
- 7.2.1.4. Others
- 7.2.2. GPS/GNSS Technology
- 7.2.3. GIS (Geographic Information System)
- 7.2.4. Variable Rate Technology (VRT)
- 7.2.5. Guidance Systems
- 7.2.6. RFID Technology
- 7.2.7. IoT-Based Monitoring
- 7.2.8. AI/Machine Learning
- 7.2.1. Remote Sensing
- 8. Global Crop Monitoring Market Analysis, by Connectivity
- 8.1. Key Segment Analysis
- 8.2. Crop Monitoring Market Size (Value - US$ Bn), Analysis, and Forecasts, by Connectivity, 2021-2035
- 8.2.1. Wired Systems
- 8.2.2. Wireless Systems
- 8.2.2.1. Wi-Fi
- 8.2.2.2. Cellular (3G/4G/5G)
- 8.2.2.3. LoRaWAN
- 8.2.2.4. Satellite Communication
- 8.2.2.5. Bluetooth
- 8.2.2.6. Others
- 9. Global Crop Monitoring Market Analysis, by Application
- 9.1. Key Segment Analysis
- 9.2. Crop Monitoring Market Size (Value - US$ Bn), Analysis, and Forecasts, by Application, 2021-2035
- 9.2.1. Soil Monitoring
- 9.2.2. Crop Health Monitoring
- 9.2.3. Weather Monitoring
- 9.2.4. Pest & Disease Monitoring
- 9.2.5. Irrigation Monitoring
- 9.2.6. Yield Monitoring
- 9.2.7. Nutrient Monitoring
- 9.2.8. Weed Detection & Monitoring
- 10. Global Crop Monitoring Market Analysis, by Application Method
- 10.1. Key Segment Analysis
- 10.2. Crop Monitoring Market Size (Value - US$ Bn), Analysis, and Forecasts, by Application Method, 2021-2035
- 10.2.1. Real-time Monitoring
- 10.2.2. Periodic Monitoring
- 10.2.3. Continuous Monitoring
- 10.2.4. Predictive Monitoring
- 11. Global Crop Monitoring Market Analysis, by End-use
- 11.1. Key Segment Analysis
- 11.2. Crop Monitoring Market Size (Value - US$ Bn), Analysis, and Forecasts, by End-use, 2021-2035
- 11.2.1. Precision Farming
- 11.2.2. Crop Production & Management
- 11.2.3. Irrigation Management
- 11.2.4. Fertilizer & Nutrient Management
- 11.2.5. Pest & Disease Management
- 11.2.6. Weather & Climate Monitoring
- 11.2.7. Livestock Integration
- 11.2.8. Greenhouse & Controlled Environment
- 11.2.9. Others
- 12. Global Crop Monitoring Market Analysis and Forecasts, by Region
- 12.1. Key Findings
- 12.2. Crop Monitoring Market Size (Value - US$ Bn), Analysis, and Forecasts, by Region, 2021-2035
- 12.2.1. North America
- 12.2.2. Europe
- 12.2.3. Asia Pacific
- 12.2.4. Middle East
- 12.2.5. Africa
- 12.2.6. South America
- 13. North America Crop Monitoring Market Analysis
- 13.1. Key Segment Analysis
- 13.2. Regional Snapshot
- 13.3. North America Crop Monitoring Market Size (Value - US$ Bn), Analysis, and Forecasts, 2021-2035
- 13.3.1. Offering Type
- 13.3.2. Technology Type
- 13.3.3. Connectivity
- 13.3.4. Application
- 13.3.5. Application Method
- 13.3.6. End-use
- 13.3.7. Country
- 13.3.7.1. USA
- 13.3.7.2. Canada
- 13.3.7.3. Mexico
- 13.4. USA Crop Monitoring Market
- 13.4.1. Country Segmental Analysis
- 13.4.2. Offering Type
- 13.4.3. Technology Type
- 13.4.4. Connectivity
- 13.4.5. Application
- 13.4.6. Application Method
- 13.4.7. End-use
- 13.5. Canada Crop Monitoring Market
- 13.5.1. Country Segmental Analysis
- 13.5.2. Offering Type
- 13.5.3. Technology Type
- 13.5.4. Connectivity
- 13.5.5. Application
- 13.5.6. Application Method
- 13.5.7. End-use
- 13.6. Mexico Crop Monitoring Market
- 13.6.1. Country Segmental Analysis
- 13.6.2. Offering Type
- 13.6.3. Technology Type
- 13.6.4. Connectivity
- 13.6.5. Application
- 13.6.6. Application Method
- 13.6.7. End-use
- 14. Europe Crop Monitoring Market Analysis
- 14.1. Key Segment Analysis
- 14.2. Regional Snapshot
- 14.3. Europe Crop Monitoring Market Size (Value - US$ Bn), Analysis, and Forecasts, 2021-2035
- 14.3.1. Offering Type
- 14.3.2. Technology Type
- 14.3.3. Connectivity
- 14.3.4. Application
- 14.3.5. Application Method
- 14.3.6. End-use
- 14.3.7. Country
- 14.3.7.1. Germany
- 14.3.7.2. United Kingdom
- 14.3.7.3. France
- 14.3.7.4. Italy
- 14.3.7.5. Spain
- 14.3.7.6. Netherlands
- 14.3.7.7. Nordic Countries
- 14.3.7.8. Poland
- 14.3.7.9. Russia & CIS
- 14.3.7.10. Rest of Europe
- 14.4. Germany Crop Monitoring Market
- 14.4.1. Country Segmental Analysis
- 14.4.2. Offering Type
- 14.4.3. Technology Type
- 14.4.4. Connectivity
- 14.4.5. Application
- 14.4.6. Application Method
- 14.4.7. End-use
- 14.5. United Kingdom Crop Monitoring Market
- 14.5.1. Country Segmental Analysis
- 14.5.2. Offering Type
- 14.5.3. Technology Type
- 14.5.4. Connectivity
- 14.5.5. Application
- 14.5.6. Application Method
- 14.5.7. End-use
- 14.6. France Crop Monitoring Market
- 14.6.1. Country Segmental Analysis
- 14.6.2. Offering Type
- 14.6.3. Technology Type
- 14.6.4. Connectivity
- 14.6.5. Application
- 14.6.6. Application Method
- 14.6.7. End-use
- 14.7. Italy Crop Monitoring Market
- 14.7.1. Country Segmental Analysis
- 14.7.2. Offering Type
- 14.7.3. Technology Type
- 14.7.4. Connectivity
- 14.7.5. Application
- 14.7.6. Application Method
- 14.7.7. End-use
- 14.8. Spain Crop Monitoring Market
- 14.8.1. Country Segmental Analysis
- 14.8.2. Offering Type
- 14.8.3. Technology Type
- 14.8.4. Connectivity
- 14.8.5. Application
- 14.8.6. Application Method
- 14.8.7. End-use
- 14.9. Netherlands Crop Monitoring Market
- 14.9.1. Country Segmental Analysis
- 14.9.2. Offering Type
- 14.9.3. Technology Type
- 14.9.4. Connectivity
- 14.9.5. Application
- 14.9.6. Application Method
- 14.9.7. End-use
- 14.10. Nordic Countries Crop Monitoring Market
- 14.10.1. Country Segmental Analysis
- 14.10.2. Offering Type
- 14.10.3. Technology Type
- 14.10.4. Connectivity
- 14.10.5. Application
- 14.10.6. Application Method
- 14.10.7. End-use
- 14.11. Poland Crop Monitoring Market
- 14.11.1. Country Segmental Analysis
- 14.11.2. Offering Type
- 14.11.3. Technology Type
- 14.11.4. Connectivity
- 14.11.5. Application
- 14.11.6. Application Method
- 14.11.7. End-use
- 14.12. Russia & CIS Crop Monitoring Market
- 14.12.1. Country Segmental Analysis
- 14.12.2. Offering Type
- 14.12.3. Technology Type
- 14.12.4. Connectivity
- 14.12.5. Application
- 14.12.6. Application Method
- 14.12.7. End-use
- 14.13. Rest of Europe Crop Monitoring Market
- 14.13.1. Country Segmental Analysis
- 14.13.2. Offering Type
- 14.13.3. Technology Type
- 14.13.4. Connectivity
- 14.13.5. Application
- 14.13.6. Application Method
- 14.13.7. End-use
- 15. Asia Pacific Crop Monitoring Market Analysis
- 15.1. Key Segment Analysis
- 15.2. Regional Snapshot
- 15.3. Asia Pacific Crop Monitoring Market Size (Value - US$ Bn), Analysis, and Forecasts, 2021-2035
- 15.3.1. Offering Type
- 15.3.2. Technology Type
- 15.3.3. Connectivity
- 15.3.4. Application
- 15.3.5. Application Method
- 15.3.6. End-use
- 15.3.7. Country
- 15.3.7.1. China
- 15.3.7.2. India
- 15.3.7.3. Japan
- 15.3.7.4. South Korea
- 15.3.7.5. Australia and New Zealand
- 15.3.7.6. Indonesia
- 15.3.7.7. Malaysia
- 15.3.7.8. Thailand
- 15.3.7.9. Vietnam
- 15.3.7.10. Rest of Asia Pacific
- 15.4. China Crop Monitoring Market
- 15.4.1. Country Segmental Analysis
- 15.4.2. Offering Type
- 15.4.3. Technology Type
- 15.4.4. Connectivity
- 15.4.5. Application
- 15.4.6. Application Method
- 15.4.7. End-use
- 15.5. India Crop Monitoring Market
- 15.5.1. Country Segmental Analysis
- 15.5.2. Offering Type
- 15.5.3. Technology Type
- 15.5.4. Connectivity
- 15.5.5. Application
- 15.5.6. Application Method
- 15.5.7. End-use
- 15.6. Japan Crop Monitoring Market
- 15.6.1. Country Segmental Analysis
- 15.6.2. Offering Type
- 15.6.3. Technology Type
- 15.6.4. Connectivity
- 15.6.5. Application
- 15.6.6. Application Method
- 15.6.7. End-use
- 15.7. South Korea Crop Monitoring Market
- 15.7.1. Country Segmental Analysis
- 15.7.2. Offering Type
- 15.7.3. Technology Type
- 15.7.4. Connectivity
- 15.7.5. Application
- 15.7.6. Application Method
- 15.7.7. End-use
- 15.8. Australia and New Zealand Crop Monitoring Market
- 15.8.1. Country Segmental Analysis
- 15.8.2. Offering Type
- 15.8.3. Technology Type
- 15.8.4. Connectivity
- 15.8.5. Application
- 15.8.6. Application Method
- 15.8.7. End-use
- 15.9. Indonesia Crop Monitoring Market
- 15.9.1. Country Segmental Analysis
- 15.9.2. Offering Type
- 15.9.3. Technology Type
- 15.9.4. Connectivity
- 15.9.5. Application
- 15.9.6. Application Method
- 15.9.7. End-use
- 15.10. Malaysia Crop Monitoring Market
- 15.10.1. Country Segmental Analysis
- 15.10.2. Offering Type
- 15.10.3. Technology Type
- 15.10.4. Connectivity
- 15.10.5. Application
- 15.10.6. Application Method
- 15.10.7. End-use
- 15.11. Thailand Crop Monitoring Market
- 15.11.1. Country Segmental Analysis
- 15.11.2. Offering Type
- 15.11.3. Technology Type
- 15.11.4. Connectivity
- 15.11.5. Application
- 15.11.6. Application Method
- 15.11.7. End-use
- 15.12. Vietnam Crop Monitoring Market
- 15.12.1. Country Segmental Analysis
- 15.12.2. Offering Type
- 15.12.3. Technology Type
- 15.12.4. Connectivity
- 15.12.5. Application
- 15.12.6. Application Method
- 15.12.7. End-use
- 15.13. Rest of Asia Pacific Crop Monitoring Market
- 15.13.1. Country Segmental Analysis
- 15.13.2. Offering Type
- 15.13.3. Technology Type
- 15.13.4. Connectivity
- 15.13.5. Application
- 15.13.6. Application Method
- 15.13.7. End-use
- 16. Middle East Crop Monitoring Market Analysis
- 16.1. Key Segment Analysis
- 16.2. Regional Snapshot
- 16.3. Middle East Crop Monitoring Market Size (Value - US$ Bn), Analysis, and Forecasts, 2021-2035
- 16.3.1. Offering Type
- 16.3.2. Technology Type
- 16.3.3. Connectivity
- 16.3.4. Application
- 16.3.5. Application Method
- 16.3.6. End-use
- 16.3.7. Country
- 16.3.7.1. Turkey
- 16.3.7.2. UAE
- 16.3.7.3. Saudi Arabia
- 16.3.7.4. Israel
- 16.3.7.5. Rest of Middle East
- 16.4. Turkey Crop Monitoring Market
- 16.4.1. Country Segmental Analysis
- 16.4.2. Offering Type
- 16.4.3. Technology Type
- 16.4.4. Connectivity
- 16.4.5. Application
- 16.4.6. Application Method
- 16.4.7. End-use
- 16.5. UAE Crop Monitoring Market
- 16.5.1. Country Segmental Analysis
- 16.5.2. Offering Type
- 16.5.3. Technology Type
- 16.5.4. Connectivity
- 16.5.5. Application
- 16.5.6. Application Method
- 16.5.7. End-use
- 16.6. Saudi Arabia Crop Monitoring Market
- 16.6.1. Country Segmental Analysis
- 16.6.2. Offering Type
- 16.6.3. Technology Type
- 16.6.4. Connectivity
- 16.6.5. Application
- 16.6.6. Application Method
- 16.6.7. End-use
- 16.7. Israel Crop Monitoring Market
- 16.7.1. Country Segmental Analysis
- 16.7.2. Offering Type
- 16.7.3. Technology Type
- 16.7.4. Connectivity
- 16.7.5. Application
- 16.7.6. Application Method
- 16.7.7. End-use
- 16.8. Rest of Middle East Crop Monitoring Market
- 16.8.1. Country Segmental Analysis
- 16.8.2. Offering Type
- 16.8.3. Technology Type
- 16.8.4. Connectivity
- 16.8.5. Application
- 16.8.6. Application Method
- 16.8.7. End-use
- 17. Africa Crop Monitoring Market Analysis
- 17.1. Key Segment Analysis
- 17.2. Regional Snapshot
- 17.3. Africa Crop Monitoring Market Size (Value - US$ Bn), Analysis, and Forecasts, 2021-2035
- 17.3.1. Offering Type
- 17.3.2. Technology Type
- 17.3.3. Connectivity
- 17.3.4. Application
- 17.3.5. Application Method
- 17.3.6. End-use
- 17.3.7. Country
- 17.3.7.1. South Africa
- 17.3.7.2. Egypt
- 17.3.7.3. Nigeria
- 17.3.7.4. Algeria
- 17.3.7.5. Rest of Africa
- 17.4. South Africa Crop Monitoring Market
- 17.4.1. Country Segmental Analysis
- 17.4.2. Offering Type
- 17.4.3. Technology Type
- 17.4.4. Connectivity
- 17.4.5. Application
- 17.4.6. Application Method
- 17.4.7. End-use
- 17.5. Egypt Crop Monitoring Market
- 17.5.1. Country Segmental Analysis
- 17.5.2. Offering Type
- 17.5.3. Technology Type
- 17.5.4. Connectivity
- 17.5.5. Application
- 17.5.6. Application Method
- 17.5.7. End-use
- 17.6. Nigeria Crop Monitoring Market
- 17.6.1. Country Segmental Analysis
- 17.6.2. Offering Type
- 17.6.3. Technology Type
- 17.6.4. Connectivity
- 17.6.5. Application
- 17.6.6. Application Method
- 17.6.7. End-use
- 17.7. Algeria Crop Monitoring Market
- 17.7.1. Country Segmental Analysis
- 17.7.2. Offering Type
- 17.7.3. Technology Type
- 17.7.4. Connectivity
- 17.7.5. Application
- 17.7.6. Application Method
- 17.7.7. End-use
- 17.8. Rest of Africa Crop Monitoring Market
- 17.8.1. Country Segmental Analysis
- 17.8.2. Offering Type
- 17.8.3. Technology Type
- 17.8.4. Connectivity
- 17.8.5. Application
- 17.8.6. Application Method
- 17.8.7. End-use
- 18. South America Crop Monitoring Market Analysis
- 18.1. Key Segment Analysis
- 18.2. Regional Snapshot
- 18.3. South America Crop Monitoring Market Size (Value - US$ Bn), Analysis, and Forecasts, 2021-2035
- 18.3.1. Offering Type
- 18.3.2. Technology Type
- 18.3.3. Connectivity
- 18.3.4. Application
- 18.3.5. Application Method
- 18.3.6. End-use
- 18.3.7. Country
- 18.3.7.1. Brazil
- 18.3.7.2. Argentina
- 18.3.7.3. Rest of South America
- 18.4. Brazil Crop Monitoring Market
- 18.4.1. Country Segmental Analysis
- 18.4.2. Offering Type
- 18.4.3. Technology Type
- 18.4.4. Connectivity
- 18.4.5. Application
- 18.4.6. Application Method
- 18.4.7. End-use
- 18.5. Argentina Crop Monitoring Market
- 18.5.1. Country Segmental Analysis
- 18.5.2. Offering Type
- 18.5.3. Technology Type
- 18.5.4. Connectivity
- 18.5.5. Application
- 18.5.6. Application Method
- 18.5.7. End-use
- 18.6. Rest of South America Crop Monitoring Market
- 18.6.1. Country Segmental Analysis
- 18.6.2. Offering Type
- 18.6.3. Technology Type
- 18.6.4. Connectivity
- 18.6.5. Application
- 18.6.6. Application Method
- 18.6.7. End-use
- 19. Key Players/ Company Profile
- 19.1. AG Leader Technology.
- 19.1.1. Company Details/ Overview
- 19.1.2. Company Financials
- 19.1.3. Key Customers and Competitors
- 19.1.4. Business/ Industry Portfolio
- 19.1.5. Product Portfolio/ Specification Details
- 19.1.6. Pricing Data
- 19.1.7. Strategic Overview
- 19.1.8. Recent Developments
- 19.2. AGCO Corporation
- 19.3. AgJunction
- 19.4. aWhere Inc.
- 19.5. Cropio (Syngenta)
- 19.6. CropX Technologies
- 19.7. Deere & Company (John Deere)
- 19.8. DroneDeploy
- 19.9. Farmers Edge
- 19.10. Gamaya
- 19.11. Granular (Corteva Agriscience)
- 19.12. Hexagon Agriculture (Ag-Syt)
- 19.13. PrecisionHawk
- 19.14. Prospera Technologies
- 19.15. Raven Industries (CNH Industrial)
- 19.16. SlantRange Inc.
- 19.17. SST Development Group
- 19.18. Taranis
- 19.19. TeeJet Technologies
- 19.20. The Climate Corporation (Bayer)
- 19.21. Topcon Positioning Systems
- 19.22. Trimble Inc.
- 19.23. Other Key Players
- 19.1. AG Leader Technology.
Note* - This is just tentative list of players. While providing the report, we will cover more number of players based on their revenue and share for each geography
Research Design
Our research design integrates both demand-side and supply-side analysis through a balanced combination of primary and secondary research methodologies. By utilizing both bottom-up and top-down approaches alongside rigorous data triangulation methods, we deliver robust market intelligence that supports strategic decision-making.
MarketGenics' comprehensive research design framework ensures the delivery of accurate, reliable, and actionable market intelligence. Through the integration of multiple research approaches, rigorous validation processes, and expert analysis, we provide our clients with the insights needed to make informed strategic decisions and capitalize on market opportunities.

MarketGenics leverages a dedicated industry panel of experts and a comprehensive suite of paid databases to effectively collect, consolidate, and analyze market intelligence.
Our approach has consistently proven to be reliable and effective in generating accurate market insights, identifying key industry trends, and uncovering emerging business opportunities.
Through both primary and secondary research, we capture and analyze critical company-level data such as manufacturing footprints, including technical centers, R&D facilities, sales offices, and headquarters.
Our expert panel further enhances our ability to estimate market size for specific brands based on validated field-level intelligence.
Our data mining techniques incorporate both parametric and non-parametric methods, allowing for structured data collection, sorting, processing, and cleaning.
Demand projections are derived from large-scale data sets analyzed through proprietary algorithms, culminating in robust and reliable market sizing.
Research Approach
The bottom-up approach builds market estimates by starting with the smallest addressable market units and systematically aggregating them to create comprehensive market size projections.
This method begins with specific, granular data points and builds upward to create the complete market landscape.
Customer Analysis → Segmental Analysis → Geographical Analysis
The top-down approach starts with the broadest possible market data and systematically narrows it down through a series of filters and assumptions to arrive at specific market segments or opportunities.
This method begins with the big picture and works downward to increasingly specific market slices.
TAM → SAM → SOM


Research Methods
Desk / Secondary Research
While analysing the market, we extensively study secondary sources, directories, and databases to identify and collect information useful for this technical, market-oriented, and commercial report. Secondary sources that we utilize are not only the public sources, but it is a combination of Open Source, Associations, Paid Databases, MG Repository & Knowledgebase, and others.
- Company websites, annual reports, financial reports, broker reports, and investor presentations
- National government documents, statistical databases and reports
- News articles, press releases and web-casts specific to the companies operating in the market, Magazines, reports, and others
- We gather information from commercial data sources for deriving company specific data such as segmental revenue, share for geography, product revenue, and others
- Internal and external proprietary databases (industry-specific), relevant patent, and regulatory databases
- Governing Bodies, Government Organizations
- Relevant Authorities, Country-specific Associations for Industries
We also employ the model mapping approach to estimate the product level market data through the players' product portfolio
Primary Research
Primary research/ interviews is vital in analyzing the market. Most of the cases involves paid primary interviews. Primary sources include primary interviews through e-mail interactions, telephonic interviews, surveys as well as face-to-face interviews with the different stakeholders across the value chain including several industry experts.
| Type of Respondents | Number of Primaries |
|---|---|
| Tier 2/3 Suppliers | ~20 |
| Tier 1 Suppliers | ~25 |
| End-users | ~25 |
| Industry Expert/ Panel/ Consultant | ~30 |
| Total | ~100 |
MG Knowledgebase
• Repository of industry blog, newsletter and case studies
• Online platform covering detailed market reports, and company profiles
Forecasting Factors and Models
Forecasting Factors
- Historical Trends – Past market patterns, cycles, and major events that shaped how markets behave over time. Understanding past trends helps predict future behavior.
- Industry Factors – Specific characteristics of the industry like structure, regulations, and innovation cycles that affect market dynamics.
- Macroeconomic Factors – Economic conditions like GDP growth, inflation, and employment rates that affect how much money people have to spend.
- Demographic Factors – Population characteristics like age, income, and location that determine who can buy your product.
- Technology Factors – How quickly people adopt new technology and how much technology infrastructure exists.
- Regulatory Factors – Government rules, laws, and policies that can help or restrict market growth.
- Competitive Factors – Analyzing competition structure such as degree of competition and bargaining power of buyers and suppliers.
Forecasting Models / Techniques
Multiple Regression Analysis
- Identify and quantify factors that drive market changes
- Statistical modeling to establish relationships between market drivers and outcomes
Time Series Analysis – Seasonal Patterns
- Understand regular cyclical patterns in market demand
- Advanced statistical techniques to separate trend, seasonal, and irregular components
Time Series Analysis – Trend Analysis
- Identify underlying market growth patterns and momentum
- Statistical analysis of historical data to project future trends
Expert Opinion – Expert Interviews
- Gather deep industry insights and contextual understanding
- In-depth interviews with key industry stakeholders
Multi-Scenario Development
- Prepare for uncertainty by modeling different possible futures
- Creating optimistic, pessimistic, and most likely scenarios
Time Series Analysis – Moving Averages
- Sophisticated forecasting for complex time series data
- Auto-regressive integrated moving average models with seasonal components
Econometric Models
- Apply economic theory to market forecasting
- Sophisticated economic models that account for market interactions
Expert Opinion – Delphi Method
- Harness collective wisdom of industry experts
- Structured, multi-round expert consultation process
Monte Carlo Simulation
- Quantify uncertainty and probability distributions
- Thousands of simulations with varying input parameters
Research Analysis
Our research framework is built upon the fundamental principle of validating market intelligence from both demand and supply perspectives. This dual-sided approach ensures comprehensive market understanding and reduces the risk of single-source bias.
Demand-Side Analysis: We understand end-user/application behavior, preferences, and market needs along with the penetration of the product for specific application.
Supply-Side Analysis: We estimate overall market revenue, analyze the segmental share along with industry capacity, competitive landscape, and market structure.
Validation & Evaluation
Data triangulation is a validation technique that uses multiple methods, sources, or perspectives to examine the same research question, thereby increasing the credibility and reliability of research findings. In market research, triangulation serves as a quality assurance mechanism that helps identify and minimize bias, validate assumptions, and ensure accuracy in market estimates.
- Data Source Triangulation – Using multiple data sources to examine the same phenomenon
- Methodological Triangulation – Using multiple research methods to study the same research question
- Investigator Triangulation – Using multiple researchers or analysts to examine the same data
- Theoretical Triangulation – Using multiple theoretical perspectives to interpret the same data

Custom Market Research Services
We will customise the research for you, in case the report listed above does not meet your requirements.
Get 10% Free Customisation