Dairy Alternatives Market Size, Share & Trends Analysis Report by Product Type (Plant-Based Milk, Plant-Based Yogurt, Plant-Based Cheese, Plant-Based Butter & Spreads, Plant-Based Ice Cream, Plant-Based Cream, Plant-Based Creamers, Other Dairy Alternative Products), Source, Formulation, Packaging Type, Distribution Channel, End-Use Industry, and Geography (North America, Europe, Asia Pacific, Middle East, Africa, and South America) – Global Industry Data, Trends, and Forecasts, 2026–2035
|
|
|
Segmental Data Insights |
|
|
Demand Trends |
|
|
Competitive Landscape |
|
|
Strategic Development |
|
|
Future Outlook & Opportunities |
|
Dairy Alternatives Market Size, Share, and Growth
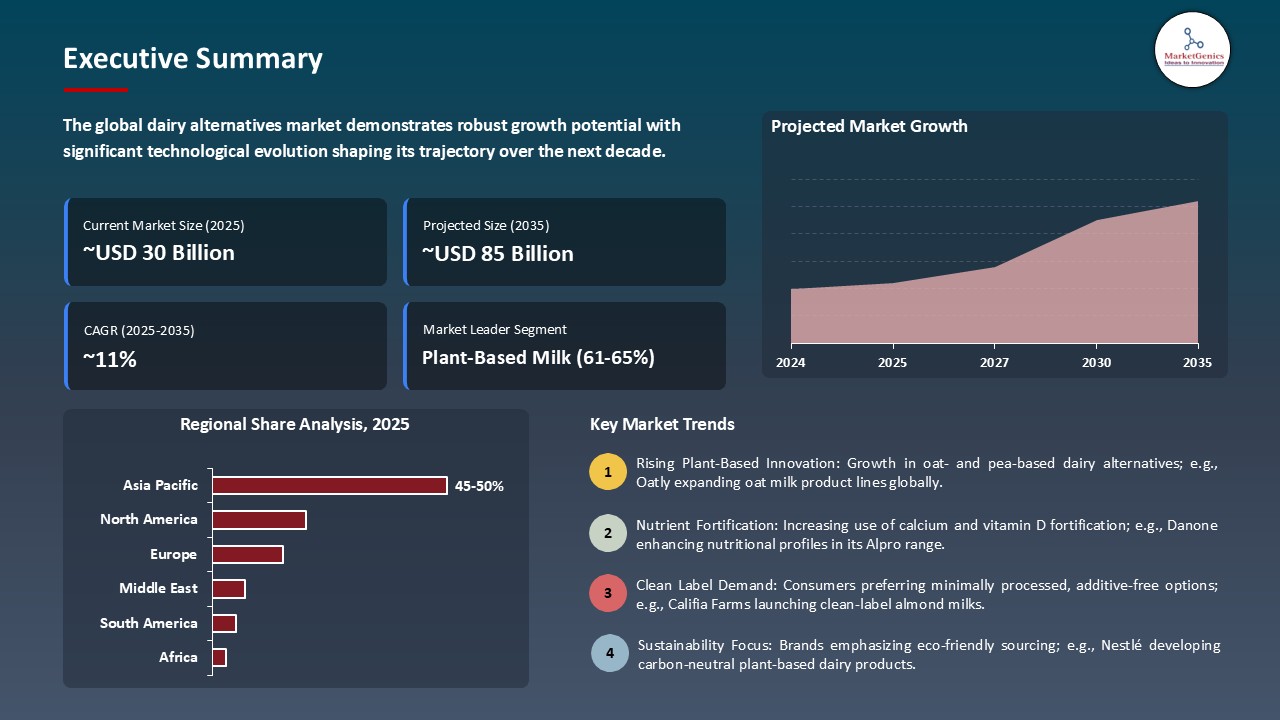
The global dairy alternatives market is experiencing robust growth, with its estimated value of USD 30.1 billion in the year 2025 and USD 84.7 billion by the period 2035, registering a CAGR of 10.9%, during the forecast period. Growth in the global dairy alternatives market is on the rise because of increased health consciousness, lactose intolerance and the adoption of plant-based diets. Consumer acceptance is increasing with innovations in taste, texture and nutritional fortification and clean-label products. The growth of retail, e-commerce, and foodservice outlets, along with sustainability trends, is also contributing to the global market transformation.
Barak Weinstein, Head of Strauss Neo, said that the CowFree product line combines technological innovation with culinary quality, offering high-protein, great-tasting dairy alternatives. He noted that these products cater to vegans, flexitarians, and those separating meat and dairy, addressing previously unmet consumer needs and expanding the plant-based dairy category.
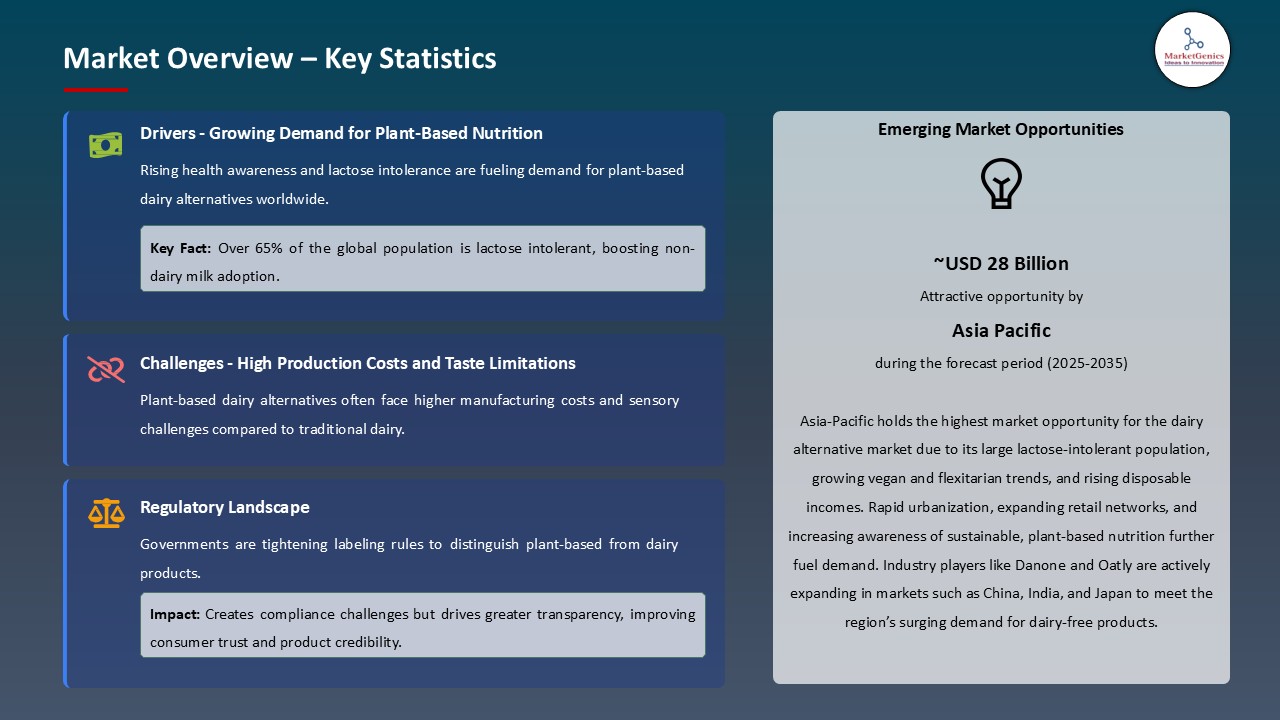
The increased prevalence of lactose intolerance and increasing environmental consciousness are some of the major drivers of the dairy alternative market. As the population with lactose malabsorption is very high, and the dairy products contain a high proportion, dairy alternatives fulfill the sustainability desires of the flexitarian consumers and their physiological requirements. For instance, in January 2024, biotech company Pureture declared a collaboration with Namyang Dairy Products to create plant-based dairy goods with the help of yeast-derived casein and allow functionality to be closer to standard cheese and milk.
Innovation in flavor, texture, nutritional enhancement and functionality in beverages, yogurts, cheese, frozen desserts and culinary usage are further contributing to market expansion. For instance, in 2025 startup Better Pulse announced an amino acid complete cowpea-based simulation of milk in Israel with a low resource footprint, aimed at sustainable nutrition. This introduction shows how innovative legumes and plant ingredients are creating functional and environmental benefits of dairy alternatives and attracting health-conscious customer segments.
Precision-fermented dairy proteins, plant-based protein components, probiotics, barista training, sustainable packaging, and personalized nutrition platforms are among the strategic adjacent opportunities that can create ecosystem synergies and allow companies to provide holistic solutions that can fulfill nutrition, sustainability, culinary performance, and lifestyle alignment.
Dairy Alternatives Market Dynamics and Trends
Driver: Health and Wellness Trends Driving Conscious Consumption
- The global dairy alternative market is experiencing high growth rates due to the trend of health and wellness, such as plant-based eating habits, clean-label preferences, food intolerance control and proactive nutrition towards illness prevention. The long-term demand is facilitated by the clinical evidence showing that plant-based consumption can positively affect cardiovascular health, weight, and inflammation. To serve dynamic consumer demands, companies are increasing their product lines and investing in research and development.
- The adoption is still accelerating with innovation and product development. For instance, in June 2025, the Indian direct-to-home brand Country Delight released its Oats Beverage, a lactose-free, nut-free, low-additive, drink with digestion-vulnerable customers and flexitarians in mind. The introduction emphasizes the orientation on the production of functional, clean-label, and convenient alternatives that are needed by health-conscious buyers to find a better nutrition and taste.
- The clean-label trend is more inclined towards less processed goods such as oat milk, compared to the dairy milk with the addition of additives. Companies that capitalize on this trend have premium pricing and gain space on the shelf in natural, organic and conventional retail stores.
- Enhanced taste, texture, and customer advocacy promote regular consumption and drive worldwide dairy alternative market growth.
Restraint: Nutritional Gaps and Fortification Challenges
- The dairy alternatives market has significant limitations associated with nutritional gaps with respect to conventional dairy, especially protein content, bioavailability of calcium, and B12 and B12 vitamins, which often necessitate significant nutritional fortification, making production more complex and costly. These issues are particularly relevant to children, youth, and older groups that can use plant-derived options as a main source of calcium and protein without proper consideration of the diet.
- Fortification also poses technical challenges such as the precipitation of calcium which interferes with texture, degradation of vitamins during storage, and low bioavailability of fortified nutrients sources in comparison to natural dairy sources. Taste, texture, and shelf stability are factors requiring high formulation capabilities and specialized processing technologies to ensure the delivery of increased nutrition. Solutions that are being implemented by companies to reduce these issues include microencapsulation, protein blends and stabilized systems of nutrient delivery to enhance product acceptability.
- Consequently, dairy substitutes are utilized mostly in beverages and low-complex applications. The nutritional and functional constraints of complex foods, such as cheese, cream-based sauces, and high-protein baked goods, prevent further adoption, and limit market growth in both high-end and culinary-based markets.
Opportunity: Foodservice Channel Expansion and Barista Segment
- The dairy alternatives market is experiencing high growth via foodservice channel outlets and especially in specialty coffee outlets where barista-quality alternatives have become popular amongst consumers. Such channels offer redundancy, professional preparation, which helps to develop taste, and social normalization, which forms a loop that helps to gain adoption faster. Fast-casual and quick-service restaurants are also broadening their menu with smoothies, milkshakes, frozen desserts and cheese options, providing consumers with plant-based options who may not find them in stores otherwise.
- The industry initiatives make this trend, which reduces barriers to adoption. For instance, in November 2024, Starbucks has announced that it is removing the additional fee on non-dairy milk, which indicates that plant-based milk is no longer a niche item but a mainstream option. The move facilitates accessibility and adoption by minimizing barriers to costs. The professional foodservice environment allows optimization of preparation, attractive presentation of a menu and exposure, which leads to consumer acceptance.
- The popularity of dairy alternatives has led to increased keenness in maintaining the positive experience at home, driving retail development.
Key Trend: Precision Fermentation and Animal-Free Dairy Proteins
- The dairy alternatives market is undergoing a technological discontinuum with the introduction of precision fermentation, creating the opportunity to make authentic dairy proteins without the use of animals. With these bioidentical proteins, it is now possible to produce products that would be indistinguishable with traditional dairy in areas where plant-based substitutes have had a traditionally low performance, including cheese, yogurt, and ice cream.
- Various commercial launches based on this development have shown taste fidelity as well as sustainability attributes. For instance, in February 2024, Perfect Day, Inc. and Unilever released Breyers Lactose-Free Chocolate, a whey-based beverage that is made with animal-free whey protein, which provides a genuinely dairy experience without causing much harm to the environment.
- The regulatory approvals are growing around the world, and regulatory authorities in Singapore, Israel, and the United States have given GRAS or similar status to several precision-fermentation dairy proteins, providing avenues of commercialization that stimulate scale-up of production.
- The combination of such technology and sustainability has the potential to disrupt the dairy and dairy substitute businesses, attracting customers seeking authentic taste and ethical and environmental responsibilities.
Dairy Alternatives Market Analysis and Segmental Data
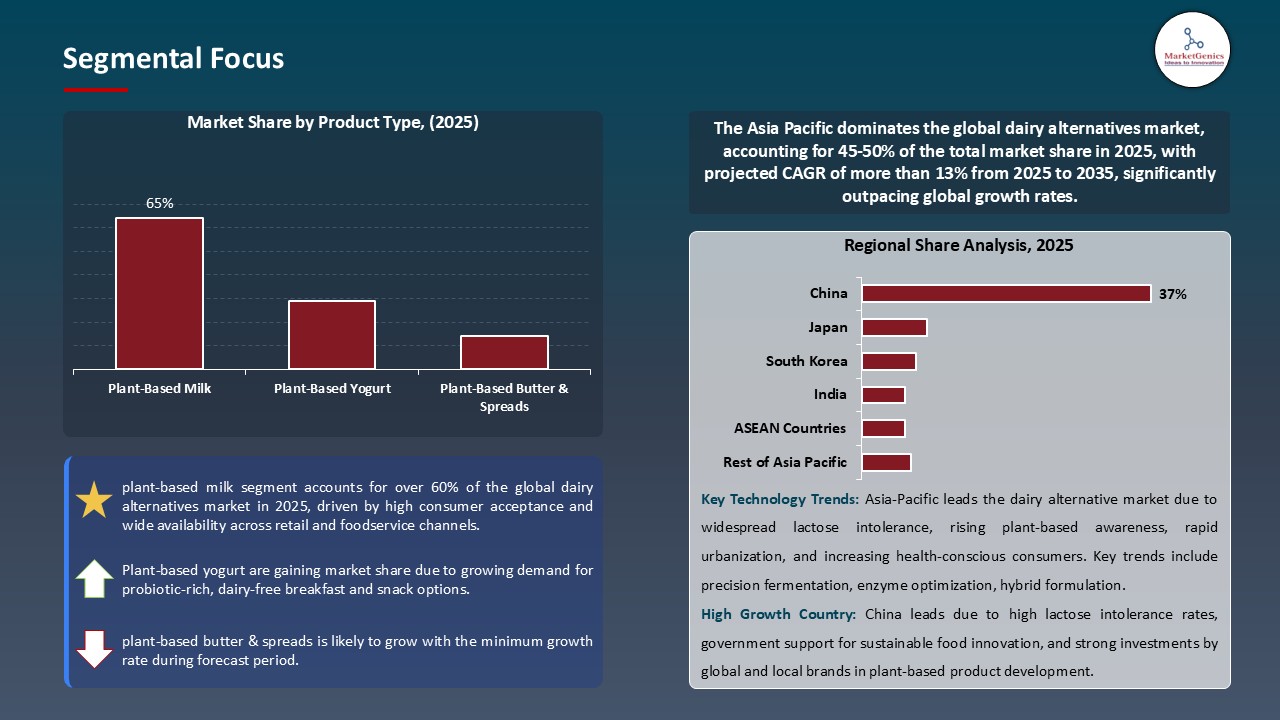
Plant-Based Milk Dominate Global Dairy Alternatives Market
- The dairy alternatives market is dominated by the plant-based milk category, which has increased consumer demand in naturally sourced, clean-label, and functional beverages. Premium plant-protein extraction and fortification methods provide high-quality nutrients, taste and bioavailability, which fulfill increasing customer demands of high-quality products.
- Manufacturers are also aggressively developing product lines to serve health-conscious consumers. For instance, In June 2025, HRX introduced a plant-based oat milk protein shake, which contained 25g of protein per 200mL, in a dairy-free, lactose-free form, and was marketed at fitness-oriented consumers. This demonstrates the aspect of the incorporation of high-protein, convenient plant-based products into mainstream consumption.
- Positive legislation, consumer interest in plant-based nutrition, and emphasis on innovation and diversification are driving the segment's growth. Manufacturers can target premium and specialty areas.
North America Leads Global Dairy Alternatives Market Demand
- North America maintains a leading role in the global dairy alternatives market due to the high level of lactose intolerance, environmentally friendly customers, the advanced plant-based ecosystem, large retail network, and efficient brand positioning that transformed the dairy alternatives into a standard product.
- Retail penetration has been high in the region, with plant-based milk and nutrition products becoming more of a common offering in both standard supermarkets and niche stores as evidenced by broad adoption rather than early adopters. Coffee culture, oat and other plant-based milks are the new cultures of consumption alongside further accelerated consumption through specialty coffee because oats and other milk-based products have better functional and sensory qualities.
- The level of innovation leadership is high, and significant companies present the next-generation products with improved nutrition, taste, texture, and sustainability qualifications. For instnace, in 2024, Danone purchased a plant-based nutrition company based in the U.S., Kate Farms, which expands its variety of dairy-free, organic nutrition products.
- North America is the largest market for dairy alternatives innovation, driven by venture capital funding, food-tech accelerators, and consumer interest in novel products.
Dairy-Alternatives-Market Ecosystem
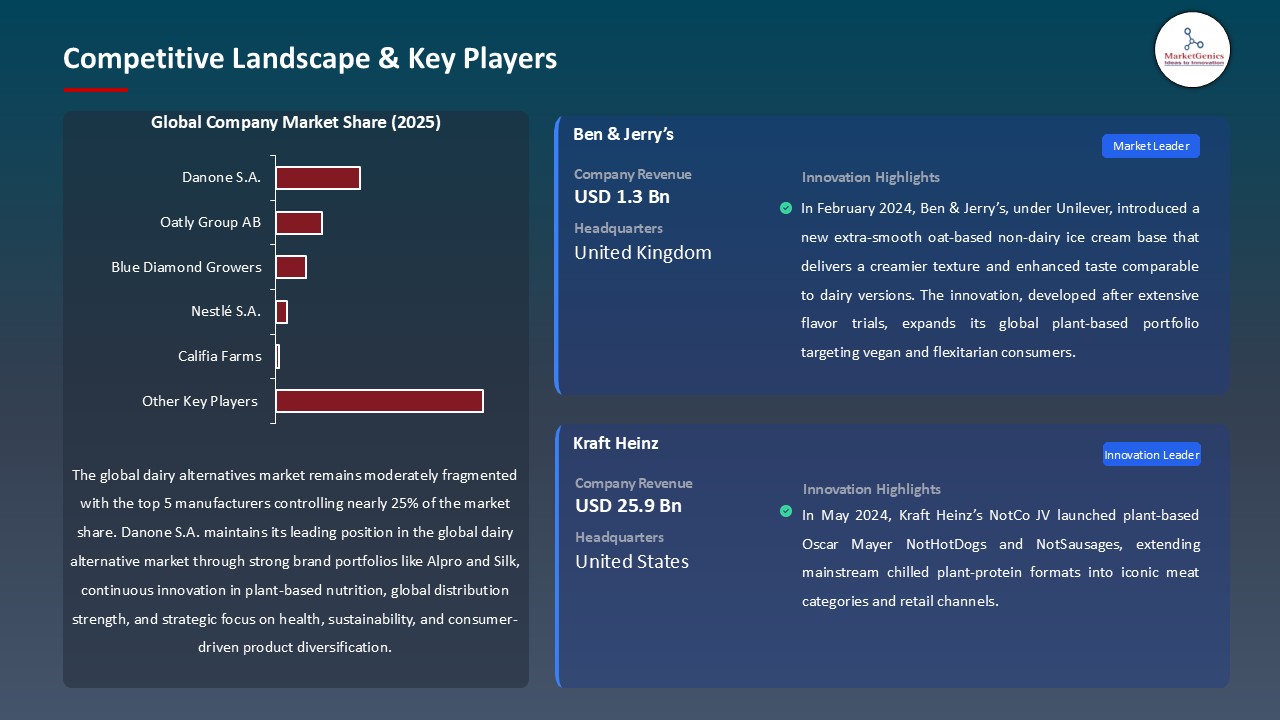
The global dairy alternatives market is moderately fragmented and there is a distinct tiered structure. Tier 1 includes established companies like Danone S.A., Oatly Group AB, Blue Diamond Growers, Nestle S.A. and Califia Farms that are riding on brand strength, retail distribution, scale of production and innovation capabilities usually via vertical integration, including ingredient sourcing to direct retail.
Tier 2 comprises specialized brands, ingredient suppliers, and traditional dairy firms joining the segment through acquisitions or internal growth, whereas Tier 3 comprises regional brands, artisan producers, and startups looking at new or niche products. Higher mainstream adoption is given greater mainstream adoption speed by conventional dairy incumbents, leveraging the current distribution, brand trust, and marketing resources, and increasing competitive innovation.
Value chain includes the upstream sourcing of raw materials, the base processing, secondary formulation, packaging, and distribution in the retail and foodservice outlets. The major dairy processors are in the process of modifying their traditional production lines to accept plant-based substitutes so as to be able to produce at scale, launch their products faster and reach a broader market. The joint ecosystem of startups, ingredient makers and big food companies creates a dynamic place with rapid innovation, lots of investment and more advanced products that are solving historical issues in taste, texture, nutrition, and functionality.
Recent Development and Strategic Overview:
- In September 2025, Zumi introduced a lactose-free, no-refined-sugar milkshake range in Bengaluru, Hyderabad and Chennai. The line has dessert-inspired flavors such as Rose Kulfi, Rasmalai and Chocolate each in 200mL Tetra Pak cartons with 6-7g of protein. These milkshakes are sweetened with monk-fruit extract and jaggery and are designed to fit lactose-intolerant, health-conscious, and digestive-sensitive consumers and offer a convenient and clean-label food and beverage.
- In November 2025, Remilk and Gad Dairies have introduced the New Milk range with precision-fermented whey protein, which features analogs of cow decisions with 75% less sugar and reduced environmental footprint by a factor of many times.
Report Scope
|
Detail |
|
|
Market Size in 2025 |
USD 30.1 Bn |
|
Market Forecast Value in 2035 |
USD 84.7 Bn |
|
Growth Rate (CAGR) |
10.9% |
|
Forecast Period |
2026 – 2035 |
|
Historical Data Available for |
2021 – 2024 |
|
Market Size Units |
US$ Billion for Value MMT for Volume |
|
Report Format |
Electronic (PDF) + Excel |
|
North America |
Europe |
Asia Pacific |
Middle East |
Africa |
South America |
|
|
|
|
|
|
|
Companies Covered |
|||||
|
|
|
|
|
|
Dairy-Alternatives-Market Segmentation and Highlights
|
Segment |
Sub-segment |
|
Dairy Alternatives Market, By Product Type |
|
|
Dairy Alternatives Market, By Source |
|
|
Dairy Alternatives Market, By Formulation |
|
|
Dairy Alternatives Market, By Packaging Type |
|
|
Dairy Alternatives Market, Distribution Channel |
|
|
Dairy Alternatives Market, By End-Use Industry |
|
Frequently Asked Questions
Table of Contents
- 1. Research Methodology and Assumptions
- 1.1. Definitions
- 1.2. Research Design and Approach
- 1.3. Data Collection Methods
- 1.4. Base Estimates and Calculations
- 1.5. Forecasting Models
- 1.5.1. Key Forecast Factors & Impact Analysis
- 1.6. Secondary Research
- 1.6.1. Open Sources
- 1.6.2. Paid Databases
- 1.6.3. Associations
- 1.7. Primary Research
- 1.7.1. Primary Sources
- 1.7.2. Primary Interviews with Stakeholders across Ecosystem
- 2. Executive Summary
- 2.1. Global Dairy Alternatives Market Outlook
- 2.1.1. Dairy Alternatives Market Size Volume (MMT) and Value (US$ Bn), and Forecasts, 2021-2035
- 2.1.2. Compounded Annual Growth Rate Analysis
- 2.1.3. Growth Opportunity Analysis
- 2.1.4. Segmental Share Analysis
- 2.1.5. Geographical Share Analysis
- 2.2. Market Analysis and Facts
- 2.3. Supply-Demand Analysis
- 2.4. Competitive Benchmarking
- 2.5. Go-to- Market Strategy
- 2.5.1. Customer/ End-use Industry Assessment
- 2.5.2. Growth Opportunity Data, 2026-2035
- 2.5.2.1. Regional Data
- 2.5.2.2. Country Data
- 2.5.2.3. Segmental Data
- 2.5.3. Identification of Potential Market Spaces
- 2.5.4. GAP Analysis
- 2.5.5. Potential Attractive Price Points
- 2.5.6. Prevailing Market Risks & Challenges
- 2.5.7. Preferred Sales & Marketing Strategies
- 2.5.8. Key Recommendations and Analysis
- 2.5.9. A Way Forward
- 2.1. Global Dairy Alternatives Market Outlook
- 3. Industry Data and Premium Insights
- 3.1. Global Food & Beverages Industry Overview, 2025
- 3.1.1. Food & Beverages Industry Ecosystem Analysis
- 3.1.2. Key Trends for Food & Beverages Industry
- 3.1.3. Regional Distribution for Food & Beverages Industry
- 3.2. Supplier Customer Data
- 3.3. Technology Roadmap and Developments
- 3.4. Trade Analysis
- 3.4.1. Import & Export Analysis, 2025
- 3.4.2. Top Importing Countries
- 3.4.3. Top Exporting Countries
- 3.5. Trump Tariff Impact Analysis
- 3.5.1. Manufacturer
- 3.5.1.1. Based on the component & Raw material
- 3.5.2. Supply Chain
- 3.5.3. End Consumer
- 3.5.1. Manufacturer
- 3.6. Raw Material Analysis
- 3.1. Global Food & Beverages Industry Overview, 2025
- 4. Market Overview
- 4.1. Market Dynamics
- 4.1.1. Drivers
- 4.1.1.1. Rising lactose intolerance and dairy allergies.
- 4.1.1.2. Growing vegan and plant-based dietary trends.
- 4.1.1.3. Increasing product innovation and fortification with nutrients.
- 4.1.2. Restraints
- 4.1.2.1. High cost compared to conventional dairy products.
- 4.1.2.2. Limited sensory appeal and texture challenges.
- 4.1.1. Drivers
- 4.2. Key Trend Analysis
- 4.3. Regulatory Framework
- 4.3.1. Key Regulations, Norms, and Subsidies, by Key Countries
- 4.3.2. Tariffs and Standards
- 4.3.3. Impact Analysis of Regulations on the Market
- 4.4. Value Chain Analysis
- 4.4.1. Raw Material Suppliers
- 4.4.2. Manufacturing
- 4.4.3. Distribution
- 4.4.4. End-Use
- 4.5. Cost Structure Analysis
- 4.5.1. Parameter’s Share for Cost Associated
- 4.5.2. COGP vs COGS
- 4.5.3. Profit Margin Analysis
- 4.6. Pricing Analysis
- 4.6.1. Regional Pricing Analysis
- 4.6.2. Segmental Pricing Trends
- 4.6.3. Factors Influencing Pricing
- 4.7. Porter’s Five Forces Analysis
- 4.8. PESTEL Analysis
- 4.9. Global Dairy Alternatives Market Demand
- 4.9.1. Historical Market Size – Volume (MMT) and Value (US$ Bn), 2020-2024
- 4.9.2. Current and Future Market Size – Volume (MMT) and Value (US$ Bn), 2026–2035
- 4.9.2.1. Y-o-Y Growth Trends
- 4.9.2.2. Absolute $ Opportunity Assessment
- 4.1. Market Dynamics
- 5. Competition Landscape
- 5.1. Competition structure
- 5.1.1. Fragmented v/s consolidated
- 5.2. Company Share Analysis, 2025
- 5.2.1. Global Company Market Share
- 5.2.2. By Region
- 5.2.2.1. North America
- 5.2.2.2. Europe
- 5.2.2.3. Asia Pacific
- 5.2.2.4. Middle East
- 5.2.2.5. Africa
- 5.2.2.6. South America
- 5.3. Product Comparison Matrix
- 5.3.1. Specifications
- 5.3.2. Market Positioning
- 5.3.3. Pricing
- 5.1. Competition structure
- 6. Global Dairy Alternatives Market Analysis, by Product Type
- 6.1. Key Segment Analysis
- 6.2. Dairy Alternatives Market Size Volume (MMT) and Value (US$ Bn), Analysis, and Forecasts, by Product Type, 2021-2035
- 6.2.1. Plant-Based Milk
- 6.2.2. Plant-Based Yogurt
- 6.2.3. Plant-Based Cheese
- 6.2.4. Plant-Based Butter & Spreads
- 6.2.5. Plant-Based Ice Cream
- 6.2.6. Plant-Based Cream
- 6.2.7. Plant-Based Creamers
- 6.2.8. Other Dairy Alternative Products
- 7. Global Dairy Alternatives Market Analysis, by Source
- 7.1. Key Segment Analysis
- 7.2. Dairy Alternatives Market Size Volume (MMT) and Value (US$ Bn), Analysis, and Forecasts, by Source, 2021-2035
- 7.2.1. Soy-Based
- 7.2.2. Almond-Based
- 7.2.3. Coconut-Based
- 7.2.4. Oat-Based
- 7.2.5. Rice-Based
- 7.2.6. Cashew-Based
- 7.2.7. Others
- 8. Global Dairy Alternatives Market Analysis, by Formulation
- 8.1. Key Segment Analysis
- 8.2. Dairy Alternatives Market Size Volume (MMT) and Value (US$ Bn), Analysis, and Forecasts, by Formulation, 2021-2035
- 8.2.1. Organic
- 8.2.2. Conventional
- 8.2.3. Fortified
- 8.2.3.1. Vitamin D Fortified
- 8.2.3.2. Calcium Fortified
- 8.2.3.3. Others
- 8.2.4. Non-Fortified
- 8.2.5. Probiotic-Enhanced
- 8.2.6. Flavored
- 8.2.7. Unflavored/Plain
- 9. Global Dairy Alternatives Market Analysis, by Packaging Type
- 9.1. Key Segment Analysis
- 9.2. Dairy Alternatives Market Size Volume (MMT) and Value (US$ Bn), Analysis, and Forecasts, by Packaging Type, 2021-2035
- 9.2.1. Bottles
- 9.2.2. Cartons
- 9.2.3. Pouches
- 9.2.4. Cans
- 9.2.5. Tubs & Containers
- 9.2.6. Bag-in-Box
- 9.2.7. Bulk Packaging
- 10. Global Dairy Alternatives Market Analysis, by Distribution Channel
- 10.1. Key Segment Analysis
- 10.2. Dairy Alternatives Market Size Volume (MMT) and Value (US$ Bn), Analysis, and Forecasts, by Distribution Channel, 2021-2035
- 10.2.1. Online Retail
- 10.2.2. Offline Retail
- 10.2.2.1. Supermarkets & Hypermarkets
- 10.2.2.2. Convenience Stores
- 10.2.2.3. Specialty Stores
- 10.2.2.4. Others
- 11. Global Dairy Alternatives Market Analysis, by End-Use Industry
- 11.1. Key Segment Analysis
- 11.2. Dairy Alternatives Market Size Volume (MMT) and Value (US$ Bn), Analysis, and Forecasts, by End-Use Industry, 2021-2035
- 11.2.1. Food & Beverage Industry
- 11.2.1.1. Bakery
- 11.2.1.2. Confectionery
- 11.2.1.3. Beverages
- 11.2.1.4. Breakfast Cereals
- 11.2.1.5. Frozen Desserts
- 11.2.1.6. Nutrition Bars
- 11.2.1.7. Others
- 11.2.2. Food Service Industry
- 11.2.2.1. Quick Service Restaurants (QSR)
- 11.2.2.2. Full-Service Restaurants
- 11.2.2.3. Cafés & Coffee Shops
- 11.2.2.4. Hotels & Catering
- 11.2.2.5. Institutional Catering
- 11.2.2.6. Others
- 11.2.3. Retail/Household Consumption
- 11.2.3.1. Direct Consumption
- 11.2.3.2. Home Cooking & Baking
- 11.2.3.3. Breakfast Applications
- 11.2.3.4. Snacking
- 11.2.3.5. Others
- 11.2.4. Nutraceutical & Dietary Supplements
- 11.2.5. Infant Nutrition
- 11.2.6. Sports Nutrition
- 11.2.7. Other Industries
- 11.2.1. Food & Beverage Industry
- 12. Global Dairy Alternatives Market Analysis and Forecasts, by Region
- 12.1. Key Findings
- 12.2. Dairy Alternatives Market Size Volume (MMT) and Value (US$ Bn), Analysis, and Forecasts, by Region, 2021-2035
- 12.2.1. North America
- 12.2.2. Europe
- 12.2.3. Asia Pacific
- 12.2.4. Middle East
- 12.2.5. Africa
- 12.2.6. South America
- 13. North America Dairy Alternatives Market Analysis
- 13.1. Key Segment Analysis
- 13.2. Regional Snapshot
- 13.3. North America Dairy Alternatives Market Size Volume (MMT) and Value (US$ Bn), Analysis, and Forecasts, 2021-2035
- 13.3.1. Product Type
- 13.3.2. Source
- 13.3.3. Formulation
- 13.3.4. Packaging Type
- 13.3.5. Distribution Channel
- 13.3.6. End-Use Industry
- 13.3.7. Country
- 13.3.7.1. USA
- 13.3.7.2. Canada
- 13.3.7.3. Mexico
- 13.4. USA Dairy Alternatives Market
- 13.4.1. Country Segmental Analysis
- 13.4.2. Product Type
- 13.4.3. Source
- 13.4.4. Formulation
- 13.4.5. Packaging Type
- 13.4.6. Distribution Channel
- 13.4.7. End-Use Industry
- 13.5. Canada Dairy Alternatives Market
- 13.5.1. Country Segmental Analysis
- 13.5.2. Product Type
- 13.5.3. Source
- 13.5.4. Formulation
- 13.5.5. Packaging Type
- 13.5.6. Distribution Channel
- 13.5.7. End-Use Industry
- 13.6. Mexico Dairy Alternatives Market
- 13.6.1. Country Segmental Analysis
- 13.6.2. Product Type
- 13.6.3. Source
- 13.6.4. Formulation
- 13.6.5. Packaging Type
- 13.6.6. Distribution Channel
- 13.6.7. End-Use Industry
- 14. Europe Dairy Alternatives Market Analysis
- 14.1. Key Segment Analysis
- 14.2. Regional Snapshot
- 14.3. Europe Dairy Alternatives Market Size Volume (MMT) and Value (US$ Bn), Analysis, and Forecasts, 2021-2035
- 14.3.1. Product Type
- 14.3.2. Source
- 14.3.3. Formulation
- 14.3.4. Packaging Type
- 14.3.5. Distribution Channel
- 14.3.6. End-Use Industry
- 14.3.7. Country
- 14.3.7.1. Germany
- 14.3.7.2. United Kingdom
- 14.3.7.3. France
- 14.3.7.4. Italy
- 14.3.7.5. Spain
- 14.3.7.6. Netherlands
- 14.3.7.7. Nordic Countries
- 14.3.7.8. Poland
- 14.3.7.9. Russia & CIS
- 14.3.7.10. Rest of Europe
- 14.4. Germany Dairy Alternatives Market
- 14.4.1. Country Segmental Analysis
- 14.4.2. Product Type
- 14.4.3. Source
- 14.4.4. Formulation
- 14.4.5. Packaging Type
- 14.4.6. Distribution Channel
- 14.4.7. End-Use Industry
- 14.5. United Kingdom Dairy Alternatives Market
- 14.5.1. Country Segmental Analysis
- 14.5.2. Product Type
- 14.5.3. Source
- 14.5.4. Formulation
- 14.5.5. Packaging Type
- 14.5.6. Distribution Channel
- 14.5.7. End-Use Industry
- 14.6. France Dairy Alternatives Market
- 14.6.1. Country Segmental Analysis
- 14.6.2. Product Type
- 14.6.3. Source
- 14.6.4. Formulation
- 14.6.5. Packaging Type
- 14.6.6. Distribution Channel
- 14.6.7. End-Use Industry
- 14.7. Italy Dairy Alternatives Market
- 14.7.1. Country Segmental Analysis
- 14.7.2. Product Type
- 14.7.3. Source
- 14.7.4. Formulation
- 14.7.5. Packaging Type
- 14.7.6. Distribution Channel
- 14.7.7. End-Use Industry
- 14.8. Spain Dairy Alternatives Market
- 14.8.1. Country Segmental Analysis
- 14.8.2. Product Type
- 14.8.3. Source
- 14.8.4. Formulation
- 14.8.5. Packaging Type
- 14.8.6. Distribution Channel
- 14.8.7. End-Use Industry
- 14.9. Netherlands Dairy Alternatives Market
- 14.9.1. Country Segmental Analysis
- 14.9.2. Product Type
- 14.9.3. Source
- 14.9.4. Formulation
- 14.9.5. Packaging Type
- 14.9.6. Distribution Channel
- 14.9.7. End-Use Industry
- 14.10. Nordic Countries Dairy Alternatives Market
- 14.10.1. Country Segmental Analysis
- 14.10.2. Product Type
- 14.10.3. Source
- 14.10.4. Formulation
- 14.10.5. Packaging Type
- 14.10.6. Distribution Channel
- 14.10.7. End-Use Industry
- 14.11. Poland Dairy Alternatives Market
- 14.11.1. Country Segmental Analysis
- 14.11.2. Product Type
- 14.11.3. Source
- 14.11.4. Formulation
- 14.11.5. Packaging Type
- 14.11.6. Distribution Channel
- 14.11.7. End-Use Industry
- 14.12. Russia & CIS Dairy Alternatives Market
- 14.12.1. Country Segmental Analysis
- 14.12.2. Product Type
- 14.12.3. Source
- 14.12.4. Formulation
- 14.12.5. Packaging Type
- 14.12.6. Distribution Channel
- 14.12.7. End-Use Industry
- 14.13. Rest of Europe Dairy Alternatives Market
- 14.13.1. Country Segmental Analysis
- 14.13.2. Product Type
- 14.13.3. Source
- 14.13.4. Formulation
- 14.13.5. Packaging Type
- 14.13.6. Distribution Channel
- 14.13.7. End-Use Industry
- 15. Asia Pacific Dairy Alternatives Market Analysis
- 15.1. Key Segment Analysis
- 15.2. Regional Snapshot
- 15.3. Asia Pacific Dairy Alternatives Market Size Volume (MMT) and Value (US$ Bn), Analysis, and Forecasts, 2021-2035
- 15.3.1. Product Type
- 15.3.2. Source
- 15.3.3. Formulation
- 15.3.4. Packaging Type
- 15.3.5. Distribution Channel
- 15.3.6. End-Use Industry
- 15.3.7. Country
- 15.3.7.1. China
- 15.3.7.2. India
- 15.3.7.3. Japan
- 15.3.7.4. South Korea
- 15.3.7.5. Australia and New Zealand
- 15.3.7.6. Indonesia
- 15.3.7.7. Malaysia
- 15.3.7.8. Thailand
- 15.3.7.9. Vietnam
- 15.3.7.10. Rest of Asia Pacific
- 15.4. China Dairy Alternatives Market
- 15.4.1. Country Segmental Analysis
- 15.4.2. Product Type
- 15.4.3. Source
- 15.4.4. Formulation
- 15.4.5. Packaging Type
- 15.4.6. Distribution Channel
- 15.4.7. End-Use Industry
- 15.5. India Dairy Alternatives Market
- 15.5.1. Country Segmental Analysis
- 15.5.2. Product Type
- 15.5.3. Source
- 15.5.4. Formulation
- 15.5.5. Packaging Type
- 15.5.6. Distribution Channel
- 15.5.7. End-Use Industry
- 15.6. Japan Dairy Alternatives Market
- 15.6.1. Country Segmental Analysis
- 15.6.2. Product Type
- 15.6.3. Source
- 15.6.4. Formulation
- 15.6.5. Packaging Type
- 15.6.6. Distribution Channel
- 15.6.7. End-Use Industry
- 15.7. South Korea Dairy Alternatives Market
- 15.7.1. Country Segmental Analysis
- 15.7.2. Product Type
- 15.7.3. Source
- 15.7.4. Formulation
- 15.7.5. Packaging Type
- 15.7.6. Distribution Channel
- 15.7.7. End-Use Industry
- 15.8. Australia and New Zealand Dairy Alternatives Market
- 15.8.1. Country Segmental Analysis
- 15.8.2. Product Type
- 15.8.3. Source
- 15.8.4. Formulation
- 15.8.5. Packaging Type
- 15.8.6. Distribution Channel
- 15.8.7. End-Use Industry
- 15.9. Indonesia Dairy Alternatives Market
- 15.9.1. Country Segmental Analysis
- 15.9.2. Product Type
- 15.9.3. Source
- 15.9.4. Formulation
- 15.9.5. Packaging Type
- 15.9.6. Distribution Channel
- 15.9.7. End-Use Industry
- 15.10. Malaysia Dairy Alternatives Market
- 15.10.1. Country Segmental Analysis
- 15.10.2. Product Type
- 15.10.3. Source
- 15.10.4. Formulation
- 15.10.5. Packaging Type
- 15.10.6. Distribution Channel
- 15.10.7. End-Use Industry
- 15.11. Thailand Dairy Alternatives Market
- 15.11.1. Country Segmental Analysis
- 15.11.2. Product Type
- 15.11.3. Source
- 15.11.4. Formulation
- 15.11.5. Packaging Type
- 15.11.6. Distribution Channel
- 15.11.7. End-Use Industry
- 15.12. Vietnam Dairy Alternatives Market
- 15.12.1. Country Segmental Analysis
- 15.12.2. Product Type
- 15.12.3. Source
- 15.12.4. Formulation
- 15.12.5. Packaging Type
- 15.12.6. Distribution Channel
- 15.12.7. End-Use Industry
- 15.13. Rest of Asia Pacific Dairy Alternatives Market
- 15.13.1. Country Segmental Analysis
- 15.13.2. Product Type
- 15.13.3. Source
- 15.13.4. Formulation
- 15.13.5. Packaging Type
- 15.13.6. Distribution Channel
- 15.13.7. End-Use Industry
- 16. Middle East Dairy Alternatives Market Analysis
- 16.1. Key Segment Analysis
- 16.2. Regional Snapshot
- 16.3. Middle East Dairy Alternatives Market Size Volume (MMT) and Value (US$ Bn), Analysis, and Forecasts, 2021-2035
- 16.3.1. Product Type
- 16.3.2. Source
- 16.3.3. Formulation
- 16.3.4. Packaging Type
- 16.3.5. Distribution Channel
- 16.3.6. End-Use Industry
- 16.3.7. Country
- 16.3.7.1. Turkey
- 16.3.7.2. UAE
- 16.3.7.3. Saudi Arabia
- 16.3.7.4. Israel
- 16.3.7.5. Rest of Middle East
- 16.4. Turkey Dairy Alternatives Market
- 16.4.1. Country Segmental Analysis
- 16.4.2. Product Type
- 16.4.3. Source
- 16.4.4. Formulation
- 16.4.5. Packaging Type
- 16.4.6. Distribution Channel
- 16.4.7. End-Use Industry
- 16.5. UAE Dairy Alternatives Market
- 16.5.1. Country Segmental Analysis
- 16.5.2. Product Type
- 16.5.3. Source
- 16.5.4. Formulation
- 16.5.5. Packaging Type
- 16.5.6. Distribution Channel
- 16.5.7. End-Use Industry
- 16.6. Saudi Arabia Dairy Alternatives Market
- 16.6.1. Country Segmental Analysis
- 16.6.2. Product Type
- 16.6.3. Source
- 16.6.4. Formulation
- 16.6.5. Packaging Type
- 16.6.6. Distribution Channel
- 16.6.7. End-Use Industry
- 16.7. Israel Dairy Alternatives Market
- 16.7.1. Country Segmental Analysis
- 16.7.2. Product Type
- 16.7.3. Source
- 16.7.4. Formulation
- 16.7.5. Packaging Type
- 16.7.6. Distribution Channel
- 16.7.7. End-Use Industry
- 16.8. Rest of Middle East Dairy Alternatives Market
- 16.8.1. Country Segmental Analysis
- 16.8.2. Product Type
- 16.8.3. Source
- 16.8.4. Formulation
- 16.8.5. Packaging Type
- 16.8.6. Distribution Channel
- 16.8.7. End-Use Industry
- 17. Africa Dairy Alternatives Market Analysis
- 17.1. Key Segment Analysis
- 17.2. Regional Snapshot
- 17.3. Africa Dairy Alternatives Market Size Volume (MMT) and Value (US$ Bn), Analysis, and Forecasts, 2021-2035
- 17.3.1. Product Type
- 17.3.2. Source
- 17.3.3. Formulation
- 17.3.4. Packaging Type
- 17.3.5. Distribution Channel
- 17.3.6. End-Use Industry
- 17.3.7. Country
- 17.3.7.1. South Africa
- 17.3.7.2. Egypt
- 17.3.7.3. Nigeria
- 17.3.7.4. Algeria
- 17.3.7.5. Rest of Africa
- 17.4. South Africa Dairy Alternatives Market
- 17.4.1. Country Segmental Analysis
- 17.4.2. Product Type
- 17.4.3. Source
- 17.4.4. Formulation
- 17.4.5. Packaging Type
- 17.4.6. Distribution Channel
- 17.4.7. End-Use Industry
- 17.5. Egypt Dairy Alternatives Market
- 17.5.1. Country Segmental Analysis
- 17.5.2. Product Type
- 17.5.3. Source
- 17.5.4. Formulation
- 17.5.5. Packaging Type
- 17.5.6. Distribution Channel
- 17.5.7. End-Use Industry
- 17.6. Nigeria Dairy Alternatives Market
- 17.6.1. Country Segmental Analysis
- 17.6.2. Product Type
- 17.6.3. Source
- 17.6.4. Formulation
- 17.6.5. Packaging Type
- 17.6.6. Distribution Channel
- 17.6.7. End-Use Industry
- 17.7. Algeria Dairy Alternatives Market
- 17.7.1. Country Segmental Analysis
- 17.7.2. Product Type
- 17.7.3. Source
- 17.7.4. Formulation
- 17.7.5. Packaging Type
- 17.7.6. Distribution Channel
- 17.7.7. End-Use Industry
- 17.8. Rest of Africa Dairy Alternatives Market
- 17.8.1. Country Segmental Analysis
- 17.8.2. Product Type
- 17.8.3. Source
- 17.8.4. Formulation
- 17.8.5. Packaging Type
- 17.8.6. Distribution Channel
- 17.8.7. End-Use Industry
- 18. South America Dairy Alternatives Market Analysis
- 18.1. Key Segment Analysis
- 18.2. Regional Snapshot
- 18.3. South America Dairy Alternatives Market Size Volume (MMT) and Value (US$ Bn), Analysis, and Forecasts, 2021-2035
- 18.3.1. Product Type
- 18.3.2. Source
- 18.3.3. Formulation
- 18.3.4. Packaging Type
- 18.3.5. Distribution Channel
- 18.3.6. End-Use Industry
- 18.3.7. Country
- 18.3.7.1. Brazil
- 18.3.7.2. Argentina
- 18.3.7.3. Rest of South America
- 18.4. Brazil Dairy Alternatives Market
- 18.4.1. Country Segmental Analysis
- 18.4.2. Product Type
- 18.4.3. Source
- 18.4.4. Formulation
- 18.4.5. Packaging Type
- 18.4.6. Distribution Channel
- 18.4.7. End-Use Industry
- 18.5. Argentina Dairy Alternatives Market
- 18.5.1. Country Segmental Analysis
- 18.5.2. Product Type
- 18.5.3. Source
- 18.5.4. Formulation
- 18.5.5. Packaging Type
- 18.5.6. Distribution Channel
- 18.5.7. End-Use Industry
- 18.6. Rest of South America Dairy Alternatives Market
- 18.6.1. Country Segmental Analysis
- 18.6.2. Product Type
- 18.6.3. Source
- 18.6.4. Formulation
- 18.6.5. Packaging Type
- 18.6.6. Distribution Channel
- 18.6.7. End-Use Industry
- 19. Key Players/ Company Profile
- 19.1. Blue Diamond Growers.
- 19.1.1. Company Details/ Overview
- 19.1.2. Company Financials
- 19.1.3. Key Customers and Competitors
- 19.1.4. Business/ Industry Portfolio
- 19.1.5. Product Portfolio/ Specification Details
- 19.1.6. Pricing Data
- 19.1.7. Strategic Overview
- 19.1.8. Recent Developments
- 19.2. Califia Farms
- 19.3. Chobani LLC
- 19.4. Daiya Foods Inc.
- 19.5. Danone S.A.
- 19.6. Earth's Own Food Company
- 19.7. Elmhurst Milked Direct LLC
- 19.8. Kite Hill
- 19.9. Miyoko's Creamery
- 19.10. Nestlé S.A.
- 19.11. Nutiva Inc.
- 19.12. Oatly Group AB
- 19.13. Pacific Foods of Oregon LLC
- 19.14. PepsiCo Inc.
- 19.15. Ripple Foods
- 19.16. Sanitarium Health Food Company
- 19.17. The Coca-Cola Company
- 19.18. The Hain Celestial Group Inc.
- 19.19. Vitasoy International Holdings Limited
- 19.20. Other Key Players
- 19.1. Blue Diamond Growers.
Note* - This is just tentative list of players. While providing the report, we will cover more number of players based on their revenue and share for each geography
Research Design
Our research design integrates both demand-side and supply-side analysis through a balanced combination of primary and secondary research methodologies. By utilizing both bottom-up and top-down approaches alongside rigorous data triangulation methods, we deliver robust market intelligence that supports strategic decision-making.
MarketGenics' comprehensive research design framework ensures the delivery of accurate, reliable, and actionable market intelligence. Through the integration of multiple research approaches, rigorous validation processes, and expert analysis, we provide our clients with the insights needed to make informed strategic decisions and capitalize on market opportunities.

MarketGenics leverages a dedicated industry panel of experts and a comprehensive suite of paid databases to effectively collect, consolidate, and analyze market intelligence.
Our approach has consistently proven to be reliable and effective in generating accurate market insights, identifying key industry trends, and uncovering emerging business opportunities.
Through both primary and secondary research, we capture and analyze critical company-level data such as manufacturing footprints, including technical centers, R&D facilities, sales offices, and headquarters.
Our expert panel further enhances our ability to estimate market size for specific brands based on validated field-level intelligence.
Our data mining techniques incorporate both parametric and non-parametric methods, allowing for structured data collection, sorting, processing, and cleaning.
Demand projections are derived from large-scale data sets analyzed through proprietary algorithms, culminating in robust and reliable market sizing.
Research Approach
The bottom-up approach builds market estimates by starting with the smallest addressable market units and systematically aggregating them to create comprehensive market size projections.
This method begins with specific, granular data points and builds upward to create the complete market landscape.
Customer Analysis → Segmental Analysis → Geographical Analysis
The top-down approach starts with the broadest possible market data and systematically narrows it down through a series of filters and assumptions to arrive at specific market segments or opportunities.
This method begins with the big picture and works downward to increasingly specific market slices.
TAM → SAM → SOM


Research Methods
Desk / Secondary Research
While analysing the market, we extensively study secondary sources, directories, and databases to identify and collect information useful for this technical, market-oriented, and commercial report. Secondary sources that we utilize are not only the public sources, but it is a combination of Open Source, Associations, Paid Databases, MG Repository & Knowledgebase, and others.
- Company websites, annual reports, financial reports, broker reports, and investor presentations
- National government documents, statistical databases and reports
- News articles, press releases and web-casts specific to the companies operating in the market, Magazines, reports, and others
- We gather information from commercial data sources for deriving company specific data such as segmental revenue, share for geography, product revenue, and others
- Internal and external proprietary databases (industry-specific), relevant patent, and regulatory databases
- Governing Bodies, Government Organizations
- Relevant Authorities, Country-specific Associations for Industries
We also employ the model mapping approach to estimate the product level market data through the players' product portfolio
Primary Research
Primary research/ interviews is vital in analyzing the market. Most of the cases involves paid primary interviews. Primary sources include primary interviews through e-mail interactions, telephonic interviews, surveys as well as face-to-face interviews with the different stakeholders across the value chain including several industry experts.
| Type of Respondents | Number of Primaries |
|---|---|
| Tier 2/3 Suppliers | ~20 |
| Tier 1 Suppliers | ~25 |
| End-users | ~25 |
| Industry Expert/ Panel/ Consultant | ~30 |
| Total | ~100 |
MG Knowledgebase
• Repository of industry blog, newsletter and case studies
• Online platform covering detailed market reports, and company profiles
Forecasting Factors and Models
Forecasting Factors
- Historical Trends – Past market patterns, cycles, and major events that shaped how markets behave over time. Understanding past trends helps predict future behavior.
- Industry Factors – Specific characteristics of the industry like structure, regulations, and innovation cycles that affect market dynamics.
- Macroeconomic Factors – Economic conditions like GDP growth, inflation, and employment rates that affect how much money people have to spend.
- Demographic Factors – Population characteristics like age, income, and location that determine who can buy your product.
- Technology Factors – How quickly people adopt new technology and how much technology infrastructure exists.
- Regulatory Factors – Government rules, laws, and policies that can help or restrict market growth.
- Competitive Factors – Analyzing competition structure such as degree of competition and bargaining power of buyers and suppliers.
Forecasting Models / Techniques
Multiple Regression Analysis
- Identify and quantify factors that drive market changes
- Statistical modeling to establish relationships between market drivers and outcomes
Time Series Analysis – Seasonal Patterns
- Understand regular cyclical patterns in market demand
- Advanced statistical techniques to separate trend, seasonal, and irregular components
Time Series Analysis – Trend Analysis
- Identify underlying market growth patterns and momentum
- Statistical analysis of historical data to project future trends
Expert Opinion – Expert Interviews
- Gather deep industry insights and contextual understanding
- In-depth interviews with key industry stakeholders
Multi-Scenario Development
- Prepare for uncertainty by modeling different possible futures
- Creating optimistic, pessimistic, and most likely scenarios
Time Series Analysis – Moving Averages
- Sophisticated forecasting for complex time series data
- Auto-regressive integrated moving average models with seasonal components
Econometric Models
- Apply economic theory to market forecasting
- Sophisticated economic models that account for market interactions
Expert Opinion – Delphi Method
- Harness collective wisdom of industry experts
- Structured, multi-round expert consultation process
Monte Carlo Simulation
- Quantify uncertainty and probability distributions
- Thousands of simulations with varying input parameters
Research Analysis
Our research framework is built upon the fundamental principle of validating market intelligence from both demand and supply perspectives. This dual-sided approach ensures comprehensive market understanding and reduces the risk of single-source bias.
Demand-Side Analysis: We understand end-user/application behavior, preferences, and market needs along with the penetration of the product for specific application.
Supply-Side Analysis: We estimate overall market revenue, analyze the segmental share along with industry capacity, competitive landscape, and market structure.
Validation & Evaluation
Data triangulation is a validation technique that uses multiple methods, sources, or perspectives to examine the same research question, thereby increasing the credibility and reliability of research findings. In market research, triangulation serves as a quality assurance mechanism that helps identify and minimize bias, validate assumptions, and ensure accuracy in market estimates.
- Data Source Triangulation – Using multiple data sources to examine the same phenomenon
- Methodological Triangulation – Using multiple research methods to study the same research question
- Investigator Triangulation – Using multiple researchers or analysts to examine the same data
- Theoretical Triangulation – Using multiple theoretical perspectives to interpret the same data

Custom Market Research Services
We will customise the research for you, in case the report listed above does not meet your requirements.
Get 10% Free Customisation