Fertilizers Market Size, Share & Trends Analysis Report by Product Type (Nitrogenous Fertilizers, Phosphatic Fertilizers, Potassic Fertilizers Complex Fertilizers, Micronutrient Fertilizers, Secondary Nutrient Fertilizers), Form, Application Method, Release Type, Source/Origin, Technology, Packaging Type, Distribution Channel, End-users, and Geography (North America, Europe, Asia Pacific, Middle East, Africa, and South America) – Global Industry Data, Trends, and Forecasts, 2026–2035
|
|
|
Segmental Data Insights |
|
|
Demand Trends |
|
|
Competitive Landscape |
|
|
Strategic Development |
|
|
Future Outlook & Opportunities |
|
Fertilizers Market Size, Share, and Growth
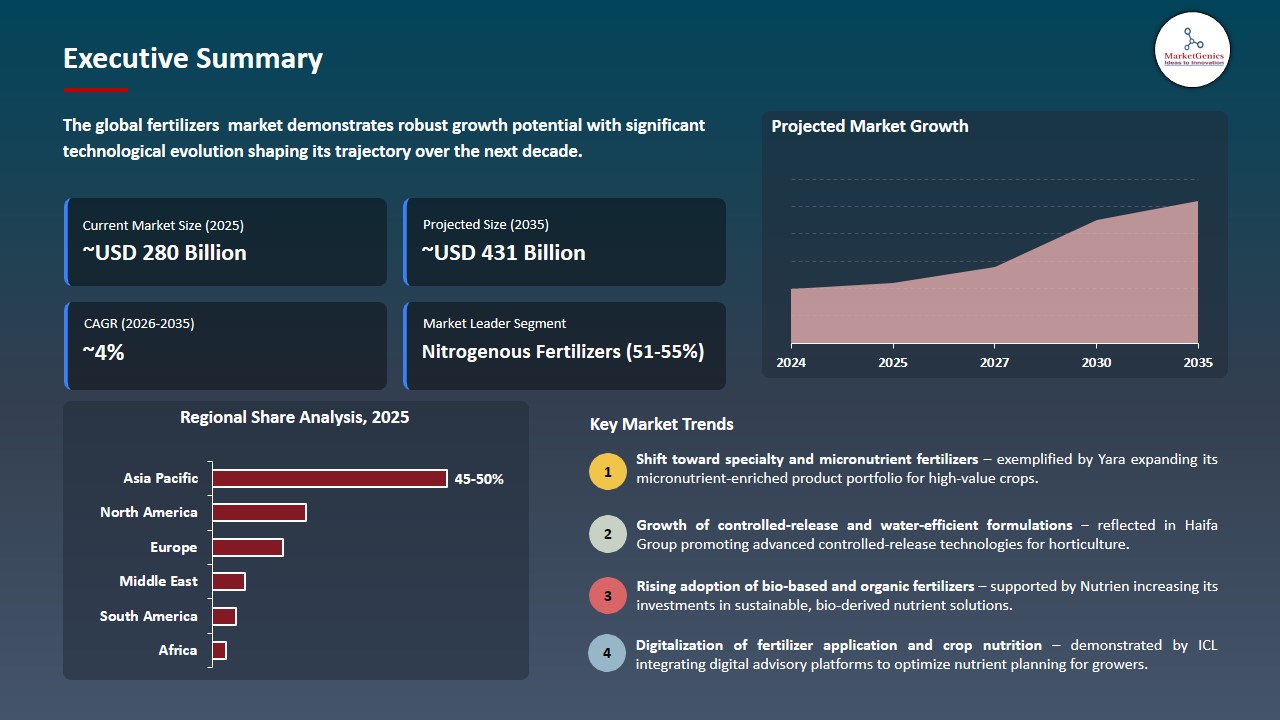
The global fertilizers market is experiencing robust growth, with its estimated value of USD 279.9 billion in the year 2025 and USD 430.5 billion by the period 2035, registering a CAGR of 4.4%, during the forecast period. The fertilizers market demand is driven by rising global food needs, declining arable land, and the push for higher crop productivity, supported by nutrient-efficient products, climate-resilient farming practices, and favorable government subsidy programs that encourage balanced nutrient application.
Elad Aharonson, president of ICL Growing Solutions said, "Our soluble fertilizer products are recognized as market leaders in China – a key region for us – and this agreement with AMP Holdings will further strengthen ICL’s position in the premium part of China's specialty fertilizer market, and We are gratified that AMP continues to select ICL as a partner, and we value our relationship with them and appreciate the endorsement of our expertise in specialty soluble fertilizers from one of the leading agricultural distribution companies in China."
The global fertilizer demand is being propelled by increasing protein-based consumption trends and maintenance of population growth, increasing the intensity of nutrient use per hectare. For instance, in August 2024, ICL Group signed a US 170 million, five-year agreement with AMP Holdings, a distributor of fertilizers based in China to distribute its water-soluble specialty fertilizers, and commercially develop its eqo.x biodegradable coated urea on its water-soluble urea in light of increasingly stricter EU regulations. They lead to faster transition toward low-impact as well as efficient fertilizers that are capable of satisfying increasing nutrient demand on a much stricter sustainability standard.
Moreover, the global fertilizers market growth is supported by the trend towards high-value horticulture and controlled-environment agriculture, which creates demand of tailor-made nutrient profiles, and consolidation of large suppliers remodels global supply chains and improves scalability of the markets. An example, in April 2025, ICL launched its X-TRA liquid micronutrient series under its Growing Solutions division expanding its range of stage-specific, exact nutrition solutions, used in greenhouse and indoor growing processes. These innovations enhance the transition of the market to more valuable and more accurate nutrition solutions that enhance efficiency and enable increased growth.
Adjacent opportunities to the global fertilizers market include precision agriculture technologies, biostimulants, controlled-release and nano-delivery inputs, soil health and microbial enhancement solutions, digital farm management platforms, and controlled-environment agriculture nutrition systems. These segments benefit central rising demand efficiency, sustainability and crop-specific nutrient optimization. These adjacent markets are propelling the transition to integrated, data-driven, high-efficiency nutrient management.
Fertilizers Market Dynamics and Trends
Driver: Decarbonization Investment and Green Ammonia Development Reshape Fertilizer Production Strategies
-
The global fertilizers market is growing with increasing support of decarbonization imperatives with the industry actors directing their capital towards low-carbon synthesis routes. Firms are focusing on integration of renewable energy and electrolytic production technology and creation of green-ammonia value chains to reduce Scope emissions, improve feedstock security, and keep pace with changing sustainability and regulatory requirements.
- This transition is reflected the pipeline of projects of the major producers and in offtakes agreements that ensure long-term renewable supply and hedge the supply of ammonia to be used in downstream production of nitrogen. For instance, in 2024, Yara is investing more in the U.S. in ammonia and getting renewable-ammonia offtakes to enhance low-carbon supply and introduce clean hydrogen and ammonia into its production strategy.
- It is anticipated that these initiatives will accelerate the use of low-carbon fertilizers, boost supply chain resilience, reduce exposure to the volatility of fossil-energy prices, and assist in meeting growing customer and regulatory sustainability demands, putting businesses in a long-term competitive position in a decarbonizing market.
Restraint: Input Price Volatility and Geopolitics Constraining Supply, Margins, and Investment
-
The global fertilizers market growth is limited by the volatility of the energy and feedstock prices, supplemented by the export restriction and regional trade interruptions which deter the producer margins and increase the working-capital levels, in turn, reducing the pace of capital investment and decreasing the investment in the production, mixing, and distribution infrastructure.
- Additionally, geopolitical disruptions and pricing instability in the commodity market are further impeding global fertilizers market stability and are stimulating portfolio restructuring and asset rationalization by major producers, leading to diminished near-term capacity flexibility and increasing the pressure on downstream agricultural stakeholders to pass costs through.
- For instance, in March 2024, Nutrien’s ongoing strategic realignment and potential asset divestments in Latin America which can be seen as a way of leading producers diversifying the regional portfolios to meet market volatility and operational pressures. These changes of the portfolio increase the pressure of the market consolidation and strengthen the price dynamic of cost.
- Thus, specialty, service-based portfolios allow superior margin capture and benefit competitive differentiation to suppliers.
Opportunity: Precision Nutrition and Controlled-Environment Farming are Driving Demand for Premium, Tailored Fertilizer Solutions.
-
The global fertilizers market growth is driven by the growth of greenhouse, vertical farming, and horticulture, which contributes to the rise of the demand in individual, water-soluble, and stage-specific nutrient solutions that are highly priced and increase the level of technical services provided to the growers.
- Manufacturers that offer superior formulations and tailored delivery value chain achieve greater margins and sustainable customer strategizing. For instance, in March 2025, Haifa’s increased Multicote and introduced new water-soluble formulations, which was a concentration in advancing its presence in precision and controlled-environment agriculture.
- These dynamics that accelerate the transition towards the specialty, high-value nutrition solutions, enhancing competitive differentiation, and boosting long-term margin potential of the advanced fertilizer manufacturers.
Key Trend: Industry Consolidation and Digital Agriculture Accelerate Integrated Nutrient Management Adoption
-
The global fertilizers market consolidation among distributors, blenders and international manufacturers of the market is increasing scale efficiencies in logistics, procurement and research and development, and digital agritech solutions are incorporating fertilizer advice, crop simulation, and traceability in the value chain. This integration will allow integrated solutions that such as formulations, advisory services, and digital agronomy that will enhance customer retention and enhance the efficiency of nutrient use at scale.
- Additionally, the major companies are promoting innovation and collaboration to provide the combination of controlled-release fertilizers, micronutrients, and data-driven application, promoting supplier economics and environmental performance. For instance, in September 2025, Mosaic’s focus on product product development and integrated soil-health initiatives is indicative of industry shift toward integrating chemical solutions with agronomic insights.
- These trends are leading to a more efficient and sustainable fertilizer application, securing grower loyalty, enhancing farm productivity and allowing suppliers to recruit a higher margin yet meeting rising environmental and regulatory demands.
Fertilizers-Market Analysis and Segmental Data
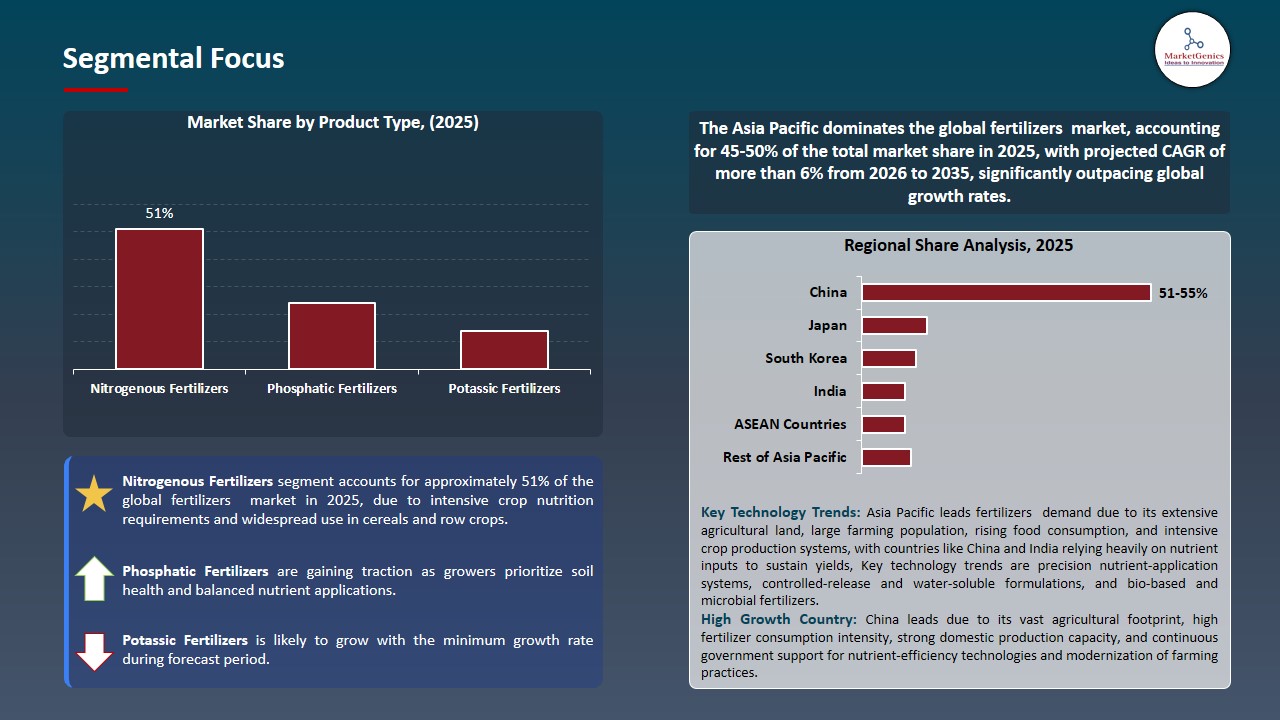
Nitrogenous Fertilizers Dominate Global Fertilizers Market
-
The nitrogenous fertilizers segment dominates the global fertilizers market nitrogen is a key nutrient to crop development it is essential to photosynthesis and protein synthesis, which enhances improved performance of the plant. In particular, urea due to its high levels of nitrogen content and affordability continues to be an option of farmers across the globe. For instance, in 2025, the World Bank fertilizer price index rose more than 6%, and it indicates strong demand of urea, with limited supply and export major restrictions.
- Furthermore, increasing world food security concern and population are increasing the pressure on staple crops, especially cereals and grains, which will need large amount of nitrogen application. The pressure of demand is also enhanced by the restriction of production and export measures that add to the suppression of the fertilizer market of nitrogenous type.
- The strategic value of nitrogenous fertilizers is being strengthened by the great demand for them due to the need for staple crops and the shortage of supply, which raises prices and promotes production and distribution to ensure global food security.
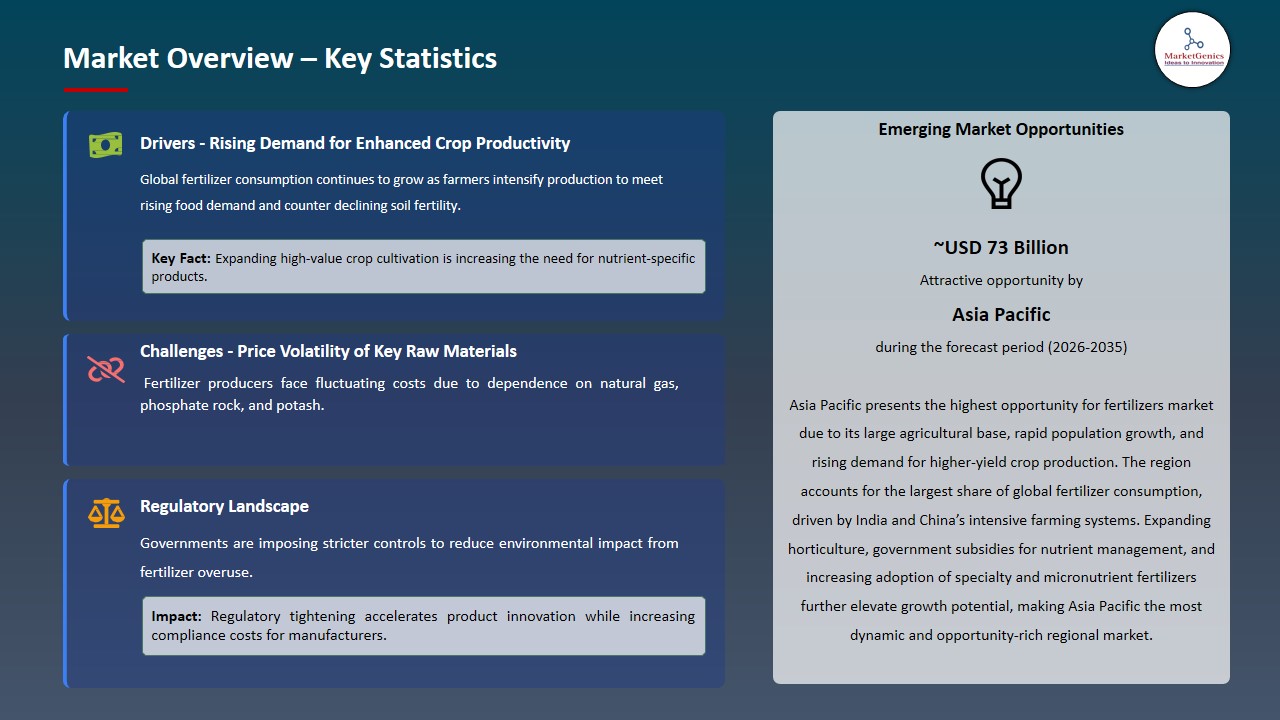
Asia Pacific Leads Global Fertilizers Market Demand
-
Asia Pacific leads the global fertilizers market is supported by the high population density in the region, especially in India and China, has been propelling the demand of the nitrogenous and multi-nutrient fertilizers to facilitate production of staple crops. As an example, in 2024, government policy incentives promoting the use of controlled-release fertilizers (CRFs) in the maize and rice plots of China led to an increase in the adoption of CRFs by about 15 percent.
- Additionally, the policies and subsidy programs implemented by the government in the area are encouraging the use of more fertilizers, allowing their repetitive application and facilitating crop intensification to satisfy the increasing food security demands. As an example, in India, the Union Cabinet approved a 24,475-crore nutrient-based subsidy (NBS) on phosphatic and potassic fertilizers in the Rabi 2024-25 season, which will make these important nutrient-enriched products affordable again to the farmers.
- Asia Pacific is becoming the world's largest supplier of fertilizers due to the region's high agricultural productivity, advantageous government policies, and innovative fertilizer application, all of which are contributing to the region's sustained demand growth, crop productivity, and food security.
Fertilizers-Market Ecosystem
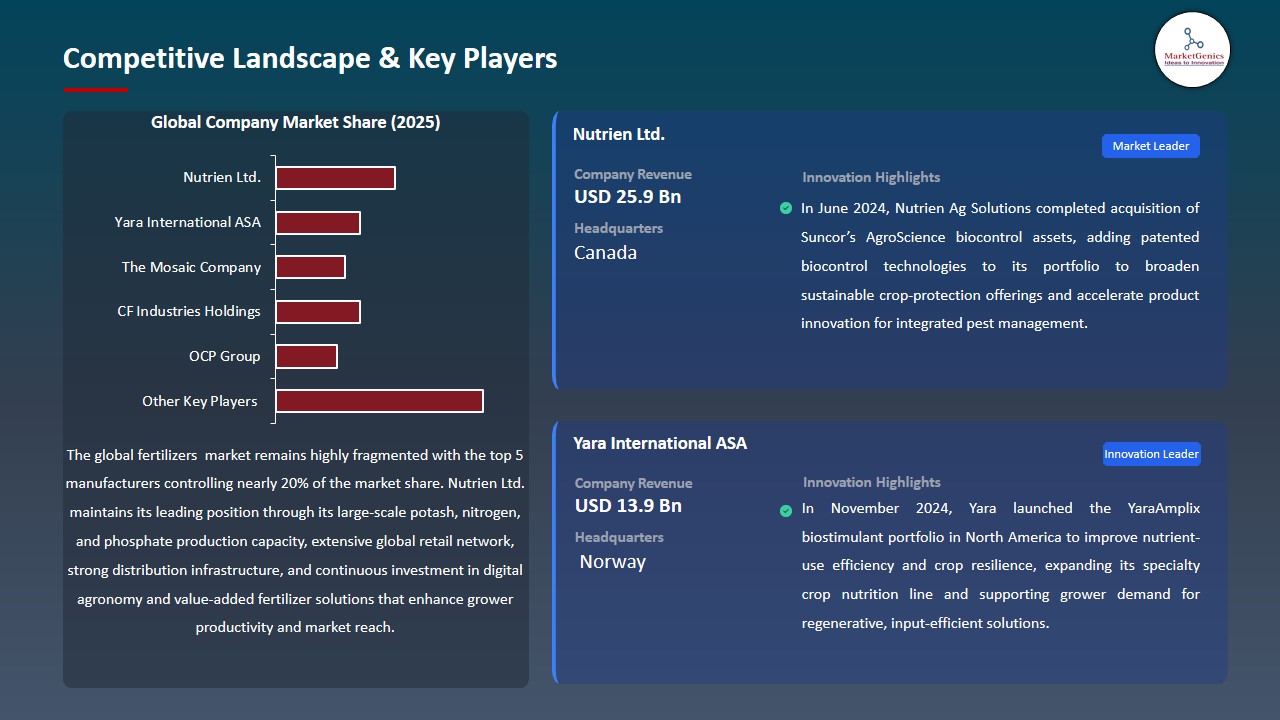
The global fertilizers market is highly fragmented, with high concentration among key players such as Nutrien Ltd., Yara International ASA, The Mosaic Company, CF Industries Holdings, and OCP Group, who dominate through huge distribution networks, strategic mergers and acquisitions, diversified product profiles and investment in innovation and sustainable fertilizer solutions.
These companies are able to gain market share and influence pricing pressures in the key regional and international markets owing to the scale advantages in production, R&D, and procurement. For instance, in June 2024, Yara International commissioned largest 24MW green-hydrogen electrolyser in Europe in Norway.
The plant generates renewable hydrogen to make ammonia, which will allow the company to market its initial low-carbon fertilizers based on green ammonia, and its CO 2 emissions will be significantly decreased. The introduction of a large-scale electrolyser that utilizes green hydrogen paves the way to the creation of low-carbon fertilizers, diversifies the industry, and establishes the standard of minimizing the emissions of greenhouse gases in the world market of fertilizers.
Recent Development and Strategic Overview:
-
In September 2025, OCP partnered with Peregrine Hydrogen to scale an innovative electrolyzer that co-produces clean hydrogen and sulfuric acid, supporting OCP’s decarbonization plans while securing an on-site supply of both critical inputs.
- In June 2025, EuroChem announced the introduction of a new custom-made vegetable crop fertilizer (Fertiva) with the aim of using high-value crops (e.g., tomato, potato, brassicas) as the focus to satisfy niche nutritional requirements and enhance its high-end product range.
Report Scope
|
Detail |
|
|
Market Size in 2025 |
USD 279.9 Bn |
|
Market Forecast Value in 2035 |
USD 430.5 Bn |
|
Growth Rate (CAGR) |
4.4% |
|
Forecast Period |
2026 – 2035 |
|
Historical Data Available for |
2021 – 2024 |
|
Market Size Units |
US$ Billion for Value Kilo Tons for Volume |
|
Report Format |
Electronic (PDF) + Excel |
|
North America |
Europe |
Asia Pacific |
Middle East |
Africa |
South America |
|
|
|
|
|
|
|
Companies Covered |
|||||
|
|
|
|
|
|
Fertilizers-Market Segmentation and Highlights
|
Segment |
Sub-segment |
|
Fertilizers Market, By Product Type |
|
|
Fertilizers Market, By Form |
|
|
Fertilizers Market, By Application Method |
|
|
Fertilizers Market, By Release Type |
|
|
Fertilizers Market, By Source/Origin
|
|
|
Fertilizers Market, By Technology
|
|
|
Fertilizers Market, By Packaging Type
|
|
|
Fertilizers Market, By Distribution Channel
|
|
|
Fertilizers Market, By End-users
|
|
Frequently Asked Questions
Table of Contents
- 1. Research Methodology and Assumptions
- 1.1. Definitions
- 1.2. Research Design and Approach
- 1.3. Data Collection Methods
- 1.4. Base Estimates and Calculations
- 1.5. Forecasting Models
- 1.5.1. Key Forecast Factors & Impact Analysis
- 1.6. Secondary Research
- 1.6.1. Open Sources
- 1.6.2. Paid Databases
- 1.6.3. Associations
- 1.7. Primary Research
- 1.7.1. Primary Sources
- 1.7.2. Primary Interviews with Stakeholders across Ecosystem
- 2. Executive Summary
- 2.1. Global Fertilizers Market Outlook
- 2.1.1. Fertilizers Market Size (Volume - Kilo Tons and Value - US$ Bn), and Forecasts, 2021-2035
- 2.1.2. Compounded Annual Growth Rate Analysis
- 2.1.3. Growth Opportunity Analysis
- 2.1.4. Segmental Share Analysis
- 2.1.5. Geographical Share Analysis
- 2.2. Market Analysis and Facts
- 2.3. Supply-Demand Analysis
- 2.4. Competitive Benchmarking
- 2.5. Go-to- Market Strategy
- 2.5.1. Customer/ End-use Industry Assessment
- 2.5.2. Growth Opportunity Data, 2026-2035
- 2.5.2.1. Regional Data
- 2.5.2.2. Country Data
- 2.5.2.3. Segmental Data
- 2.5.3. Identification of Potential Market Spaces
- 2.5.4. GAP Analysis
- 2.5.5. Potential Attractive Price Points
- 2.5.6. Prevailing Market Risks & Challenges
- 2.5.7. Preferred Sales & Marketing Strategies
- 2.5.8. Key Recommendations and Analysis
- 2.5.9. A Way Forward
- 2.1. Global Fertilizers Market Outlook
- 3. Industry Data and Premium Insights
- 3.1. Global Agriculture Industry Overview, 2025
- 3.1.1. Agriculture Industry Ecosystem Analysis
- 3.1.2. Key Trends for Agriculture Industry
- 3.1.3. Regional Distribution for Agriculture Industry
- 3.2. Supplier Customer Data
- 3.3. Technology Roadmap and Developments
- 3.4. Trade Analysis
- 3.4.1. Import & Export Analysis, 2025
- 3.4.2. Top Importing Countries
- 3.4.3. Top Exporting Countries
- 3.5. Trump Tariff Impact Analysis
- 3.5.1. Manufacturer
- 3.5.1.1. Based on the component & Raw material
- 3.5.2. Supply Chain
- 3.5.3. End Consumer
- 3.5.1. Manufacturer
- 3.6. Raw Material Analysis
- 3.1. Global Agriculture Industry Overview, 2025
- 4. Market Overview
- 4.1. Market Dynamics
- 4.1.1. Drivers
- 4.1.1.1. Increasing global demand for higher crop yields driven by population growth
- 4.1.1.2. Expansion of precision agriculture and nutrient-efficient application technologies
- 4.1.1.3. Rising adoption of specialty and micronutrient fertilizers to address soil deficiencies
- 4.1.2. Restraints
- 4.1.2.1. Volatility in raw material prices, particularly natural gas and phosphates
- 4.1.2.2. Growing regulatory pressures related to environmental emissions and nutrient runoff
- 4.1.1. Drivers
- 4.2. Key Trend Analysis
- 4.3. Regulatory Framework
- 4.3.1. Key Regulations, Norms, and Subsidies, by Key Countries
- 4.3.2. Tariffs and Standards
- 4.3.3. Impact Analysis of Regulations on the Market
- 4.4. Value Chain Analysis
- 4.4.1. Raw Material Suppliers
- 4.4.2. Fertilizers Manufacturers
- 4.4.3. Dealers/ Distributors
- 4.4.4. End-Users/ Customers
- 4.5. Cost Structure Analysis
- 4.5.1. Parameter’s Share for Cost Associated
- 4.5.2. COGP vs COGS
- 4.5.3. Profit Margin Analysis
- 4.6. Pricing Analysis
- 4.6.1. Regional Pricing Analysis
- 4.6.2. Segmental Pricing Trends
- 4.6.3. Factors Influencing Pricing
- 4.7. Porter’s Five Forces Analysis
- 4.8. PESTEL Analysis
- 4.9. Global Fertilizers Market Demand
- 4.9.1. Historical Market Size – Volume (Kilo Tons) and Value (US$ Bn), 2020-2024
- 4.9.2. Current and Future Market Size – Volume (Kilo Tons) and Value (US$ Bn), 2026–2035
- 4.9.2.1. Y-o-Y Growth Trends
- 4.9.2.2. Absolute $ Opportunity Assessment
- 4.1. Market Dynamics
- 5. Competition Landscape
- 5.1. Competition structure
- 5.1.1. Fragmented v/s consolidated
- 5.2. Company Share Analysis, 2025
- 5.2.1. Global Company Market Share
- 5.2.2. By Region
- 5.2.2.1. North America
- 5.2.2.2. Europe
- 5.2.2.3. Asia Pacific
- 5.2.2.4. Middle East
- 5.2.2.5. Africa
- 5.2.2.6. South America
- 5.3. Product Comparison Matrix
- 5.3.1. Specifications
- 5.3.2. Market Positioning
- 5.3.3. Pricing
- 5.1. Competition structure
- 6. Global Fertilizers Market Analysis, by Product Type
- 6.1. Key Segment Analysis
- 6.2. Fertilizers Market Size (Volume - Kilo Tons and Value - US$ Bn), Analysis, and Forecasts, by Product Type, 2021-2035
- 6.2.1. Nitrogenous Fertilizers
- 6.2.1.1. Urea
- 6.2.1.2. Ammonium Nitrate
- 6.2.1.3. Ammonium Sulfate
- 6.2.1.4. Calcium Ammonium Nitrate (CAN)
- 6.2.1.5. Anhydrous Ammonia
- 6.2.1.6. Others
- 6.2.2. Phosphatic Fertilizers
- 6.2.2.1. Single Super Phosphate (SSP)
- 6.2.2.2. Triple Super Phosphate (TSP)
- 6.2.2.3. Diammonium Phosphate (DAP)
- 6.2.2.4. Monoammonium Phosphate (MAP)
- 6.2.2.5. Others
- 6.2.3. Potassic Fertilizers
- 6.2.3.1. Muriate of Potash (MOP)
- 6.2.3.2. Sulfate of Potash (SOP)
- 6.2.3.3. Others
- 6.2.4. Complex Fertilizers
- 6.2.4.1. NPK Fertilizers
- 6.2.4.2. NP Fertilizers
- 6.2.4.3. PK Fertilizers
- 6.2.4.4. Others
- 6.2.5. Micronutrient Fertilizers
- 6.2.5.1. Zinc
- 6.2.5.2. Boron
- 6.2.5.3. Iron
- 6.2.5.4. Manganese
- 6.2.5.5. Copper
- 6.2.5.6. Molybdenum
- 6.2.5.7. Others
- 6.2.6. Secondary Nutrient Fertilizers
- 6.2.6.1. Calcium Fertilizers
- 6.2.6.2. Magnesium Fertilizers
- 6.2.6.3. Sulfur Fertilizers
- 6.2.6.4. Others
- 6.2.1. Nitrogenous Fertilizers
- 7. Global Fertilizers Market Analysis, by Form
- 7.1. Key Segment Analysis
- 7.2. Fertilizers Market Size (Volume - Kilo Tons and Value - US$ Bn), Analysis, and Forecasts, by Form, 2021-2035
- 7.2.1. Solid
- 7.2.1.1. Granular
- 7.2.1.2. Powder
- 7.2.1.3. Prilled
- 7.2.1.4. Others
- 7.2.2. Liquid
- 7.2.2.1. Solution
- 7.2.2.2. Suspension
- 7.2.2.3. Others
- 7.2.3. Gaseous
- 7.2.1. Solid
- 8. Global Fertilizers Market Analysis, by Application Method
- 8.1. Key Segment Analysis
- 8.2. Fertilizers Market Size (Volume - Kilo Tons and Value - US$ Bn), Analysis, and Forecasts, by Application Method, 2021-2035
- 8.2.1. Soil Application
- 8.2.1.1. Broadcasting
- 8.2.1.2. Banding
- 8.2.1.3. Side Dressing
- 8.2.1.4. Incorporation
- 8.2.1.5. Others
- 8.2.2. Foliar Application
- 8.2.2.1. Fertigation
- 8.2.2.2. Drip Fertigation
- 8.2.2.3. Sprinkler Fertigation
- 8.2.2.4. Others
- 8.2.3. Injection
- 8.2.1. Soil Application
- 9. Global Fertilizers Market Analysis, by Release Type
- 9.1. Key Segment Analysis
- 9.2. Fertilizers Market Size (Volume - Kilo Tons and Value - US$ Bn), Analysis, and Forecasts, by Release Type, 2021-2035
- 9.2.1. Quick Release
- 9.2.2. Slow Release
- 9.2.3. Controlled Release
- 9.2.4. Stabilized Fertilizers
- 10. Global Fertilizers Market Analysis, by Source/Origin
- 10.1. Key Segment Analysis
- 10.2. Fertilizers Market Size (Volume - Kilo Tons and Value - US$ Bn), Analysis, and Forecasts, by Source/Origin, 2021-2035
- 10.2.1. Organic Fertilizers
- 10.2.1.1. Animal-based
- 10.2.1.2. Plant-based
- 10.2.1.3. Mineral-based
- 10.2.2. Inorganic/Synthetic Fertilizers
- 10.2.1. Organic Fertilizers
- 11. Global Fertilizers Market Analysis, by Technology
- 11.1. Key Segment Analysis
- 11.2. Fertilizers Market Size (Volume - Kilo Tons and Value - US$ Bn), Analysis, and Forecasts, by Technology, 2021-2035
- 11.2.1. Conventional Fertilizers
- 11.2.2. Enhanced Efficiency Fertilizers (EEFs)
- 11.2.2.1. Nitrification Inhibitors
- 11.2.2.2. Urease Inhibitors
- 11.2.2.3. Controlled Release Coated Fertilizers
- 11.2.2.4. Stabilized Nitrogen Fertilizers
- 11.2.2.5. Others
- 11.2.3. Bio-fertilizers
- 11.2.3.1. Nitrogen-fixing
- 11.2.3.2. Phosphate-solubilizing
- 11.2.3.3. Potash-mobilizing
- 11.2.3.4. Others
- 12. Global Fertilizers Market Analysis, by Packaging Type
- 12.1. Key Segment Analysis
- 12.2. Fertilizers Market Size (Volume - Kilo Tons and Value - US$ Bn), Analysis, and Forecasts, by Packaging Type, 2021-2035
- 12.2.1. Bags (25 kg, 50 kg)
- 12.2.2. Bulk
- 12.2.3. Bottles/Containers
- 12.2.4. Jumbo Bags
- 13. Global Fertilizers Market Analysis, by Distribution Channel
- 13.1. Key Segment Analysis
- 13.2. Fertilizers Market Size (Volume - Kilo Tons and Value - US$ Bn), Analysis, and Forecasts, by Distribution Channel, 2021-2035
- 13.2.1. Direct Sales
- 13.2.2. Distributors
- 13.2.3. Retailers
- 13.2.3.1. Agricultural Cooperatives
- 13.2.3.2. Farm Supply Stores
- 13.2.3.3. Garden Centers
- 13.2.3.4. Others
- 13.2.4. Online Sales
- 14. Global Fertilizers Market Analysis, by End-users
- 14.1. Key Segment Analysis
- 14.2. Fertilizers Market Size (Volume - Kilo Tons and Value - US$ Bn), Analysis, and Forecasts, by End-users, 2021-2035
- 14.2.1. Agriculture
- 14.2.1.1. Field Crops
- 14.2.1.2. Horticulture
- 14.2.1.3. Plantation Crops
- 14.2.1.4. Others
- 14.2.2. Horticulture & Greenhouse
- 14.2.2.1. Protected Cultivation
- 14.2.2.2. Nurseries
- 14.2.2.3. Hydroponics
- 14.2.2.4. Others
- 14.2.3. Turf & Landscaping
- 14.2.3.1. Sports Turf
- 14.2.3.2. Residential Lawns
- 14.2.3.3. Commercial Landscaping
- 14.2.3.4. Others
- 14.2.4. Forestry
- 14.2.4.1. Commercial Forestry
- 14.2.4.2. Reforestation Projects
- 14.2.4.3. Agroforestry
- 14.2.4.4. Others
- 14.2.1. Agriculture
- 15. Global Fertilizers Market Analysis and Forecasts, by Region
- 15.1. Key Findings
- 15.2. Fertilizers Market Size (Volume - Kilo Tons and Value - US$ Bn), Analysis, and Forecasts, by Region, 2021-2035
- 15.2.1. North America
- 15.2.2. Europe
- 15.2.3. Asia Pacific
- 15.2.4. Middle East
- 15.2.5. Africa
- 15.2.6. South America
- 16. North America Fertilizers Market Analysis
- 16.1. Key Segment Analysis
- 16.2. Regional Snapshot
- 16.3. North America Fertilizers Market Size (Volume - Kilo Tons and Value - US$ Bn), Analysis, and Forecasts, 2021-2035
- 16.3.1. Product Type
- 16.3.2. Form
- 16.3.3. Application Method
- 16.3.4. Release Type
- 16.3.5. Source/Origin
- 16.3.6. Technology
- 16.3.7. Packaging Type
- 16.3.8. Distribution Channel
- 16.3.9. End-users
- 16.3.10. Country
- 16.3.10.1. USA
- 16.3.10.2. Canada
- 16.3.10.3. Mexico
- 16.4. USA Fertilizers Market
- 16.4.1. Country Segmental Analysis
- 16.4.2. Product Type
- 16.4.3. Form
- 16.4.4. Application Method
- 16.4.5. Release Type
- 16.4.6. Source/Origin
- 16.4.7. Technology
- 16.4.8. Packaging Type
- 16.4.9. Distribution Channel
- 16.4.10. End-users
- 16.5. Canada Fertilizers Market
- 16.5.1. Country Segmental Analysis
- 16.5.2. Product Type
- 16.5.3. Form
- 16.5.4. Application Method
- 16.5.5. Release Type
- 16.5.6. Source/Origin
- 16.5.7. Technology
- 16.5.8. Packaging Type
- 16.5.9. Distribution Channel
- 16.5.10. End-users
- 16.6. Mexico Fertilizers Market
- 16.6.1. Country Segmental Analysis
- 16.6.2. Product Type
- 16.6.3. Form
- 16.6.4. Application Method
- 16.6.5. Release Type
- 16.6.6. Source/Origin
- 16.6.7. Technology
- 16.6.8. Packaging Type
- 16.6.9. Distribution Channel
- 16.6.10. End-users
- 17. Europe Fertilizers Market Analysis
- 17.1. Key Segment Analysis
- 17.2. Regional Snapshot
- 17.3. Europe Fertilizers Market Size (Volume - Kilo Tons and Value - US$ Bn), Analysis, and Forecasts, 2021-2035
- 17.3.1. Product Type
- 17.3.2. Form
- 17.3.3. Application Method
- 17.3.4. Release Type
- 17.3.5. Source/Origin
- 17.3.6. Technology
- 17.3.7. Packaging Type
- 17.3.8. Distribution Channel
- 17.3.9. End-users
- 17.3.10. Country
- 17.3.10.1. Germany
- 17.3.10.2. United Kingdom
- 17.3.10.3. France
- 17.3.10.4. Italy
- 17.3.10.5. Spain
- 17.3.10.6. Netherlands
- 17.3.10.7. Nordic Countries
- 17.3.10.8. Poland
- 17.3.10.9. Russia & CIS
- 17.3.10.10. Rest of Europe
- 17.4. Germany Fertilizers Market
- 17.4.1. Country Segmental Analysis
- 17.4.2. Product Type
- 17.4.3. Form
- 17.4.4. Application Method
- 17.4.5. Release Type
- 17.4.6. Source/Origin
- 17.4.7. Technology
- 17.4.8. Packaging Type
- 17.4.9. Distribution Channel
- 17.4.10. End-users
- 17.5. United Kingdom Fertilizers Market
- 17.5.1. Country Segmental Analysis
- 17.5.2. Product Type
- 17.5.3. Form
- 17.5.4. Application Method
- 17.5.5. Release Type
- 17.5.6. Source/Origin
- 17.5.7. Technology
- 17.5.8. Packaging Type
- 17.5.9. Distribution Channel
- 17.5.10. End-users
- 17.6. France Fertilizers Market
- 17.6.1. Country Segmental Analysis
- 17.6.2. Product Type
- 17.6.3. Form
- 17.6.4. Application Method
- 17.6.5. Release Type
- 17.6.6. Source/Origin
- 17.6.7. Technology
- 17.6.8. Packaging Type
- 17.6.9. Distribution Channel
- 17.6.10. End-users
- 17.7. Italy Fertilizers Market
- 17.7.1. Country Segmental Analysis
- 17.7.2. Product Type
- 17.7.3. Form
- 17.7.4. Application Method
- 17.7.5. Release Type
- 17.7.6. Source/Origin
- 17.7.7. Technology
- 17.7.8. Packaging Type
- 17.7.9. Distribution Channel
- 17.7.10. End-users
- 17.8. Spain Fertilizers Market
- 17.8.1. Country Segmental Analysis
- 17.8.2. Product Type
- 17.8.3. Form
- 17.8.4. Application Method
- 17.8.5. Release Type
- 17.8.6. Source/Origin
- 17.8.7. Technology
- 17.8.8. Packaging Type
- 17.8.9. Distribution Channel
- 17.8.10. End-users
- 17.9. Netherlands Fertilizers Market
- 17.9.1. Country Segmental Analysis
- 17.9.2. Product Type
- 17.9.3. Form
- 17.9.4. Application Method
- 17.9.5. Release Type
- 17.9.6. Source/Origin
- 17.9.7. Technology
- 17.9.8. Packaging Type
- 17.9.9. Distribution Channel
- 17.9.10. End-users
- 17.10. Nordic Countries Fertilizers Market
- 17.10.1. Country Segmental Analysis
- 17.10.2. Product Type
- 17.10.3. Form
- 17.10.4. Application Method
- 17.10.5. Release Type
- 17.10.6. Source/Origin
- 17.10.7. Technology
- 17.10.8. Packaging Type
- 17.10.9. Distribution Channel
- 17.10.10. End-users
- 17.11. Poland Fertilizers Market
- 17.11.1. Country Segmental Analysis
- 17.11.2. Product Type
- 17.11.3. Form
- 17.11.4. Application Method
- 17.11.5. Release Type
- 17.11.6. Source/Origin
- 17.11.7. Technology
- 17.11.8. Packaging Type
- 17.11.9. Distribution Channel
- 17.11.10. End-users
- 17.12. Russia & CIS Fertilizers Market
- 17.12.1. Country Segmental Analysis
- 17.12.2. Product Type
- 17.12.3. Form
- 17.12.4. Application Method
- 17.12.5. Release Type
- 17.12.6. Source/Origin
- 17.12.7. Technology
- 17.12.8. Packaging Type
- 17.12.9. Distribution Channel
- 17.12.10. End-users
- 17.13. Rest of Europe Fertilizers Market
- 17.13.1. Country Segmental Analysis
- 17.13.2. Product Type
- 17.13.3. Form
- 17.13.4. Application Method
- 17.13.5. Release Type
- 17.13.6. Source/Origin
- 17.13.7. Technology
- 17.13.8. Packaging Type
- 17.13.9. Distribution Channel
- 17.13.10. End-users
- 18. Asia Pacific Fertilizers Market Analysis
- 18.1. Key Segment Analysis
- 18.2. Regional Snapshot
- 18.3. Asia Pacific Fertilizers Market Size (Volume - Kilo Tons and Value - US$ Bn), Analysis, and Forecasts, 2021-2035
- 18.3.1. Product Type
- 18.3.2. Form
- 18.3.3. Application Method
- 18.3.4. Release Type
- 18.3.5. Source/Origin
- 18.3.6. Technology
- 18.3.7. Packaging Type
- 18.3.8. Distribution Channel
- 18.3.9. End-users
- 18.3.10. Country
- 18.3.10.1. China
- 18.3.10.2. India
- 18.3.10.3. Japan
- 18.3.10.4. South Korea
- 18.3.10.5. Australia and New Zealand
- 18.3.10.6. Indonesia
- 18.3.10.7. Malaysia
- 18.3.10.8. Thailand
- 18.3.10.9. Vietnam
- 18.3.10.10. Rest of Asia Pacific
- 18.4. China Fertilizers Market
- 18.4.1. Country Segmental Analysis
- 18.4.2. Product Type
- 18.4.3. Form
- 18.4.4. Application Method
- 18.4.5. Release Type
- 18.4.6. Source/Origin
- 18.4.7. Technology
- 18.4.8. Packaging Type
- 18.4.9. Distribution Channel
- 18.4.10. End-users
- 18.5. India Fertilizers Market
- 18.5.1. Country Segmental Analysis
- 18.5.2. Product Type
- 18.5.3. Form
- 18.5.4. Application Method
- 18.5.5. Release Type
- 18.5.6. Source/Origin
- 18.5.7. Technology
- 18.5.8. Packaging Type
- 18.5.9. Distribution Channel
- 18.5.10. End-users
- 18.6. Japan Fertilizers Market
- 18.6.1. Country Segmental Analysis
- 18.6.2. Product Type
- 18.6.3. Form
- 18.6.4. Application Method
- 18.6.5. Release Type
- 18.6.6. Source/Origin
- 18.6.7. Technology
- 18.6.8. Packaging Type
- 18.6.9. Distribution Channel
- 18.6.10. End-users
- 18.7. South Korea Fertilizers Market
- 18.7.1. Country Segmental Analysis
- 18.7.2. Product Type
- 18.7.3. Form
- 18.7.4. Application Method
- 18.7.5. Release Type
- 18.7.6. Source/Origin
- 18.7.7. Technology
- 18.7.8. Packaging Type
- 18.7.9. Distribution Channel
- 18.7.10. End-users
- 18.8. Australia and New Zealand Fertilizers Market
- 18.8.1. Country Segmental Analysis
- 18.8.2. Product Type
- 18.8.3. Form
- 18.8.4. Application Method
- 18.8.5. Release Type
- 18.8.6. Source/Origin
- 18.8.7. Technology
- 18.8.8. Packaging Type
- 18.8.9. Distribution Channel
- 18.8.10. End-users
- 18.9. Indonesia Fertilizers Market
- 18.9.1. Country Segmental Analysis
- 18.9.2. Product Type
- 18.9.3. Form
- 18.9.4. Application Method
- 18.9.5. Release Type
- 18.9.6. Source/Origin
- 18.9.7. Technology
- 18.9.8. Packaging Type
- 18.9.9. Distribution Channel
- 18.9.10. End-users
- 18.10. Malaysia Fertilizers Market
- 18.10.1. Country Segmental Analysis
- 18.10.2. Product Type
- 18.10.3. Form
- 18.10.4. Application Method
- 18.10.5. Release Type
- 18.10.6. Source/Origin
- 18.10.7. Technology
- 18.10.8. Packaging Type
- 18.10.9. Distribution Channel
- 18.10.10. End-users
- 18.11. Thailand Fertilizers Market
- 18.11.1. Country Segmental Analysis
- 18.11.2. Product Type
- 18.11.3. Form
- 18.11.4. Application Method
- 18.11.5. Release Type
- 18.11.6. Source/Origin
- 18.11.7. Technology
- 18.11.8. Packaging Type
- 18.11.9. Distribution Channel
- 18.11.10. End-users
- 18.12. Vietnam Fertilizers Market
- 18.12.1. Country Segmental Analysis
- 18.12.2. Product Type
- 18.12.3. Form
- 18.12.4. Application Method
- 18.12.5. Release Type
- 18.12.6. Source/Origin
- 18.12.7. Technology
- 18.12.8. Packaging Type
- 18.12.9. Distribution Channel
- 18.12.10. End-users
- 18.13. Rest of Asia Pacific Fertilizers Market
- 18.13.1. Country Segmental Analysis
- 18.13.2. Product Type
- 18.13.3. Form
- 18.13.4. Application Method
- 18.13.5. Release Type
- 18.13.6. Source/Origin
- 18.13.7. Technology
- 18.13.8. Packaging Type
- 18.13.9. Distribution Channel
- 18.13.10. End-users
- 19. Middle East Fertilizers Market Analysis
- 19.1. Key Segment Analysis
- 19.2. Regional Snapshot
- 19.3. Middle East Fertilizers Market Size (Volume - Kilo Tons and Value - US$ Bn), Analysis, and Forecasts, 2021-2035
- 19.3.1. Product Type
- 19.3.2. Form
- 19.3.3. Application Method
- 19.3.4. Release Type
- 19.3.5. Source/Origin
- 19.3.6. Technology
- 19.3.7. Packaging Type
- 19.3.8. Distribution Channel
- 19.3.9. End-users
- 19.3.10. Country
- 19.3.10.1. Turkey
- 19.3.10.2. UAE
- 19.3.10.3. Saudi Arabia
- 19.3.10.4. Israel
- 19.3.10.5. Rest of Middle East
- 19.4. Turkey Fertilizers Market
- 19.4.1. Country Segmental Analysis
- 19.4.2. Product Type
- 19.4.3. Form
- 19.4.4. Application Method
- 19.4.5. Release Type
- 19.4.6. Source/Origin
- 19.4.7. Technology
- 19.4.8. Packaging Type
- 19.4.9. Distribution Channel
- 19.4.10. End-users
- 19.5. UAE Fertilizers Market
- 19.5.1. Country Segmental Analysis
- 19.5.2. Product Type
- 19.5.3. Form
- 19.5.4. Application Method
- 19.5.5. Release Type
- 19.5.6. Source/Origin
- 19.5.7. Technology
- 19.5.8. Packaging Type
- 19.5.9. Distribution Channel
- 19.5.10. End-users
- 19.6. Saudi Arabia Fertilizers Market
- 19.6.1. Country Segmental Analysis
- 19.6.2. Product Type
- 19.6.3. Form
- 19.6.4. Application Method
- 19.6.5. Release Type
- 19.6.6. Source/Origin
- 19.6.7. Technology
- 19.6.8. Packaging Type
- 19.6.9. Distribution Channel
- 19.6.10. End-users
- 19.7. Israel Fertilizers Market
- 19.7.1. Country Segmental Analysis
- 19.7.2. Product Type
- 19.7.3. Form
- 19.7.4. Application Method
- 19.7.5. Release Type
- 19.7.6. Source/Origin
- 19.7.7. Technology
- 19.7.8. Packaging Type
- 19.7.9. Distribution Channel
- 19.7.10. End-users
- 19.8. Rest of Middle East Fertilizers Market
- 19.8.1. Country Segmental Analysis
- 19.8.2. Product Type
- 19.8.3. Form
- 19.8.4. Application Method
- 19.8.5. Release Type
- 19.8.6. Source/Origin
- 19.8.7. Technology
- 19.8.8. Packaging Type
- 19.8.9. Distribution Channel
- 19.8.10. End-users
- 20. Africa Fertilizers Market Analysis
- 20.1. Key Segment Analysis
- 20.2. Regional Snapshot
- 20.3. Africa Fertilizers Market Size (Volume - Kilo Tons and Value - US$ Bn), Analysis, and Forecasts, 2021-2035
- 20.3.1. Product Type
- 20.3.2. Form
- 20.3.3. Application Method
- 20.3.4. Release Type
- 20.3.5. Source/Origin
- 20.3.6. Technology
- 20.3.7. Packaging Type
- 20.3.8. Distribution Channel
- 20.3.9. End-users
- 20.3.10. Country
- 20.3.10.1. South Africa
- 20.3.10.2. Egypt
- 20.3.10.3. Nigeria
- 20.3.10.4. Algeria
- 20.3.10.5. Rest of Africa
- 20.4. South Africa Fertilizers Market
- 20.4.1. Country Segmental Analysis
- 20.4.2. Product Type
- 20.4.3. Form
- 20.4.4. Application Method
- 20.4.5. Release Type
- 20.4.6. Source/Origin
- 20.4.7. Technology
- 20.4.8. Packaging Type
- 20.4.9. Distribution Channel
- 20.4.10. End-users
- 20.5. Egypt Fertilizers Market
- 20.5.1. Country Segmental Analysis
- 20.5.2. Product Type
- 20.5.3. Form
- 20.5.4. Application Method
- 20.5.5. Release Type
- 20.5.6. Source/Origin
- 20.5.7. Technology
- 20.5.8. Packaging Type
- 20.5.9. Distribution Channel
- 20.5.10. End-users
- 20.6. Nigeria Fertilizers Market
- 20.6.1. Country Segmental Analysis
- 20.6.2. Product Type
- 20.6.3. Form
- 20.6.4. Application Method
- 20.6.5. Release Type
- 20.6.6. Source/Origin
- 20.6.7. Technology
- 20.6.8. Packaging Type
- 20.6.9. Distribution Channel
- 20.6.10. End-users
- 20.7. Algeria Fertilizers Market
- 20.7.1. Country Segmental Analysis
- 20.7.2. Product Type
- 20.7.3. Form
- 20.7.4. Application Method
- 20.7.5. Release Type
- 20.7.6. Source/Origin
- 20.7.7. Technology
- 20.7.8. Packaging Type
- 20.7.9. Distribution Channel
- 20.7.10. End-users
- 20.8. Rest of Africa Fertilizers Market
- 20.8.1. Country Segmental Analysis
- 20.8.2. Product Type
- 20.8.3. Form
- 20.8.4. Application Method
- 20.8.5. Release Type
- 20.8.6. Source/Origin
- 20.8.7. Technology
- 20.8.8. Packaging Type
- 20.8.9. Distribution Channel
- 20.8.10. End-users
- 21. South America Fertilizers Market Analysis
- 21.1. Key Segment Analysis
- 21.2. Regional Snapshot
- 21.3. South America Fertilizers Market Size (Volume - Kilo Tons and Value - US$ Bn), Analysis, and Forecasts, 2021-2035
- 21.3.1. Product Type
- 21.3.2. Form
- 21.3.3. Application Method
- 21.3.4. Release Type
- 21.3.5. Source/Origin
- 21.3.6. Technology
- 21.3.7. Packaging Type
- 21.3.8. Distribution Channel
- 21.3.9. End-users
- 21.3.10. Country
- 21.3.10.1. Brazil
- 21.3.10.2. Argentina
- 21.3.10.3. Rest of South America
- 21.4. Brazil Fertilizers Market
- 21.4.1. Country Segmental Analysis
- 21.4.2. Product Type
- 21.4.3. Form
- 21.4.4. Application Method
- 21.4.5. Release Type
- 21.4.6. Source/Origin
- 21.4.7. Technology
- 21.4.8. Packaging Type
- 21.4.9. Distribution Channel
- 21.4.10. End-users
- 21.5. Argentina Fertilizers Market
- 21.5.1. Country Segmental Analysis
- 21.5.2. Product Type
- 21.5.3. Form
- 21.5.4. Application Method
- 21.5.5. Release Type
- 21.5.6. Source/Origin
- 21.5.7. Technology
- 21.5.8. Packaging Type
- 21.5.9. Distribution Channel
- 21.5.10. End-users
- 21.6. Rest of South America Fertilizers Market
- 21.6.1. Country Segmental Analysis
- 21.6.2. Product Type
- 21.6.3. Form
- 21.6.4. Application Method
- 21.6.5. Release Type
- 21.6.6. Source/Origin
- 21.6.7. Technology
- 21.6.8. Packaging Type
- 21.6.9. Distribution Channel
- 21.6.10. End-users
- 22. Key Players/ Company Profile
- 22.1. CF Industries Holdings, Inc.
- 22.1.1. Company Details/ Overview
- 22.1.2. Company Financials
- 22.1.3. Key Customers and Competitors
- 22.1.4. Business/ Industry Portfolio
- 22.1.5. Product Portfolio/ Specification Details
- 22.1.6. Pricing Data
- 22.1.7. Strategic Overview
- 22.1.8. Recent Developments
- 22.2. Chambal Fertilisers and Chemicals Limited
- 22.3. Coromandel International Limited
- 22.4. Deepak Fertilisers And Petrochemicals Corp. Ltd.
- 22.5. Eurochem Group
- 22.6. Gujarat State Fertilizers & Chemicals Limited
- 22.7. Haifa Group
- 22.8. ICL Group
- 22.9. K+S Aktiengesellschaft
- 22.10. Koch Industries (Koch Fertilizer)
- 22.11. Nutrien Ltd.
- 22.12. OCP Group
- 22.13. PhosAgro
- 22.14. SABIC (Saudi Basic Industries Corporation)
- 22.15. Sinofert Holdings Limited
- 22.16. Sociedad Química y Minera de Chile (SQM)
- 22.17. The Mosaic Company
- 22.18. Uralkali
- 22.19. Yara International ASA
- 22.20. Zuari Agro Chemicals Limited
- 22.21. Other Key Players
- 22.1. CF Industries Holdings, Inc.
Note* - This is just tentative list of players. While providing the report, we will cover more number of players based on their revenue and share for each geography
Research Design
Our research design integrates both demand-side and supply-side analysis through a balanced combination of primary and secondary research methodologies. By utilizing both bottom-up and top-down approaches alongside rigorous data triangulation methods, we deliver robust market intelligence that supports strategic decision-making.
MarketGenics' comprehensive research design framework ensures the delivery of accurate, reliable, and actionable market intelligence. Through the integration of multiple research approaches, rigorous validation processes, and expert analysis, we provide our clients with the insights needed to make informed strategic decisions and capitalize on market opportunities.

MarketGenics leverages a dedicated industry panel of experts and a comprehensive suite of paid databases to effectively collect, consolidate, and analyze market intelligence.
Our approach has consistently proven to be reliable and effective in generating accurate market insights, identifying key industry trends, and uncovering emerging business opportunities.
Through both primary and secondary research, we capture and analyze critical company-level data such as manufacturing footprints, including technical centers, R&D facilities, sales offices, and headquarters.
Our expert panel further enhances our ability to estimate market size for specific brands based on validated field-level intelligence.
Our data mining techniques incorporate both parametric and non-parametric methods, allowing for structured data collection, sorting, processing, and cleaning.
Demand projections are derived from large-scale data sets analyzed through proprietary algorithms, culminating in robust and reliable market sizing.
Research Approach
The bottom-up approach builds market estimates by starting with the smallest addressable market units and systematically aggregating them to create comprehensive market size projections.
This method begins with specific, granular data points and builds upward to create the complete market landscape.
Customer Analysis → Segmental Analysis → Geographical Analysis
The top-down approach starts with the broadest possible market data and systematically narrows it down through a series of filters and assumptions to arrive at specific market segments or opportunities.
This method begins with the big picture and works downward to increasingly specific market slices.
TAM → SAM → SOM


Research Methods
Desk / Secondary Research
While analysing the market, we extensively study secondary sources, directories, and databases to identify and collect information useful for this technical, market-oriented, and commercial report. Secondary sources that we utilize are not only the public sources, but it is a combination of Open Source, Associations, Paid Databases, MG Repository & Knowledgebase, and others.
- Company websites, annual reports, financial reports, broker reports, and investor presentations
- National government documents, statistical databases and reports
- News articles, press releases and web-casts specific to the companies operating in the market, Magazines, reports, and others
- We gather information from commercial data sources for deriving company specific data such as segmental revenue, share for geography, product revenue, and others
- Internal and external proprietary databases (industry-specific), relevant patent, and regulatory databases
- Governing Bodies, Government Organizations
- Relevant Authorities, Country-specific Associations for Industries
We also employ the model mapping approach to estimate the product level market data through the players' product portfolio
Primary Research
Primary research/ interviews is vital in analyzing the market. Most of the cases involves paid primary interviews. Primary sources include primary interviews through e-mail interactions, telephonic interviews, surveys as well as face-to-face interviews with the different stakeholders across the value chain including several industry experts.
| Type of Respondents | Number of Primaries |
|---|---|
| Tier 2/3 Suppliers | ~20 |
| Tier 1 Suppliers | ~25 |
| End-users | ~25 |
| Industry Expert/ Panel/ Consultant | ~30 |
| Total | ~100 |
MG Knowledgebase
• Repository of industry blog, newsletter and case studies
• Online platform covering detailed market reports, and company profiles
Forecasting Factors and Models
Forecasting Factors
- Historical Trends – Past market patterns, cycles, and major events that shaped how markets behave over time. Understanding past trends helps predict future behavior.
- Industry Factors – Specific characteristics of the industry like structure, regulations, and innovation cycles that affect market dynamics.
- Macroeconomic Factors – Economic conditions like GDP growth, inflation, and employment rates that affect how much money people have to spend.
- Demographic Factors – Population characteristics like age, income, and location that determine who can buy your product.
- Technology Factors – How quickly people adopt new technology and how much technology infrastructure exists.
- Regulatory Factors – Government rules, laws, and policies that can help or restrict market growth.
- Competitive Factors – Analyzing competition structure such as degree of competition and bargaining power of buyers and suppliers.
Forecasting Models / Techniques
Multiple Regression Analysis
- Identify and quantify factors that drive market changes
- Statistical modeling to establish relationships between market drivers and outcomes
Time Series Analysis – Seasonal Patterns
- Understand regular cyclical patterns in market demand
- Advanced statistical techniques to separate trend, seasonal, and irregular components
Time Series Analysis – Trend Analysis
- Identify underlying market growth patterns and momentum
- Statistical analysis of historical data to project future trends
Expert Opinion – Expert Interviews
- Gather deep industry insights and contextual understanding
- In-depth interviews with key industry stakeholders
Multi-Scenario Development
- Prepare for uncertainty by modeling different possible futures
- Creating optimistic, pessimistic, and most likely scenarios
Time Series Analysis – Moving Averages
- Sophisticated forecasting for complex time series data
- Auto-regressive integrated moving average models with seasonal components
Econometric Models
- Apply economic theory to market forecasting
- Sophisticated economic models that account for market interactions
Expert Opinion – Delphi Method
- Harness collective wisdom of industry experts
- Structured, multi-round expert consultation process
Monte Carlo Simulation
- Quantify uncertainty and probability distributions
- Thousands of simulations with varying input parameters
Research Analysis
Our research framework is built upon the fundamental principle of validating market intelligence from both demand and supply perspectives. This dual-sided approach ensures comprehensive market understanding and reduces the risk of single-source bias.
Demand-Side Analysis: We understand end-user/application behavior, preferences, and market needs along with the penetration of the product for specific application.
Supply-Side Analysis: We estimate overall market revenue, analyze the segmental share along with industry capacity, competitive landscape, and market structure.
Validation & Evaluation
Data triangulation is a validation technique that uses multiple methods, sources, or perspectives to examine the same research question, thereby increasing the credibility and reliability of research findings. In market research, triangulation serves as a quality assurance mechanism that helps identify and minimize bias, validate assumptions, and ensure accuracy in market estimates.
- Data Source Triangulation – Using multiple data sources to examine the same phenomenon
- Methodological Triangulation – Using multiple research methods to study the same research question
- Investigator Triangulation – Using multiple researchers or analysts to examine the same data
- Theoretical Triangulation – Using multiple theoretical perspectives to interpret the same data

Custom Market Research Services
We will customise the research for you, in case the report listed above does not meet your requirements.
Get 10% Free Customisation