Food Phosphate Market Size, Share & Trends Analysis Report by Product Type (Orthophosphates, Polyphosphates, Blended Phosphates), Form, Function, Application, Source, Grade, Packaging Type, Distribution Channel, Price Range, Purity Level, and Geography (North America, Europe, Asia Pacific, Middle East, Africa, and South America) – Global Industry Data, Trends, and Forecasts, 2025–2035
|
|
|
Segmental Data Insights |
|
|
Demand Trends |
|
|
Competitive Landscape |
|
|
Strategic Development |
|
|
Future Outlook & Opportunities |
|
Food Phosphate Market Size, Share, and Growth
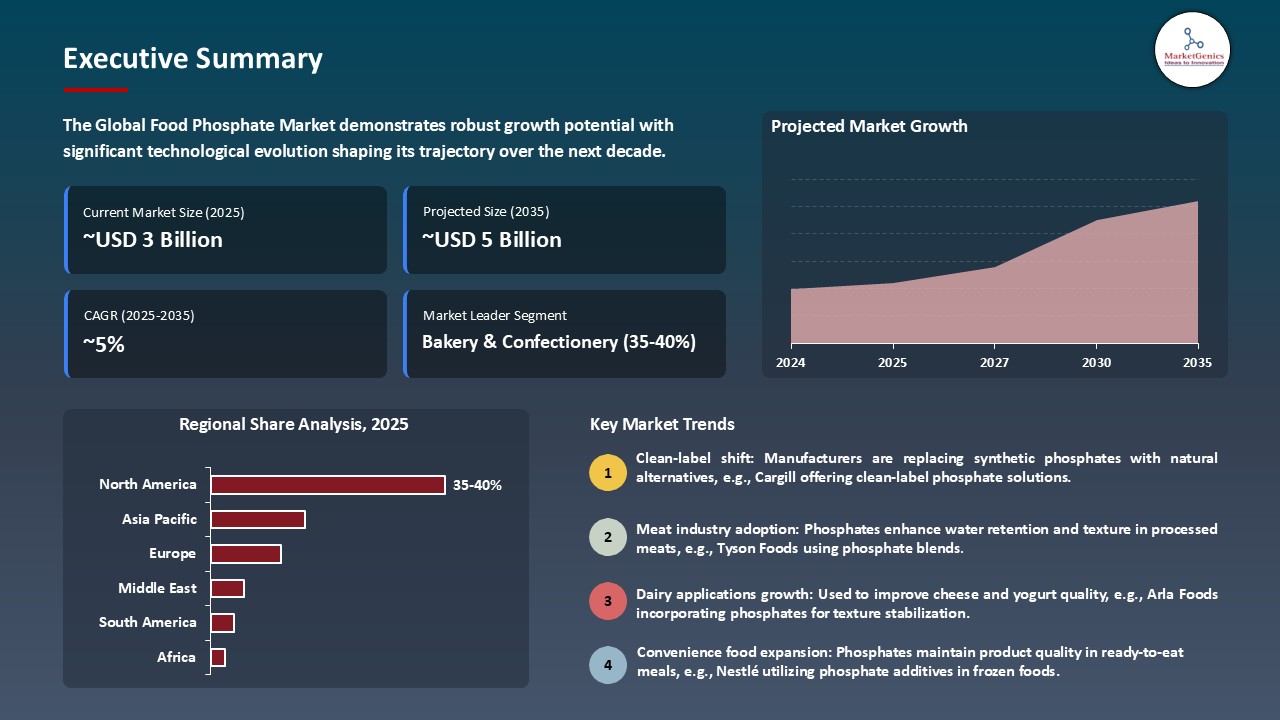
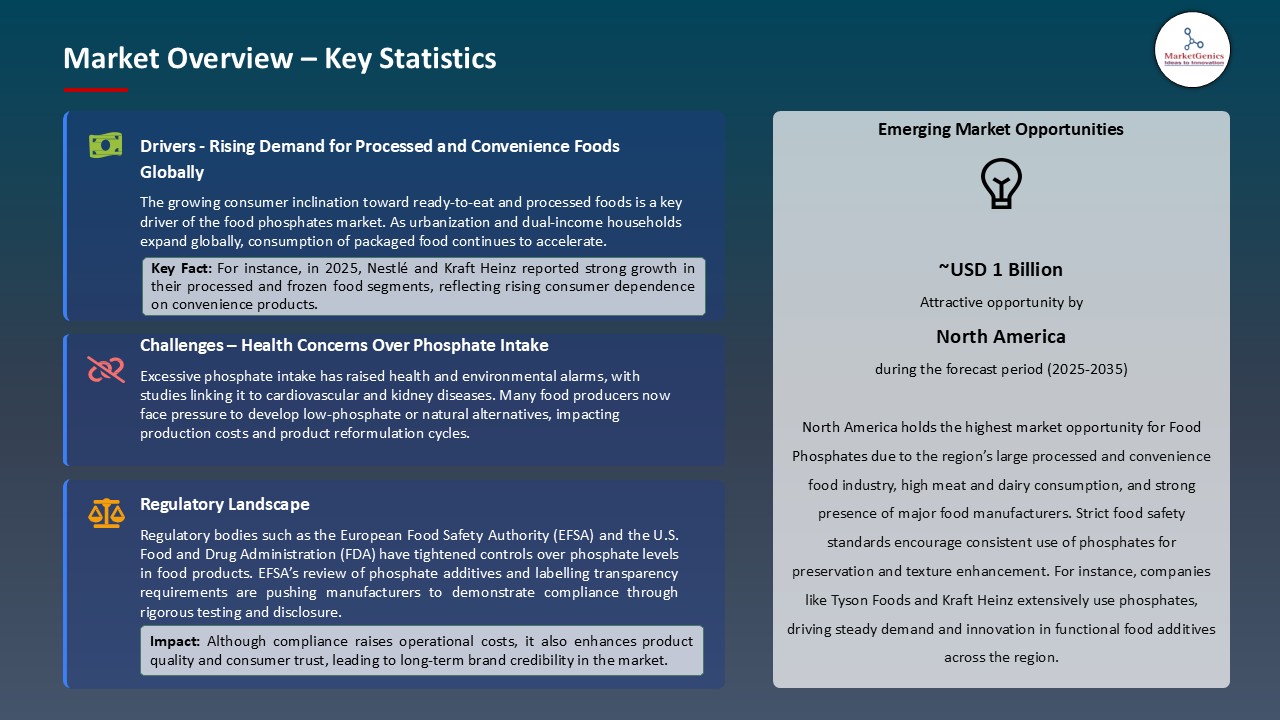
The global food phosphate market is experiencing robust growth, with its estimated value of USD 3.2 billion in the year 2025 and USD 5.1 billion by the period 2035, registering a CAGR of 4.7%, during the forecast period. The global food phosphate market is growing due to the growing global demand for processed and convenience foods, the expansion of the bakery and confectionery industries, and health and wellness trends.
Simon George, Country President and Managing Director, Cargill Food South Asia said, “We are excited to deliver comprehensive solutions that empower our customers to grow their business through innovative products and cost-efficient solutions and at the same time, connecting consumers to the nutrition they need and food they love, building a more food secure world. Through AAHAR, we aim to strengthen our partnerships and reinforce Cargill’s position as a trusted food solutions provider in the industry”
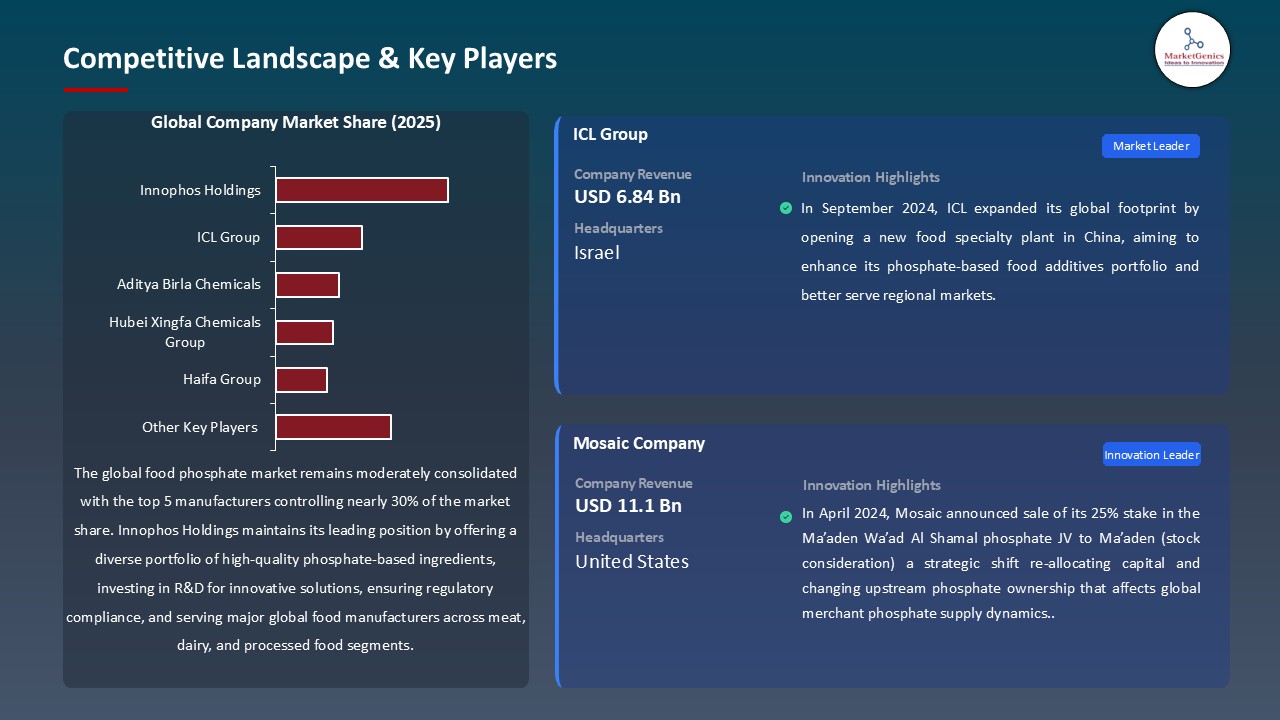
The global food phosphate market is propelled due to food-grade phosphates are widely used to improve water-holding capacity, juiciness, and texture in meat, poultry, and seafood products. This enhances product yield, reduces cooking loss, and ensures consistent quality, making phosphates a critical functional ingredient in processed protein foods. For instance, in September 2024, ICL Group inaugurated a new food specialty plant in Zhangjiagang, China, focusing on producing specialty food solutions for meat, poultry, and seafood segments such as textures and marinades, among other offerings.
Government strong supports and policies drives the food phosphate market. For instance, in March 2025, the Union Cabinet approved revised rates for the Nutrient Based Subsidy scheme. These subsidies apply to phosphatic and potassic (P&K) Fertilizers, including NPKS grades. These initiatives reflect the government's proactive approach to ensuring the availability and affordability of food-grade phosphates, thereby supporting the agricultural sector and food security objectives.
The regulatory framework is actively promoting the adoption of food-grade phosphates through various policies and initiatives aimed at enhancing agricultural productivity, ensuring food security, and supporting sustainable practices. For instance, in January 2025, the Indian government extended the special subsidy of ₹3,500 per tonne on Di-Ammonium Phosphate (DAP) fertilizers until further notice. This measure aims to ensure the sustainable availability of DAP at affordable prices for farmers, thereby supporting the food phosphate market.
The key market opportunities for global food phosphate market are nutraceuticals, plant-based foods, functional beverages, clean-label ingredients, and food fortification. These trends are driving innovation, expanding application areas, and strengthening the long-term growth trajectory of the global food phosphate market.
Food Phosphate Market Dynamics and Trends
Driver: Increasing Demand for Plant-Based Meat and Dairy Alternatives
- The food phosphate market is increasing owing to increasing health consciousness and environmental awareness are driving consumers toward plant-based meat and dairy alternatives. This trend boosts the demand for phosphate-based texture stabilizers, which help maintain product structure, moisture retention, and palatability. For instance, in November 2024, At Fi Europe 2024, BENEO showcased its hybrid and fully plant-based development processes using textures from Meatless and faba bean protein concentrate. These innovations aim to streamline production and facilitate faster market launches for plant-based products.
- Additionally, manufacturers are focusing on improving the sensory and functional properties of plant-based products, requiring additives like phosphates to enhance texture and stability. For instance, IFPC introduced custom stabilizer systems for dairy and plant-based proteins in 2024, improving consistency and shelf life of alternative dairy products.
- Thus, the introduction of phosphate-based stabilizers by companies like IFPC enhances the texture, consistency, and shelf life of plant-based products, directly driving higher adoption of phosphates and contributing to sustained growth in the global food phosphate market.
Restraint: Limited Application in Certain Foods
- Food-grade phosphates are not universally applicable across all food products, particularly within organic, natural, or minimally processed categories, where the use of synthetic additives is either restricted or prohibited. This constraint limits their adoption in these expanding segments, thereby constraining potential market penetration and overall demand growth. For instance, in 2024, the European Union’s organic food regulations (EU Regulation 2018/848) restricted the use of synthetic phosphates in certified organic processed foods.
- As a result, manufacturers of organic meat, dairy, and baked products in countries like Germany and France had to rely on natural alternatives such as seaweed extracts or mineral salts, limiting the use of conventional food-grade phosphates.
Opportunity: Consumer Preference for Clean-Label Products
- The food phosphate market is growing due to consumers are increasingly seeking foods with recognizable, minimally processed ingredients, pushing manufacturers to replace synthetic additives with natural alternatives. Phosphates are being reformulated or substituted in certain applications to meet this clean-label demand. For instance, in July 2025, announced the launch of VersaCal Bright a science-backed, clean-label solution that delivers the whiteness and brightness of titanium dioxide (TiO₂), with the added benefit of essential nutrients.
- In addition, the food phosphate market’s growth is bolstered by development of natural phosphate alternatives. For instance, in February 2025, UK scientist Jane Pearce developed Phosphate Removal Material (PRM), a natural product designed to extract phosphates from waterways and repurpose them for agricultural use. This innovation aligns with the clean-label trend by offering a natural solution to phosphate utilization.
- These clean-label innovations and natural phosphate alternatives are driving wider adoption of food phosphates, enhancing product appeal, regulatory compliance, and overall market growth.
Key Trend: Adoption of Natural Phosphate Alternatives
- The adoption of natural phosphate alternatives is becoming a key trend in the global food phosphate market because of manufacturers and consumers are seeking clean-label, sustainable, and functional ingredients to replace synthetic phosphates. For instance, in July 2025, Wenda Ingredients launched TasteNrich HyBind PR3, a natural phosphate replacer designed to enhance the yield and texture of processed meat and poultry products. This ingredient system, composed of cultured dextrose and sea salt, offers a clean-label alternative to synthetic phosphates, aligning with the industry's shift towards natural ingredients.
- Furthermore, environmental concerns and stricter regulations on synthetic phosphate usage are encouraging the shift toward natural phosphate alternatives. Recovering phosphate from bio-waste or water bodies not only reduces environmental pollution but also provides a sustainable source for food applications. For instance, the UK’s Phosphate Removal Material (PRM), developed by Rookwood Operations, extracts phosphates from rivers and lakes for reuse in agriculture and food, aligning with both sustainability goals and regulatory compliance.
Food Phosphate Market Analysis and Segmental Data
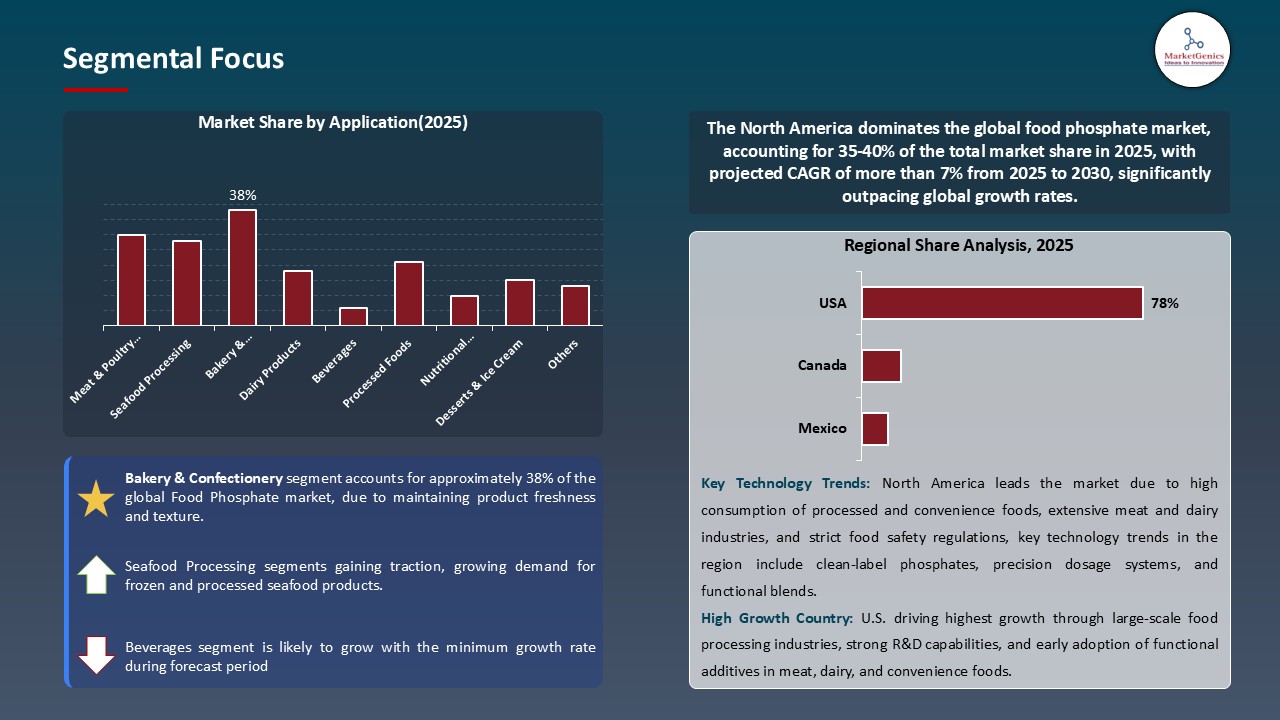
Bakery & Confectionery Dominate Global Food Phosphate Market
- Bakery & confectionery dominate the global food phosphate market owing to phosphates help maintain moisture, improve texture, and extend the shelf-life of bakery and confectionery products, making them essential for consistent product quality. For instance, in May 2025, Ingredion launched innovation such as egg replacement in bakery product, with more options than ever, manufacturers can cut costs and still achieve customer-preferred texture and structure in bakery products.
- Moreover, the food phosphate market is growing due to the growing consumption of packaged confectionery and ready-to-eat bakery products is driving phosphate use to ensure product consistency, color, and taste. For instance, in November 2024, Cargill unveiled new sustainable food innovations for sugar-coated candies and snack bars, enabling clean-label solutions while maintaining texture and sweetness.
North America Leads Global Food Phosphate Market Demand
- North America dominates the food phosphate market because of the investment of major companies, such as Mosaic Company, Nutrien Ltd., Innophos, and Olin Corporation. For instance, in July 2025, Innophos launched VersaCal Bright, a clean-label whitening solution for food manufacturers, offering a safe alternative to titanium dioxide in select food categories
- Furthermore, policies and investment by the North America government are helping to bolster the food phosphate market in North America. For instance, in August 2025, the U.S. Department of Energy (DOE) and Cornell University supported research on producing biochar from human and agricultural waste as a renewable phosphorus source. This project demonstrated how biochar could supply up to 7% of global phosphorus demand, offering an eco-friendly alternative to mined phosphates while reducing waste and supporting sustainable food production systems.
Food Phosphate Market Ecosystem
The global food phosphate market is highly fragmented, with high concentration among key players such as Innophos Holdings, ICL Group, Aditya Birla Chemicals, Hubei Xingfa Chemicals Group, and Haifa Group, who dominate through innovative solutions, extensive distribution networks, and strong client relationships. For instance, in September 2024, ICL announced it has opened a new food specialty plant in China, which was designed to help customers easily partner with ICL to create novel and innovative food offerings tailored to Chinese consumers’ palates.
Government bodies, institutions, and R&D organizations are increasingly investing in developing sustainable and natural phosphate alternatives to reduce reliance on synthetic phosphates and improve food safety. For instance, in July 2024, Yuntianhua disclosed an environmental impact assessment a 4.5 million t/y phosphorus ore flotation project a large upstream capacity development affecting phosphates supply.
Recent Development and Strategic Overview:
- In March 2025, Budenheim announced a new high-purity iron/ferric phosphate grade tailored for infant-nutrition and specialty food applications, now available for sampling. This new batch of high-purity Ferric Pyrophosphate meets the highest standards of purity, consistency, and safety, ensuring superior performance and supports our goal of aligning with the US Food and Drug Administration’s closer to Zero Initiative.
- In August 2024, Prayon has officially acquired the US-based company Natural Enrichment Industries (NEI), a producer of calcium phosphate salts (TCP). This strategic move marks a significant milestone in the Group expansion in the US and further solidifies its global position on the high value-added calcium phosphate salts market.
Report Scope
|
Detail |
|
|
Market Size in 2025 |
USD 3.2 Bn |
|
Market Forecast Value in 2035 |
USD 5.1 Bn |
|
Growth Rate (CAGR) |
4.7% |
|
Forecast Period |
2025 – 2035 |
|
Historical Data Available for |
2021 – 2024 |
|
Market Size Units |
US$ Billion for Value MMT for Volume |
|
Report Format |
Electronic (PDF) + Excel |
|
North America |
Europe |
Asia Pacific |
Middle East |
Africa |
South America |
|
|
|
|
|
|
|
Companies Covered |
|||||
|
|
|
|
|
|
Food Phosphate Market Segmentation and Highlights
|
Segment |
Sub-segment |
|
Food Phosphate Market By Product Type |
|
|
Food Phosphate Market By Form
|
|
|
Food Phosphate Market By Function
|
|
|
Food Phosphate Market By Application |
|
|
Food Phosphate Market By Source
|
|
|
Food Phosphate Market By Grade
|
|
|
Food Phosphate Market By Packaging Type
|
|
|
Food Phosphate Market By Distribution Channel
|
|
|
Food Phosphate Market By Price Range
|
|
|
Food Phosphate Market By Purity Level
|
|
Frequently Asked Questions
Table of Contents
- 1. Research Methodology and Assumptions
- 1.1. Definitions
- 1.2. Research Design and Approach
- 1.3. Data Collection Methods
- 1.4. Base Estimates and Calculations
- 1.5. Forecasting Models
- 1.5.1. Key Forecast Factors & Impact Analysis
- 1.6. Secondary Research
- 1.6.1. Open Sources
- 1.6.2. Paid Databases
- 1.6.3. Associations
- 1.7. Primary Research
- 1.7.1. Primary Sources
- 1.7.2. Primary Interviews with Stakeholders across Ecosystem
- 2. Executive Summary
- 2.1. Global Food Phosphate Market Outlook
- 2.1.1. Food Phosphate Market Size (Volume - MMT and Value - US$ Bn), and Forecasts, 2021-2035
- 2.1.2. Compounded Annual Growth Rate Analysis
- 2.1.3. Growth Opportunity Analysis
- 2.1.4. Segmental Share Analysis
- 2.1.5. Geographical Share Analysis
- 2.2. Market Analysis and Facts
- 2.3. Supply-Demand Analysis
- 2.4. Competitive Benchmarking
- 2.5. Go-to- Market Strategy
- 2.5.1. Customer/ End-use Industry Assessment
- 2.5.2. Growth Opportunity Data, 2025-2035
- 2.5.2.1. Regional Data
- 2.5.2.2. Country Data
- 2.5.2.3. Segmental Data
- 2.5.3. Identification of Potential Market Spaces
- 2.5.4. GAP Analysis
- 2.5.5. Potential Attractive Price Points
- 2.5.6. Prevailing Market Risks & Challenges
- 2.5.7. Preferred Sales & Marketing Strategies
- 2.5.8. Key Recommendations and Analysis
- 2.5.9. A Way Forward
- 2.1. Global Food Phosphate Market Outlook
- 3. Industry Data and Premium Insights
- 3.1. Global Food Phosphate Industry Overview, 2025
- 3.1.1. Food & Beverages Industry Ecosystem Analysis
- 3.1.2. Key Trends for Food & Beverages Industry
- 3.1.3. Regional Distribution for Food & Beverages Industry
- 3.2. Supplier Customer Data
- 3.3. Technology Roadmap and Developments
- 3.4. Trade Analysis
- 3.4.1. Import & Export Analysis, 2025
- 3.4.2. Top Importing Countries
- 3.4.3. Top Exporting Countries
- 3.5. Trump Tariff Impact Analysis
- 3.5.1. Manufacturer
- 3.5.1.1. Based on the component & Raw material
- 3.5.2. Supply Chain
- 3.5.3. End Consumer
- 3.5.1. Manufacturer
- 3.6. Raw Material Analysis
- 3.1. Global Food Phosphate Industry Overview, 2025
- 4. Market Overview
- 4.1. Market Dynamics
- 4.1.1. Drivers
- 4.1.1.1. Rising demand for processed and convenience foods.
- 4.1.1.2. Increasing use of phosphates as food additives for preservation and texture enhancement
- 4.1.1.3. Growing meat and dairy consumption globally.
- 4.1.2. Restraints
- 4.1.2.1. Health concerns related to excessive phosphate intake.
- 4.1.2.2. Stringent regulatory standards on phosphate usage in foods.
- 4.1.1. Drivers
- 4.2. Key Trend Analysis
- 4.3. Regulatory Framework
- 4.3.1. Key Regulations, Norms, and Subsidies, by Key Countries
- 4.3.2. Tariffs and Standards
- 4.3.3. Impact Analysis of Regulations on the Market
- 4.4. Value Chain Analysis
- 4.4.1. Raw Material Suppliers
- 4.4.2. Food Phosphate Manufacturers
- 4.4.3. Distributors/ Suppliers
- 4.4.4. End-users/ Customers
- 4.5. Porter’s Five Forces Analysis
- 4.6. PESTEL Analysis
- 4.7. Global Food Phosphate Market Demand
- 4.7.1. Historical Market Size - in Volume (MMT) and Value (US$ Bn), 2020-2024
- 4.7.2. Current and Future Market Size - in Volume (MMT) and Value (US$ Bn), 2025–2035
- 4.7.2.1. Y-o-Y Growth Trends
- 4.7.2.2. Absolute $ Opportunity Assessment
- 4.1. Market Dynamics
- 5. Competition Landscape
- 5.1. Competition structure
- 5.1.1. Fragmented v/s consolidated
- 5.2. Company Share Analysis, 2025
- 5.2.1. Global Company Market Share
- 5.2.2. By Region
- 5.2.2.1. North America
- 5.2.2.2. Europe
- 5.2.2.3. Asia Pacific
- 5.2.2.4. Middle East
- 5.2.2.5. Africa
- 5.2.2.6. South America
- 5.3. Product Comparison Matrix
- 5.3.1. Specifications
- 5.3.2. Market Positioning
- 5.3.3. Pricing
- 5.1. Competition structure
- 6. Global Food Phosphate Market Analysis, by Product Type
- 6.1. Key Segment Analysis
- 6.2. Food Phosphate Market Size (Volume - MMT and Value - US$ Bn), Analysis, and Forecasts, by Product Type, 2021-2035
- 6.2.1. Orthophosphates
- 6.2.1.1. Monosodium Phosphate (MSP)
- 6.2.1.2. Disodium Phosphate (DSP)
- 6.2.1.3. Trisodium Phosphate (TSP)
- 6.2.1.4. Monocalcium Phosphate (MCP)
- 6.2.1.5. Dicalcium Phosphate (DCP)
- 6.2.1.6. Tricalcium Phosphate (TCP)
- 6.2.1.7. Monopotassium Phosphate
- 6.2.1.8. Dipotassium Phosphate
- 6.2.1.9. Tripotassium Phosphate
- 6.2.1.10. Others
- 6.2.2. Polyphosphates
- 6.2.2.1. Sodium Tripolyphosphate (STPP)
- 6.2.2.2. Sodium Hexametaphosphate (SHMP)
- 6.2.2.3. Tetrasodium Pyrophosphate (TSPP)
- 6.2.2.4. Tetrapotassium Pyrophosphate (TKPP)
- 6.2.2.5. Others
- 6.2.3. Blended Phosphates
- 6.2.3.1. Customized Phosphate Blends
- 6.2.3.2. Functional Phosphate Mixtures
- 6.2.1. Orthophosphates
- 7. Global Food Phosphate Market Analysis, by Form
- 7.1. Key Segment Analysis
- 7.2. Food Phosphate Market Size (Volume - MMT and Value - US$ Bn), Analysis, and Forecasts, by Form, 2021-2035
- 7.2.1. Powder
- 7.2.2. Liquid
- 7.2.3. Granular
- 7.2.4. Crystalline
- 8. Global Food Phosphate Market Analysis and Forecasts, by Function
- 8.1. Key Findings
- 8.2. Food Phosphate Market Size (Volume - MMT and Value - US$ Bn), Analysis, and Forecasts, by Function, 2021-2035
- 8.2.1. Buffering Agents
- 8.2.2. Emulsifiers
- 8.2.3. Stabilizers
- 8.2.4. Leavening Agents
- 8.2.5. Acidity Regulators
- 8.2.6. Moisture Retention Agents
- 8.2.7. Texture Modifiers
- 8.2.8. Anti-caking Agents
- 8.2.9. Nutrient Supplements
- 9. Global Food Phosphate Market Analysis and Forecasts, by Application
- 9.1. Key Findings
- 9.2. Food Phosphate Market Size (Volume - MMT and Value - US$ Bn), Analysis, and Forecasts, by Application, 2021-2035
- 9.2.1. Meat & Poultry Processing
- 9.2.2. Seafood Processing
- 9.2.3. Bakery & Confectionery
- 9.2.4. Dairy Products
- 9.2.5. Beverages
- 9.2.6. Processed Foods
- 9.2.7. Nutritional Supplements
- 9.2.8. Desserts & Ice Cream
- 9.2.9. Sauces & Dressings
- 9.2.10. Pet Food
- 9.2.11. Others
- 10. Global Food Phosphate Market Analysis and Forecasts, by Source
- 10.1. Key Findings
- 10.2. Food Phosphate Market Size (Volume - MMT and Value - US$ Bn), Analysis, and Forecasts, by Source, 2021-2035
- 10.2.1. Synthetic
- 10.2.2. Natural/Organic
- 11. Global Food Phosphate Market Analysis and Forecasts, by Grade
- 11.1. Key Findings
- 11.2. Food Phosphate Market Size (Volume - MMT and Value - US$ Bn), Analysis, and Forecasts, by Grade, 2021-2035
- 11.2.1. Food Grade
- 11.2.2. Feed Grade
- 11.2.3. Technical Grade
- 12. Global Food Phosphate Market Analysis and Forecasts, by Packaging Type
- 12.1. Key Findings
- 12.2. Food Phosphate Market Size (Volume - MMT and Value - US$ Bn), Analysis, and Forecasts, by Packaging Type, 2021-2035
- 12.2.1. Bags (25 kg, 50 kg)
- 12.2.2. Drums
- 12.2.3. Bulk Packaging
- 12.2.4. Small Retail Packs
- 13. Global Food Phosphate Market Analysis and Forecasts, by Distribution Channel
- 13.1. Key Findings
- 13.2. Food Phosphate Market Size (Volume - MMT and Value - US$ Bn), Analysis, and Forecasts, by Distribution Channel, 2021-2035
- 13.2.1. Direct Sales
- 13.2.2. Distributors
- 13.2.3. Online Retail
- 13.2.4. Specialty Stores
- 14. Global Food Phosphate Market Analysis and Forecasts, by Price Range
- 14.1. Key Findings
- 14.2. Food Phosphate Market Size (Volume - MMT and Value - US$ Bn), Analysis, and Forecasts, by Price Range, 2021-2035
- 14.2.1. Premium
- 14.2.2. Mid-Range
- 14.2.3. Economy
- 15. Global Food Phosphate Market Analysis and Forecasts, by Purity Level
- 15.1. Key Findings
- 15.2. Food Phosphate Market Size (Volume - MMT and Value - US$ Bn), Analysis, and Forecasts, by Purity Level, 2021-2035
- 15.2.1. 98% Purity
- 15.2.2. 95-98% Purity
- 15.2.3. <95% Purity
- 16. Global Food Phosphate Market Analysis and Forecasts, by Region
- 16.1. Key Findings
- 16.2. Food Phosphate Market Size (Volume - MMT and Value - US$ Bn), Analysis, and Forecasts, by Region, 2021-2035
- 16.2.1. North America
- 16.2.2. Europe
- 16.2.3. Asia Pacific
- 16.2.4. Middle East
- 16.2.5. Africa
- 16.2.6. South America
- 17. North America Food Phosphate Market Analysis
- 17.1. Key Segment Analysis
- 17.2. Regional Snapshot
- 17.3. North America Food Phosphate Market Size Volume - MMT and Value - US$ Bn), Analysis, and Forecasts, 2021-2035
- 17.3.1. Product Type
- 17.3.2. Form
- 17.3.3. Function
- 17.3.4. Application
- 17.3.5. Source
- 17.3.6. Grade
- 17.3.7. Packaging Type
- 17.3.8. Distribution Channel
- 17.3.9. Price Range
- 17.3.10. Purity Level
- 17.3.11. Country
- 17.3.11.1. USA
- 17.3.11.2. Canada
- 17.3.11.3. Mexico
- 17.4. USA Food Phosphate Market
- 17.4.1. Country Segmental Analysis
- 17.4.2. Product Type
- 17.4.3. Form
- 17.4.4. Function
- 17.4.5. Application
- 17.4.6. Source
- 17.4.7. Grade
- 17.4.8. Packaging Type
- 17.4.9. Distribution Channel
- 17.4.10. Price Range
- 17.4.11. Purity Level
- 17.5. Canada Food Phosphate Market
- 17.5.1. Country Segmental Analysis
- 17.5.2. Product Type
- 17.5.3. Form
- 17.5.4. Function
- 17.5.5. Application
- 17.5.6. Source
- 17.5.7. Grade
- 17.5.8. Packaging Type
- 17.5.9. Distribution Channel
- 17.5.10. Price Range
- 17.5.11. Purity Level
- 17.6. Mexico Food Phosphate Market
- 17.6.1. Country Segmental Analysis
- 17.6.2. Product Type
- 17.6.3. Form
- 17.6.4. Function
- 17.6.5. Application
- 17.6.6. Source
- 17.6.7. Grade
- 17.6.8. Packaging Type
- 17.6.9. Distribution Channel
- 17.6.10. Price Range
- 17.6.11. Purity Level
- 18. Europe Food Phosphate Market Analysis
- 18.1. Key Segment Analysis
- 18.2. Regional Snapshot
- 18.3. Europe Food Phosphate Market Size (Volume - MMT and Value - US$ Bn), Analysis, and Forecasts, 2021-2035
- 18.3.1. Product Type
- 18.3.2. Form
- 18.3.3. Function
- 18.3.4. Application
- 18.3.5. Source
- 18.3.6. Grade
- 18.3.7. Packaging Type
- 18.3.8. Distribution Channel
- 18.3.9. Price Range
- 18.3.10. Purity Level
- 18.3.11. Country
- 18.3.11.1. Germany
- 18.3.11.2. United Kingdom
- 18.3.11.3. France
- 18.3.11.4. Italy
- 18.3.11.5. Spain
- 18.3.11.6. Netherlands
- 18.3.11.7. Nordic Countries
- 18.3.11.8. Poland
- 18.3.11.9. Russia & CIS
- 18.3.11.10. Rest of Europe
- 18.4. Germany Food Phosphate Market
- 18.4.1. Country Segmental Analysis
- 18.4.2. Product Type
- 18.4.3. Form
- 18.4.4. Function
- 18.4.5. Application
- 18.4.6. Source
- 18.4.7. Grade
- 18.4.8. Packaging Type
- 18.4.9. Distribution Channel
- 18.4.10. Price Range
- 18.4.11. Purity Level
- 18.5. United Kingdom Food Phosphate Market
- 18.5.1. Country Segmental Analysis
- 18.5.2. Product Type
- 18.5.3. Form
- 18.5.4. Function
- 18.5.5. Application
- 18.5.6. Source
- 18.5.7. Grade
- 18.5.8. Packaging Type
- 18.5.9. Distribution Channel
- 18.5.10. Price Range
- 18.5.11. Purity Level
- 18.6. France Food Phosphate Market
- 18.6.1. Country Segmental Analysis
- 18.6.2. Product Type
- 18.6.3. Form
- 18.6.4. Function
- 18.6.5. Application
- 18.6.6. Source
- 18.6.7. Grade
- 18.6.8. Packaging Type
- 18.6.9. Distribution Channel
- 18.6.10. Price Range
- 18.6.11. Purity Level
- 18.7. Italy Food Phosphate Market
- 18.7.1. Country Segmental Analysis
- 18.7.2. Product Type
- 18.7.3. Form
- 18.7.4. Function
- 18.7.5. Application
- 18.7.6. Source
- 18.7.7. Grade
- 18.7.8. Packaging Type
- 18.7.9. Distribution Channel
- 18.7.10. Price Range
- 18.7.11. Purity Level
- 18.8. Spain Food Phosphate Market
- 18.8.1. Country Segmental Analysis
- 18.8.2. Product Type
- 18.8.3. Form
- 18.8.4. Function
- 18.8.5. Application
- 18.8.6. Source
- 18.8.7. Grade
- 18.8.8. Packaging Type
- 18.8.9. Distribution Channel
- 18.8.10. Price Range
- 18.8.11. Purity Level
- 18.9. Netherlands Food Phosphate Market
- 18.9.1. Country Segmental Analysis
- 18.9.2. Product Type
- 18.9.3. Form
- 18.9.4. Function
- 18.9.5. Application
- 18.9.6. Source
- 18.9.7. Grade
- 18.9.8. Packaging Type
- 18.9.9. Distribution Channel
- 18.9.10. Price Range
- 18.9.11. Purity Level
- 18.10. Nordic Countries Food Phosphate Market
- 18.10.1. Country Segmental Analysis
- 18.10.2. Product Type
- 18.10.3. Form
- 18.10.4. Function
- 18.10.5. Application
- 18.10.6. Source
- 18.10.7. Grade
- 18.10.8. Packaging Type
- 18.10.9. Distribution Channel
- 18.10.10. Price Range
- 18.10.11. Purity Level
- 18.11. Poland Food Phosphate Market
- 18.11.1. Country Segmental Analysis
- 18.11.2. Product Type
- 18.11.3. Form
- 18.11.4. Function
- 18.11.5. Application
- 18.11.6. Source
- 18.11.7. Grade
- 18.11.8. Packaging Type
- 18.11.9. Distribution Channel
- 18.11.10. Price Range
- 18.11.11. Purity Level
- 18.12. Russia & CIS Food Phosphate Market
- 18.12.1. Country Segmental Analysis
- 18.12.2. Product Type
- 18.12.3. Form
- 18.12.4. Function
- 18.12.5. Application
- 18.12.6. Source
- 18.12.7. Grade
- 18.12.8. Packaging Type
- 18.12.9. Distribution Channel
- 18.12.10. Price Range
- 18.12.11. Purity Level
- 18.13. Rest of Europe Food Phosphate Market
- 18.13.1. Country Segmental Analysis
- 18.13.2. Product Type
- 18.13.3. Form
- 18.13.4. Function
- 18.13.5. Application
- 18.13.6. Source
- 18.13.7. Grade
- 18.13.8. Packaging Type
- 18.13.9. Distribution Channel
- 18.13.10. Price Range
- 18.13.11. Purity Level
- 19. Asia Pacific Food Phosphate Market Analysis
- 19.1. Key Segment Analysis
- 19.2. Regional Snapshot
- 19.3. East Asia Food Phosphate Market Size (Volume - MMT and Value - US$ Bn), Analysis, and Forecasts, 2021-2035
- 19.3.1. Product Type
- 19.3.2. Form
- 19.3.3. Function
- 19.3.4. Application
- 19.3.5. Source
- 19.3.6. Grade
- 19.3.7. Packaging Type
- 19.3.8. Distribution Channel
- 19.3.9. Price Range
- 19.3.10. Purity Level
- 19.3.11. Country
- 19.3.11.1. China
- 19.3.11.2. India
- 19.3.11.3. Japan
- 19.3.11.4. South Korea
- 19.3.11.5. Australia and New Zealand
- 19.3.11.6. Indonesia
- 19.3.11.7. Malaysia
- 19.3.11.8. Thailand
- 19.3.11.9. Vietnam
- 19.3.11.10. Rest of Asia Pacific
- 19.4. China Food Phosphate Market
- 19.4.1. Country Segmental Analysis
- 19.4.2. Product Type
- 19.4.3. Form
- 19.4.4. Function
- 19.4.5. Application
- 19.4.6. Source
- 19.4.7. Grade
- 19.4.8. Packaging Type
- 19.4.9. Distribution Channel
- 19.4.10. Price Range
- 19.4.11. Purity Level
- 19.5. India Food Phosphate Market
- 19.5.1. Country Segmental Analysis
- 19.5.2. Product Type
- 19.5.3. Form
- 19.5.4. Function
- 19.5.5. Application
- 19.5.6. Source
- 19.5.7. Grade
- 19.5.8. Packaging Type
- 19.5.9. Distribution Channel
- 19.5.10. Price Range
- 19.5.11. Purity Level
- 19.6. Japan Food Phosphate Market
- 19.6.1. Country Segmental Analysis
- 19.6.2. Product Type
- 19.6.3. Form
- 19.6.4. Function
- 19.6.5. Application
- 19.6.6. Source
- 19.6.7. Grade
- 19.6.8. Packaging Type
- 19.6.9. Distribution Channel
- 19.6.10. Price Range
- 19.6.11. Purity Level
- 19.7. South Korea Food Phosphate Market
- 19.7.1. Country Segmental Analysis
- 19.7.2. Product Type
- 19.7.3. Form
- 19.7.4. Function
- 19.7.5. Application
- 19.7.6. Source
- 19.7.7. Grade
- 19.7.8. Packaging Type
- 19.7.9. Distribution Channel
- 19.7.10. Price Range
- 19.7.11. Purity Level
- 19.8. Australia and New Zealand Food Phosphate Market
- 19.8.1. Country Segmental Analysis
- 19.8.2. Product Type
- 19.8.3. Form
- 19.8.4. Function
- 19.8.5. Application
- 19.8.6. Source
- 19.8.7. Grade
- 19.8.8. Packaging Type
- 19.8.9. Distribution Channel
- 19.8.10. Price Range
- 19.8.11. Purity Level
- 19.9. Indonesia Food Phosphate Market
- 19.9.1. Country Segmental Analysis
- 19.9.2. Product Type
- 19.9.3. Form
- 19.9.4. Function
- 19.9.5. Application
- 19.9.6. Source
- 19.9.7. Grade
- 19.9.8. Packaging Type
- 19.9.9. Distribution Channel
- 19.9.10. Price Range
- 19.9.11. Purity Level
- 19.10. Malaysia Food Phosphate Market
- 19.10.1. Country Segmental Analysis
- 19.10.2. Product Type
- 19.10.3. Form
- 19.10.4. Function
- 19.10.5. Application
- 19.10.6. Source
- 19.10.7. Grade
- 19.10.8. Packaging Type
- 19.10.9. Distribution Channel
- 19.10.10. Price Range
- 19.10.11. Purity Level
- 19.11. Thailand Food Phosphate Market
- 19.11.1. Country Segmental Analysis
- 19.11.2. Product Type
- 19.11.3. Form
- 19.11.4. Function
- 19.11.5. Application
- 19.11.6. Source
- 19.11.7. Grade
- 19.11.8. Packaging Type
- 19.11.9. Distribution Channel
- 19.11.10. Price Range
- 19.11.11. Purity Level
- 19.12. Vietnam Food Phosphate Market
- 19.12.1. Country Segmental Analysis
- 19.12.2. Product Type
- 19.12.3. Form
- 19.12.4. Function
- 19.12.5. Application
- 19.12.6. Source
- 19.12.7. Grade
- 19.12.8. Packaging Type
- 19.12.9. Distribution Channel
- 19.12.10. Price Range
- 19.12.11. Purity Level
- 19.13. Rest of Asia Pacific Food Phosphate Market
- 19.13.1. Country Segmental Analysis
- 19.13.2. Product Type
- 19.13.3. Form
- 19.13.4. Function
- 19.13.5. Application
- 19.13.6. Source
- 19.13.7. Grade
- 19.13.8. Packaging Type
- 19.13.9. Distribution Channel
- 19.13.10. Price Range
- 19.13.11. Purity Level
- 20. Middle East Food Phosphate Market Analysis
- 20.1. Key Segment Analysis
- 20.2. Regional Snapshot
- 20.3. Middle East Food Phosphate Market Size (Volume - MMT and Value - US$ Bn), Analysis, and Forecasts, 2021-2035
- 20.3.1. Product Type
- 20.3.2. Form
- 20.3.3. Function
- 20.3.4. Application
- 20.3.5. Source
- 20.3.6. Grade
- 20.3.7. Packaging Type
- 20.3.8. Distribution Channel
- 20.3.9. Price Range
- 20.3.10. Purity Level
- 20.3.11. Country
- 20.3.11.1. Turkey
- 20.3.11.2. UAE
- 20.3.11.3. Saudi Arabia
- 20.3.11.4. Israel
- 20.3.11.5. Rest of Middle East
- 20.4. Turkey Food Phosphate Market
- 20.4.1. Country Segmental Analysis
- 20.4.2. Product Type
- 20.4.3. Form
- 20.4.4. Function
- 20.4.5. Application
- 20.4.6. Source
- 20.4.7. Grade
- 20.4.8. Packaging Type
- 20.4.9. Distribution Channel
- 20.4.10. Price Range
- 20.4.11. Purity Level
- 20.5. UAE Food Phosphate Market
- 20.5.1. Country Segmental Analysis
- 20.5.2. Product Type
- 20.5.3. Form
- 20.5.4. Function
- 20.5.5. Application
- 20.5.6. Source
- 20.5.7. Grade
- 20.5.8. Packaging Type
- 20.5.9. Distribution Channel
- 20.5.10. Price Range
- 20.5.11. Purity Level
- 20.6. Saudi Arabia Food Phosphate Market
- 20.6.1. Country Segmental Analysis
- 20.6.2. Product Type
- 20.6.3. Form
- 20.6.4. Function
- 20.6.5. Application
- 20.6.6. Source
- 20.6.7. Grade
- 20.6.8. Packaging Type
- 20.6.9. Distribution Channel
- 20.6.10. Price Range
- 20.6.11. Purity Level
- 20.7. Israel Food Phosphate Market
- 20.7.1. Country Segmental Analysis
- 20.7.2. Product Type
- 20.7.3. Form
- 20.7.4. Function
- 20.7.5. Application
- 20.7.6. Source
- 20.7.7. Grade
- 20.7.8. Packaging Type
- 20.7.9. Distribution Channel
- 20.7.10. Price Range
- 20.7.11. Purity Level
- 20.8. Rest of Middle East Food Phosphate Market
- 20.8.1. Country Segmental Analysis
- 20.8.2. Product Type
- 20.8.3. Form
- 20.8.4. Function
- 20.8.5. Application
- 20.8.6. Source
- 20.8.7. Grade
- 20.8.8. Packaging Type
- 20.8.9. Distribution Channel
- 20.8.10. Price Range
- 20.8.11. Purity Level
- 21. Africa Food Phosphate Market Analysis
- 21.1. Key Segment Analysis
- 21.2. Regional Snapshot
- 21.3. Africa Food Phosphate Market Size (Volume - MMT and Value - US$ Bn), Analysis, and Forecasts, 2021-2035
- 21.3.1. Product Type
- 21.3.2. Form
- 21.3.3. Function
- 21.3.4. Application
- 21.3.5. Source
- 21.3.6. Grade
- 21.3.7. Packaging Type
- 21.3.8. Distribution Channel
- 21.3.9. Price Range
- 21.3.10. Purity Level
- 21.3.11. Country
- 21.3.11.1. South Africa
- 21.3.11.2. Egypt
- 21.3.11.3. Nigeria
- 21.3.11.4. Algeria
- 21.3.11.5. Rest of Africa
- 21.4. South Africa Food Phosphate Market
- 21.4.1. Country Segmental Analysis
- 21.4.2. Product Type
- 21.4.3. Form
- 21.4.4. Function
- 21.4.5. Application
- 21.4.6. Source
- 21.4.7. Grade
- 21.4.8. Packaging Type
- 21.4.9. Distribution Channel
- 21.4.10. Price Range
- 21.4.11. Purity Level
- 21.5. Egypt Food Phosphate Market
- 21.5.1. Country Segmental Analysis
- 21.5.2. Product Type
- 21.5.3. Form
- 21.5.4. Function
- 21.5.5. Application
- 21.5.6. Source
- 21.5.7. Grade
- 21.5.8. Packaging Type
- 21.5.9. Distribution Channel
- 21.5.10. Price Range
- 21.5.11. Purity Level
- 21.6. Nigeria Food Phosphate Market
- 21.6.1. Country Segmental Analysis
- 21.6.2. Product Type
- 21.6.3. Form
- 21.6.4. Function
- 21.6.5. Application
- 21.6.6. Source
- 21.6.7. Grade
- 21.6.8. Packaging Type
- 21.6.9. Distribution Channel
- 21.6.10. Price Range
- 21.6.11. Purity Level
- 21.7. Algeria Food Phosphate Market
- 21.7.1. Country Segmental Analysis
- 21.7.2. Product Type
- 21.7.3. Form
- 21.7.4. Function
- 21.7.5. Application
- 21.7.6. Source
- 21.7.7. Grade
- 21.7.8. Packaging Type
- 21.7.9. Distribution Channel
- 21.7.10. Price Range
- 21.7.11. Purity Level
- 21.8. Rest of Africa Food Phosphate Market
- 21.8.1. Country Segmental Analysis
- 21.8.2. Product Type
- 21.8.3. Form
- 21.8.4. Function
- 21.8.5. Application
- 21.8.6. Source
- 21.8.7. Grade
- 21.8.8. Packaging Type
- 21.8.9. Distribution Channel
- 21.8.10. Price Range
- 21.8.11. Purity Level
- 22. South America Food Phosphate Market Analysis
- 22.1. Key Segment Analysis
- 22.2. Regional Snapshot
- 22.3. Central and South Africa Food Phosphate Market Size (Volume - MMT and Value - US$ Bn), Analysis, and Forecasts, 2021-2035
- 22.3.1. Product Type
- 22.3.2. Form
- 22.3.3. Function
- 22.3.4. Application
- 22.3.5. Source
- 22.3.6. Grade
- 22.3.7. Packaging Type
- 22.3.8. Distribution Channel
- 22.3.9. Price Range
- 22.3.10. Purity Level
- 22.3.11. Country
- 22.3.11.1. Brazil
- 22.3.11.2. Argentina
- 22.3.11.3. Rest of South America
- 22.4. Brazil Food Phosphate Market
- 22.4.1. Country Segmental Analysis
- 22.4.2. Product Type
- 22.4.3. Form
- 22.4.4. Function
- 22.4.5. Application
- 22.4.6. Source
- 22.4.7. Grade
- 22.4.8. Packaging Type
- 22.4.9. Distribution Channel
- 22.4.10. Price Range
- 22.4.11. Purity Level
- 22.5. Argentina Food Phosphate Market
- 22.5.1. Country Segmental Analysis
- 22.5.2. Product Type
- 22.5.3. Form
- 22.5.4. Function
- 22.5.5. Application
- 22.5.6. Source
- 22.5.7. Grade
- 22.5.8. Packaging Type
- 22.5.9. Distribution Channel
- 22.5.10. Price Range
- 22.5.11. Purity Level
- 22.6. Rest of South America Food Phosphate Market
- 22.6.1. Country Segmental Analysis
- 22.6.2. Product Type
- 22.6.3. Form
- 22.6.4. Function
- 22.6.5. Application
- 22.6.6. Source
- 22.6.7. Grade
- 22.6.8. Packaging Type
- 22.6.9. Distribution Channel
- 22.6.10. Price Range
- 22.6.11. Purity Level
- 23. Key Players/ Company Profile
- 23.1. Aditya Birla Chemicals
- 23.1.1. Company Details/ Overview
- 23.1.2. Company Financials
- 23.1.3. Key Customers and Competitors
- 23.1.4. Business/ Industry Portfolio
- 23.1.5. Product Portfolio/ Specification Details
- 23.1.6. Pricing Data
- 23.1.7. Strategic Overview
- 23.1.8. Recent Developments
- 23.2. Budenheim
- 23.3. Cargill Incorporated
- 23.4. Chengdu Chuanhong Phosphorus Chemical
- 23.5. Chengxing Industrial Group
- 23.6. Fosfa A.S.
- 23.7. Guizhou Qianneng Tianhe Phosphorus
- 23.8. Haifa Group
- 23.9. Hindustan Phosphates
- 23.10. Hubei Xingfa Chemicals Group
- 23.11. ICL Group
- 23.12. Innophos Holdings
- 23.13. Mexichem (Orbia)
- 23.14. Mosaic Company
- 23.15. Prayon Group
- 23.16. Sigma-Aldrich
- 23.17. Suqian Modern Chemical
- 23.18. TKI Hrastnik
- 23.19. Wengfu Group
- 23.20. Yunnan Phosphate Group
- 23.21. Yuntianhua Group
- 23.22. Other Key Players
- 23.1. Aditya Birla Chemicals
Note* - This is just tentative list of players. While providing the report, we will cover more number of players based on their revenue and share for each geography
Research Design
Our research design integrates both demand-side and supply-side analysis through a balanced combination of primary and secondary research methodologies. By utilizing both bottom-up and top-down approaches alongside rigorous data triangulation methods, we deliver robust market intelligence that supports strategic decision-making.
MarketGenics' comprehensive research design framework ensures the delivery of accurate, reliable, and actionable market intelligence. Through the integration of multiple research approaches, rigorous validation processes, and expert analysis, we provide our clients with the insights needed to make informed strategic decisions and capitalize on market opportunities.

MarketGenics leverages a dedicated industry panel of experts and a comprehensive suite of paid databases to effectively collect, consolidate, and analyze market intelligence.
Our approach has consistently proven to be reliable and effective in generating accurate market insights, identifying key industry trends, and uncovering emerging business opportunities.
Through both primary and secondary research, we capture and analyze critical company-level data such as manufacturing footprints, including technical centers, R&D facilities, sales offices, and headquarters.
Our expert panel further enhances our ability to estimate market size for specific brands based on validated field-level intelligence.
Our data mining techniques incorporate both parametric and non-parametric methods, allowing for structured data collection, sorting, processing, and cleaning.
Demand projections are derived from large-scale data sets analyzed through proprietary algorithms, culminating in robust and reliable market sizing.
Research Approach
The bottom-up approach builds market estimates by starting with the smallest addressable market units and systematically aggregating them to create comprehensive market size projections.
This method begins with specific, granular data points and builds upward to create the complete market landscape.
Customer Analysis → Segmental Analysis → Geographical Analysis
The top-down approach starts with the broadest possible market data and systematically narrows it down through a series of filters and assumptions to arrive at specific market segments or opportunities.
This method begins with the big picture and works downward to increasingly specific market slices.
TAM → SAM → SOM


Research Methods
Desk / Secondary Research
While analysing the market, we extensively study secondary sources, directories, and databases to identify and collect information useful for this technical, market-oriented, and commercial report. Secondary sources that we utilize are not only the public sources, but it is a combination of Open Source, Associations, Paid Databases, MG Repository & Knowledgebase, and others.
- Company websites, annual reports, financial reports, broker reports, and investor presentations
- National government documents, statistical databases and reports
- News articles, press releases and web-casts specific to the companies operating in the market, Magazines, reports, and others
- We gather information from commercial data sources for deriving company specific data such as segmental revenue, share for geography, product revenue, and others
- Internal and external proprietary databases (industry-specific), relevant patent, and regulatory databases
- Governing Bodies, Government Organizations
- Relevant Authorities, Country-specific Associations for Industries
We also employ the model mapping approach to estimate the product level market data through the players' product portfolio
Primary Research
Primary research/ interviews is vital in analyzing the market. Most of the cases involves paid primary interviews. Primary sources include primary interviews through e-mail interactions, telephonic interviews, surveys as well as face-to-face interviews with the different stakeholders across the value chain including several industry experts.
| Type of Respondents | Number of Primaries |
|---|---|
| Tier 2/3 Suppliers | ~20 |
| Tier 1 Suppliers | ~25 |
| End-users | ~25 |
| Industry Expert/ Panel/ Consultant | ~30 |
| Total | ~100 |
MG Knowledgebase
• Repository of industry blog, newsletter and case studies
• Online platform covering detailed market reports, and company profiles
Forecasting Factors and Models
Forecasting Factors
- Historical Trends – Past market patterns, cycles, and major events that shaped how markets behave over time. Understanding past trends helps predict future behavior.
- Industry Factors – Specific characteristics of the industry like structure, regulations, and innovation cycles that affect market dynamics.
- Macroeconomic Factors – Economic conditions like GDP growth, inflation, and employment rates that affect how much money people have to spend.
- Demographic Factors – Population characteristics like age, income, and location that determine who can buy your product.
- Technology Factors – How quickly people adopt new technology and how much technology infrastructure exists.
- Regulatory Factors – Government rules, laws, and policies that can help or restrict market growth.
- Competitive Factors – Analyzing competition structure such as degree of competition and bargaining power of buyers and suppliers.
Forecasting Models / Techniques
Multiple Regression Analysis
- Identify and quantify factors that drive market changes
- Statistical modeling to establish relationships between market drivers and outcomes
Time Series Analysis – Seasonal Patterns
- Understand regular cyclical patterns in market demand
- Advanced statistical techniques to separate trend, seasonal, and irregular components
Time Series Analysis – Trend Analysis
- Identify underlying market growth patterns and momentum
- Statistical analysis of historical data to project future trends
Expert Opinion – Expert Interviews
- Gather deep industry insights and contextual understanding
- In-depth interviews with key industry stakeholders
Multi-Scenario Development
- Prepare for uncertainty by modeling different possible futures
- Creating optimistic, pessimistic, and most likely scenarios
Time Series Analysis – Moving Averages
- Sophisticated forecasting for complex time series data
- Auto-regressive integrated moving average models with seasonal components
Econometric Models
- Apply economic theory to market forecasting
- Sophisticated economic models that account for market interactions
Expert Opinion – Delphi Method
- Harness collective wisdom of industry experts
- Structured, multi-round expert consultation process
Monte Carlo Simulation
- Quantify uncertainty and probability distributions
- Thousands of simulations with varying input parameters
Research Analysis
Our research framework is built upon the fundamental principle of validating market intelligence from both demand and supply perspectives. This dual-sided approach ensures comprehensive market understanding and reduces the risk of single-source bias.
Demand-Side Analysis: We understand end-user/application behavior, preferences, and market needs along with the penetration of the product for specific application.
Supply-Side Analysis: We estimate overall market revenue, analyze the segmental share along with industry capacity, competitive landscape, and market structure.
Validation & Evaluation
Data triangulation is a validation technique that uses multiple methods, sources, or perspectives to examine the same research question, thereby increasing the credibility and reliability of research findings. In market research, triangulation serves as a quality assurance mechanism that helps identify and minimize bias, validate assumptions, and ensure accuracy in market estimates.
- Data Source Triangulation – Using multiple data sources to examine the same phenomenon
- Methodological Triangulation – Using multiple research methods to study the same research question
- Investigator Triangulation – Using multiple researchers or analysts to examine the same data
- Theoretical Triangulation – Using multiple theoretical perspectives to interpret the same data

Custom Market Research Services
We will customise the research for you, in case the report listed above does not meet your requirements.
Get 10% Free Customisation