Functional Water Market Size, Share & Trends Analysis Report by Product Type (Enhanced Water, Vitamin & Nutrient Infused Water, Electrolyte/Performance Water, Alkaline Water, Flavored Functional Water, Detox/Beauty Water, Probiotic/Prebiotic Water, Oxygenated Water, Others), Source/ Ingredient Additive, Packaging Type, Consumer Group, Form, Application/ Usage, Distribution Channel, and Geography (North America, Europe, Asia Pacific, Middle East, Africa, and South America) – Global Industry Data, Trends, and Forecasts, 2026–2035
|
|
|
Segmental Data Insights |
|
|
Demand Trends |
|
|
Competitive Landscape |
|
|
Strategic Development |
|
|
Future Outlook & Opportunities |
|
Functional Water Market Size, Share, and Growth
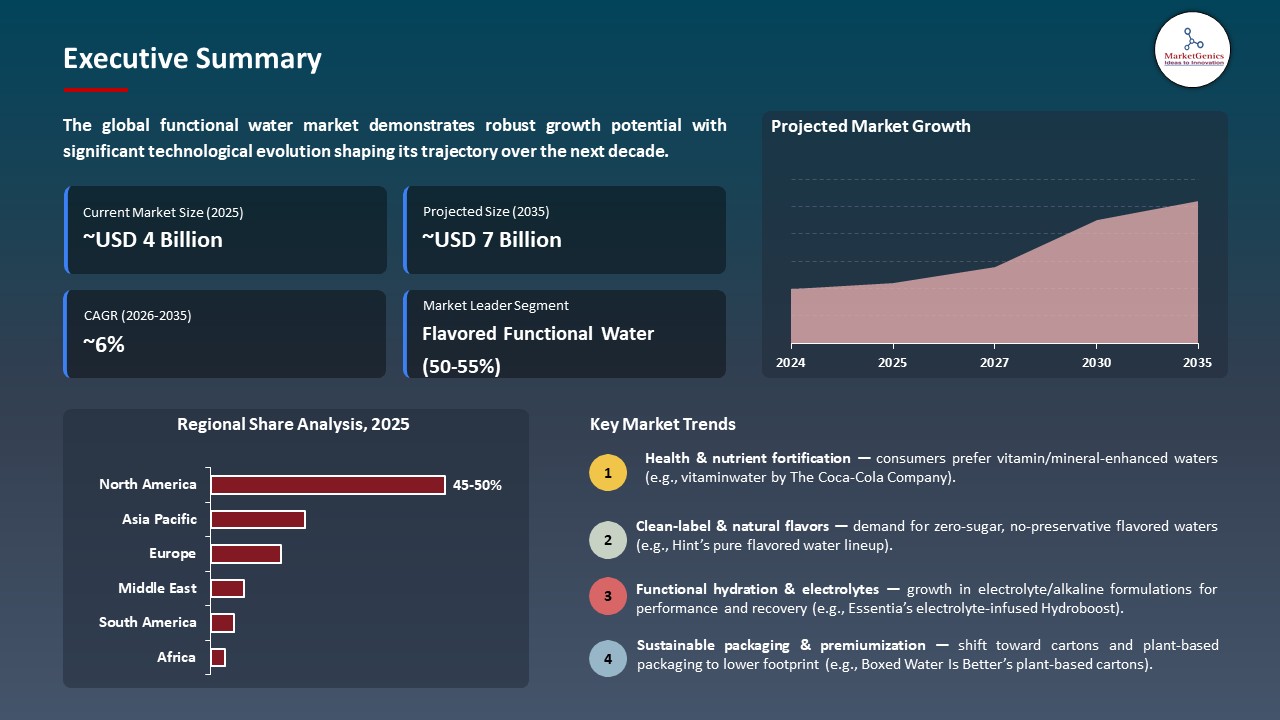
The global functional water market is exhibiting strong growth, with an estimated value of USD 3.8 billion in 2025 and USD 6.9 billion by 2035, achieving a CAGR of 6.1%, during the forecast period. The global functional water market is driven by rising health awareness, preference for sugar-free hydration, increasing fitness and sports participation, busy lifestyles, and growing interest in beverages fortified with electrolytes, vitamins, and minerals that support hydration, immunity, and overall wellness.
“Functional water is a natural extension for Powerade,” said Sabrina Niland, vice president of innovation, strategy, and chief of staff for BodyArmor Sports Nutrition. She added that the brand’s 2023 refresh in packaging and formulation helped drive seven consecutive quarters of market share growth.
The growing consumer demand towards stronger hydration product formulations with added-value health benefits is fueling the functional water market to encourage manufacturers to formulate nutrient-enriched and functional offerings of water beyond the normal offerings. For instance, in March 2024, Essentia Water introduced Essentia Hydroboost, a flavored functional water with Hydrolytes (B 2 vitamins and 400mg electrolytes), which offers better hydration and does not contain artificial additives and targets wellness-conscious, on-the-go consumers. The growth in health awareness is boosting the uptake of functional water drinks and this will increase the growth of the market and diversification of products within the global beverage portfolio.
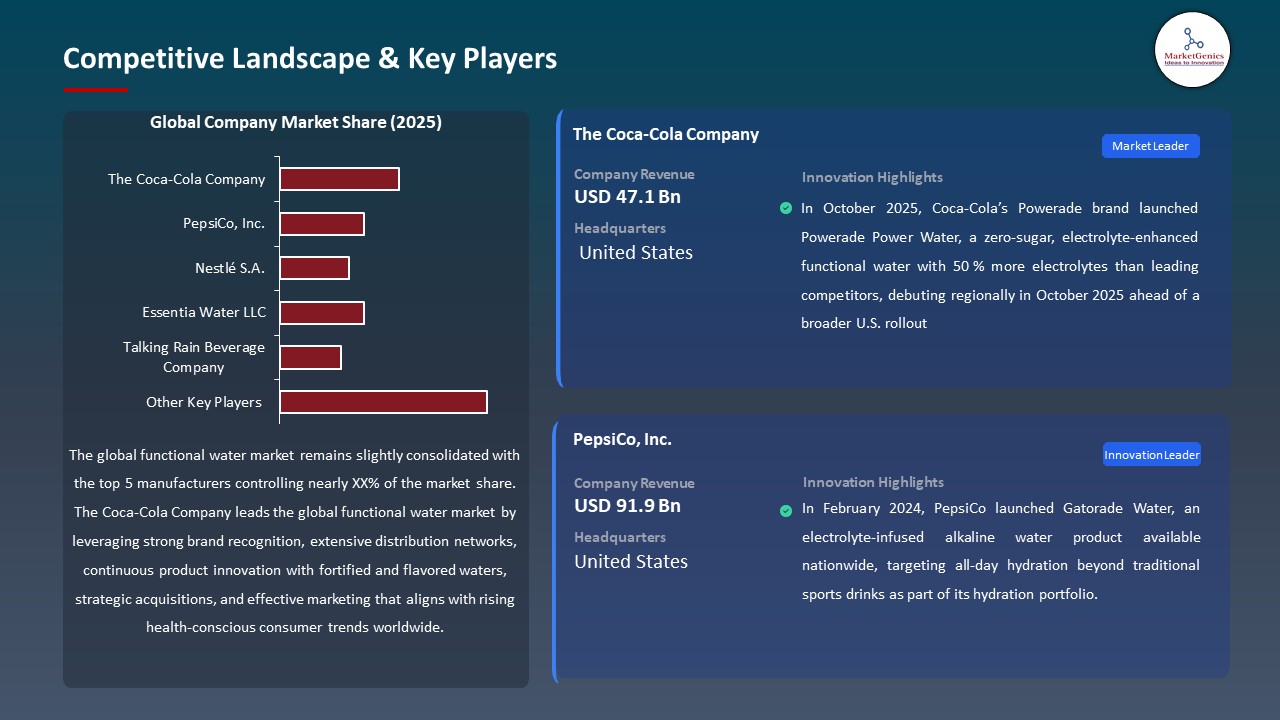
Furthermore, the functional water market is driven by the major beverage companies that have extended their core brands to the functional water segment with increased hydration products that aim at performance and health. For instance, in October 2025, The Coca-Cola Company launched the PowerAde Power Water, a zero-sugar functional water containing 50% more electrolytes than other profit-making products in a variety of flavors and promoted the product as a way to provide better hydration to active consumers as part of its continued Powerade line. Functional hydration product extensions increase consumer reach, promote category development, and provide market leadership.
Key opportunities adjacent to the global functional water market include expansion into sports and performance beverages, vitamin- and nutrient-fortified drinks, plant-based and botanical waters, ready-to-drink wellness beverages, and electrolyte-enhanced hydration solutions. These opportunities enable manufacturers to capitalize on health trends, portfolio diversification and crossover demand by health and active consumers. Adjacent market development also stimulates product development, expansion of consumer base and general functional beverage market development.
 Functional Water Market Dynamics and Trends
Driver: Expansion of Functional Electrolyte and Probiotic Water Innovations by Manufacturers
-
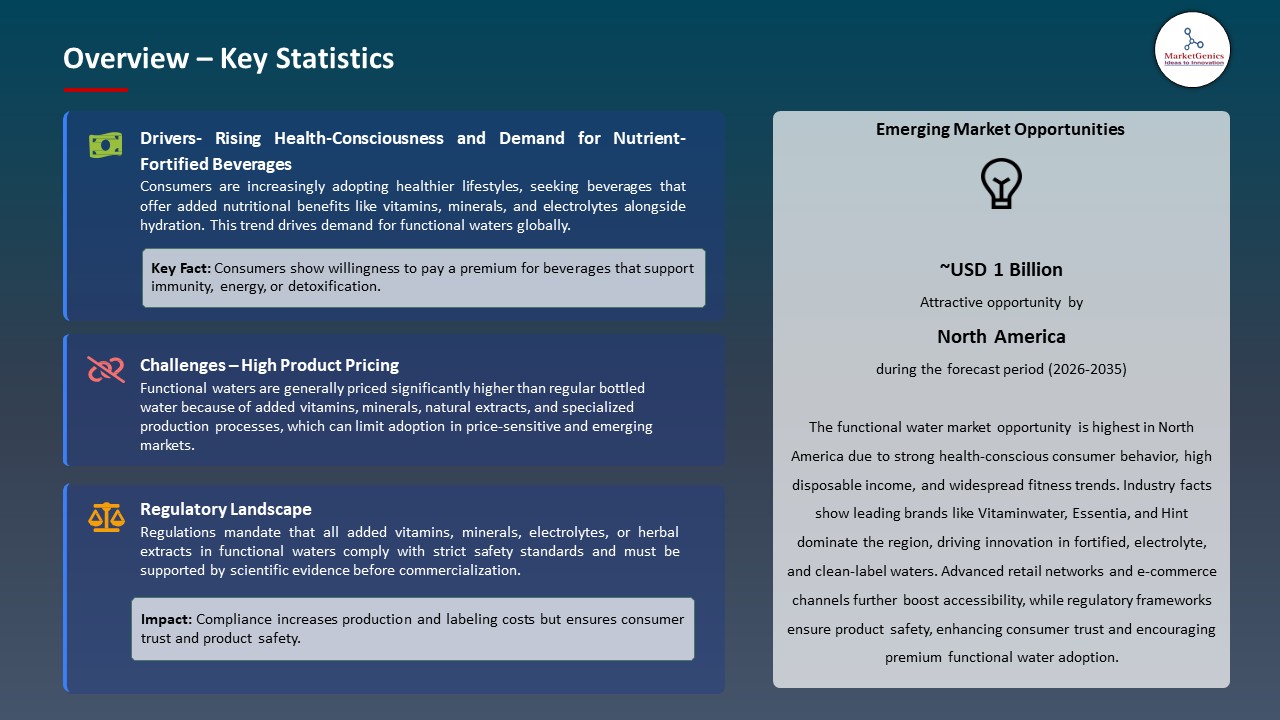
The strategic growth of functional water portfolios by manufacturers to encompass specialized hydration solutions with added health value to serve more wellness-conscious consumers is a major driver the functional water market. The increasing consumer interest in drinks with more than simple hydration, which take into consideration digestive health, immune protection, and daily nutritional needs, is indicated by this trend.
- Manufacturers are also innovating to incorporate various health functionalities in one drink. For instance, in January 2026, Karma Water launched its Pineapple Coconut Probiotic Water which was developed with 2billion CFU of BC30 probiotics and it contained a complete daily amount of six essential vitamins (A, B3, B5, B6, B12, and E). This artificial-free functional water is an integration of the digestive and immune support with an increased hydration.
- The multifunctional probiotic and vitamin-enriched waters attain the differentiation of the market, increase consumer interaction, and boost the global functional water segment growth.
Restraint: Regulatory Scrutiny on Health Claims and Labeling Limits Innovation and Marketing Freedom
-
The legal constraints on the functional water market are established by the strict regulatory supervision of health claim, ingredient disclosure, and nutritional labeling that can restrain the way the producers make, position, and market their products. Authorities in major markets like the U.S. and the EU have set stiff conditions to prove functional benefits, and strong scientific evidence is demanded before allowing the health-related claims on the packaging or marketing materials.
- These regulatory climate makes compliance expensive, slows time-to-market on new ingredients, and limits promotion which can be viewed as unverified. The manufacturers need to invest in clinical validation, quality assurance, and labeling compliance, whereas smaller companies with small resources are challenged, slowing down innovation and lowering their competitive edge.
- Regulatory scrutiny increases the cost of compliance and slows the pace of product launch which restricts market agility and responsiveness to consumer preference changes.
Opportunity: Premium Wellness Positioning Through Botanical and Adaptogen‑Infused Waters
-
Premium products enhanced with botanicals and adaptogens, like ginseng, ashwagandha, and turmeric, are a major growth opportunity in the functional water market. These products serve customers looking for holistic wellness, stress relief, cognitive support, and natural, plant-based health benefits beyond ordinary hydration.
- The incorporation of adaptogenic plant ingredients to provide superior well-being effects. For instance, in May 2025 Sekwl Beverage House introduced a series of adaptogenic sparkling water blended with organic botanicals and functional mushrooms (Lion’s Mane, Cordyceps, Turkey Tail, and Reishi) to help maintain balance, focus, immune resilience, and deal with stress.
- This trend allows functional waters to compete favorably with sports and electrolyte beverages, high-end wellness beverages, natural tonic, and botanical infusions in the mainstream and health-conscious retail outlets.
- Adaptogen-infused and botanical waters expand consumer segmentation, improve premium positioning and diversify consumption occasions, growing the functional beverage market segment.
Key Trend: Personalization and Targeted Functional Formulations Based on Lifestyle Needs
-
The shift toward highly customized and lifestyle-targeted formulations that use consumer health insights to customize functional benefits is a major trend affecting the functional water market. The products offered by brands are being formulated to have certain nutritional or functional functions like immunity support, active lifestyle hydration, cognitive attention or stress management based on the diverse health objectives of the consumer.
- Brands are also differentiating functional drinks to meet a certain lifestyle and wellness goal. For instance, Wet Hydration’s tailored functional water products, such as Glow, Boost, and future relaxation-oriented adaptogenic based formulations, are the way in which brands are designing targeted beverages to specific lifestyle and wellness goals.
- This trend reflects consumer demand for targeted, transparent functional beverages, with brands leveraging digital and direct-to-consumer channels to refine formulations, tailor recommendations, and strengthen loyalty.
- Personalization of functional water formulations drives deeper involvement with the consumer, increased usage opportunities as well as differentiating the category in a competitive market environment.
 Functional Water Market Analysis and Segmental Data
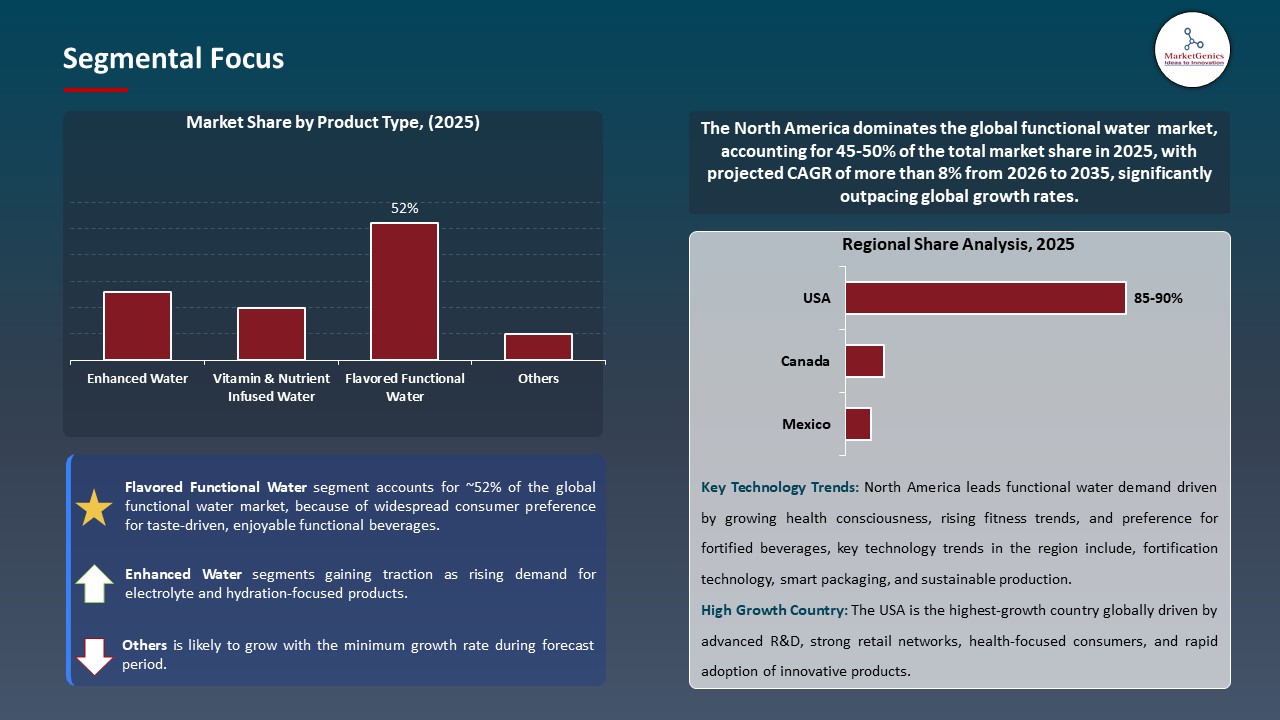
Flavored Functional Water Dominate Global Functional Water Market
-
The flavored functional water segment dominates the global functional water market, due to the preference of consumers to the hydration products with the additional benefits that consumers are seeking. Flavored versions such as fruit-forward and electrolyte-enhanced versions take up most of the consumption of functional water because of the broad appeal and the versatile positioning of the version as a healthier option to sugary drinks.
- For instance, in March 2024, Essentia Water launched Essentia Hydroboost, the first flavored functional water with 200mg of added hydration or electrolytes, and the added on-the-go flavor profiles that are health-conscious, like Lemon Lime, Peach Mango, and Raspberry Pomegranate.
- The high demand of flavored functional water enhances a faster consumer adoption, spur product innovation, and expanded market access among various demographic segments.
North America Leads Global Functional Water Market Demand
-
North America leads the functional water market is driven by consumers are increasingly purchasing beverages with added health benefits, such as electrolytes, essential vitamins, and immune system support, as people are becoming more health conscious and adopting health-oriented lifestyles. For instance, in 2025, Powerade (Coca-cola) introduced Power water, a zero-sugar, electrolyte-enhanced, functional water in four flavours to the North Americans consumers seeking performance-focused hydration.
- Moreover, the North American functional water market is propelled by the development of e-commerce and direct-to-consumer platforms, which enhance product convenience and availability, stimulating an increase in the proportion of consumers who are willing to use functional water products. For instance, in 2024, PepsiCo launched the bubly brand with bubly burst, which consists of zero-sugar flavored functional waters and comes online and in retail to satisfy consumer needs of convenient, healthy drinks.
- The increasing health-consciousness and the increased accessibility of e-commerce and direct-to-consumer promotes the increase in the adoption of functional water, the rise in market development and the leadership of the North American market in the functional water market.
Functional Water Market Ecosystem
The global functional water market is slightly consolidated, dominated by major players such as such as The Coca-Cola Company, PepsiCo, Inc., Nestlé S.A., Essentia Water LLC, and Talking Rain Beverage Company, which dominate through strong brand equity, extensive global distribution networks as well as superior formulation and packaging technologies.
These strategic participants are progressively prioritizing niche and functional solutions to spur innovation. They can be electrolyte-enhanced alkaline waters, vitamin-and mineral-enhanced hydration beverages, functional, zero-sugar, and caffeinated or immunity supporting waters. Examples of such targeted solutions include Brand vitamin water, Gatorade Water, Essentia Hydroboost and Sparkling Ice + Caffeine.
Government agencies, research institutions, and research and development organizations are also involved in the development of functional hydration technologies. As an example, in February 2024, the food science research centers of the U.S. partnered with manufacturing food drink companies to research the most efficient electrolytes absorption and clean-label fortification, leading to developments in hydration effectiveness and ingredient transparency.
Market leaders are focusing on product diversification and portfolio growth as a way of improving sustainability and operational efficiency. These involve recyclable light-weight packaging, sugar-reduction policies, plant-based ingredients, as well as scalable manufacturing processes that impact fewer on the environment along with increased efficiency in supply-chain.
Technological change also favors growth in the market. In June 2024, beverage-related companies embraced the AI-based formulation and consumer analytics platforms to improve the optimization of flavor profiles and functional ingredient dosing to enhance product development efficiency and reduce time-to-market by quantifiable percentages. The functional water market is in a continuous state of evolution by consolidation, targeted innovation, institutional support, diversified portfolios, and absorbing sophisticated digital and formulation technologies.
 Recent Development and Strategic Overview:
-
In May 2025, The Coca-Cola Company undertook a strategic refresh of its vitaminwater portfolio, introducing updated packaging and expanding its functional offerings with new variants such as elevate, featuring multivitamins, and re-hydrate zero sugar, formulated with electrolytes to address evolving consumer hydration needs.
- In March 2024, Essentia Water launched Essentia Hydroboost, its first flavored functional water, formulated with Hydrolytes combining B-vitamins and electrolytes, and introduced in Lemon Lime, Peach Mango, and Raspberry Pomegranate variants to expand its functional hydration portfolio.
Report Scope
|
Detail |
|
|
Market Size in 2025 |
USD 3.8 Bn |
|
Market Forecast Value in 2035 |
USD 6.9 Bn |
|
Growth Rate (CAGR) |
6.1% |
|
Forecast Period |
2026 – 2035 |
|
Historical Data Available for |
2021 – 2024 |
|
Market Size Units |
US$ Billion for Value |
|
Report Format |
Electronic (PDF) + Excel |
|
North America |
Europe |
Asia Pacific |
Middle East |
Africa |
South America |
|
|
|
|
|
|
|
Companies Covered |
|||||
|
|
|
|
|
|
Functional Water Market Segmentation and Highlights
|
Segment |
Sub-segment |
|
Functional Water Market, By Product Type |
|
|
Functional Water Market, By Source/ Ingredient Additive |
|
|
Functional Water Market, By Packaging Type |
|
|
Functional Water Market, By Consumer Group |
|
|
Functional Water Market, By Form |
|
|
Functional Water Market, By Application/ Usage |
|
|
Functional Water Market, By Distribution Channel |
|
Frequently Asked Questions
Table of Contents
- 1. Research Methodology and Assumptions
- 1.1. Definitions
- 1.2. Research Design and Approach
- 1.3. Data Collection Methods
- 1.4. Base Estimates and Calculations
- 1.5. Forecasting Models
- 1.5.1. Key Forecast Factors & Impact Analysis
- 1.6. Secondary Research
- 1.6.1. Open Sources
- 1.6.2. Paid Databases
- 1.6.3. Associations
- 1.7. Primary Research
- 1.7.1. Primary Sources
- 1.7.2. Primary Interviews with Stakeholders across Ecosystem
- 2. Executive Summary
- 2.1. Global Functional Water Market Outlook
- 2.1.1. Functional Water Market Size (Value - US$ Bn), and Forecasts, 2021-2035
- 2.1.2. Compounded Annual Growth Rate Analysis
- 2.1.3. Growth Opportunity Analysis
- 2.1.4. Segmental Share Analysis
- 2.1.5. Geographical Share Analysis
- 2.2. Market Analysis and Facts
- 2.3. Supply-Demand Analysis
- 2.4. Competitive Benchmarking
- 2.5. Go-to- Market Strategy
- 2.5.1. Customer/ End-use Industry Assessment
- 2.5.2. Growth Opportunity Data, 2026-2035
- 2.5.2.1. Regional Data
- 2.5.2.2. Country Data
- 2.5.2.3. Segmental Data
- 2.5.3. Identification of Potential Market Spaces
- 2.5.4. GAP Analysis
- 2.5.5. Potential Attractive Price Points
- 2.5.6. Prevailing Market Risks & Challenges
- 2.5.7. Preferred Sales & Marketing Strategies
- 2.5.8. Key Recommendations and Analysis
- 2.5.9. A Way Forward
- 2.1. Global Functional Water Market Outlook
- 3. Industry Data and Premium Insights
- 3.1. Global Food & Beverages Industry Overview, 2025
- 3.1.1. Food & Beverages Ecosystem Analysis
- 3.1.2. Key Trends for Food & Beverages Industry
- 3.1.3. Regional Distribution for Food & Beverages Industry
- 3.2. Supplier Customer Data
- 3.3. Technology Roadmap and Developments
- 3.4. Trade Analysis
- 3.4.1. Import & Export Analysis, 2025
- 3.4.2. Top Importing Countries
- 3.4.3. Top Exporting Countries
- 3.5. Trump Tariff Impact Analysis
- 3.5.1. Manufacturer
- 3.5.1.1. Based on the component & Raw material
- 3.5.2. Supply Chain
- 3.5.3. End Consumer
- 3.5.1. Manufacturer
- 3.6. Raw Material Analysis
- 3.1. Global Food & Beverages Industry Overview, 2025
- 4. Market Overview
- 4.1. Market Dynamics
- 4.1.1. Drivers
- 4.1.1.1. Rising health-conscious consumer trends and demand for hydration with added benefits
- 4.1.1.2. Increasing prevalence of lifestyle diseases driving demand for fortified beverages
- 4.1.1.3. Innovation in flavors and functional ingredients by key manufacturers
- 4.1.2. Restraints
- 4.1.2.1. High product pricing compared to regular bottled water
- 4.1.2.2. Stringent regulatory approvals for functional additives and health claims
- 4.1.1. Drivers
- 4.2. Key Trend Analysis
- 4.3. Regulatory Framework
- 4.3.1. Key Regulations, Norms, and Subsidies, by Key Countries
- 4.3.2. Tariffs and Standards
- 4.3.3. Impact Analysis of Regulations on the Market
- 4.4. Value Chain / Ecosystem Analysis
- 4.5. Porter’s Five Forces Analysis
- 4.6. PESTEL Analysis
- 4.7. Global Functional Water Market Demand
- 4.7.1. Historical Market Size – in Value (US$ Bn), 2020-2024
- 4.7.2. Current and Future Market Size – in Value (US$ Bn), 2026–2035
- 4.7.2.1. Y-o-Y Growth Trends
- 4.7.2.2. Absolute $ Opportunity Assessment
- 4.1. Market Dynamics
- 5. Competition Landscape
- 5.1. Competition structure
- 5.1.1. Fragmented v/s consolidated
- 5.2. Company Share Analysis, 2025
- 5.2.1. Global Company Market Share
- 5.2.2. By Region
- 5.2.2.1. North America
- 5.2.2.2. Europe
- 5.2.2.3. Asia Pacific
- 5.2.2.4. Middle East
- 5.2.2.5. Africa
- 5.2.2.6. South America
- 5.3. Product Comparison Matrix
- 5.3.1. Specifications
- 5.3.2. Market Positioning
- 5.3.3. Pricing
- 5.1. Competition structure
- 6. Global Functional Water Market Analysis, by Product Type
- 6.1. Key Segment Analysis
- 6.2. Functional Water Market Size (Value - US$ Bn), Analysis, and Forecasts, Product Type, 2021-2035
- 6.2.1. Enhanced Water
- 6.2.2. Vitamin & Nutrient Infused Water
- 6.2.3. Electrolyte/Performance Water
- 6.2.4. Alkaline Water
- 6.2.5. Flavored Functional Water
- 6.2.6. Detox/Beauty Water
- 6.2.7. Probiotic/Prebiotic Water
- 6.2.8. Oxygenated Water
- 6.2.9. Others
- 7. Global Functional Water Market Analysis, by Source/ Ingredient Additive
- 7.1. Key Segment Analysis
- 7.2. Functional Water Market Size (Value - US$ Bn), Analysis, and Forecasts, by Source/ Ingredient Additive, 2021-2035
- 7.2.1. Vitamins
- 7.2.2. Minerals & Electrolytes
- 7.2.3. Botanical Extracts
- 7.2.4. Antioxidants
- 7.2.5. Amino Acids
- 7.2.6. Herbal Extracts
- 7.2.7. Fiber/Prebiotics
- 7.2.8. Probiotics
- 7.2.9. Others
- 8. Global Functional Water Market Analysis, by Packaging Type
- 8.1. Key Segment Analysis
- 8.2. Functional Water Market Size (Value - US$ Bn), Analysis, and Forecasts, by Packaging Type, 2021-2035
- 8.2.1. Bottles (PET/Glass)
- 8.2.2. Cans
- 8.2.3. Pouches
- 8.2.4. Boxed/ Carton Packs
- 8.2.5. Bulk/ Jugs
- 8.2.6. Others
- 9. Global Functional Water Market Analysis, by Consumer Group
- 9.1. Key Segment Analysis
- 9.2. Functional Water Market Size (Value - US$ Bn), Analysis, and Forecasts, by Consumer Group, 2021-2035
- 9.2.1. Adults
- 9.2.2. Athletes/Sports Enthusiasts
- 9.2.3. Children/Youth
- 9.2.4. Seniors
- 9.2.5. All Age Groups
- 10. Global Functional Water Market Analysis, by Form
- 10.1. Key Segment Analysis
- 10.2. Functional Water Market Size (Value - US$ Bn), Analysis, and Forecasts, by Form, 2021-2035
- 10.2.1. Still/Non-Carbonated
- 10.2.2. Sparkling/Carbonated
- 10.2.3. Powder/Concentrate to be Reconstituted
- 11. Global Functional Water Market Analysis, by Application/ Usage
- 11.1. Key Segment Analysis
- 11.2. Functional Water Market Size (Value - US$ Bn), Analysis, and Forecasts, by Application/ Usage, 2021-2035
- 11.2.1. Hydration & Wellness
- 11.2.2. Sports & Fitness
- 11.2.3. Everyday Consumption
- 11.2.4. Medical & Therapeutic
- 11.2.5. Beauty & Detox
- 11.2.6. Others
- 12. Global Functional Water Market Analysis, by Distribution Channel
- 12.1. Key Segment Analysis
- 12.2. Functional Water Market Size (Value - US$ Bn), Analysis, and Forecasts, by Distribution Channel, 2021-2035
- 12.2.1. Supermarkets/Hypermarkets
- 12.2.2. Convenience Stores
- 12.2.3. Online Retail
- 12.2.4. Specialty/Health Food Stores
- 12.2.5. Vending Machines/Automated Retail
- 12.2.6. Food Service Channels
- 13. Global Functional Water Market Analysis, by Region
- 13.1. Key Findings
- 13.2. Functional Water Market Size (Value - US$ Mn), Analysis, and Forecasts, by Region, 2021-2035
- 13.2.1. North America
- 13.2.2. Europe
- 13.2.3. Asia Pacific
- 13.2.4. Middle East
- 13.2.5. Africa
- 13.2.6. South America
- 14. North America Functional Water Market Analysis
- 14.1. Key Segment Analysis
- 14.2. Regional Snapshot
- 14.3. North America Functional Water Market Size Value - US$ Bn), Analysis, and Forecasts, 2021-2035
- 14.3.1. Product Type
- 14.3.2. Source/ Ingredient Additive
- 14.3.3. Packaging Type
- 14.3.4. Consumer Group
- 14.3.5. Form
- 14.3.6. Application/ Usage
- 14.3.7. Distribution Channel
- 14.3.8. Country
- 14.3.8.1. USA
- 14.3.8.2. Canada
- 14.3.8.3. Mexico
- 14.4. USA Functional Water Market
- 14.4.1. Country Segmental Analysis
- 14.4.2. Product Type
- 14.4.3. Source/ Ingredient Additive
- 14.4.4. Packaging Type
- 14.4.5. Consumer Group
- 14.4.6. Form
- 14.4.7. Application/ Usage
- 14.4.8. Distribution Channel
- 14.5. Canada Functional Water Market
- 14.5.1. Country Segmental Analysis
- 14.5.2. Product Type
- 14.5.3. Source/ Ingredient Additive
- 14.5.4. Packaging Type
- 14.5.5. Consumer Group
- 14.5.6. Form
- 14.5.7. Application/ Usage
- 14.5.8. Distribution Channel
- 14.6. Mexico Functional Water Market
- 14.6.1. Country Segmental Analysis
- 14.6.2. Product Type
- 14.6.3. Source/ Ingredient Additive
- 14.6.4. Packaging Type
- 14.6.5. Consumer Group
- 14.6.6. Form
- 14.6.7. Application/ Usage
- 14.6.8. Distribution Channel
- 15. Europe Functional Water Market Analysis
- 15.1. Key Segment Analysis
- 15.2. Regional Snapshot
- 15.3. Europe Functional Water Market Size (Value - US$ Bn), Analysis, and Forecasts, 2021-2035
- 15.3.1. Product Type
- 15.3.2. Source/ Ingredient Additive
- 15.3.3. Packaging Type
- 15.3.4. Consumer Group
- 15.3.5. Form
- 15.3.6. Application/ Usage
- 15.3.7. Distribution Channel
- 15.3.8. Country
- 15.3.8.1. Germany
- 15.3.8.2. United Kingdom
- 15.3.8.3. France
- 15.3.8.4. Italy
- 15.3.8.5. Spain
- 15.3.8.6. Netherlands
- 15.3.8.7. Nordic Countries
- 15.3.8.8. Poland
- 15.3.8.9. Russia & CIS
- 15.3.8.10. Rest of Europe
- 15.4. Germany Functional Water Market
- 15.4.1. Country Segmental Analysis
- 15.4.2. Product Type
- 15.4.3. Source/ Ingredient Additive
- 15.4.4. Packaging Type
- 15.4.5. Consumer Group
- 15.4.6. Form
- 15.4.7. Application/ Usage
- 15.4.8. Distribution Channel
- 15.5. United Kingdom Functional Water Market
- 15.5.1. Country Segmental Analysis
- 15.5.2. Product Type
- 15.5.3. Source/ Ingredient Additive
- 15.5.4. Packaging Type
- 15.5.5. Consumer Group
- 15.5.6. Form
- 15.5.7. Application/ Usage
- 15.5.8. Distribution Channel
- 15.6. France Functional Water Market
- 15.6.1. Country Segmental Analysis
- 15.6.2. Product Type
- 15.6.3. Source/ Ingredient Additive
- 15.6.4. Packaging Type
- 15.6.5. Consumer Group
- 15.6.6. Form
- 15.6.7. Application/ Usage
- 15.6.8. Distribution Channel
- 15.7. Italy Functional Water Market
- 15.7.1. Country Segmental Analysis
- 15.7.2. Product Type
- 15.7.3. Source/ Ingredient Additive
- 15.7.4. Packaging Type
- 15.7.5. Consumer Group
- 15.7.6. Form
- 15.7.7. Application/ Usage
- 15.7.8. Distribution Channel
- 15.8. Spain Functional Water Market
- 15.8.1. Country Segmental Analysis
- 15.8.2. Product Type
- 15.8.3. Source/ Ingredient Additive
- 15.8.4. Packaging Type
- 15.8.5. Consumer Group
- 15.8.6. Form
- 15.8.7. Application/ Usage
- 15.8.8. Distribution Channel
- 15.9. Netherlands Functional Water Market
- 15.9.1. Country Segmental Analysis
- 15.9.2. Product Type
- 15.9.3. Source/ Ingredient Additive
- 15.9.4. Packaging Type
- 15.9.5. Consumer Group
- 15.9.6. Form
- 15.9.7. Application/ Usage
- 15.9.8. Distribution Channel
- 15.10. Nordic Countries Functional Water Market
- 15.10.1. Country Segmental Analysis
- 15.10.2. Product Type
- 15.10.3. Source/ Ingredient Additive
- 15.10.4. Packaging Type
- 15.10.5. Consumer Group
- 15.10.6. Form
- 15.10.7. Application/ Usage
- 15.10.8. Distribution Channel
- 15.11. Poland Functional Water Market
- 15.11.1. Country Segmental Analysis
- 15.11.2. Product Type
- 15.11.3. Source/ Ingredient Additive
- 15.11.4. Packaging Type
- 15.11.5. Consumer Group
- 15.11.6. Form
- 15.11.7. Application/ Usage
- 15.11.8. Distribution Channel
- 15.12. Russia & CIS Functional Water Market
- 15.12.1. Country Segmental Analysis
- 15.12.2. Product Type
- 15.12.3. Source/ Ingredient Additive
- 15.12.4. Packaging Type
- 15.12.5. Consumer Group
- 15.12.6. Form
- 15.12.7. Application/ Usage
- 15.12.8. Distribution Channel
- 15.13. Rest of Europe Functional Water Market
- 15.13.1. Country Segmental Analysis
- 15.13.2. Product Type
- 15.13.3. Source/ Ingredient Additive
- 15.13.4. Packaging Type
- 15.13.5. Consumer Group
- 15.13.6. Form
- 15.13.7. Application/ Usage
- 15.13.8. Distribution Channel
- 16. Asia Pacific Functional Water Market Analysis
- 16.1. Key Segment Analysis
- 16.2. Regional Snapshot
- 16.3. Asia Pacific Functional Water Market Size (Value - US$ Bn), Analysis, and Forecasts, 2021-2035
- 16.3.1. Product Type
- 16.3.2. Source/ Ingredient Additive
- 16.3.3. Packaging Type
- 16.3.4. Consumer Group
- 16.3.5. Form
- 16.3.6. Application/ Usage
- 16.3.7. Distribution Channel
- 16.3.8. Country
- 16.3.8.1. China
- 16.3.8.2. India
- 16.3.8.3. Japan
- 16.3.8.4. South Korea
- 16.3.8.5. Australia and New Zealand
- 16.3.8.6. Indonesia
- 16.3.8.7. Malaysia
- 16.3.8.8. Thailand
- 16.3.8.9. Vietnam
- 16.3.8.10. Rest of Asia Pacific
- 16.4. China Functional Water Market
- 16.4.1. Country Segmental Analysis
- 16.4.2. Product Type
- 16.4.3. Source/ Ingredient Additive
- 16.4.4. Packaging Type
- 16.4.5. Consumer Group
- 16.4.6. Form
- 16.4.7. Application/ Usage
- 16.4.8. Distribution Channel
- 16.5. India Functional Water Market
- 16.5.1. Country Segmental Analysis
- 16.5.2. Product Type
- 16.5.3. Source/ Ingredient Additive
- 16.5.4. Packaging Type
- 16.5.5. Consumer Group
- 16.5.6. Form
- 16.5.7. Application/ Usage
- 16.5.8. Distribution Channel
- 16.6. Japan Functional Water Market
- 16.6.1. Country Segmental Analysis
- 16.6.2. Product Type
- 16.6.3. Source/ Ingredient Additive
- 16.6.4. Packaging Type
- 16.6.5. Consumer Group
- 16.6.6. Form
- 16.6.7. Application/ Usage
- 16.6.8. Distribution Channel
- 16.7. South Korea Functional Water Market
- 16.7.1. Country Segmental Analysis
- 16.7.2. Product Type
- 16.7.3. Source/ Ingredient Additive
- 16.7.4. Packaging Type
- 16.7.5. Consumer Group
- 16.7.6. Form
- 16.7.7. Application/ Usage
- 16.7.8. Distribution Channel
- 16.8. Australia and New Zealand Functional Water Market
- 16.8.1. Country Segmental Analysis
- 16.8.2. Product Type
- 16.8.3. Source/ Ingredient Additive
- 16.8.4. Packaging Type
- 16.8.5. Consumer Group
- 16.8.6. Form
- 16.8.7. Application/ Usage
- 16.8.8. Distribution Channel
- 16.9. Indonesia Functional Water Market
- 16.9.1. Country Segmental Analysis
- 16.9.2. Product Type
- 16.9.3. Source/ Ingredient Additive
- 16.9.4. Packaging Type
- 16.9.5. Consumer Group
- 16.9.6. Form
- 16.9.7. Application/ Usage
- 16.9.8. Distribution Channel
- 16.10. Malaysia Functional Water Market
- 16.10.1. Country Segmental Analysis
- 16.10.2. Product Type
- 16.10.3. Source/ Ingredient Additive
- 16.10.4. Packaging Type
- 16.10.5. Consumer Group
- 16.10.6. Form
- 16.10.7. Application/ Usage
- 16.10.8. Distribution Channel
- 16.11. Thailand Functional Water Market
- 16.11.1. Country Segmental Analysis
- 16.11.2. Product Type
- 16.11.3. Source/ Ingredient Additive
- 16.11.4. Packaging Type
- 16.11.5. Consumer Group
- 16.11.6. Form
- 16.11.7. Application/ Usage
- 16.11.8. Distribution Channel
- 16.12. Vietnam Functional Water Market
- 16.12.1. Country Segmental Analysis
- 16.12.2. Product Type
- 16.12.3. Source/ Ingredient Additive
- 16.12.4. Packaging Type
- 16.12.5. Consumer Group
- 16.12.6. Form
- 16.12.7. Application/ Usage
- 16.12.8. Distribution Channel
- 16.13. Rest of Asia Pacific Functional Water Market
- 16.13.1. Country Segmental Analysis
- 16.13.2. Product Type
- 16.13.3. Source/ Ingredient Additive
- 16.13.4. Packaging Type
- 16.13.5. Consumer Group
- 16.13.6. Form
- 16.13.7. Application/ Usage
- 16.13.8. Distribution Channel
- 17. Middle East Functional Water Market Analysis
- 17.1. Key Segment Analysis
- 17.2. Regional Snapshot
- 17.3. Middle East Functional Water Market Size (Value - US$ Bn), Analysis, and Forecasts, 2021-2035
- 17.3.1. Product Type
- 17.3.2. Source/ Ingredient Additive
- 17.3.3. Packaging Type
- 17.3.4. Consumer Group
- 17.3.5. Form
- 17.3.6. Application/ Usage
- 17.3.7. Distribution Channel
- 17.3.8. Country
- 17.3.8.1. Turkey
- 17.3.8.2. UAE
- 17.3.8.3. Saudi Arabia
- 17.3.8.4. Israel
- 17.3.8.5. Rest of Middle East
- 17.4. Turkey Functional Water Market
- 17.4.1. Country Segmental Analysis
- 17.4.2. Product Type
- 17.4.3. Source/ Ingredient Additive
- 17.4.4. Packaging Type
- 17.4.5. Consumer Group
- 17.4.6. Form
- 17.4.7. Application/ Usage
- 17.4.8. Distribution Channel
- 17.5. UAE Functional Water Market
- 17.5.1. Country Segmental Analysis
- 17.5.2. Product Type
- 17.5.3. Source/ Ingredient Additive
- 17.5.4. Packaging Type
- 17.5.5. Consumer Group
- 17.5.6. Form
- 17.5.7. Application/ Usage
- 17.5.8. Distribution Channel
- 17.6. Saudi Arabia Functional Water Market
- 17.6.1. Country Segmental Analysis
- 17.6.2. Product Type
- 17.6.3. Source/ Ingredient Additive
- 17.6.4. Packaging Type
- 17.6.5. Consumer Group
- 17.6.6. Form
- 17.6.7. Application/ Usage
- 17.6.8. Distribution Channel
- 17.7. Israel Functional Water Market
- 17.7.1. Country Segmental Analysis
- 17.7.2. Product Type
- 17.7.3. Source/ Ingredient Additive
- 17.7.4. Packaging Type
- 17.7.5. Consumer Group
- 17.7.6. Form
- 17.7.7. Application/ Usage
- 17.7.8. Distribution Channel
- 17.8. Rest of Middle East Functional Water Market
- 17.8.1. Country Segmental Analysis
- 17.8.2. Product Type
- 17.8.3. Source/ Ingredient Additive
- 17.8.4. Packaging Type
- 17.8.5. Consumer Group
- 17.8.6. Form
- 17.8.7. Application/ Usage
- 17.8.8. Distribution Channel
- 18. Africa Functional Water Market Analysis
- 18.1. Key Segment Analysis
- 18.2. Regional Snapshot
- 18.3. Africa Functional Water Market Size (Value - US$ Bn), Analysis, and Forecasts, 2021-2035
- 18.3.1. Product Type
- 18.3.2. Source/ Ingredient Additive
- 18.3.3. Packaging Type
- 18.3.4. Consumer Group
- 18.3.5. Form
- 18.3.6. Application/ Usage
- 18.3.7. Distribution Channel
- 18.3.8. Country
- 18.3.8.1. South Africa
- 18.3.8.2. Egypt
- 18.3.8.3. Nigeria
- 18.3.8.4. Algeria
- 18.3.8.5. Rest of Africa
- 18.4. South Africa Functional Water Market
- 18.4.1. Country Segmental Analysis
- 18.4.2. Product Type
- 18.4.3. Source/ Ingredient Additive
- 18.4.4. Packaging Type
- 18.4.5. Consumer Group
- 18.4.6. Form
- 18.4.7. Application/ Usage
- 18.4.8. Distribution Channel
- 18.5. Egypt Functional Water Market
- 18.5.1. Country Segmental Analysis
- 18.5.2. Product Type
- 18.5.3. Source/ Ingredient Additive
- 18.5.4. Packaging Type
- 18.5.5. Consumer Group
- 18.5.6. Form
- 18.5.7. Application/ Usage
- 18.5.8. Distribution Channel
- 18.6. Nigeria Functional Water Market
- 18.6.1. Country Segmental Analysis
- 18.6.2. Product Type
- 18.6.3. Source/ Ingredient Additive
- 18.6.4. Packaging Type
- 18.6.5. Consumer Group
- 18.6.6. Form
- 18.6.7. Application/ Usage
- 18.6.8. Distribution Channel
- 18.7. Algeria Functional Water Market
- 18.7.1. Country Segmental Analysis
- 18.7.2. Product Type
- 18.7.3. Source/ Ingredient Additive
- 18.7.4. Packaging Type
- 18.7.5. Consumer Group
- 18.7.6. Form
- 18.7.7. Application/ Usage
- 18.7.8. Distribution Channel
- 18.8. Rest of Africa Functional Water Market
- 18.8.1. Country Segmental Analysis
- 18.8.2. Product Type
- 18.8.3. Source/ Ingredient Additive
- 18.8.4. Packaging Type
- 18.8.5. Consumer Group
- 18.8.6. Form
- 18.8.7. Application/ Usage
- 18.8.8. Distribution Channel
- 19. South America Functional Water Market Analysis
- 19.1. Key Segment Analysis
- 19.2. Regional Snapshot
- 19.3. South America Functional Water Market Size (Value - US$ Bn), Analysis, and Forecasts, 2021-2035
- 19.3.1. Product Type
- 19.3.2. Source/ Ingredient Additive
- 19.3.3. Packaging Type
- 19.3.4. Consumer Group
- 19.3.5. Form
- 19.3.6. Application/ Usage
- 19.3.7. Distribution Channel
- 19.3.8. Country
- 19.3.8.1. Brazil
- 19.3.8.2. Argentina
- 19.3.8.3. Rest of South America
- 19.4. Brazil Functional Water Market
- 19.4.1. Country Segmental Analysis
- 19.4.2. Product Type
- 19.4.3. Source/ Ingredient Additive
- 19.4.4. Packaging Type
- 19.4.5. Consumer Group
- 19.4.6. Form
- 19.4.7. Application/ Usage
- 19.4.8. Distribution Channel
- 19.5. Argentina Functional Water Market
- 19.5.1. Country Segmental Analysis
- 19.5.2. Product Type
- 19.5.3. Source/ Ingredient Additive
- 19.5.4. Packaging Type
- 19.5.5. Consumer Group
- 19.5.6. Form
- 19.5.7. Application/ Usage
- 19.5.8. Distribution Channel
- 19.6. Rest of South America Functional Water Market
- 19.6.1. Country Segmental Analysis
- 19.6.2. Product Type
- 19.6.3. Source/ Ingredient Additive
- 19.6.4. Packaging Type
- 19.6.5. Consumer Group
- 19.6.6. Form
- 19.6.7. Application/ Usage
- 19.6.8. Distribution Channel
- 20. Key Players/ Company Profile
- 20.1. Alkaline88, LLC
- 20.1.1. Company Details/ Overview
- 20.1.2. Company Financials
- 20.1.3. Key Customers and Competitors
- 20.1.4. Business/ Industry Portfolio
- 20.1.5. Product Portfolio/ Specification Details
- 20.1.6. Pricing Data
- 20.1.7. Strategic Overview
- 20.1.8. Recent Developments
- 20.2. AQUAhydrate, LLC
- 20.3. Bai Brands, LLC (Dr Pepper Snapple Group)
- 20.4. Core Hydration (The Coca-Cola Company)
- 20.5. Danone S.A.
- 20.6. Essentia Water LLC
- 20.7. Glacéau (The Coca-Cola Company)
- 20.8. Hint, Inc.
- 20.9. LIFEWTR (PepsiCo, Inc.)
- 20.10. Nestlé S.A.
- 20.11. PepsiCo, Inc.
- 20.12. Perrier (Nestlé Waters)
- 20.13. Propel (Gatorade brand – PepsiCo, Inc.)
- 20.14. S.Pellegrino S.p.A. (Nestlé Waters)
- 20.15. Smartwater (The Coca-Cola Company)
- 20.16. Talking Rain Beverage Company
- 20.17. The Coca-Cola Company
- 20.18. Tyent USA, Inc.
- 20.19. VOSS Water AS
- 20.20. Zevia (Zevia PBC)
- 20.21. Other Key Players
- 20.1. Alkaline88, LLC
Note* - This is just tentative list of players. While providing the report, we will cover more number of players based on their revenue and share for each geography
Research Design
Our research design integrates both demand-side and supply-side analysis through a balanced combination of primary and secondary research methodologies. By utilizing both bottom-up and top-down approaches alongside rigorous data triangulation methods, we deliver robust market intelligence that supports strategic decision-making.
MarketGenics' comprehensive research design framework ensures the delivery of accurate, reliable, and actionable market intelligence. Through the integration of multiple research approaches, rigorous validation processes, and expert analysis, we provide our clients with the insights needed to make informed strategic decisions and capitalize on market opportunities.

MarketGenics leverages a dedicated industry panel of experts and a comprehensive suite of paid databases to effectively collect, consolidate, and analyze market intelligence.
Our approach has consistently proven to be reliable and effective in generating accurate market insights, identifying key industry trends, and uncovering emerging business opportunities.
Through both primary and secondary research, we capture and analyze critical company-level data such as manufacturing footprints, including technical centers, R&D facilities, sales offices, and headquarters.
Our expert panel further enhances our ability to estimate market size for specific brands based on validated field-level intelligence.
Our data mining techniques incorporate both parametric and non-parametric methods, allowing for structured data collection, sorting, processing, and cleaning.
Demand projections are derived from large-scale data sets analyzed through proprietary algorithms, culminating in robust and reliable market sizing.
Research Approach
The bottom-up approach builds market estimates by starting with the smallest addressable market units and systematically aggregating them to create comprehensive market size projections.
This method begins with specific, granular data points and builds upward to create the complete market landscape.
Customer Analysis → Segmental Analysis → Geographical Analysis
The top-down approach starts with the broadest possible market data and systematically narrows it down through a series of filters and assumptions to arrive at specific market segments or opportunities.
This method begins with the big picture and works downward to increasingly specific market slices.
TAM → SAM → SOM


Research Methods
Desk / Secondary Research
While analysing the market, we extensively study secondary sources, directories, and databases to identify and collect information useful for this technical, market-oriented, and commercial report. Secondary sources that we utilize are not only the public sources, but it is a combination of Open Source, Associations, Paid Databases, MG Repository & Knowledgebase, and others.
- Company websites, annual reports, financial reports, broker reports, and investor presentations
- National government documents, statistical databases and reports
- News articles, press releases and web-casts specific to the companies operating in the market, Magazines, reports, and others
- We gather information from commercial data sources for deriving company specific data such as segmental revenue, share for geography, product revenue, and others
- Internal and external proprietary databases (industry-specific), relevant patent, and regulatory databases
- Governing Bodies, Government Organizations
- Relevant Authorities, Country-specific Associations for Industries
We also employ the model mapping approach to estimate the product level market data through the players' product portfolio
Primary Research
Primary research/ interviews is vital in analyzing the market. Most of the cases involves paid primary interviews. Primary sources include primary interviews through e-mail interactions, telephonic interviews, surveys as well as face-to-face interviews with the different stakeholders across the value chain including several industry experts.
| Type of Respondents | Number of Primaries |
|---|---|
| Tier 2/3 Suppliers | ~20 |
| Tier 1 Suppliers | ~25 |
| End-users | ~25 |
| Industry Expert/ Panel/ Consultant | ~30 |
| Total | ~100 |
MG Knowledgebase
• Repository of industry blog, newsletter and case studies
• Online platform covering detailed market reports, and company profiles
Forecasting Factors and Models
Forecasting Factors
- Historical Trends – Past market patterns, cycles, and major events that shaped how markets behave over time. Understanding past trends helps predict future behavior.
- Industry Factors – Specific characteristics of the industry like structure, regulations, and innovation cycles that affect market dynamics.
- Macroeconomic Factors – Economic conditions like GDP growth, inflation, and employment rates that affect how much money people have to spend.
- Demographic Factors – Population characteristics like age, income, and location that determine who can buy your product.
- Technology Factors – How quickly people adopt new technology and how much technology infrastructure exists.
- Regulatory Factors – Government rules, laws, and policies that can help or restrict market growth.
- Competitive Factors – Analyzing competition structure such as degree of competition and bargaining power of buyers and suppliers.
Forecasting Models / Techniques
Multiple Regression Analysis
- Identify and quantify factors that drive market changes
- Statistical modeling to establish relationships between market drivers and outcomes
Time Series Analysis – Seasonal Patterns
- Understand regular cyclical patterns in market demand
- Advanced statistical techniques to separate trend, seasonal, and irregular components
Time Series Analysis – Trend Analysis
- Identify underlying market growth patterns and momentum
- Statistical analysis of historical data to project future trends
Expert Opinion – Expert Interviews
- Gather deep industry insights and contextual understanding
- In-depth interviews with key industry stakeholders
Multi-Scenario Development
- Prepare for uncertainty by modeling different possible futures
- Creating optimistic, pessimistic, and most likely scenarios
Time Series Analysis – Moving Averages
- Sophisticated forecasting for complex time series data
- Auto-regressive integrated moving average models with seasonal components
Econometric Models
- Apply economic theory to market forecasting
- Sophisticated economic models that account for market interactions
Expert Opinion – Delphi Method
- Harness collective wisdom of industry experts
- Structured, multi-round expert consultation process
Monte Carlo Simulation
- Quantify uncertainty and probability distributions
- Thousands of simulations with varying input parameters
Research Analysis
Our research framework is built upon the fundamental principle of validating market intelligence from both demand and supply perspectives. This dual-sided approach ensures comprehensive market understanding and reduces the risk of single-source bias.
Demand-Side Analysis: We understand end-user/application behavior, preferences, and market needs along with the penetration of the product for specific application.
Supply-Side Analysis: We estimate overall market revenue, analyze the segmental share along with industry capacity, competitive landscape, and market structure.
Validation & Evaluation
Data triangulation is a validation technique that uses multiple methods, sources, or perspectives to examine the same research question, thereby increasing the credibility and reliability of research findings. In market research, triangulation serves as a quality assurance mechanism that helps identify and minimize bias, validate assumptions, and ensure accuracy in market estimates.
- Data Source Triangulation – Using multiple data sources to examine the same phenomenon
- Methodological Triangulation – Using multiple research methods to study the same research question
- Investigator Triangulation – Using multiple researchers or analysts to examine the same data
- Theoretical Triangulation – Using multiple theoretical perspectives to interpret the same data

Custom Market Research Services
We will customise the research for you, in case the report listed above does not meet your requirements.
Get 10% Free Customisation