Processed Fruits & Vegetables Market Size, Share & Trends Analysis Report by Product Type (Processed Fruits, Processed Vegetables), Processing Technology, Packaging Type, Distribution Channel, Nature/Organic Status, Applications, and Geography (North America, Europe, Asia Pacific, Middle East, Africa, and South America) – Global Industry Data, Trends, and Forecasts, 2026–2035
|
|
|
Segmental Data Insights |
|
|
Demand Trends |
|
|
Competitive Landscape |
|
|
Strategic Development |
|
|
Future Outlook & Opportunities |
|
Processed Fruits & Vegetables Market Size, Share, and Growth
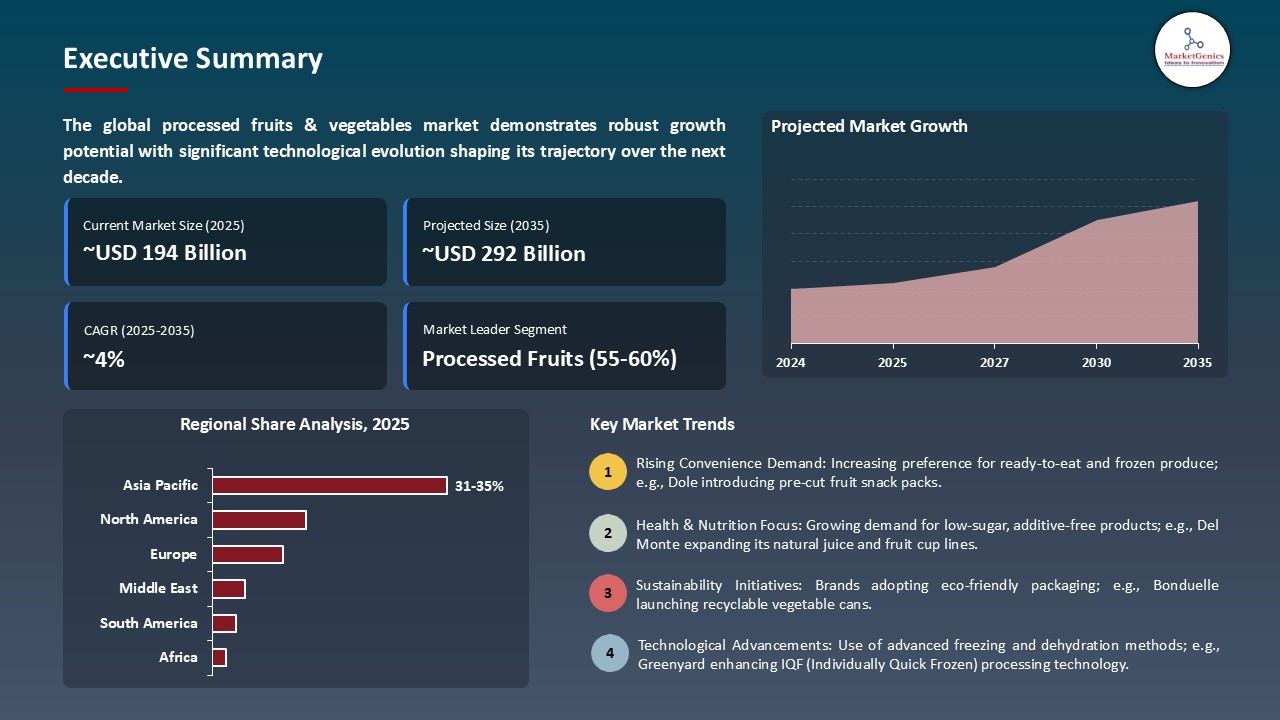
The global processed fruits & vegetables market is experiencing robust growth, with its estimated value of USD 193.7 billion in the year 2025 and USD 292.3 billion by the period 2035, registering a CAGR of 4.2%, during the forecast period. The global processed fruits and vegetables market is expanding because of the increasing health consciousness, demand of natural, rich with antioxidants products and fortified products. High-tech processing guarantees nutrient preservation and safety, and increased retail and online shopping accessibility increases accessibility worldwide.
Mr. Saurabh Mehra, MD & Global Head, Food and Feed Processing and Value-Added Segment at Olam Agri, said, “Through this partnership, we will scale our sustainability projects with farmers and bakers in Nigeria and Ghana. As a leader in the food and feed value chain, we see this collaboration as strengthening our engagement and support for farmers and bakers to empower more local talent, strengthen food systems, and advance food security.
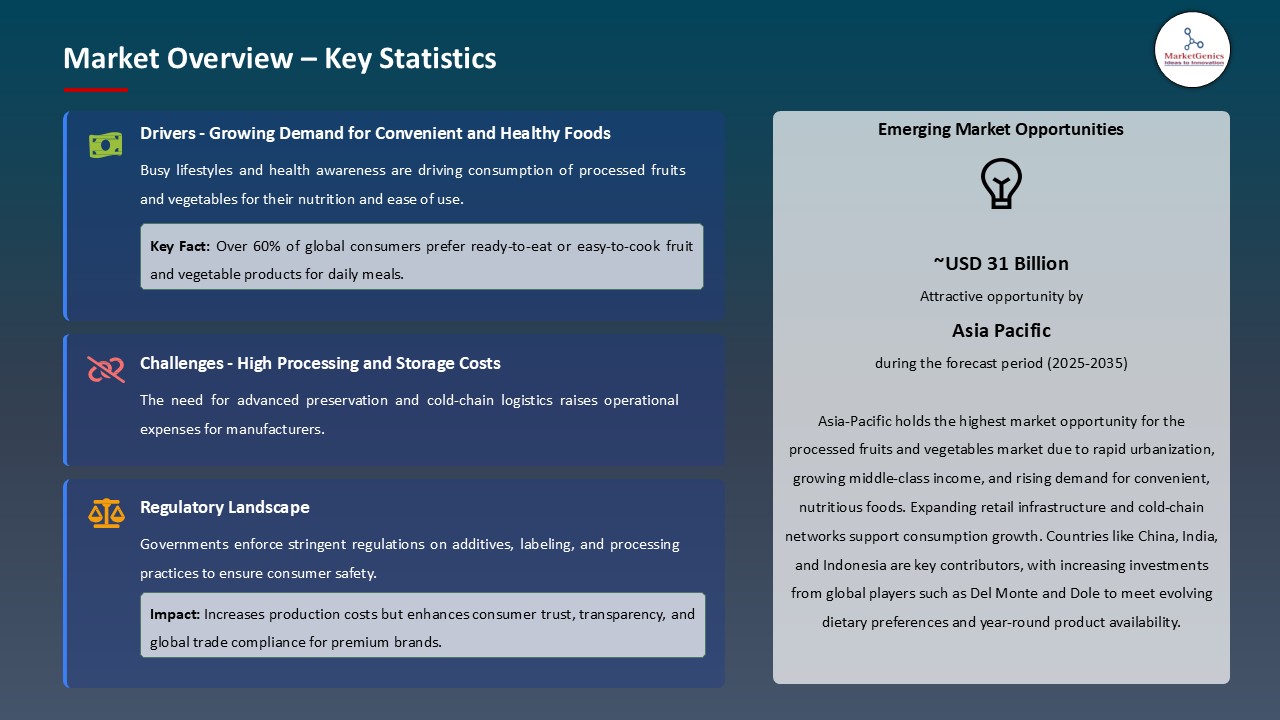
The growing demand of convenient and nutritious food and lifestyle changes related to urbanization is fueling the processed fruits and vegetables market. As a growing number of consumers reside in urban areas and have less time to prepare meals, consumption of ready-to-use, shelf-stable, and frozen substitutes that provide nutrition with less effort is increasing. Such products are moving well beyond commodity products, with added convenience and a culinary diversity.
New technologies of preservation, clean-label processing, nutrient retention and sustainable packaging further facilitate market growth by overcoming the historic issues of taste, nutrition and integrity of ingredients. New technologies like the IQF and high-pressure processing techniques increase the quality of products, which allows them to take a premium position in health-conscious retail outlets.
Cut fresh vegetables and cold-pressed juices, smoothie bases, plant-based meal ingredients, probiotic-fermented vegetables and upcycled products can enable processors to maximize their use of raw materials, diversify their revenues and serve a wide range of consumption occasions, channels of distribution, and price points, supporting sustainable market growth in the long run.
Processed Fruits & Vegetables Market Dynamics and Trends
Driver: Food Security Imperatives and Supply Chain Resilience
- The processed fruits and vegetables market is progressively motivated by the food security requirements and the necessity of sustainable supply chains. Processed produce guarantees that people have regular access to vital nutrients all the year round, which reduces the risk associated with seasonal availability, transportation issues, and perishability of fresh produce. Processing enhances the stability of food systems and promotes the nutritional requirements of the populations by prolonging shelf life, minimizing post- harvests, and facilitating the redistribution of goods across geographic locations.
- Governments and industry stakeholders are also focusing on the establishment of preservation infrastructure, cold chain logistics, efficient processing and modernization technology to retain and preserve quality, nutrient attributes, and safety. These measures mitigate the susceptibility to environmental, economic, and logistical shocks and improve efficiency in the whole system.
- The capability to deliver a consistent supply of a variety of fruits and vegetables regardless of seasonal changes makes dietary diversity, promotes long-term objectives of the population health, and offers long-term development possibilities to processors.
- Supply chain optimization, storage innovation, and processing scalability allow integration of the supply chain to make the market the cornerstone of sustainable and resilient food systems.
Restraint: Perception Challenges and Fresh Produce Competition
- The processed fruits and vegetables market is limited by the belief of the consumers that processing reduces nutritional value, taste, and naturalness of ingredients, although modern processes are known to preserve and even increase nutrient levels. These perceptions restrict the uptake by health conscious and premium oriented consumers, who are among the major drivers of market growth.
- The category is experiencing an increasing competition with fresh-cut produce, meal kits, and prepared fresh products that offer convenience and perceived high-quality to customers. These substitutes catch the health-halo gains and price-skilling, which undermine the classic benefit of the processed products.
- Inertial perception constraints and competition from new substitutes limit the premium positioning of processed fruits and vegetables, restricting market expansion to price-sensitive or mainstream groups rather than high-value, nutrition-oriented niches.
Opportunity: Plant-Based Meal Solutions and Culinary Innovation
- The processed fruits and vegetables market presents a viable growth potential due to the development of technology that has increased efficiency, quality, and value additions in its products. Several technologies, including automation, accuracy cutting, and sophisticated packaging technologies enable the processors to address the consumer demand of convenience, freshness, and clean-label products besides lessening waste and labor expenses.
- Business organisations are engaging in investing in new advanced machinery to enhance processing performance. For instance, in February 2025, Sormac Ltd. displayed its new fruit and vegetable processing equipment at the Fruit Logistica 2025, and the latest technologies will allow optimization of throughput and quality control, as well as its ability to enable scale-up and Fruit Logistica 2025 new technologies reveal how technological adoption can facilitate scale-up and entering high-value and ready-to-eat markets.
- Implementing technological advancements with sustainable business practices, data-driven supply chain management, and innovative product creation can lead to long-term growth, diversification, and profitability in both new and established marketplaces.
Key Trend: Sustainability, Regenerative Agriculture, and Circular Economy
- Sustainability of the processed fruits and vegetables market is taking a new orientation with such considerations as regenerative agriculture, renewable energy in processing, water conservation, and new packaging as well as reduction of food waste by upcycling. These efforts address the demands of the consumers, the demands of the retailers, the demands of the investors and the regulatory trends and provide differentiation and the ability to withstand long term operations.
- Processors are also transforming excess or poor-quality produce into value product. For instance, in May 2025, ICAR-CCRI created products based on citrus as value added products, converting citrus peel and citrus pulp waste into processed foods, showing how the agricultural by-products can be upcycled, that is, waste can be transformed back into revenue generators. Businesses are transitioning to compostable packaging, paper-based containers, and reusable systems instead of metal cans and plastics.
- These sustainability-focused efforts boost brand loyalty, reduce climate-related operational risks, and align with the ESG principles that are gaining traction among retailers, investors, and regulators.
Processed Fruits and Vegetables Market Analysis and Segmental Data
Processed Fruits Dominate Global Processed Fruits & Vegetables Market
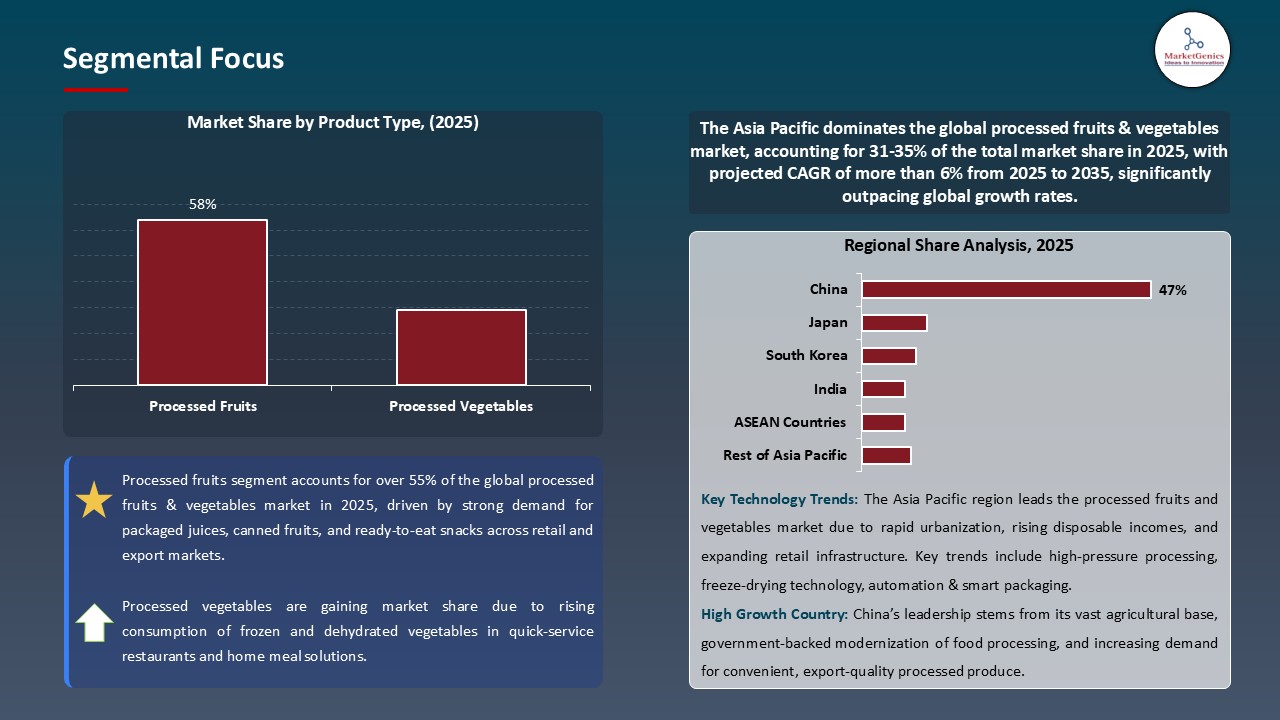
- The processed fruits segment leads the global processed fruits and vegetables market, owing to consumer’s preference towards convenient and high quality fruit products, and growing demand of clean-label, fortified, and ready-to-eat products. The use of advanced technologies of preservation, freezing, and drying is improving product shelf life, taste, and retention of nutritional value.
- The current trend in fruit processing is the enhancement of freshness and waste reduction with the aim of sustainability targets. For instance, in March 2025, UK-based biotech company Tropic presented a gene-edited non-browning banana, which extends the shelf life of the banana after peeling, as an innovative way that processed fruit products, and as a solution to global food-waste issues. This is an indication of the trend towards science-based, environmentally friendly fruit processing solutions, which are popular among health-conscious, environmentally conscious consumers.
- The processed fruits category is further enhanced by conducive regulations, increased consumer confidence, and a widening distribution channels whereby manufacturers are able to scale production, introduce high quality recipes and be able to exploit the increased demand of naturally sourced and nutrient rich fruit products in the global market.
Asia Pacific Leads Global Processed Fruits & Vegetables Market Demand
- Asia Pacific has continued to lead in the market with approximate 39%of total global processed fruits and vegetables revenues due to the high rate of urbanization, increasing the middle-income group, increasing disposable income, and high domestic production which guarantees the ease of access to raw materials. It is increasingly using innovative technologies in processing, latest distribution channels and strategic partnerships to address changing consumer demands.
- The processors in the region are actively developing product lines and seeking new approaches to meet the shifting tastes of consumers. For instance, in September 2025, Asian Fruit Logistica in Hong Kong exhibited new processed fruit and vegetable products, new packaging and strategic alliances between growers in the region and multinational processors, noting the dynamic growth of the market as well as its modernization of processing methods.
- Furthermore, the Asia Pacific also have the advantages of concentrated agricultural production that allows the creation of rapid harvest-to-processing schedules which optimize the quality and minimizes the costs. Favorable government programs and cultural orientation towards consumption of preserved fruits and vegetables also enhance the contribution to the global growth of processed fruits and vegetables in the region.
Processed-Fruits-and-Vegetables-Market Ecosystem
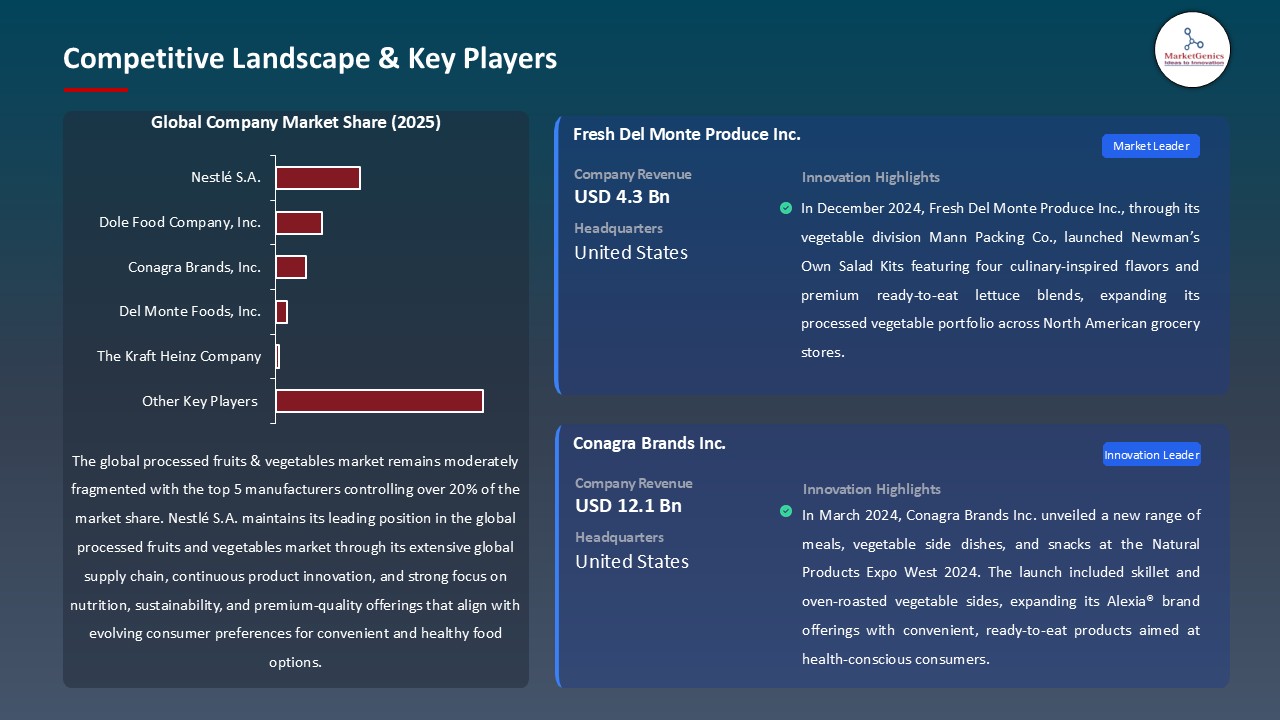
The global processed fruits and vegetables market is moderately concentrated, and it is divided based on the way of processing, product, and region. The main players include Del Monte Foods, Dole, General Mills, Conagra Brands, Nomad Foods, and Bonduelle, all of them are vertically integrated, have large product lines, strong brands, and extensive distribution channel, which allows them to be premium-positioned and invest in innovation over the long term.
These businesses utilize vertical functions such as source farming, processing along production areas, cold storage and close retailing connections, which develop competitive edges in quality management, supply chain effectiveness, and value capture. Tier 2 comprises regional processors and category leaders, and Tier 3 consists of local processors and co-packers having narrow distribution.
Academic partnerships such as BGG and Lycored coming up with processed fruits and vegetables-lycopene combinations depict a market trend of seeking complex and solution-based formulations, which have better clinical effects and high prices. Firms in this industry are characterized by high technical and regulatory barriers more particularly to natural processed fruits and vegetables where knowledge of growth, control of contamination and dossier preparation of the products involves heavy investment and synthetic alternatives have the disadvantage of being perceived by consumers in spite of their low prices.
Recent Development and Strategic Overview:
- In July 2025, TELUS Agriculture and Consumer Goods established a historic ten-year agreement with Welchs with the aim of implementing a complete digital compliance traceability platform in Welchs supply chain. This innovation will deal with regulatory and operational complexity and will popularize farm to pack real-time transparency and positioning the processed fruits and vegetables sector to be more efficient and global.
- In July 2025, The J.R. Simplot Co. declared that it had acquired a frozen-potato processor, Clarebout Potatoes, in Belgium thereby forming a European network of 23 manufacturing plants. The acquisition increases the presence of Simplot in Europe and improves its supply chain integration to process 150,000 metric tons in each year locally to feed the domestic and export markets.
Report Scope
|
Detail |
|
|
Market Size in 2025 |
USD 193.7 Bn |
|
Market Forecast Value in 2035 |
USD 292.3 Bn |
|
Growth Rate (CAGR) |
4.2% |
|
Forecast Period |
2026 – 2035 |
|
Historical Data Available for |
2021 – 2024 |
|
Market Size Units |
US$ Billion for Value |
|
Report Format |
Electronic (PDF) + Excel |
|
North America |
Europe |
Asia Pacific |
Middle East |
Africa |
South America |
|
|
|
|
|
|
|
Companies Covered |
|||||
|
|
|
|
|
|
Processed-Fruits-and-Vegetables-Market Segmentation and Highlights
|
Segment |
Sub-segment |
|
Processed Fruits & Vegetables Market, By Product Type |
|
|
Processed Fruits & Vegetables Market, By Processing Technology |
|
|
Processed Fruits & Vegetables Market, By Packaging Type |
|
|
Processed Fruits & Vegetables Market, By Distribution Channel |
|
|
Processed Fruits & Vegetables Market, Nature/Organic Status |
|
|
Processed Fruits & Vegetables Market, By Applications |
|
Frequently Asked Questions
Table of Contents
- 1. Research Methodology and Assumptions
- 1.1. Definitions
- 1.2. Research Design and Approach
- 1.3. Data Collection Methods
- 1.4. Base Estimates and Calculations
- 1.5. Forecasting Models
- 1.5.1. Key Forecast Factors & Impact Analysis
- 1.6. Secondary Research
- 1.6.1. Open Sources
- 1.6.2. Paid Databases
- 1.6.3. Associations
- 1.7. Primary Research
- 1.7.1. Primary Sources
- 1.7.2. Primary Interviews with Stakeholders across Ecosystem
- 2. Executive Summary
- 2.1. Global Processed Fruits & Vegetables Market Outlook
- 2.1.1. Processed Fruits & Vegetables Market Size Value (US$ Bn), and Forecasts, 2021-2035
- 2.1.2. Compounded Annual Growth Rate Analysis
- 2.1.3. Growth Opportunity Analysis
- 2.1.4. Segmental Share Analysis
- 2.1.5. Geographical Share Analysis
- 2.2. Market Analysis and Facts
- 2.3. Supply-Demand Analysis
- 2.4. Competitive Benchmarking
- 2.5. Go-to- Market Strategy
- 2.5.1. Customer/ End-use Industry Assessment
- 2.5.2. Growth Opportunity Data, 2026-2035
- 2.5.2.1. Regional Data
- 2.5.2.2. Country Data
- 2.5.2.3. Segmental Data
- 2.5.3. Identification of Potential Market Spaces
- 2.5.4. GAP Analysis
- 2.5.5. Potential Attractive Price Points
- 2.5.6. Prevailing Market Risks & Challenges
- 2.5.7. Preferred Sales & Marketing Strategies
- 2.5.8. Key Recommendations and Analysis
- 2.5.9. A Way Forward
- 2.1. Global Processed Fruits & Vegetables Market Outlook
- 3. Industry Data and Premium Insights
- 3.1. Global Food & Beverages Industry Overview, 2025
- 3.1.1. Industry Ecosystem Analysis
- 3.1.2. Key Trends for Food & Beverages Industry
- 3.1.3. Regional Distribution for Food & Beverages Industry
- 3.2. Supplier Customer Data
- 3.3. Technology Roadmap and Developments
- 3.4. Trade Analysis
- 3.4.1. Import & Export Analysis, 2025
- 3.4.2. Top Importing Countries
- 3.4.3. Top Exporting Countries
- 3.5. Trump Tariff Impact Analysis
- 3.5.1. Manufacturer
- 3.5.1.1. Based on the component & Raw material
- 3.5.2. Supply Chain
- 3.5.3. End Consumer
- 3.5.1. Manufacturer
- 3.6. Raw Material Analysis
- 3.1. Global Food & Beverages Industry Overview, 2025
- 4. Market Overview
- 4.1. Market Dynamics
- 4.1.1. Drivers
- 4.1.1.1. Rising demand for convenient and ready-to-eat food products
- 4.1.1.2. Growth in global food processing and retail sectors
- 4.1.1.3. Increasing consumer awareness of healthy and nutritious diets.
- 4.1.2. Restraints
- 4.1.2.1. High processing and storage costs
- 4.1.2.2. Nutrient loss and quality degradation during processing.
- 4.1.1. Drivers
- 4.2. Key Trend Analysis
- 4.3. Regulatory Framework
- 4.3.1. Key Regulations, Norms, and Subsidies, by Key Countries
- 4.3.2. Tariffs and Standards
- 4.3.3. Impact Analysis of Regulations on the Market
- 4.4. Value Chain Analysis
- 4.4.1. Raw Material Suppliers
- 4.4.2. Manufacturing
- 4.4.3. Distribution
- 4.4.4. End-Use
- 4.5. Cost Structure Analysis
- 4.5.1. Parameter’s Share for Cost Associated
- 4.5.2. COGP vs COGS
- 4.5.3. Profit Margin Analysis
- 4.6. Pricing Analysis
- 4.6.1. Regional Pricing Analysis
- 4.6.2. Segmental Pricing Trends
- 4.6.3. Factors Influencing Pricing
- 4.7. Porter’s Five Forces Analysis
- 4.8. PESTEL Analysis
- 4.9. Global Processed Fruits & Vegetables Market Demand
- 4.9.1. Historical Market Size – Value (US$ Bn), 2020-2024
- 4.9.2. Current and Future Market Size – Value (US$ Bn), 2026–2035
- 4.9.2.1. Y-o-Y Growth Trends
- 4.9.2.2. Absolute $ Opportunity Assessment
- 4.1. Market Dynamics
- 5. Competition Landscape
- 5.1. Competition structure
- 5.1.1. Fragmented v/s consolidated
- 5.2. Company Share Analysis, 2025
- 5.2.1. Global Company Market Share
- 5.2.2. By Region
- 5.2.2.1. North America
- 5.2.2.2. Europe
- 5.2.2.3. Asia Pacific
- 5.2.2.4. Middle East
- 5.2.2.5. Africa
- 5.2.2.6. South America
- 5.3. Product Comparison Matrix
- 5.3.1. Specifications
- 5.3.2. Market Positioning
- 5.3.3. Pricing
- 5.1. Competition structure
- 6. Global Processed Fruits & Vegetables Market Analysis, by Product Type
- 6.1. Key Segment Analysis
- 6.2. Processed Fruits & Vegetables Market Size Value (US$ Bn), Analysis, and Forecasts, by Product Type, 2021-2035
- 6.2.1. Processed Fruits
- 6.2.1.1. Dried Fruits
- 6.2.1.2. Frozen Fruits
- 6.2.1.3. Canned Fruits
- 6.2.1.4. Fruit Juices & Concentrates
- 6.2.1.5. Fruit Purees & Pastes
- 6.2.1.6. Jams & Preserves
- 6.2.1.7. Others
- 6.2.2. Processed Vegetables
- 6.2.2.1. Dried Vegetables
- 6.2.2.2. Frozen Vegetables
- 6.2.2.3. Canned Vegetables
- 6.2.2.4. Vegetable Juices
- 6.2.2.5. Vegetable Purees & Pastes
- 6.2.2.6. Pickled Vegetables
- 6.2.2.7. Others
- 6.2.1. Processed Fruits
- 7. Global Processed Fruits & Vegetables Market Analysis, by Processing Technology
- 7.1. Key Segment Analysis
- 7.2. Processed Fruits & Vegetables Market Size Value (US$ Bn), Analysis, and Forecasts, by Processing Technology, 2021-2035
- 7.2.1. Thermal Processing
- 7.2.1.1. Pasteurization
- 7.2.1.2. Sterilization
- 7.2.1.3. Blanching
- 7.2.1.4. Others
- 7.2.2. Non-Thermal Processing
- 7.2.2.1. High-Pressure Processing (HPP)
- 7.2.2.2. Pulsed Electric Field (PEF)
- 7.2.2.3. Ultraviolet (UV) Treatment
- 7.2.2.4. Others
- 7.2.3. Dehydration
- 7.2.4. Freezing
- 7.2.5. Fermentation
- 7.2.6. Other Technologies
- 7.2.1. Thermal Processing
- 8. Global Processed Fruits & Vegetables Market Analysis, by Packaging Type
- 8.1. Key Segment Analysis
- 8.2. Processed Fruits & Vegetables Market Size Value (US$ Bn), Analysis, and Forecasts, by Packaging Type, 2021-2035
- 8.2.1. Cans
- 8.2.2. Glass Jars & Bottles
- 8.2.3. Pouches
- 8.2.4. Plastic Containers
- 8.2.5. Tetra Packs/Cartons
- 8.2.6. Flexible Packaging
- 9. Global Processed Fruits & Vegetables Market Analysis, by Distribution Channel
- 9.1. Key Segment Analysis
- 9.2. Processed Fruits & Vegetables Market Size Value (US$ Bn), Analysis, and Forecasts, by Distribution Channel, 2021-2035
- 9.2.1. Offline Channels
- 9.2.1.1. Supermarkets & Hypermarkets
- 9.2.1.2. Convenience Stores
- 9.2.1.3. Specialty Stores
- 9.2.1.4. Wholesale & Distributors
- 9.2.1.5. Others
- 9.2.2. Online Channels
- 9.2.1. Offline Channels
- 10. Global Processed Fruits & Vegetables Market Analysis, by Nature/Organic Status
- 10.1. Key Segment Analysis
- 10.2. Processed Fruits & Vegetables Market Size Value (US$ Bn), Analysis, and Forecasts, by Nature/Organic Status, 2021-2035
- 10.2.1. Conventional
- 10.2.2. Organic
- 10.2.3. Clean Label
- 10.2.4. Non-GMO
- 11. Global Processed Fruits & Vegetables Market Analysis, by Applications
- 11.1. Key Segment Analysis
- 11.2. Processed Fruits & Vegetables Market Size Value (US$ Bn), Analysis, and Forecasts, by Applications, 2021-2035
- 11.2.1. Food & Beverage
- 11.2.1.1. Bakery & Confectionery
- 11.2.1.2. Dairy Products
- 11.2.1.3. Beverages
- 11.2.1.4. Ready-to-Eat Meals
- 11.2.1.5. Snacks
- 11.2.1.6. Sauces & Condiments
- 11.2.1.7. Others
- 11.2.2. Food Service/HoReCa
- 11.2.2.1. Restaurants
- 11.2.2.2. Hotels
- 11.2.2.3. Catering Services
- 11.2.2.4. Quick Service Restaurants (QSR)
- 11.2.2.5. Others
- 11.2.3. Industrial Processing
- 11.2.3.1. Secondary Food Manufacturing
- 11.2.3.2. Pharmaceutical
- 11.2.3.3. Cosmetics & Personal Care
- 11.2.3.4. Others
- 11.2.4. Other Applications
- 11.2.1. Food & Beverage
- 12. Global Processed Fruits & Vegetables Market Analysis and Forecasts, by Region
- 12.1. Key Findings
- 12.2. Processed Fruits & Vegetables Market Size Value (US$ Bn), Analysis, and Forecasts, by Region, 2021-2035
- 12.2.1. North America
- 12.2.2. Europe
- 12.2.3. Asia Pacific
- 12.2.4. Middle East
- 12.2.5. Africa
- 12.2.6. South America
- 13. North America Processed Fruits & Vegetables Market Analysis
- 13.1. Key Segment Analysis
- 13.2. Regional Snapshot
- 13.3. North America Processed Fruits & Vegetables Market Size- Volume (Tons) and Value (US$ Bn), Analysis, and Forecasts, 2021-2035
- 13.3.1. Product Type
- 13.3.2. Processing Technology
- 13.3.3. Packaging Type
- 13.3.4. Distribution Channel
- 13.3.5. Nature/Organic Status
- 13.3.6. Applications
- 13.3.7. Country
- 13.3.7.1. USA
- 13.3.7.2. Canada
- 13.3.7.3. Mexico
- 13.4. USA Processed Fruits & Vegetables Market
- 13.4.1. Country Segmental Analysis
- 13.4.2. Product Type
- 13.4.3. Processing Technology
- 13.4.4. Packaging Type
- 13.4.5. Distribution Channel
- 13.4.6. Nature/Organic Status
- 13.4.7. Applications
- 13.5. Canada Processed Fruits & Vegetables Market
- 13.5.1. Country Segmental Analysis
- 13.5.2. Product Type
- 13.5.3. Processing Technology
- 13.5.4. Packaging Type
- 13.5.5. Distribution Channel
- 13.5.6. Nature/Organic Status
- 13.5.7. Applications
- 13.6. Mexico Processed Fruits & Vegetables Market
- 13.6.1. Country Segmental Analysis
- 13.6.2. Product Type
- 13.6.3. Processing Technology
- 13.6.4. Packaging Type
- 13.6.5. Distribution Channel
- 13.6.6. Nature/Organic Status
- 13.6.7. Applications
- 14. Europe Processed Fruits & Vegetables Market Analysis
- 14.1. Key Segment Analysis
- 14.2. Regional Snapshot
- 14.3. Europe Processed Fruits & Vegetables Market Size Value (US$ Bn), Analysis, and Forecasts, 2021-2035
- 14.3.1. Product Type
- 14.3.2. Processing Technology
- 14.3.3. Packaging Type
- 14.3.4. Distribution Channel
- 14.3.5. Nature/Organic Status
- 14.3.6. Applications
- 14.3.7. Country
- 14.3.7.1. Germany
- 14.3.7.2. United Kingdom
- 14.3.7.3. France
- 14.3.7.4. Italy
- 14.3.7.5. Spain
- 14.3.7.6. Netherlands
- 14.3.7.7. Nordic Countries
- 14.3.7.8. Poland
- 14.3.7.9. Russia & CIS
- 14.3.7.10. Rest of Europe
- 14.4. Germany Processed Fruits & Vegetables Market
- 14.4.1. Country Segmental Analysis
- 14.4.2. Product Type
- 14.4.3. Processing Technology
- 14.4.4. Packaging Type
- 14.4.5. Distribution Channel
- 14.4.6. Nature/Organic Status
- 14.4.7. Applications
- 14.5. United Kingdom Processed Fruits & Vegetables Market
- 14.5.1. Country Segmental Analysis
- 14.5.2. Product Type
- 14.5.3. Processing Technology
- 14.5.4. Packaging Type
- 14.5.5. Distribution Channel
- 14.5.6. Nature/Organic Status
- 14.5.7. Applications
- 14.6. France Processed Fruits & Vegetables Market
- 14.6.1. Country Segmental Analysis
- 14.6.2. Product Type
- 14.6.3. Processing Technology
- 14.6.4. Packaging Type
- 14.6.5. Distribution Channel
- 14.6.6. Nature/Organic Status
- 14.6.7. Applications
- 14.7. Italy Processed Fruits & Vegetables Market
- 14.7.1. Country Segmental Analysis
- 14.7.2. Product Type
- 14.7.3. Processing Technology
- 14.7.4. Packaging Type
- 14.7.5. Distribution Channel
- 14.7.6. Nature/Organic Status
- 14.7.7. Applications
- 14.8. Spain Processed Fruits & Vegetables Market
- 14.8.1. Country Segmental Analysis
- 14.8.2. Product Type
- 14.8.3. Processing Technology
- 14.8.4. Packaging Type
- 14.8.5. Distribution Channel
- 14.8.6. Nature/Organic Status
- 14.8.7. Applications
- 14.9. Netherlands Processed Fruits & Vegetables Market
- 14.9.1. Country Segmental Analysis
- 14.9.2. Product Type
- 14.9.3. Processing Technology
- 14.9.4. Packaging Type
- 14.9.5. Distribution Channel
- 14.9.6. Nature/Organic Status
- 14.9.7. Applications
- 14.10. Nordic Countries Processed Fruits & Vegetables Market
- 14.10.1. Country Segmental Analysis
- 14.10.2. Product Type
- 14.10.3. Processing Technology
- 14.10.4. Packaging Type
- 14.10.5. Distribution Channel
- 14.10.6. Nature/Organic Status
- 14.10.7. Applications
- 14.11. Poland Processed Fruits & Vegetables Market
- 14.11.1. Country Segmental Analysis
- 14.11.2. Product Type
- 14.11.3. Processing Technology
- 14.11.4. Packaging Type
- 14.11.5. Distribution Channel
- 14.11.6. Nature/Organic Status
- 14.11.7. Applications
- 14.12. Russia & CIS Processed Fruits & Vegetables Market
- 14.12.1. Country Segmental Analysis
- 14.12.2. Product Type
- 14.12.3. Processing Technology
- 14.12.4. Packaging Type
- 14.12.5. Distribution Channel
- 14.12.6. Nature/Organic Status
- 14.12.7. Applications
- 14.13. Rest of Europe Processed Fruits & Vegetables Market
- 14.13.1. Country Segmental Analysis
- 14.13.2. Product Type
- 14.13.3. Processing Technology
- 14.13.4. Packaging Type
- 14.13.5. Distribution Channel
- 14.13.6. Nature/Organic Status
- 14.13.7. Applications
- 15. Asia Pacific Processed Fruits & Vegetables Market Analysis
- 15.1. Key Segment Analysis
- 15.2. Regional Snapshot
- 15.3. Asia Pacific Processed Fruits & Vegetables Market Size Value (US$ Bn), Analysis, and Forecasts, 2021-2035
- 15.3.1. Product Type
- 15.3.2. Processing Technology
- 15.3.3. Packaging Type
- 15.3.4. Distribution Channel
- 15.3.5. Nature/Organic Status
- 15.3.6. Applications
- 15.3.7. Country
- 15.3.7.1. China
- 15.3.7.2. India
- 15.3.7.3. Japan
- 15.3.7.4. South Korea
- 15.3.7.5. Australia and New Zealand
- 15.3.7.6. Indonesia
- 15.3.7.7. Malaysia
- 15.3.7.8. Thailand
- 15.3.7.9. Vietnam
- 15.3.7.10. Rest of Asia Pacific
- 15.4. China Processed Fruits & Vegetables Market
- 15.4.1. Country Segmental Analysis
- 15.4.2. Product Type
- 15.4.3. Processing Technology
- 15.4.4. Packaging Type
- 15.4.5. Distribution Channel
- 15.4.6. Nature/Organic Status
- 15.4.7. Applications
- 15.5. India Processed Fruits & Vegetables Market
- 15.5.1. Country Segmental Analysis
- 15.5.2. Product Type
- 15.5.3. Processing Technology
- 15.5.4. Packaging Type
- 15.5.5. Distribution Channel
- 15.5.6. Nature/Organic Status
- 15.5.7. Applications
- 15.6. Japan Processed Fruits & Vegetables Market
- 15.6.1. Country Segmental Analysis
- 15.6.2. Product Type
- 15.6.3. Processing Technology
- 15.6.4. Packaging Type
- 15.6.5. Distribution Channel
- 15.6.6. Nature/Organic Status
- 15.6.7. Applications
- 15.7. South Korea Processed Fruits & Vegetables Market
- 15.7.1. Country Segmental Analysis
- 15.7.2. Product Type
- 15.7.3. Processing Technology
- 15.7.4. Packaging Type
- 15.7.5. Distribution Channel
- 15.7.6. Nature/Organic Status
- 15.7.7. Applications
- 15.8. Australia and New Zealand Processed Fruits & Vegetables Market
- 15.8.1. Country Segmental Analysis
- 15.8.2. Product Type
- 15.8.3. Processing Technology
- 15.8.4. Packaging Type
- 15.8.5. Distribution Channel
- 15.8.6. Nature/Organic Status
- 15.8.7. Applications
- 15.9. Indonesia Processed Fruits & Vegetables Market
- 15.9.1. Country Segmental Analysis
- 15.9.2. Product Type
- 15.9.3. Processing Technology
- 15.9.4. Packaging Type
- 15.9.5. Distribution Channel
- 15.9.6. Nature/Organic Status
- 15.9.7. Applications
- 15.10. Malaysia Processed Fruits & Vegetables Market
- 15.10.1. Country Segmental Analysis
- 15.10.2. Product Type
- 15.10.3. Processing Technology
- 15.10.4. Packaging Type
- 15.10.5. Distribution Channel
- 15.10.6. Nature/Organic Status
- 15.10.7. Applications
- 15.11. Thailand Processed Fruits & Vegetables Market
- 15.11.1. Country Segmental Analysis
- 15.11.2. Product Type
- 15.11.3. Processing Technology
- 15.11.4. Packaging Type
- 15.11.5. Distribution Channel
- 15.11.6. Nature/Organic Status
- 15.11.7. Applications
- 15.12. Vietnam Processed Fruits & Vegetables Market
- 15.12.1. Country Segmental Analysis
- 15.12.2. Product Type
- 15.12.3. Processing Technology
- 15.12.4. Packaging Type
- 15.12.5. Distribution Channel
- 15.12.6. Nature/Organic Status
- 15.12.7. Applications
- 15.13. Rest of Asia Pacific Processed Fruits & Vegetables Market
- 15.13.1. Country Segmental Analysis
- 15.13.2. Product Type
- 15.13.3. Processing Technology
- 15.13.4. Packaging Type
- 15.13.5. Distribution Channel
- 15.13.6. Nature/Organic Status
- 15.13.7. Applications
- 16. Middle East Processed Fruits & Vegetables Market Analysis
- 16.1. Key Segment Analysis
- 16.2. Regional Snapshot
- 16.3. Middle East Processed Fruits & Vegetables Market Size Value (US$ Bn), Analysis, and Forecasts, 2021-2035
- 16.3.1. Product Type
- 16.3.2. Processing Technology
- 16.3.3. Packaging Type
- 16.3.4. Distribution Channel
- 16.3.5. Nature/Organic Status
- 16.3.6. Applications
- 16.3.7. Country
- 16.3.7.1. Turkey
- 16.3.7.2. UAE
- 16.3.7.3. Saudi Arabia
- 16.3.7.4. Israel
- 16.3.7.5. Rest of Middle East
- 16.4. Turkey Processed Fruits & Vegetables Market
- 16.4.1. Country Segmental Analysis
- 16.4.2. Product Type
- 16.4.3. Processing Technology
- 16.4.4. Packaging Type
- 16.4.5. Distribution Channel
- 16.4.6. Nature/Organic Status
- 16.4.7. Applications
- 16.5. UAE Processed Fruits & Vegetables Market
- 16.5.1. Country Segmental Analysis
- 16.5.2. Product Type
- 16.5.3. Processing Technology
- 16.5.4. Packaging Type
- 16.5.5. Distribution Channel
- 16.5.6. Nature/Organic Status
- 16.5.7. Applications
- 16.6. Saudi Arabia Processed Fruits & Vegetables Market
- 16.6.1. Country Segmental Analysis
- 16.6.2. Product Type
- 16.6.3. Processing Technology
- 16.6.4. Packaging Type
- 16.6.5. Distribution Channel
- 16.6.6. Nature/Organic Status
- 16.6.7. Applications
- 16.7. Israel Processed Fruits & Vegetables Market
- 16.7.1. Country Segmental Analysis
- 16.7.2. Product Type
- 16.7.3. Processing Technology
- 16.7.4. Packaging Type
- 16.7.5. Distribution Channel
- 16.7.6. Nature/Organic Status
- 16.7.7. Applications
- 16.8. Rest of Middle East Processed Fruits & Vegetables Market
- 16.8.1. Country Segmental Analysis
- 16.8.2. Product Type
- 16.8.3. Processing Technology
- 16.8.4. Packaging Type
- 16.8.5. Distribution Channel
- 16.8.6. Nature/Organic Status
- 16.8.7. Applications
- 17. Africa Processed Fruits & Vegetables Market Analysis
- 17.1. Key Segment Analysis
- 17.2. Regional Snapshot
- 17.3. Africa Processed Fruits & Vegetables Market Size Value (US$ Bn), Analysis, and Forecasts, 2021-2035
- 17.3.1. Product Type
- 17.3.2. Processing Technology
- 17.3.3. Packaging Type
- 17.3.4. Distribution Channel
- 17.3.5. Nature/Organic Status
- 17.3.6. Applications
- 17.3.7. Country
- 17.3.7.1. South Africa
- 17.3.7.2. Egypt
- 17.3.7.3. Nigeria
- 17.3.7.4. Algeria
- 17.3.7.5. Rest of Africa
- 17.4. South Africa Processed Fruits & Vegetables Market
- 17.4.1. Country Segmental Analysis
- 17.4.2. Product Type
- 17.4.3. Processing Technology
- 17.4.4. Packaging Type
- 17.4.5. Distribution Channel
- 17.4.6. Nature/Organic Status
- 17.4.7. Applications
- 17.5. Egypt Processed Fruits & Vegetables Market
- 17.5.1. Country Segmental Analysis
- 17.5.2. Product Type
- 17.5.3. Processing Technology
- 17.5.4. Packaging Type
- 17.5.5. Distribution Channel
- 17.5.6. Nature/Organic Status
- 17.5.7. Applications
- 17.6. Nigeria Processed Fruits & Vegetables Market
- 17.6.1. Country Segmental Analysis
- 17.6.2. Product Type
- 17.6.3. Processing Technology
- 17.6.4. Packaging Type
- 17.6.5. Distribution Channel
- 17.6.6. Nature/Organic Status
- 17.6.7. Applications
- 17.7. Algeria Processed Fruits & Vegetables Market
- 17.7.1. Country Segmental Analysis
- 17.7.2. Product Type
- 17.7.3. Processing Technology
- 17.7.4. Packaging Type
- 17.7.5. Distribution Channel
- 17.7.6. Nature/Organic Status
- 17.7.7. Applications
- 17.8. Rest of Africa Processed Fruits & Vegetables Market
- 17.8.1. Country Segmental Analysis
- 17.8.2. Product Type
- 17.8.3. Processing Technology
- 17.8.4. Packaging Type
- 17.8.5. Distribution Channel
- 17.8.6. Nature/Organic Status
- 17.8.7. Applications
- 18. South America Processed Fruits & Vegetables Market Analysis
- 18.1. Key Segment Analysis
- 18.2. Regional Snapshot
- 18.3. South America Processed Fruits & Vegetables Market Size Value (US$ Bn), Analysis, and Forecasts, 2021-2035
- 18.3.1. Product Type
- 18.3.2. Processing Technology
- 18.3.3. Packaging Type
- 18.3.4. Distribution Channel
- 18.3.5. Nature/Organic Status
- 18.3.6. Applications
- 18.3.7. Country
- 18.3.7.1. Brazil
- 18.3.7.2. Argentina
- 18.3.7.3. Rest of South America
- 18.4. Brazil Processed Fruits & Vegetables Market
- 18.4.1. Country Segmental Analysis
- 18.4.2. Product Type
- 18.4.3. Processing Technology
- 18.4.4. Packaging Type
- 18.4.5. Distribution Channel
- 18.4.6. Nature/Organic Status
- 18.4.7. Applications
- 18.5. Argentina Processed Fruits & Vegetables Market
- 18.5.1. Country Segmental Analysis
- 18.5.2. Product Type
- 18.5.3. Processing Technology
- 18.5.4. Packaging Type
- 18.5.5. Distribution Channel
- 18.5.6. Nature/Organic Status
- 18.5.7. Applications
- 18.6. Rest of South America Processed Fruits & Vegetables Market
- 18.6.1. Country Segmental Analysis
- 18.6.2. Product Type
- 18.6.3. Processing Technology
- 18.6.4. Packaging Type
- 18.6.5. Distribution Channel
- 18.6.6. Nature/Organic Status
- 18.6.7. Applications
- 19. Key Players/ Company Profile
- 19.1. Ardo Group.
- 19.1.1. Company Details/ Overview
- 19.1.2. Company Financials
- 19.1.3. Key Customers and Competitors
- 19.1.4. Business/ Industry Portfolio
- 19.1.5. Product Portfolio/ Specification Details
- 19.1.6. Pricing Data
- 19.1.7. Strategic Overview
- 19.1.8. Recent Developments
- 19.2. B&G Foods, Inc.
- 19.3. Bonduelle Group
- 19.4. Capricorn Food Products India Ltd.
- 19.5. Conagra Brands, Inc.
- 19.6. Del Monte Foods, Inc.
- 19.7. Dole Food Company, Inc.
- 19.8. Greenyard NV
- 19.9. Guimarra Companies
- 19.10. Nestlé S.A.
- 19.11. Olam International Limited
- 19.12. Pinnacle Foods Inc.
- 19.13. Seneca Foods Corporation
- 19.14. Simplot Australia Pty Ltd.
- 19.15. SunOpta Inc.
- 19.16. Sysco Corporation
- 19.17. The Kraft Heinz Company
- 19.18. The Schwan Food Company
- 19.19. Titan Frozen Fruit
- 19.20. Welch Foods Inc.
- 19.21. Other Key Players
- 19.1. Ardo Group.
Note* - This is just tentative list of players. While providing the report, we will cover more number of players based on their revenue and share for each geography
Research Design
Our research design integrates both demand-side and supply-side analysis through a balanced combination of primary and secondary research methodologies. By utilizing both bottom-up and top-down approaches alongside rigorous data triangulation methods, we deliver robust market intelligence that supports strategic decision-making.
MarketGenics' comprehensive research design framework ensures the delivery of accurate, reliable, and actionable market intelligence. Through the integration of multiple research approaches, rigorous validation processes, and expert analysis, we provide our clients with the insights needed to make informed strategic decisions and capitalize on market opportunities.

MarketGenics leverages a dedicated industry panel of experts and a comprehensive suite of paid databases to effectively collect, consolidate, and analyze market intelligence.
Our approach has consistently proven to be reliable and effective in generating accurate market insights, identifying key industry trends, and uncovering emerging business opportunities.
Through both primary and secondary research, we capture and analyze critical company-level data such as manufacturing footprints, including technical centers, R&D facilities, sales offices, and headquarters.
Our expert panel further enhances our ability to estimate market size for specific brands based on validated field-level intelligence.
Our data mining techniques incorporate both parametric and non-parametric methods, allowing for structured data collection, sorting, processing, and cleaning.
Demand projections are derived from large-scale data sets analyzed through proprietary algorithms, culminating in robust and reliable market sizing.
Research Approach
The bottom-up approach builds market estimates by starting with the smallest addressable market units and systematically aggregating them to create comprehensive market size projections.
This method begins with specific, granular data points and builds upward to create the complete market landscape.
Customer Analysis → Segmental Analysis → Geographical Analysis
The top-down approach starts with the broadest possible market data and systematically narrows it down through a series of filters and assumptions to arrive at specific market segments or opportunities.
This method begins with the big picture and works downward to increasingly specific market slices.
TAM → SAM → SOM


Research Methods
Desk / Secondary Research
While analysing the market, we extensively study secondary sources, directories, and databases to identify and collect information useful for this technical, market-oriented, and commercial report. Secondary sources that we utilize are not only the public sources, but it is a combination of Open Source, Associations, Paid Databases, MG Repository & Knowledgebase, and others.
- Company websites, annual reports, financial reports, broker reports, and investor presentations
- National government documents, statistical databases and reports
- News articles, press releases and web-casts specific to the companies operating in the market, Magazines, reports, and others
- We gather information from commercial data sources for deriving company specific data such as segmental revenue, share for geography, product revenue, and others
- Internal and external proprietary databases (industry-specific), relevant patent, and regulatory databases
- Governing Bodies, Government Organizations
- Relevant Authorities, Country-specific Associations for Industries
We also employ the model mapping approach to estimate the product level market data through the players' product portfolio
Primary Research
Primary research/ interviews is vital in analyzing the market. Most of the cases involves paid primary interviews. Primary sources include primary interviews through e-mail interactions, telephonic interviews, surveys as well as face-to-face interviews with the different stakeholders across the value chain including several industry experts.
| Type of Respondents | Number of Primaries |
|---|---|
| Tier 2/3 Suppliers | ~20 |
| Tier 1 Suppliers | ~25 |
| End-users | ~25 |
| Industry Expert/ Panel/ Consultant | ~30 |
| Total | ~100 |
MG Knowledgebase
• Repository of industry blog, newsletter and case studies
• Online platform covering detailed market reports, and company profiles
Forecasting Factors and Models
Forecasting Factors
- Historical Trends – Past market patterns, cycles, and major events that shaped how markets behave over time. Understanding past trends helps predict future behavior.
- Industry Factors – Specific characteristics of the industry like structure, regulations, and innovation cycles that affect market dynamics.
- Macroeconomic Factors – Economic conditions like GDP growth, inflation, and employment rates that affect how much money people have to spend.
- Demographic Factors – Population characteristics like age, income, and location that determine who can buy your product.
- Technology Factors – How quickly people adopt new technology and how much technology infrastructure exists.
- Regulatory Factors – Government rules, laws, and policies that can help or restrict market growth.
- Competitive Factors – Analyzing competition structure such as degree of competition and bargaining power of buyers and suppliers.
Forecasting Models / Techniques
Multiple Regression Analysis
- Identify and quantify factors that drive market changes
- Statistical modeling to establish relationships between market drivers and outcomes
Time Series Analysis – Seasonal Patterns
- Understand regular cyclical patterns in market demand
- Advanced statistical techniques to separate trend, seasonal, and irregular components
Time Series Analysis – Trend Analysis
- Identify underlying market growth patterns and momentum
- Statistical analysis of historical data to project future trends
Expert Opinion – Expert Interviews
- Gather deep industry insights and contextual understanding
- In-depth interviews with key industry stakeholders
Multi-Scenario Development
- Prepare for uncertainty by modeling different possible futures
- Creating optimistic, pessimistic, and most likely scenarios
Time Series Analysis – Moving Averages
- Sophisticated forecasting for complex time series data
- Auto-regressive integrated moving average models with seasonal components
Econometric Models
- Apply economic theory to market forecasting
- Sophisticated economic models that account for market interactions
Expert Opinion – Delphi Method
- Harness collective wisdom of industry experts
- Structured, multi-round expert consultation process
Monte Carlo Simulation
- Quantify uncertainty and probability distributions
- Thousands of simulations with varying input parameters
Research Analysis
Our research framework is built upon the fundamental principle of validating market intelligence from both demand and supply perspectives. This dual-sided approach ensures comprehensive market understanding and reduces the risk of single-source bias.
Demand-Side Analysis: We understand end-user/application behavior, preferences, and market needs along with the penetration of the product for specific application.
Supply-Side Analysis: We estimate overall market revenue, analyze the segmental share along with industry capacity, competitive landscape, and market structure.
Validation & Evaluation
Data triangulation is a validation technique that uses multiple methods, sources, or perspectives to examine the same research question, thereby increasing the credibility and reliability of research findings. In market research, triangulation serves as a quality assurance mechanism that helps identify and minimize bias, validate assumptions, and ensure accuracy in market estimates.
- Data Source Triangulation – Using multiple data sources to examine the same phenomenon
- Methodological Triangulation – Using multiple research methods to study the same research question
- Investigator Triangulation – Using multiple researchers or analysts to examine the same data
- Theoretical Triangulation – Using multiple theoretical perspectives to interpret the same data

Custom Market Research Services
We will customise the research for you, in case the report listed above does not meet your requirements.
Get 10% Free Customisation