Smart Home Devices Market Size, Share & Trends Analysis Report by Product Type (Smart Lighting, Smart HVAC Systems, Smart Security & Surveillance, Smart Kitchen Appliances, Smart Entertainment Devices, Smart Thermostats, Smart Locks & Access Control, Smart Plugs & Power Management, Wearable Devices, Smart Speakers & Voice Assistants), Connectivity, Technology Integration, Installation Type, Application, End-user, Distribution Channel, and Geography (North America, Europe, Asia Pacific, Middle East, Africa, and South America) – Global Industry Data, Trends, and Forecasts, 2026–2035
|
|
|
Segmental Data Insights |
|
|
Demand Trends |
|
|
Competitive Landscape |
|
|
Strategic Development |
|
|
Future Outlook & Opportunities |
|
Smart Home Devices Market Size, Share, and Growth
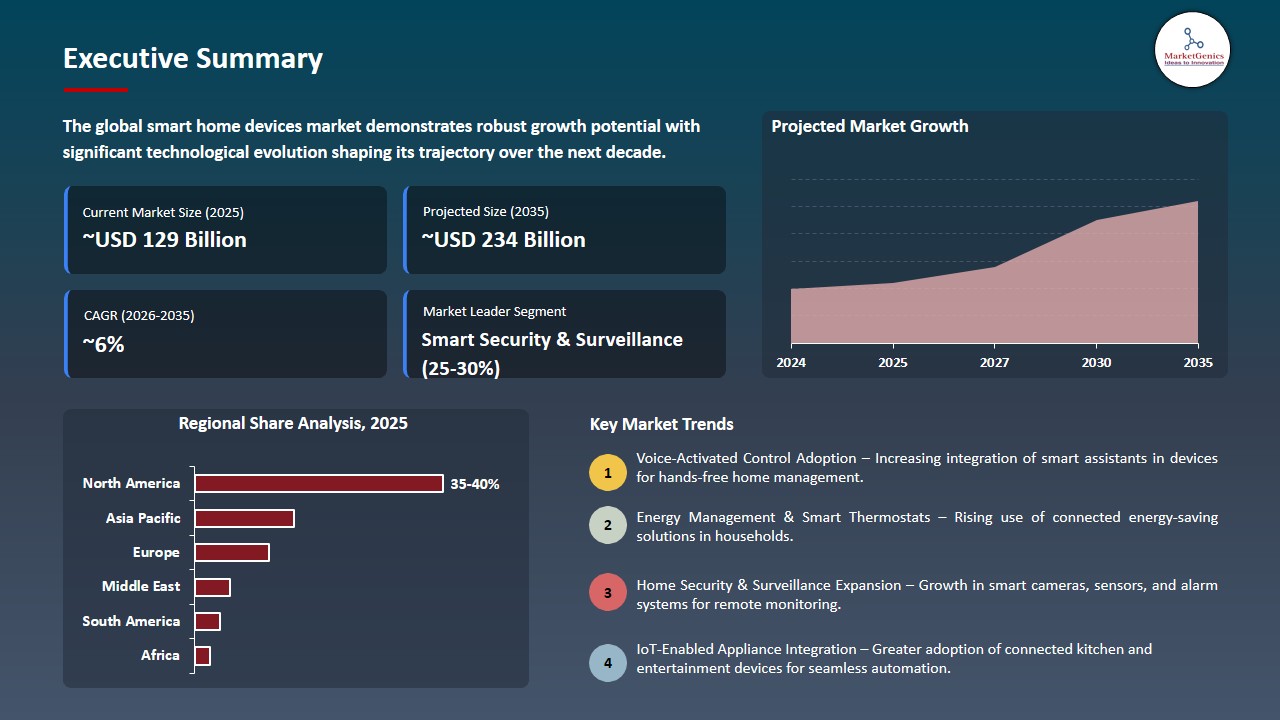
The global smart home devices market is witnessing strong growth, valued at USD 128.4 billion in 2025 and projected to reach USD 234.3 billion by 2035, expanding at a CAGR of 6.2% during the forecast period. Asia Pacific is the fastest-growing smart home devices market due to increasing urbanization, rising disposable incomes, and rapid adoption of connected IoT and AI-enabled home automation solutions.
Omar Khan, ADT Executive Vice President and Chief Business Officer, said, “This acquisition represents a major step forward in our vision to deliver a safer, smarter home that understands context, recognizes risk, and provides peace of mind, all while protecting customer privacy, by integrating AI sensing into the home, we plan to add a new intelligence layer, elevating traditional security and smart home capabilities by allowing ADT to verify human presence”
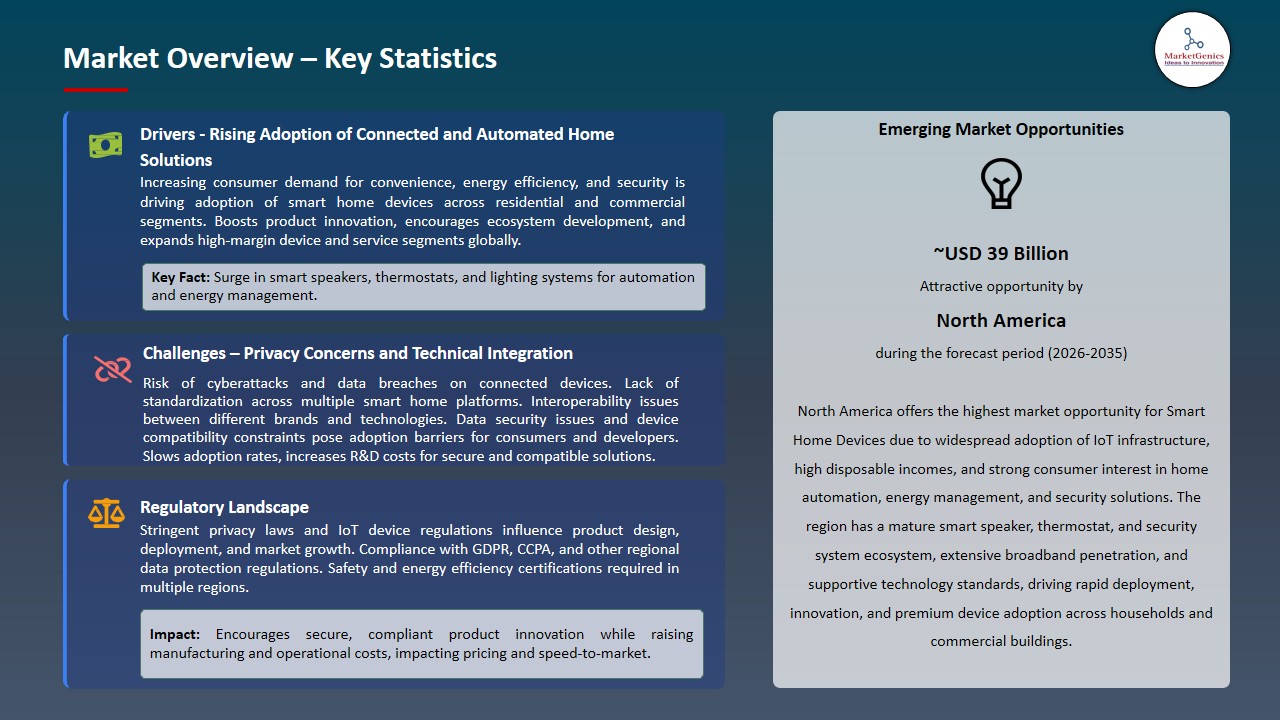
The increase in consumer preference of convenience, energy efficiency and security is pushing the global smart home devices market due to the development of connected IoT that enables households remotely control and monitor lighting, climate and appliances. The combination with AI and voice assistants will provide an even more positive user experience, allow automatic routines, predictive maintenance, and personalized interactions.
Xiaomi announced seven new products in September 2025 in the AIoT category, such as the Xiaomi Watch S4 41mm, Mi Robot Vacuum 5 series, Smart Camera C701, and Xiaomi TV S Pro Mini LED 2026. Likewise, in 2025, Ring launched its 4K Retinal Vision cameras and other AI-controlled options such as Alexa+ Greetings and Familiar Faces, which provided improved imagery, more intelligent automation, and greater security at the house. The innovations are creating smarter, more connected homes that make homes comfortably, safely and efficiently. The accelerated integration of AI and IoT is making the markets adopt and smart living to be an automated and intelligent ecosystem.
Adjacent opportunities to the smart home devices market include AI-powered home automation, energy management systems, wearable health monitors, connected kitchen appliances, and voice-assisted entertainment platforms. These sectors complement smart homes by enhancing convenience, sustainability, and personalization. Leveraging these adjacent markets can accelerate adoption, drive cross-device integration, and expand revenue streams for smart home ecosystem providers.
Smart Home Devices Market Dynamics and Trends
Driver: Rising Adoption of AI-Enabled Smart Home Devices Enhancing Consumer Convenience
-
The adoption of AI-driven smart home devices is one of the primary drivers of the market as these technologies make life easier and enhance home efficiency. Smart cameras, smart thermostats, voice-controlled assistants and other intelligent devices enable users to remotely automate routine operations, keep track of security and control energy usage.
- Mobile application and cloud system connection enables predictive value and real-time control, which improve convenience and personalization. The growing acceptance and market expansion are happening around the world as more consumers are embracing AI-powered ecosystems linking various devices to give them seamless interaction, energy savings, and greater comfort.
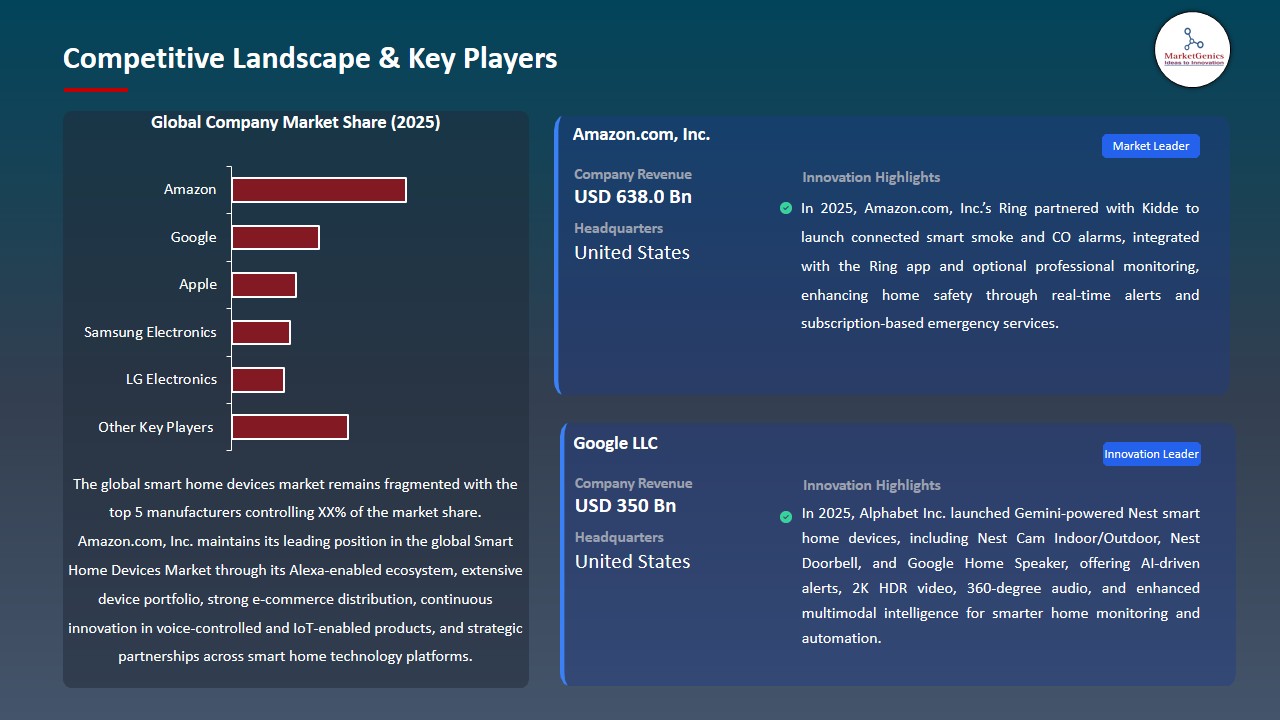
- In 2025, Google LLC introduced a next-generation AI assistant, Gemini for Home, which is compatible with Nest products, allowing control of the smart home without any inconvenience, personalized actions, and uninterrupted communication by hands-free voice dialogue via the Gemini Live service, and makes the smart home more convenient and intuitive.
- The proliferation of AI-powered smart home gadgets is pushing consumers to more convenient, energy-saving, and faster market expansion in the world arena.
Restraint: Data Privacy Concerns Limiting Consumer Adoption of Connected Devices
-
Data privacy concerns are progressively restricting the usage of connected smart home devices as consumers become more apprehensive of the way their personal data is gathered, stored, and utilized. Intelligent cameras, voice-assistants, and internet of things powered appliances tend to send sensitive information via cloud-networks, creating concerns of unauthorized access, hacking, and misuse by third parties.
- Regional regulatory frameworks are inconsistent, and both manufacturers and users are unsure of whether they are complying with the laws of data protection, such as GDPR in Europe or CCPA in North America. The consumer trust may be lost when there are cases of data breaches or misuse, which will discourage the adoption and slack market growth.
- Manufacturers should make it their priority that they have a very strong encryption, clear privacy policies, and control over their data to reduce the risk. The expansion of devices connected to homes can be crippled without a good idea of how to solve these issues and restrict the potential of the connected home ecosystem in the world.
- The data privacy concerns of consumers are limiting uptake of smart home devices which may slow the growth of the entire market.
Opportunity: Expansion of Voice-Controlled Smart Home Ecosystems
-
The increasing use of voice-controllable smart home items is a massive potential in the market, as it allows one to interact with numerous interconnected items easily. Home owners are in control of lighting, security, entertainment and appliances through the application of natural language which improves comfort and effectiveness.
- AI-based assistants can be integrated with third-party applications to create personal routines, suggestive recommendations, and automated daily routines, which will increase engagement and adoption. With the consumer preference moving to a hands-free, user-intuitive home control, a company that can have an interoperable voice ecosystem will be able to gain a bigger market of the smart home.
- In January 2025, Nice Home Management introduced Mylo, a native voice assistant on its Nice Home Management platform, providing smart home control that was context-aware, intuitive, and seamlessly updated, making it easier to use and ease the work of installers.
- The utilization of voice-controlled smart home systems is fueling market expansiveness through increased ease of use, interaction, and cohesiveness amongst the gadgets.
Key Trend: Personalized Entertainment and Home Media Solutions
-
The smart home devices market is changing with the increased demand of personalized entertainment and home media solutions. Consumers are becoming more and more interested in personalized delivery of content, in the opportunities of immersive audio-visual experiences, and in personalized recommendations based on their interests and preferences powered by AI.
- Smart televisions, streaming players and multi-room sound systems have become accessible to AI assistants and now one can control the content, set up the settings and have access to personalized recommendations with minimal effort. This trend boosts user interaction, increases the period of usage, and creates loyalty, which leads to innovation and adoption of the connected home entertainment ecologies around the world.
- Samsung Vision AI, a feature that uses artificial intelligence to design individualized screens, was introduced in 2025 by Samsung Electronics on its Neo QLED, OLED, QLED, and The Frame televisions, inspiring customized screens, real-time translations, content (Samsung) discovery, and immersive entertainment.
- The trend is increasing the use of smart home entertainment, which increases consumer engagement, loyalty, and growth in AI-powered connected media ecosystems.
Smart-Home-Devices-Market Analysis and Segmental Data
Smart Security & Surveillance Dominate Global Smart Home Devices Market
-
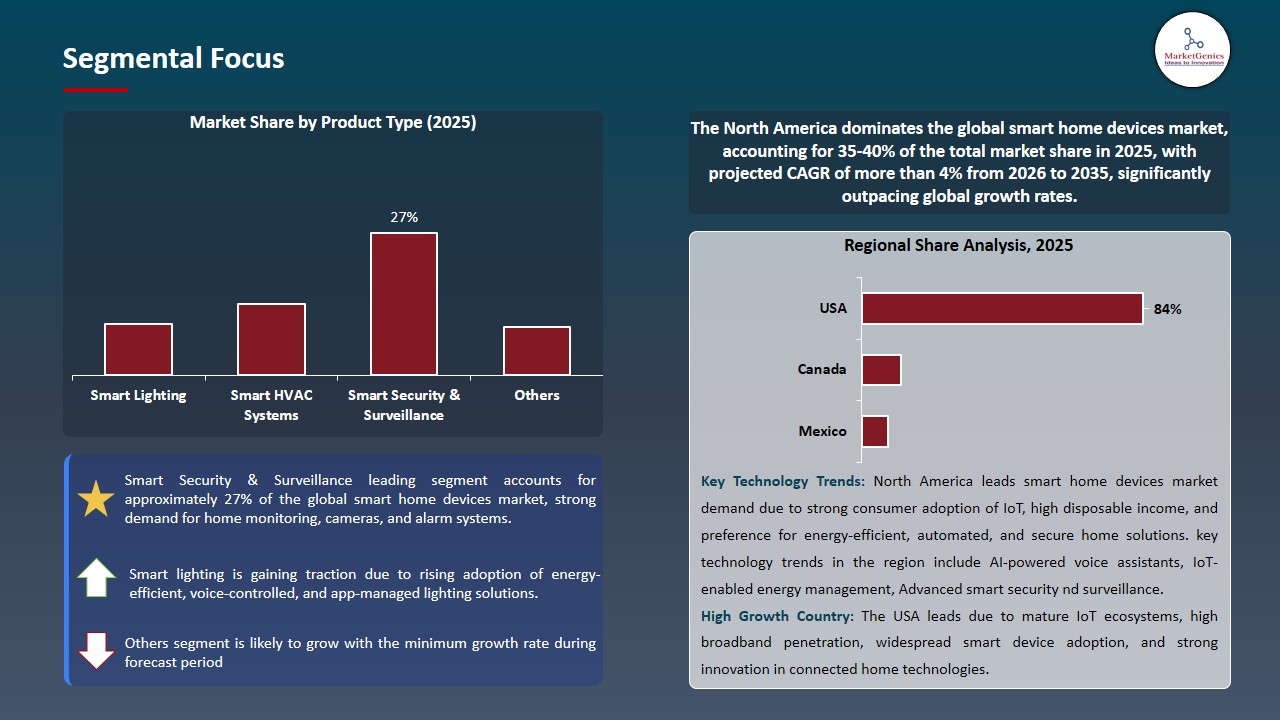
The smart security and surveillance market segment is the most prevalent in the smart home devices market globally, and it has the highest share because of the growing consumer interest in home safety and security of their property. Motion sensors, advanced cameras, smart door bells, and alarm management offer real time monitoring, remote access and automated alerts that improve general security and peace of mind.
- The combination of mobile applications, AI-driven analytics and cloud services enables homeowners to follow activity, identify faces and receive real-time notifications, which will accelerate adoption.
- In June 2025, TP-Link released the Tapo H500 hub that has 4K cameras, AI face tagging, and Matter support, capable of supporting 16 cameras and 64 sensors to provide extra security to the home.
- Increased awareness of security in preventing theft, along with the compatibility of smart homes and ecosystems, will make security solutions the most urgent and rapidly-adopted category of connected home technology.
North America Leads Global Smart Home Devices Market Demand
-
The North America region leads the global smart home devices market due to high consumer awareness, widespread adoption of connected technologies, and strong infrastructure supporting IoT ecosystems. Advanced broadband networks, mature retail channels, and early adoption of AI-powered devices enable seamless integration of smart home solutions across residential spaces.
- The trends of rising energy efficiency, domestic security, and convenience are driving the use of smart thermostats, smart lights, cameras, and voice assistants. Consumers with high tech tendencies apply pressure on a supply chain aiming to buy AI-enabled interoperable devices that can make their lives more comfortable and safer, and innovative companies concentrate on the introduction of new products with regional preferences in mind.
- Moreover, government incentives, smarter city programs, and the increasing investment in connected home infrastructure give North America an upper hand in the market, driving ongoing innovation and a fast increase in the use of smart home devices.
- North America dominance increases the pace of global market trends and establishes innovation and consumer expectations standards.
Smart-Home-Devices-Market Ecosystem
The global smart home devices market is consolidated, with leading players including Amazon, Google, Apple, Samsung Electronics, and LG Electronics. Competitive advantage is maintained by these companies due to vertically integrated hardware-software systems, proprietary operating systems, AI-driven automation, high-tech connectivity protocols, and vast networks of global distribution. This is enhanced by constant investments in AI-based automation of homes, voice-assistants, energy management systems, and partnering with telecom, cloud service and IoT solution companies.
Smart home devices value chain includes component suppliers (sensors, microcontrollers, cameras), device designing and manufacturing, operating system development, integrating applications ecosystem, cloud connectivity, retailing, and after sales services. Long-term engagement is increased with after-purchase services like cloud storage with a subscription, security measures, software updates, and ecosystem synchronization. Every step will have guaranteed compliance of the devices with each other, optimized energy use, and improve user experiences both in homes and organizations.
The barriers to entry are high because of brand loyalty, advanced research and development requirements, intellectual property portfolio, regulatory adherence and large-scale production capacities. The innovations like smart assistants powered by AI, voice-activated home hubs, automated security systems, and integration across devices are what promote differentiation, recurring revenues, and continued expansion of the market across the globe.
Recent Development and Strategic Overview:
-
In February 2026, ADT Inc. acquired Origin Wireless (Origin AI) to integrate its real-time AI sensing platform into ADT’s smart home ecosystem. The technology enables human presence and motion detection without cameras or wearables, enhancing security, occupancy analytics, and context-aware automation. This acquisition adds over 200 patents, strengthens privacy-conscious monitoring, and lays the foundation for next-generation intelligent home protection.
- In May 2025, Generac Holdings Inc. launched the ecobee by Generac Smart Thermostat Enhanced with Home Energy Management, integrating with Generac generators and PWRcell 2 solar storage. The system optimizes HVAC energy use, manages electrical loads during outages, and offers advanced occupancy sensing, delivering up to 26% savings on heating and cooling.
Report Scope
|
Detail |
|
|
Market Size in 2025 |
USD 128.4 Bn |
|
Market Forecast Value in 2035 |
USD 234.3 Bn |
|
Growth Rate (CAGR) |
6.2% |
|
Forecast Period |
2026 – 2035 |
|
Historical Data Available for |
2021 – 2024 |
|
Market Size Units |
US$ Billion for Value Million Units for Volume |
|
Report Format |
Electronic (PDF) + Excel |
|
North America |
Europe |
Asia Pacific |
Middle East |
Africa |
South America |
|
|
|
|
|
|
|
Companies Covered |
|||||
|
|
|
|
||
Smart-Wearables-Market Segmentation and Highlights
|
Segment |
Sub-segment |
|
Smart Home Devices Market, By Product Type |
|
|
Smart Home Devices Market, By Connectivity |
|
|
Smart Home Devices Market, By Technology Integration |
|
|
Smart Home Devices Market, By Installation Type |
|
|
Smart Home Devices Market, By Application |
|
|
Smart Home Devices Market, By End-user |
|
|
Smart Home Devices Market, By Distribution Channel |
|
Frequently Asked Questions
Table of Contents
- 1. Research Methodology and Assumptions
- 1.1. Definitions
- 1.2. Research Design and Approach
- 1.3. Data Collection Methods
- 1.4. Base Estimates and Calculations
- 1.5. Forecasting Models
- 1.5.1. Key Forecast Factors & Impact Analysis
- 1.6. Secondary Research
- 1.6.1. Open Sources
- 1.6.2. Paid Databases
- 1.6.3. Associations
- 1.7. Primary Research
- 1.7.1. Primary Sources
- 1.7.2. Primary Interviews with Stakeholders across Ecosystem
- 2. Executive Summary
- 2.1. Global Smart Home Devices Market Outlook
- 2.1.1. Smart Home Devices Market Size Volume (Million Units) and Value (US$ Bn), and Forecasts, 2021-2035
- 2.1.2. Compounded Annual Growth Rate Analysis
- 2.1.3. Growth Opportunity Analysis
- 2.1.4. Segmental Share Analysis
- 2.1.5. Geographical Share Analysis
- 2.2. Market Analysis and Facts
- 2.3. Supply-Demand Analysis
- 2.4. Competitive Benchmarking
- 2.5. Go-to- Market Strategy
- 2.5.1. Customer/ End-use Industry Assessment
- 2.5.2. Growth Opportunity Data, 2026-2035
- 2.5.2.1. Regional Data
- 2.5.2.2. Country Data
- 2.5.2.3. Segmental Data
- 2.5.3. Identification of Potential Market Spaces
- 2.5.4. GAP Analysis
- 2.5.5. Potential Attractive Price Points
- 2.5.6. Prevailing Market Risks & Challenges
- 2.5.7. Preferred Sales & Marketing Strategies
- 2.5.8. Key Recommendations and Analysis
- 2.5.9. A Way Forward
- 2.1. Global Smart Home Devices Market Outlook
- 3. Industry Data and Premium Insights
- 3.1. Global Consumer Goods & Services Industry Overview, 2025
- 3.1.1. Consumer Goods & Services Industry Ecosystem Analysis
- 3.1.2. Key Trends for Consumer Goods & Services Industry
- 3.1.3. Regional Distribution for Consumer Goods & Services Industry
- 3.2. Supplier Customer Data
- 3.3. Technology Roadmap and Developments
- 3.4. Trade Analysis
- 3.4.1. Import & Export Analysis, 2025
- 3.4.2. Top Importing Countries
- 3.4.3. Top Exporting Countries
- 3.5. Trump Tariff Impact Analysis
- 3.5.1. Manufacturer
- 3.5.1.1. Based on the component & Raw material
- 3.5.2. Supply Chain
- 3.5.3. End Consumer
- 3.5.1. Manufacturer
- 3.6. Raw Material Analysis
- 3.1. Global Consumer Goods & Services Industry Overview, 2025
- 4. Market Overview
- 4.1. Market Dynamics
- 4.1.1. Drivers
- 4.1.1.1. Increasing consumer demand for home automation, convenience, and energy efficiency.
- 4.1.1.2. Growing adoption of IoT-enabled devices and AI-powered smart assistants.
- 4.1.1.3. Rising awareness and investment in home security and remote monitoring solutions.
- 4.1.2. Restraints
- 4.1.2.1. Data privacy and cybersecurity concerns.
- 4.1.2.2. High initial costs and interoperability challenges across different device platforms.
- 4.1.1. Drivers
- 4.2. Key Trend Analysis
- 4.3. Regulatory Framework
- 4.3.1. Key Regulations, Norms, and Subsidies, by Key Countries
- 4.3.2. Tariffs and Standards
- 4.3.3. Impact Analysis of Regulations on the Market
- 4.4. Value Chain Analysis/ Ecosystem Analysis
- 4.4.1. Component Suppliers
- 4.4.2. Smart Home Devices Manufacturers
- 4.4.3. Distributors/ Channel Partners
- 4.4.4. End Users/ Customers
- 4.5. Cost Structure Analysis
- 4.5.1. Parameter’s Share for Cost Associated
- 4.5.2. COGP vs COGS
- 4.5.3. Profit Margin Analysis
- 4.6. Pricing Analysis
- 4.6.1. Regional Pricing Analysis
- 4.6.2. Segmental Pricing Trends
- 4.6.3. Factors Influencing Pricing
- 4.7. Porter’s Five Forces Analysis
- 4.8. PESTEL Analysis
- 4.9. Global Smart Home Devices Market Demand
- 4.9.1. Historical Market Size – Volume (Million Units) and Value (US$ Bn), 2020-2024
- 4.9.2. Current and Future Market Size - Volume (Million Units) and Value (US$ Bn), 2026–2035
- 4.9.2.1. Y-o-Y Growth Trends
- 4.9.2.2. Absolute $ Opportunity Assessment
- 4.1. Market Dynamics
- 5. Competition Landscape
- 5.1. Competition structure
- 5.1.1. Fragmented v/s consolidated
- 5.2. Company Share Analysis, 2025
- 5.2.1. Global Company Market Share
- 5.2.2. By Region
- 5.2.2.1. North America
- 5.2.2.2. Europe
- 5.2.2.3. Asia Pacific
- 5.2.2.4. Middle East
- 5.2.2.5. Africa
- 5.2.2.6. South America
- 5.3. Product Comparison Matrix
- 5.3.1. Specifications
- 5.3.2. Market Positioning
- 5.3.3. Pricing
- 5.1. Competition structure
- 6. Global Smart Home Devices Market Analysis, by Product Type
- 6.1. Key Segment Analysis
- 6.2. Smart Home Devices Market Size Volume (Million Units) and Value (US$ Bn), Analysis, and Forecasts, by Product Type, 2021-2035
- 6.2.1. Smart Lighting
- 6.2.2. Smart HVAC Systems
- 6.2.3. Smart Security & Surveillance
- 6.2.4. Smart Kitchen Appliances
- 6.2.5. Smart Entertainment Devices
- 6.2.6. Smart Thermostats
- 6.2.7. Smart Locks & Access Control
- 6.2.8. Smart Plugs & Power Management
- 6.2.9. Wearable Devices
- 6.2.10. Smart Speakers & Voice Assistants
- 7. Global Smart Home Devices Market Analysis, by Connectivity
- 7.1. Key Segment Analysis
- 7.2. Smart Home Devices Market Size Volume (Million Units) and Value (US$ Bn), Analysis, and Forecasts, by Connectivity, 2021-2035
- 7.2.1. WiFi-Based Devices
- 7.2.2. Bluetooth-Based Devices
- 7.2.3. Zigbee Protocol Devices
- 7.2.4. Z-Wave Protocol Devices
- 7.2.5. LoRaWAN Devices
- 7.2.6. NB-IoT Devices
- 7.2.7. 5G Connected Devices
- 7.2.8. Hybrid Multi-Protocol Devices
- 8. Global Smart Home Devices Market Analysis, by Technology Integration
- 8.1. Key Segment Analysis
- 8.2. Smart Home Devices Market Size Volume (Million Units) and Value (US$ Bn), Analysis, and Forecasts, by Technology Integration, 2021-2035
- 8.2.1. Voice Assistant–Integrate
- 8.2.2. ML–Enabled Adaptive Devices
- 8.2.3. Rule-Based Automation Devices
- 8.2.4. CV–Enabled Devices
- 8.2.5. GenAI–Integrated Smart Home Platforms
- 8.2.6. Edge AI–Powered Devices
- 8.2.7. Others
- 9. Global Smart Home Devices Market Analysis, by Installation Type
- 9.1. Key Segment Analysis
- 9.2. Smart Home Devices Market Size Volume (Million Units) and Value (US$ Bn), Analysis, and Forecasts, by Installation Type, 2021-2035
- 9.2.1. DIY Installation
- 9.2.2. Professional Installation
- 9.2.3. Pre-Installed
- 10. Global Smart Home Devices Market Analysis, by Application
- 10.1. Key Segment Analysis
- 10.2. Smart Home Devices Market Size Volume (Million Units) and Value (US$ Bn), Analysis, and Forecasts, by Application, 2021-2035
- 10.2.1. Lighting Control & Automation
- 10.2.2. Temperature & Climate Control
- 10.2.3. Security & Access Management
- 10.2.4. Energy Management & Monitoring
- 10.2.5. Entertainment & Media Control
- 10.2.6. Health & Wellness Monitoring
- 10.2.7. Appliance Control & Monitoring
- 10.2.8. Voice-Activated Control
- 10.2.9. Remote Monitoring & Notifications
- 10.2.10. Automated Scheduling & Routines
- 10.2.11. Others
- 11. Global Smart Home Devices Market Analysis, by End-user
- 11.1. Key Segment Analysis
- 11.2. Smart Home Devices Market Size Volume (Million Units) and Value (US$ Bn), Analysis, and Forecasts, by End-user, 2021-2035
- 11.2.1. Residential
- 11.2.2. Hospitality Sector
- 11.2.3. Healthcare Facilities
- 11.2.4. Commercial Office Buildings
- 11.2.5. Retail & Shopping Centers
- 11.2.6. Educational Institutions
- 11.2.7. Manufacturing & Industrial Facilities
- 11.2.8. Government & Public Buildings
- 11.2.9. Elderly Care & Assisted Living Facilities
- 11.2.10. Others
- 12. Global Smart Home Devices Market Analysis, by Distribution Channel
- 12.1. Key Segment Analysis
- 12.2. Smart Home Devices Market Size Volume (Million Units) and Value (US$ Bn), Analysis, and Forecasts, by Distribution Channel, 2021-2035
- 12.2.1. Direct-to-Consumer Sales
- 12.2.2. Electronics Retail Chains
- 12.2.3. Department Stores
- 12.2.4. Online E-Commerce Platforms
- 12.2.5. Specialty Stores
- 13. Global Smart Home Devices Market Analysis and Forecasts, by Region
- 13.1. Key Findings
- 13.2. Smart Home Devices Market Size Volume (Million Units) and Value (US$ Bn), Analysis, and Forecasts, by Region, 2021-2035
- 13.2.1. North America
- 13.2.2. Europe
- 13.2.3. Asia Pacific
- 13.2.4. Middle East
- 13.2.5. Africa
- 13.2.6. South America
- 14. North America Smart Home Devices Market Analysis
- 14.1. Key Segment Analysis
- 14.2. Regional Snapshot
- 14.3. North America Smart Home Devices Market Size- Volume (Million Units) and Value (US$ Bn), Analysis, and Forecasts, 2021-2035
- 14.3.1. Product Type
- 14.3.2. Connectivity
- 14.3.3. Technology Integration
- 14.3.4. Installation Type
- 14.3.5. Application
- 14.3.6. End-user
- 14.3.7. Distribution Channel
- 14.3.8. Country
- 14.3.8.1. USA
- 14.3.8.2. Canada
- 14.3.8.3. Mexico
- 14.4. USA Smart Home Devices Market
- 14.4.1. Country Segmental Analysis
- 14.4.2. Product Type
- 14.4.3. Connectivity
- 14.4.4. Technology Integration
- 14.4.5. Installation Type
- 14.4.6. Application
- 14.4.7. End-user
- 14.4.8. Distribution Channel
- 14.5. Canada Smart Home Devices Market
- 14.5.1. Country Segmental Analysis
- 14.5.2. Product Type
- 14.5.3. Connectivity
- 14.5.4. Technology Integration
- 14.5.5. Installation Type
- 14.5.6. Application
- 14.5.7. End-user
- 14.5.8. Distribution Channel
- 14.6. Mexico Smart Home Devices Market
- 14.6.1. Country Segmental Analysis
- 14.6.2. Product Type
- 14.6.3. Connectivity
- 14.6.4. Technology Integration
- 14.6.5. Installation Type
- 14.6.6. Application
- 14.6.7. End-user
- 14.6.8. Distribution Channel
- 15. Europe Smart Home Devices Market Analysis
- 15.1. Key Segment Analysis
- 15.2. Regional Snapshot
- 15.3. Europe Smart Home Devices Market Size Volume (Million Units) and Value (US$ Bn), Analysis, and Forecasts, 2021-2035
- 15.3.1. Product Type
- 15.3.2. Connectivity
- 15.3.3. Technology Integration
- 15.3.4. Installation Type
- 15.3.5. Application
- 15.3.6. End-user
- 15.3.7. Distribution Channel
- 15.3.8. Country
- 15.3.8.1. Germany
- 15.3.8.2. United Kingdom
- 15.3.8.3. France
- 15.3.8.4. Italy
- 15.3.8.5. Spain
- 15.3.8.6. Netherlands
- 15.3.8.7. Nordic Countries
- 15.3.8.8. Poland
- 15.3.8.9. Russia & CIS
- 15.3.8.10. Rest of Europe
- 15.4. Germany Smart Home Devices Market
- 15.4.1. Country Segmental Analysis
- 15.4.2. Product Type
- 15.4.3. Connectivity
- 15.4.4. Technology Integration
- 15.4.5. Installation Type
- 15.4.6. Application
- 15.4.7. End-user
- 15.4.8. Distribution Channel
- 15.5. United Kingdom Smart Home Devices Market
- 15.5.1. Country Segmental Analysis
- 15.5.2. Product Type
- 15.5.3. Connectivity
- 15.5.4. Technology Integration
- 15.5.5. Installation Type
- 15.5.6. Application
- 15.5.7. End-user
- 15.5.8. Distribution Channel
- 15.6. France Smart Home Devices Market
- 15.6.1. Country Segmental Analysis
- 15.6.2. Product Type
- 15.6.3. Connectivity
- 15.6.4. Technology Integration
- 15.6.5. Installation Type
- 15.6.6. Application
- 15.6.7. End-user
- 15.6.8. Distribution Channel
- 15.7. Italy Smart Home Devices Market
- 15.7.1. Country Segmental Analysis
- 15.7.2. Product Type
- 15.7.3. Connectivity
- 15.7.4. Technology Integration
- 15.7.5. Installation Type
- 15.7.6. Application
- 15.7.7. End-user
- 15.7.8. Distribution Channel
- 15.8. Spain Smart Home Devices Market
- 15.8.1. Country Segmental Analysis
- 15.8.2. Product Type
- 15.8.3. Connectivity
- 15.8.4. Technology Integration
- 15.8.5. Installation Type
- 15.8.6. Application
- 15.8.7. End-user
- 15.8.8. Distribution Channel
- 15.9. Netherlands Smart Home Devices Market
- 15.9.1. Country Segmental Analysis
- 15.9.2. Product Type
- 15.9.3. Connectivity
- 15.9.4. Technology Integration
- 15.9.5. Installation Type
- 15.9.6. Application
- 15.9.7. End-user
- 15.9.8. Distribution Channel
- 15.10. Nordic Countries Smart Home Devices Market
- 15.10.1. Country Segmental Analysis
- 15.10.2. Product Type
- 15.10.3. Connectivity
- 15.10.4. Technology Integration
- 15.10.5. Installation Type
- 15.10.6. Application
- 15.10.7. End-user
- 15.10.8. Distribution Channel
- 15.11. Poland Smart Home Devices Market
- 15.11.1. Country Segmental Analysis
- 15.11.2. Product Type
- 15.11.3. Connectivity
- 15.11.4. Technology Integration
- 15.11.5. Installation Type
- 15.11.6. Application
- 15.11.7. End-user
- 15.11.8. Distribution Channel
- 15.12. Russia & CIS Smart Home Devices Market
- 15.12.1. Country Segmental Analysis
- 15.12.2. Product Type
- 15.12.3. Connectivity
- 15.12.4. Technology Integration
- 15.12.5. Installation Type
- 15.12.6. Application
- 15.12.7. End-user
- 15.12.8. Distribution Channel
- 15.13. Rest of Europe Smart Home Devices Market
- 15.13.1. Country Segmental Analysis
- 15.13.2. Product Type
- 15.13.3. Connectivity
- 15.13.4. Technology Integration
- 15.13.5. Installation Type
- 15.13.6. Application
- 15.13.7. End-user
- 15.13.8. Distribution Channel
- 16. Asia Pacific Smart Home Devices Market Analysis
- 16.1. Key Segment Analysis
- 16.2. Regional Snapshot
- 16.3. Asia Pacific Smart Home Devices Market Size Volume (Million Units) and Value (US$ Bn), Analysis, and Forecasts, 2021-2035
- 16.3.1. Product Type
- 16.3.2. Connectivity
- 16.3.3. Technology Integration
- 16.3.4. Installation Type
- 16.3.5. Application
- 16.3.6. End-user
- 16.3.7. Distribution Channel
- 16.3.8. Country
- 16.3.8.1. China
- 16.3.8.2. India
- 16.3.8.3. Japan
- 16.3.8.4. South Korea
- 16.3.8.5. Australia and New Zealand
- 16.3.8.6. Indonesia
- 16.3.8.7. Malaysia
- 16.3.8.8. Thailand
- 16.3.8.9. Vietnam
- 16.3.8.10. Rest of Asia Pacific
- 16.4. China Smart Home Devices Market
- 16.4.1. Country Segmental Analysis
- 16.4.2. Product Type
- 16.4.3. Connectivity
- 16.4.4. Technology Integration
- 16.4.5. Installation Type
- 16.4.6. Application
- 16.4.7. End-user
- 16.4.8. Distribution Channel
- 16.5. India Smart Home Devices Market
- 16.5.1. Country Segmental Analysis
- 16.5.2. Product Type
- 16.5.3. Connectivity
- 16.5.4. Technology Integration
- 16.5.5. Installation Type
- 16.5.6. Application
- 16.5.7. End-user
- 16.5.8. Distribution Channel
- 16.6. Japan Smart Home Devices Market
- 16.6.1. Country Segmental Analysis
- 16.6.2. Product Type
- 16.6.3. Connectivity
- 16.6.4. Technology Integration
- 16.6.5. Installation Type
- 16.6.6. Application
- 16.6.7. End-user
- 16.6.8. Distribution Channel
- 16.7. South Korea Smart Home Devices Market
- 16.7.1. Country Segmental Analysis
- 16.7.2. Product Type
- 16.7.3. Connectivity
- 16.7.4. Technology Integration
- 16.7.5. Installation Type
- 16.7.6. Application
- 16.7.7. End-user
- 16.7.8. Distribution Channel
- 16.8. Australia and New Zealand Smart Home Devices Market
- 16.8.1. Country Segmental Analysis
- 16.8.2. Product Type
- 16.8.3. Connectivity
- 16.8.4. Technology Integration
- 16.8.5. Installation Type
- 16.8.6. Application
- 16.8.7. End-user
- 16.8.8. Distribution Channel
- 16.9. Indonesia Smart Home Devices Market
- 16.9.1. Country Segmental Analysis
- 16.9.2. Product Type
- 16.9.3. Connectivity
- 16.9.4. Technology Integration
- 16.9.5. Installation Type
- 16.9.6. Application
- 16.9.7. End-user
- 16.9.8. Distribution Channel
- 16.10. Malaysia Smart Home Devices Market
- 16.10.1. Country Segmental Analysis
- 16.10.2. Product Type
- 16.10.3. Connectivity
- 16.10.4. Technology Integration
- 16.10.5. Installation Type
- 16.10.6. Application
- 16.10.7. End-user
- 16.10.8. Distribution Channel
- 16.11. Thailand Smart Home Devices Market
- 16.11.1. Country Segmental Analysis
- 16.11.2. Product Type
- 16.11.3. Connectivity
- 16.11.4. Technology Integration
- 16.11.5. Installation Type
- 16.11.6. Application
- 16.11.7. End-user
- 16.11.8. Distribution Channel
- 16.12. Vietnam Smart Home Devices Market
- 16.12.1. Country Segmental Analysis
- 16.12.2. Product Type
- 16.12.3. Connectivity
- 16.12.4. Technology Integration
- 16.12.5. Installation Type
- 16.12.6. Application
- 16.12.7. End-user
- 16.12.8. Distribution Channel
- 16.13. Rest of Asia Pacific Smart Home Devices Market
- 16.13.1. Country Segmental Analysis
- 16.13.2. Product Type
- 16.13.3. Connectivity
- 16.13.4. Technology Integration
- 16.13.5. Installation Type
- 16.13.6. Application
- 16.13.7. End-user
- 16.13.8. Distribution Channel
- 17. Middle East Smart Home Devices Market Analysis
- 17.1. Key Segment Analysis
- 17.2. Regional Snapshot
- 17.3. Middle East Smart Home Devices Market Size Volume (Million Units) and Value (US$ Bn), Analysis, and Forecasts, 2021-2035
- 17.3.1. Product Type
- 17.3.2. Connectivity
- 17.3.3. Technology Integration
- 17.3.4. Installation Type
- 17.3.5. Application
- 17.3.6. End-user
- 17.3.7. Distribution Channel
- 17.3.8. Country
- 17.3.8.1. Turkey
- 17.3.8.2. UAE
- 17.3.8.3. Saudi Arabia
- 17.3.8.4. Israel
- 17.3.8.5. Rest of Middle East
- 17.4. Turkey Smart Home Devices Market
- 17.4.1. Country Segmental Analysis
- 17.4.2. Product Type
- 17.4.3. Connectivity
- 17.4.4. Technology Integration
- 17.4.5. Installation Type
- 17.4.6. Application
- 17.4.7. End-user
- 17.4.8. Distribution Channel
- 17.5. UAE Smart Home Devices Market
- 17.5.1. Country Segmental Analysis
- 17.5.2. Product Type
- 17.5.3. Connectivity
- 17.5.4. Technology Integration
- 17.5.5. Installation Type
- 17.5.6. Application
- 17.5.7. End-user
- 17.5.8. Distribution Channel
- 17.6. Saudi Arabia Smart Home Devices Market
- 17.6.1. Country Segmental Analysis
- 17.6.2. Product Type
- 17.6.3. Connectivity
- 17.6.4. Technology Integration
- 17.6.5. Installation Type
- 17.6.6. Application
- 17.6.7. End-user
- 17.6.8. Distribution Channel
- 17.7. Israel Smart Home Devices Market
- 17.7.1. Country Segmental Analysis
- 17.7.2. Product Type
- 17.7.3. Connectivity
- 17.7.4. Technology Integration
- 17.7.5. Installation Type
- 17.7.6. Application
- 17.7.7. End-user
- 17.7.8. Distribution Channel
- 17.8. Rest of Middle East Smart Home Devices Market
- 17.8.1. Country Segmental Analysis
- 17.8.2. Product Type
- 17.8.3. Connectivity
- 17.8.4. Technology Integration
- 17.8.5. Installation Type
- 17.8.6. Application
- 17.8.7. End-user
- 17.8.8. Distribution Channel
- 18. Africa Smart Home Devices Market Analysis
- 18.1. Key Segment Analysis
- 18.2. Regional Snapshot
- 18.3. Africa Smart Home Devices Market Size Volume (Million Units) and Value (US$ Bn), Analysis, and Forecasts, 2021-2035
- 18.3.1. Product Type
- 18.3.2. Connectivity
- 18.3.3. Technology Integration
- 18.3.4. Installation Type
- 18.3.5. Application
- 18.3.6. End-user
- 18.3.7. Distribution Channel
- 18.3.8. Country
- 18.3.8.1. South Africa
- 18.3.8.2. Egypt
- 18.3.8.3. Nigeria
- 18.3.8.4. Algeria
- 18.3.8.5. Rest of Africa
- 18.4. South Africa Smart Home Devices Market
- 18.4.1. Country Segmental Analysis
- 18.4.2. Product Type
- 18.4.3. Connectivity
- 18.4.4. Technology Integration
- 18.4.5. Installation Type
- 18.4.6. Application
- 18.4.7. End-user
- 18.4.8. Distribution Channel
- 18.5. Egypt Smart Home Devices Market
- 18.5.1. Country Segmental Analysis
- 18.5.2. Product Type
- 18.5.3. Connectivity
- 18.5.4. Technology Integration
- 18.5.5. Installation Type
- 18.5.6. Application
- 18.5.7. End-user
- 18.5.8. Distribution Channel
- 18.6. Nigeria Smart Home Devices Market
- 18.6.1. Country Segmental Analysis
- 18.6.2. Product Type
- 18.6.3. Connectivity
- 18.6.4. Technology Integration
- 18.6.5. Installation Type
- 18.6.6. Application
- 18.6.7. End-user
- 18.6.8. Distribution Channel
- 18.7. Algeria Smart Home Devices Market
- 18.7.1. Country Segmental Analysis
- 18.7.2. Product Type
- 18.7.3. Connectivity
- 18.7.4. Technology Integration
- 18.7.5. Installation Type
- 18.7.6. Application
- 18.7.7. End-user
- 18.7.8. Distribution Channel
- 18.8. Rest of Africa Smart Home Devices Market
- 18.8.1. Country Segmental Analysis
- 18.8.2. Product Type
- 18.8.3. Connectivity
- 18.8.4. Technology Integration
- 18.8.5. Installation Type
- 18.8.6. Application
- 18.8.7. End-user
- 18.8.8. Distribution Channel
- 19. South America Smart Home Devices Market Analysis
- 19.1. Key Segment Analysis
- 19.2. Regional Snapshot
- 19.3. South America Smart Home Devices Market Size Volume (Million Units) and Value (US$ Bn), Analysis, and Forecasts, 2021-2035
- 19.3.1. Product Type
- 19.3.2. Connectivity
- 19.3.3. Technology Integration
- 19.3.4. Installation Type
- 19.3.5. Application
- 19.3.6. End-user
- 19.3.7. Distribution Channel
- 19.3.8. Country
- 19.3.8.1. Brazil
- 19.3.8.2. Argentina
- 19.3.8.3. Rest of South America
- 19.4. Brazil Smart Home Devices Market
- 19.4.1. Country Segmental Analysis
- 19.4.2. Product Type
- 19.4.3. Connectivity
- 19.4.4. Technology Integration
- 19.4.5. Installation Type
- 19.4.6. Application
- 19.4.7. End-user
- 19.4.8. Distribution Channel
- 19.5. Argentina Smart Home Devices Market
- 19.5.1. Country Segmental Analysis
- 19.5.2. Product Type
- 19.5.3. Connectivity
- 19.5.4. Technology Integration
- 19.5.5. Installation Type
- 19.5.6. Application
- 19.5.7. End-user
- 19.5.8. Distribution Channel
- 19.6. Rest of South America Smart Home Devices Market
- 19.6.1. Country Segmental Analysis
- 19.6.2. Product Type
- 19.6.3. Connectivity
- 19.6.4. Technology Integration
- 19.6.5. Installation Type
- 19.6.6. Application
- 19.6.7. End-user
- 19.6.8. Distribution Channel
- 20. Key Players/ Company Profile
- 20.1. ABB
- 20.1.1. Company Details/ Overview
- 20.1.2. Company Financials
- 20.1.3. Key Customers and Competitors
- 20.1.4. Business/ Industry Portfolio
- 20.1.5. Product Portfolio/ Specification Details
- 20.1.6. Pricing Data
- 20.1.7. Strategic Overview
- 20.1.8. Recent Developments
- 20.2. Amazon
- 20.3. Apple
- 20.4. BSH Home Appliances
- 20.5. D-Link
- 20.6. GE Appliances
- 20.7. Google
- 20.8. Haier Group
- 20.9. Honeywell International
- 20.10. Huawei
- 20.11. IKEA Home Smart
- 20.12. Johnson Controls
- 20.13. LG Electronics
- 20.14. Lutron Electronics
- 20.15. Netgear
- 20.16. Sony
- 20.17. Samsung Electronics
- 20.18. Schneider Electric
- 20.19. TP-Link
- 20.20. Whirlpool Corporation
- 20.21. Xiaomi
- 20.22. Other Key Players
- 20.1. ABB
Note* - This is just tentative list of players. While providing the report, we will cover more number of players based on their revenue and share for each geography
Research Design
Our research design integrates both demand-side and supply-side analysis through a balanced combination of primary and secondary research methodologies. By utilizing both bottom-up and top-down approaches alongside rigorous data triangulation methods, we deliver robust market intelligence that supports strategic decision-making.
MarketGenics' comprehensive research design framework ensures the delivery of accurate, reliable, and actionable market intelligence. Through the integration of multiple research approaches, rigorous validation processes, and expert analysis, we provide our clients with the insights needed to make informed strategic decisions and capitalize on market opportunities.

MarketGenics leverages a dedicated industry panel of experts and a comprehensive suite of paid databases to effectively collect, consolidate, and analyze market intelligence.
Our approach has consistently proven to be reliable and effective in generating accurate market insights, identifying key industry trends, and uncovering emerging business opportunities.
Through both primary and secondary research, we capture and analyze critical company-level data such as manufacturing footprints, including technical centers, R&D facilities, sales offices, and headquarters.
Our expert panel further enhances our ability to estimate market size for specific brands based on validated field-level intelligence.
Our data mining techniques incorporate both parametric and non-parametric methods, allowing for structured data collection, sorting, processing, and cleaning.
Demand projections are derived from large-scale data sets analyzed through proprietary algorithms, culminating in robust and reliable market sizing.
Research Approach
The bottom-up approach builds market estimates by starting with the smallest addressable market units and systematically aggregating them to create comprehensive market size projections.
This method begins with specific, granular data points and builds upward to create the complete market landscape.
Customer Analysis → Segmental Analysis → Geographical Analysis
The top-down approach starts with the broadest possible market data and systematically narrows it down through a series of filters and assumptions to arrive at specific market segments or opportunities.
This method begins with the big picture and works downward to increasingly specific market slices.
TAM → SAM → SOM


Research Methods
Desk / Secondary Research
While analysing the market, we extensively study secondary sources, directories, and databases to identify and collect information useful for this technical, market-oriented, and commercial report. Secondary sources that we utilize are not only the public sources, but it is a combination of Open Source, Associations, Paid Databases, MG Repository & Knowledgebase, and others.
- Company websites, annual reports, financial reports, broker reports, and investor presentations
- National government documents, statistical databases and reports
- News articles, press releases and web-casts specific to the companies operating in the market, Magazines, reports, and others
- We gather information from commercial data sources for deriving company specific data such as segmental revenue, share for geography, product revenue, and others
- Internal and external proprietary databases (industry-specific), relevant patent, and regulatory databases
- Governing Bodies, Government Organizations
- Relevant Authorities, Country-specific Associations for Industries
We also employ the model mapping approach to estimate the product level market data through the players' product portfolio
Primary Research
Primary research/ interviews is vital in analyzing the market. Most of the cases involves paid primary interviews. Primary sources include primary interviews through e-mail interactions, telephonic interviews, surveys as well as face-to-face interviews with the different stakeholders across the value chain including several industry experts.
| Type of Respondents | Number of Primaries |
|---|---|
| Tier 2/3 Suppliers | ~20 |
| Tier 1 Suppliers | ~25 |
| End-users | ~25 |
| Industry Expert/ Panel/ Consultant | ~30 |
| Total | ~100 |
MG Knowledgebase
• Repository of industry blog, newsletter and case studies
• Online platform covering detailed market reports, and company profiles
Forecasting Factors and Models
Forecasting Factors
- Historical Trends – Past market patterns, cycles, and major events that shaped how markets behave over time. Understanding past trends helps predict future behavior.
- Industry Factors – Specific characteristics of the industry like structure, regulations, and innovation cycles that affect market dynamics.
- Macroeconomic Factors – Economic conditions like GDP growth, inflation, and employment rates that affect how much money people have to spend.
- Demographic Factors – Population characteristics like age, income, and location that determine who can buy your product.
- Technology Factors – How quickly people adopt new technology and how much technology infrastructure exists.
- Regulatory Factors – Government rules, laws, and policies that can help or restrict market growth.
- Competitive Factors – Analyzing competition structure such as degree of competition and bargaining power of buyers and suppliers.
Forecasting Models / Techniques
Multiple Regression Analysis
- Identify and quantify factors that drive market changes
- Statistical modeling to establish relationships between market drivers and outcomes
Time Series Analysis – Seasonal Patterns
- Understand regular cyclical patterns in market demand
- Advanced statistical techniques to separate trend, seasonal, and irregular components
Time Series Analysis – Trend Analysis
- Identify underlying market growth patterns and momentum
- Statistical analysis of historical data to project future trends
Expert Opinion – Expert Interviews
- Gather deep industry insights and contextual understanding
- In-depth interviews with key industry stakeholders
Multi-Scenario Development
- Prepare for uncertainty by modeling different possible futures
- Creating optimistic, pessimistic, and most likely scenarios
Time Series Analysis – Moving Averages
- Sophisticated forecasting for complex time series data
- Auto-regressive integrated moving average models with seasonal components
Econometric Models
- Apply economic theory to market forecasting
- Sophisticated economic models that account for market interactions
Expert Opinion – Delphi Method
- Harness collective wisdom of industry experts
- Structured, multi-round expert consultation process
Monte Carlo Simulation
- Quantify uncertainty and probability distributions
- Thousands of simulations with varying input parameters
Research Analysis
Our research framework is built upon the fundamental principle of validating market intelligence from both demand and supply perspectives. This dual-sided approach ensures comprehensive market understanding and reduces the risk of single-source bias.
Demand-Side Analysis: We understand end-user/application behavior, preferences, and market needs along with the penetration of the product for specific application.
Supply-Side Analysis: We estimate overall market revenue, analyze the segmental share along with industry capacity, competitive landscape, and market structure.
Validation & Evaluation
Data triangulation is a validation technique that uses multiple methods, sources, or perspectives to examine the same research question, thereby increasing the credibility and reliability of research findings. In market research, triangulation serves as a quality assurance mechanism that helps identify and minimize bias, validate assumptions, and ensure accuracy in market estimates.
- Data Source Triangulation – Using multiple data sources to examine the same phenomenon
- Methodological Triangulation – Using multiple research methods to study the same research question
- Investigator Triangulation – Using multiple researchers or analysts to examine the same data
- Theoretical Triangulation – Using multiple theoretical perspectives to interpret the same data

Custom Market Research Services
We will customise the research for you, in case the report listed above does not meet your requirements.
Get 10% Free Customisation