Smart Kitchen Appliances Market Size, Share & Trends Analysis Report by Product Type (Smart Refrigerators, Smart Ovens & Cooktops, Smart Dishwashers, Smart Coffee Makers, Smart Microwaves, Smart Air Fryers, Smart Blenders & Food Processors, Smart Slow Cookers & Pressure Cookers, Smart Toasters, Smart Scales, Others), Technology, Connectivity Type, Application, End-users, Installation Type, Distribution Channel, and Geography (North America, Europe, Asia Pacific, Middle East, Africa, and South America) – Global Industry Data, Trends, and Forecasts, 2026–2035
Market Overview:
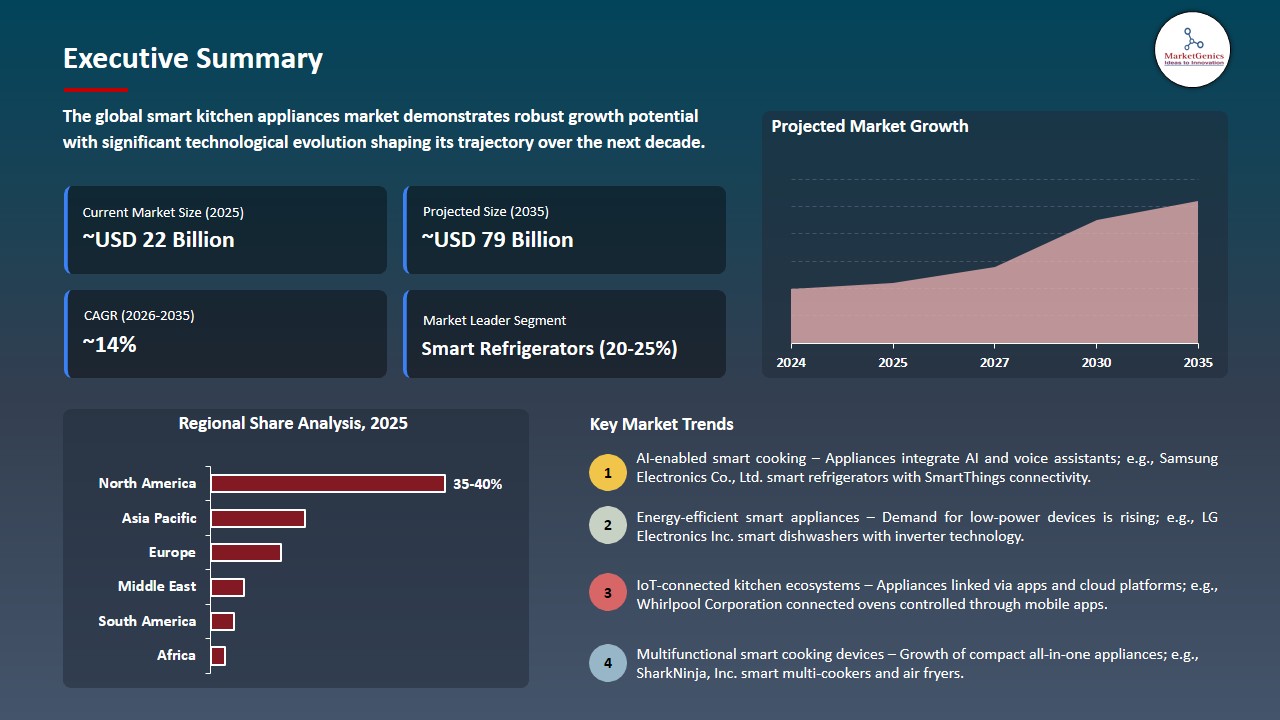
The global smart kitchen appliances market was valued at approximately USD 21.7 billion in 2025 and is expected to reach around USD 79 billion by 2035, expanding at a CAGR of 13.8% from 2025 to 2035.
This growth is driven by the rising number of single-person households, increasing disposable incomes, growing adoption of smart home ecosystems, and a surge in online purchases of small household appliances. Additionally, the rapid penetration of Internet of Things (IoT) technology in home appliances is further accelerating market expansion worldwide.
|
|
|
Segmental Data Insights |
|
|
Demand Trends |
|
|
Competitive Landscape |
|
|
Strategic Development |
|
|
Future Outlook & Opportunities |
|
Smart Kitchen Appliances Market Size, Share, and Growth
Asia Pacific is the fastest-growing region for the Smart Kitchen Appliances Market due to rapid urbanization, expanding middle-class population, increasing adoption of smart homes, and growing demand for technologically advanced and energy-efficient kitchen solutions across emerging economies.
Steve Baek, president of the LG Home Appliance Solution Company, said, " We are redefining the home experience across luxury, premium and mainstream segments by combining design sophistication, AI intelligence and seamless platform integration, with a complete built-in appliance portfolio and differentiated builder offerings, we will continue to strengthen our leadership in the North American B2B appliance market."
The use of smart kitchen appliances is picking up pace all over the world due to an increase in consumer demand of connected homes, automation to save time and energy-saving living. Appliances like refrigerators, ovens, and cooktops are highly appealing to the contemporary homes by integrating artificial intelligence (AI), Internet of Things (IoT), and mobile connectivity as they can track food supplies, suggest recipes, streamline cooking, and minimize energy usage.
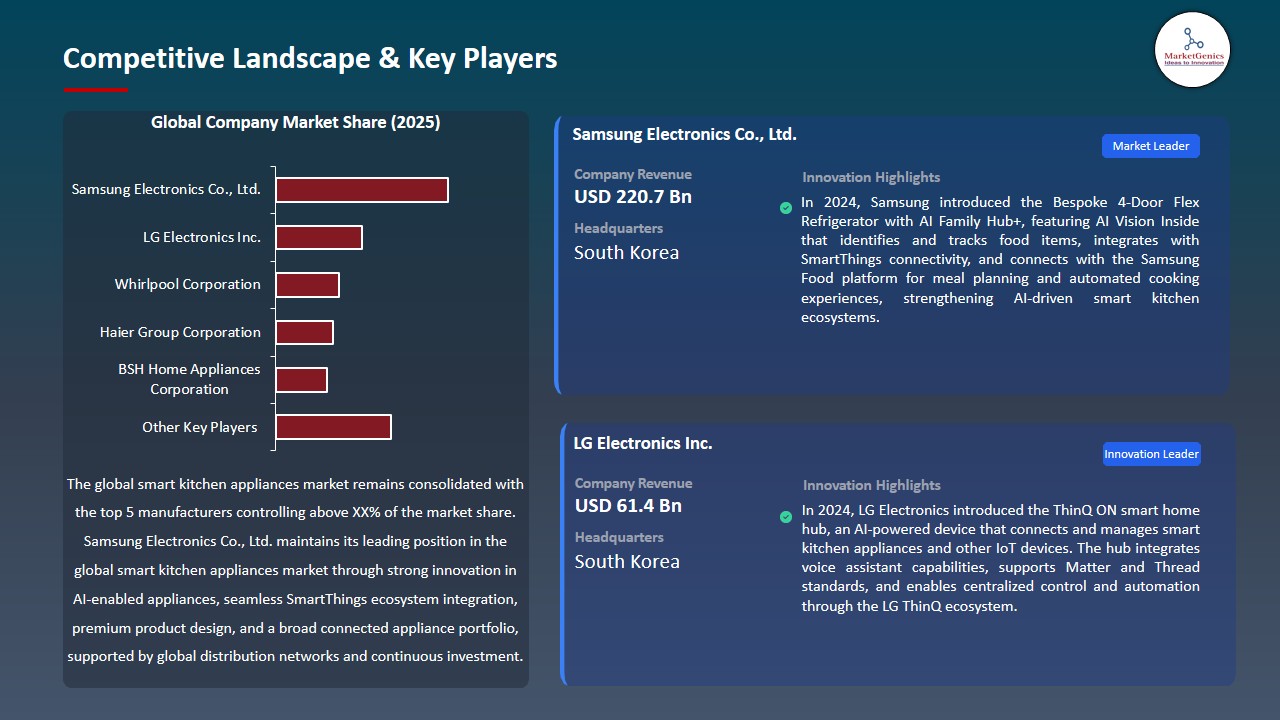
The fast growth of cities and hectic living is also fueling the appetite to buy equipment that can make the life of food preparation and the management of food easier. Large producers are incorporating advanced digital capabilities with an aim of enhancing adoption in the market. As an example, in January 2024, Samsung Electronics announced the Bespoke 4-Door Flex refrigerator with AI Vision inside, which can identify food products and be connected to the SmartThings ecosystem to autonomously manage food and suggest recipes.
Additionally, LG Electronics introduced its AI-powered SIGNATURE refrigerator featuring conversational AI and ThinQ Food technology that identifies ingredients and suggests recipes through an internal camera. These innovations highlight how intelligent features are transforming traditional appliances into connected kitchen ecosystems.
Adjacent opportunities to the smart kitchen appliances market include smart home ecosystems and IoT platforms, connected food management and recipe apps, smart energy management solutions, online grocery integration and automated replenishment systems, and voice-enabled virtual assistants for kitchen control, which collectively expand appliance functionality, improve convenience, and strengthen interoperability across modern digital households.
Smart Kitchen Appliances Market Dynamics and Trends
Driver: Rapid Urbanization and Changing Consumer Lifestyles Driving Demand for Smart Kitchen Automation
-
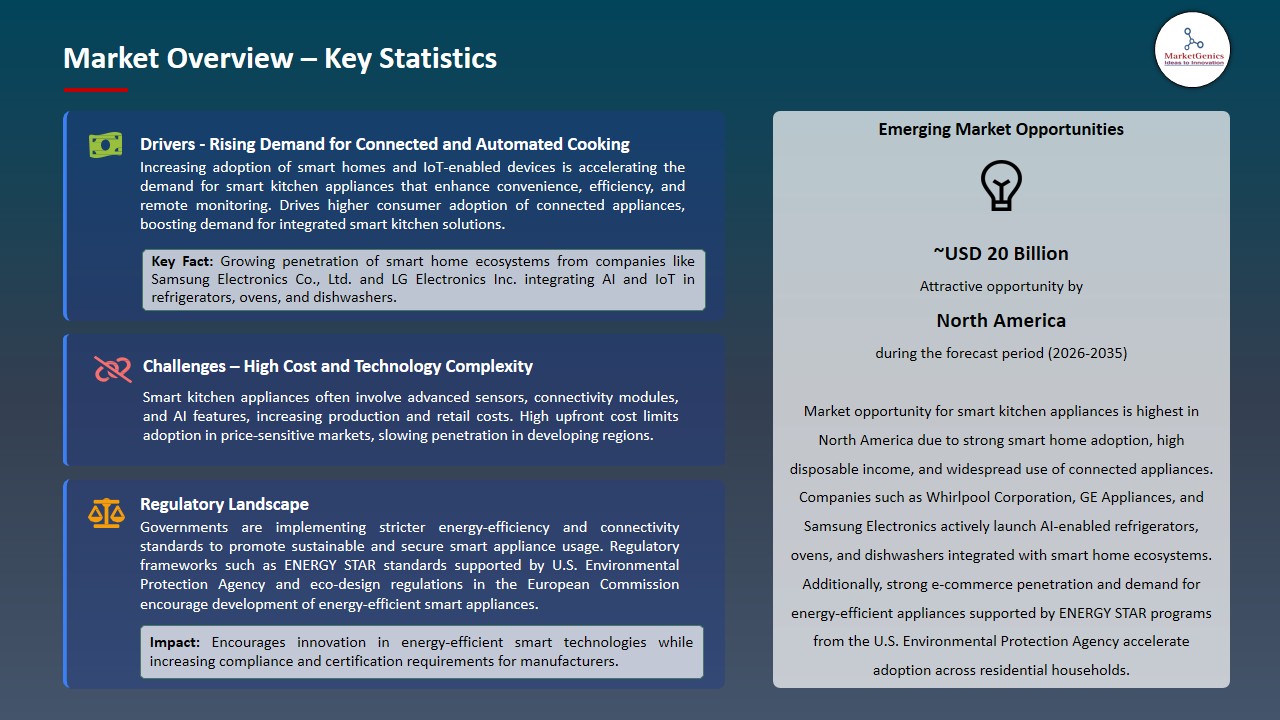
The high pace of urbanization and the growing pace of hectic lifestyles are contributing a great deal to the demand of smart kitchen appliances that can make daily cooking and managing of the household easy. Income-earning families are focusing on appliances that have automation, remote control, and fast meal preparation.
- Smart home devices like smart ovens, refrigerators and dishwashers allow customers to observe and regulate a cooking process via mobile apps and voice assistant. Such capabilities enhance convenience, lessen manual work, and enable effective kitchen work, which speeds up the use of intelligent kitchen technologies across the globe.
- In February 2026, Whirlpool Corporation KitchenAid launched smart kitchen appliances with AIs, such as a Smart Double Wall Oven that has an Intelligent Cooking Camera and French Door Refrigerators with Intelligent Auto Fill to bring more automation and connection to cooking.
- The quicker pace of the implementation of connected and automated kitchen has been boosting the long-term pressure of smart kitchen appliances all across the world.
Restraint: High Initial Cost and Integration Complexity Limiting Consumer Adoption Rates
-
The expensive upfront expenses of intelligent kitchen gadgets are also a major constraint to mass adoption. The high costs of advanced technologies like AI-driven sensors, touchscreen interfaces, connection modules and integrated software platforms add significant costs to product prices in comparison to traditional appliances. This is an element of cost that puts off price-elastic customers especially in the developing markets where cost is a major factor in purchasing.
- The complexity of integration is another factor that prevents adoption as connected appliances frequently need to have reliable internet access, to have mobile applications that are compatible and to interact with other smart homes. Challenges in installation, configuration and maintenance may dishearten users not technologically inclined to use these devices fully.
- High initial investments and technical integration barriers remain the stumbling blocks to mass adoption of smart kitchen appliances by consumers.
Opportunity: Expansion of Smart Home Ecosystems Creating New Revenue Streams
-
The introduction of generative AI opens new opportunities in the smart appliances kitchen market by making the cooking experience highly personalized and intelligent. The AI systems can recognize the preferences of users, their dieting aims and the ingredients available in the market to automatically create tailored recipes and meal plans.
- These technologies, which are integrated with smart ovens, refrigerators, and cooking assistants, are guided by step-by-step preparation, optimization of cooking parameters, and waste management of food. This development is changing kitchens to data-driven, intelligent cooking spaces that increase convenience, healthy eating, and the user experience in general.
- CHEF iQ, which in July 2025 introduced the iQ MiniOven, a small smart oven with 11 cooking modes and hundreds of intelligent presets, and has a high-speed convection oven to cook quickly and evenly.
- Personalized cooking based on generative AI is increasing the demand of smart smart kitchen appliances.
Key Trend: Emergence of Generative AI and Personalized Cooking Experiences Transforming Kitchen Technology
-
The advent of generative AI is changing the smart kitchen appliances by providing intelligent and customized cooking experiences. The users can be analyzed on their preferences, dietary needs, and availability of ingredients and provide personalized recipes, meal plans, and cooking instructions under the guidance of advanced AI algorithms.
- Connected ovens, refrigerators and cooking assistants-integrating the appliances means that they automatically change temperature, timing, and preparation steps to make preparing a meal easier. The trend is driving the further transformation towards highly intuitive, data-driven kitchens with the benefit of increasing convenience, food waste reduction, and general cooking efficiency to the modern households.
- Upliance.ai launched Upliance 2.0 in 2025, an AI-powered smart cooking device with a collection of more than 750 guided recipes, an in-built weighing scale with macro-tracking, and app connectivity to allow customization of its meals and remote control.
- The use of personalized, automated, and data-driven smart kitchens across the globe is being driven by the use of generative AI-powered appliances.
Smart Kitchen Appliances Market Analysis and Segmental Data
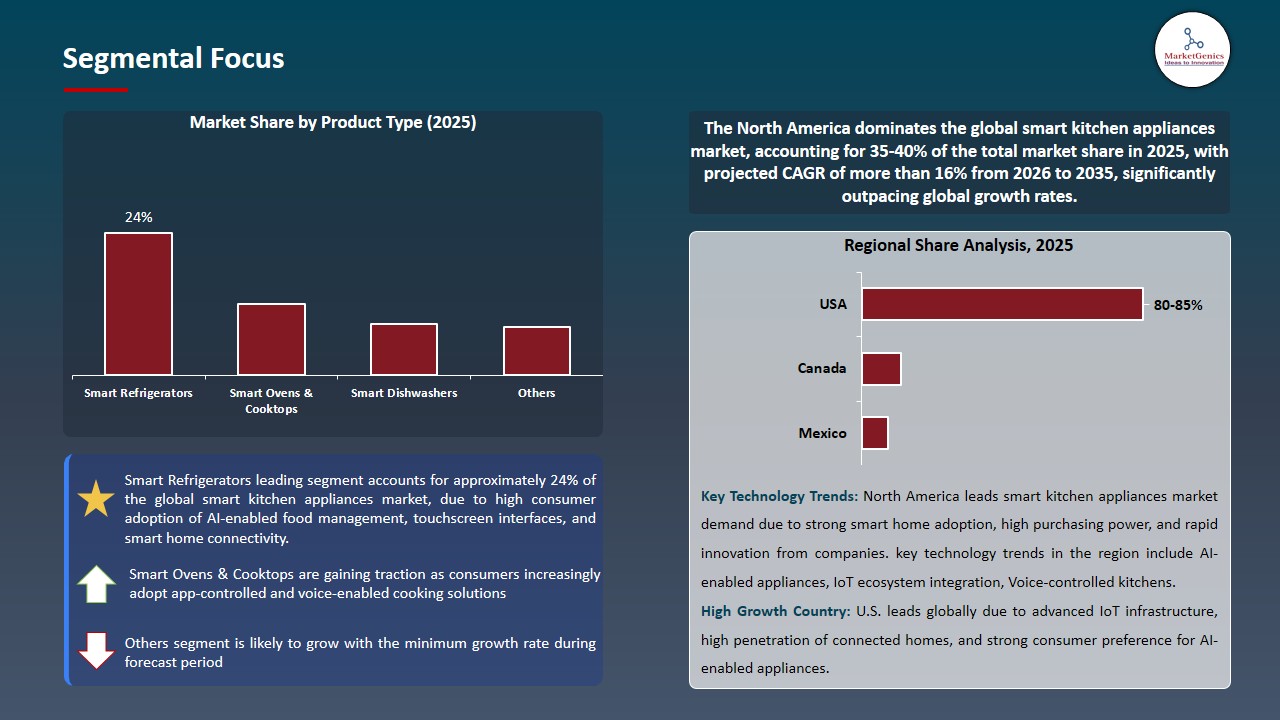
Smart Refrigerators Dominate Global Smart Kitchen Appliances Market
-
Smart refrigerators control the smart kitchen appliances market in the world as they have sophisticated features that interrelate food management, energy efficiency and connectivity. There is a growing demand among consumers to adopt refrigerators that have the ability of keeping track of inventory, have expiration dates, and give automated notification, which makes daily chores easier in the homes.
- Connections to mobile applications, voice assistants, and IoT systems can enable a user to remotely manage the temperature, suggestions on recipes, and energy usage. These features make smart refrigerators crucial devices in the integrated kitchens, which facilitates their popularization and establishes their domination in the market.
- More specifically, in January 2025, Hisense released AI-powered Jumbo Side-by-Side and FreshVault smart refrigerators, with custom meal planning, inventory management, and enhanced freshness preservation, fueling smart, connected kitchen experiences.
- The world is moving toward fully connected, automated and efficient kitchen ecosystems; Smart fridges are hastening this process.
North America Leads Global Smart Kitchen Appliances Market Demand
-
The smart kitchen appliances market in North America is the most competitive in the world because of the extensive demand in connected home technologies, increasing disposable income, and the willingness to use convenient, energy-saving devices. Homes are moving towards investments in AI-powered refrigerators, oven, and dish washers that connect with mobile applications, voice recognition, and general smart home platforms.
- The developed digital environment and the high-tech population of the region make the fast implementation of IoT-based kitchen solutions possible. Also, state programs, which stimulate the use of energy-saving appliances and environmentally friendly lifestyle, contribute to their use. The existence of large-scale manufacturers, large retails chains and good after sales services also enhance market penetration.
- North America is the biggest and most developed market, which determines trends and standards that are followed in the innovations of smart kitchen appliances and expectations of consumers worldwide.
Smart Kitchen Appliances Market Ecosystem
The global smart kitchen appliances market is consolidated, with key players including Samsung Electronics Co., Ltd., LG Electronics Inc., Whirlpool Corporation, Haier Group Corporation, and BSH Home Appliances Corporation. These companies have competitive advantages of vertically integrated hardware-software environments, custom operating systems, AI-powered automation, sophisticated connectivity standards, and the massive global distribution networks. Their management is supported by frequent investment in automation of the kitchen using AI, energy saving technologies, voice assistants, and value partnerships with IoT, cloud computing, and telecommunication providers.
The smart kitchen appliances value chain includes sourcing of essential parts (sensors, microcontrollers, and cameras), designing and the production of the devices, developing proprietary operating systems, integrating applications and digital ecosystem, creating cloud connectivity, and retail distribution and overall post-sale services.
Additional value such as the subscription-based cloud storage, frequent software updates, and ecosystem sync guarantee long-term user interaction, flawless interoperability of the device, enhanced energy efficiency, and a higher and steady experience of both home and business users.
Entry barriers are high because of brand loyalty, complicated requirements in terms of research and development, intellectual property patents, regulatory compliance, and large-scale production. The flow of AI-driven assistants, voice-activated hubs, and automated kitchen solutions has brought about differentiation, repeat revenues, and long-term growth in the world.
Recent Development and Strategic Overview:
-
In January 2026, BSH Home Appliances debuted Bosch Cook AI, an AI-powered smart kitchen appliance delivering personalized cooking guidance, intuitive automation, and seamless integration with smart home ecosystems, reinforcing BSH’s leadership in intelligent, connected kitchen solutions.
- In March 2026, Midea launched its AI Eco Master and Smart Master Lines, featuring AI-powered kitchen appliances, energy-efficient air conditioners, and smart home devices with voice control and IoT integration, delivering personalized, connected, and energy‑optimized home experiences.
Report Scope
|
Detail |
|
|
Market Size in 2025 |
USD 21.7 Bn |
|
Market Forecast Value in 2035 |
~USD 70 Bn |
|
Growth Rate (CAGR) |
13.8% |
|
Forecast Period |
2026 – 2035 |
|
Historical Data Available for |
2021 – 2024 |
|
Market Size Units |
US$ Billion for Value Thousand Units for Volume |
|
Report Format |
Electronic (PDF) + Excel |
|
North America |
Europe |
Asia Pacific |
Middle East |
Africa |
South America |
|
|
|
|
|
|
|
Companies Covered |
|||||
|
|
|
|
|
|
Smart Kitchen Appliances Market Segmentation and Highlights
|
Segment |
Sub-segment |
|
Smart Kitchen Appliances Market, By Product Type |
|
|
Smart Kitchen Appliances Market, By Technology |
|
|
Smart Kitchen Appliances Market, By Connectivity Type |
|
|
Smart Kitchen Appliances Market, By Application |
|
|
Smart Kitchen Appliances Market, By End-users |
|
|
Smart Kitchen Appliances Market, By Installation Type |
|
|
Smart Kitchen Appliances Market, By Distribution Channel |
|
Frequently Asked Questions
Table of Contents
- 1. Research Methodology and Assumptions
- 1.1. Definitions
- 1.2. Research Design and Approach
- 1.3. Data Collection Methods
- 1.4. Base Estimates and Calculations
- 1.5. Forecasting Models
- 1.5.1. Key Forecast Factors & Impact Analysis
- 1.6. Secondary Research
- 1.6.1. Open Sources
- 1.6.2. Paid Databases
- 1.6.3. Associations
- 1.7. Primary Research
- 1.7.1. Primary Sources
- 1.7.2. Primary Interviews with Stakeholders across Ecosystem
- 2. Executive Summary
- 2.1. Global Smart Kitchen Appliances Market Outlook
- 2.1.1. Smart Kitchen Appliances Market Size (Volume (Thousand Units) and Value (US$ Bn)), and Forecasts, 2021-2035
- 2.1.2. Compounded Annual Growth Rate Analysis
- 2.1.3. Growth Opportunity Analysis
- 2.1.4. Segmental Share Analysis
- 2.1.5. Geographical Share Analysis
- 2.2. Market Analysis and Facts
- 2.3. Supply-Demand Analysis
- 2.4. Competitive Benchmarking
- 2.5. Go-to- Market Strategy
- 2.5.1. Customer/ End-use Industry Assessment
- 2.5.2. Growth Opportunity Data, 2026-2035
- 2.5.2.1. Regional Data
- 2.5.2.2. Country Data
- 2.5.2.3. Segmental Data
- 2.5.3. Identification of Potential Market Spaces
- 2.5.4. GAP Analysis
- 2.5.5. Potential Attractive Price Points
- 2.5.6. Prevailing Market Risks & Challenges
- 2.5.7. Preferred Sales & Marketing Strategies
- 2.5.8. Key Recommendations and Analysis
- 2.5.9. A Way Forward
- 2.1. Global Smart Kitchen Appliances Market Outlook
- 3. Industry Data and Premium Insights
- 3.1. Global Consumer Goods & Services Industry Overview, 2025
- 3.1.1. Consumer Goods & Services Industry Ecosystem Analysis
- 3.1.2. Key Trends for Consumer Goods & Services Industry
- 3.1.3. Regional Distribution for Consumer Goods & Services Industry
- 3.2. Supplier Customer Data
- 3.3. Technology Roadmap and Developments
- 3.4. Trade Analysis
- 3.4.1. Import & Export Analysis, 2025
- 3.4.2. Top Importing Countries
- 3.4.3. Top Exporting Countries
- 3.5. Trump Tariff Impact Analysis
- 3.5.1. Manufacturer
- 3.5.1.1. Based on the component & Raw material
- 3.5.2. Supply Chain
- 3.5.3. End Consumer
- 3.5.1. Manufacturer
- 3.6. Raw Material Analysis
- 3.1. Global Consumer Goods & Services Industry Overview, 2025
- 4. Market Overview
- 4.1. Market Dynamics
- 4.1.1. Drivers
- 4.1.1.1. Rising adoption of connected home ecosystems and IoT-enabled devices
- 4.1.1.2. Growing consumer demand for energy-efficient and time-saving appliances
- 4.1.1.3. Increasing disposable income and urban lifestyle shifts
- 4.1.2. Restraints
- 4.1.2.1. High initial cost of smart kitchen appliances
- 4.1.2.2. Data security and privacy concerns related to connected devices
- 4.1.1. Drivers
- 4.2. Key Trend Analysis
- 4.3. Regulatory Framework
- 4.3.1. Key Regulations, Norms, and Subsidies, by Key Countries
- 4.3.2. Tariffs and Standards
- 4.3.3. Impact Analysis of Regulations on the Market
- 4.4. Value Chain Analysis
- 4.4.1. Component Suppliers
- 4.4.2. OEMs / Appliance Manufacturers
- 4.4.3. Distributors &Retail Channels
- 4.4.4. End Users
- 4.5. Cost Structure Analysis
- 4.5.1. Parameter’s Share for Cost Associated
- 4.5.2. COGP vs COGS
- 4.5.3. Profit Margin Analysis
- 4.6. Pricing Analysis
- 4.6.1. Regional Pricing Analysis
- 4.6.2. Segmental Pricing Trends
- 4.6.3. Factors Influencing Pricing
- 4.7. Porter’s Five Forces Analysis
- 4.8. PESTEL Analysis
- 4.9. Global Smart Kitchen Appliances Market Demand
- 4.9.1. Historical Market Size – Volume (Thousand Units) and Value (US$ Bn), 2020-2024
- 4.9.2. Current and Future Market Size – Volume (Thousand Units) and Value (US$ Bn), 2026–2035
- 4.9.2.1. Y-o-Y Growth Trends
- 4.9.2.2. Absolute $ Opportunity Assessment
- 4.1. Market Dynamics
- 5. Competition Landscape
- 5.1. Competition structure
- 5.1.1. Fragmented v/s consolidated
- 5.2. Company Share Analysis, 2025
- 5.2.1. Global Company Market Share
- 5.2.2. By Region
- 5.2.2.1. North America
- 5.2.2.2. Europe
- 5.2.2.3. Asia Pacific
- 5.2.2.4. Middle East
- 5.2.2.5. Africa
- 5.2.2.6. South America
- 5.3. Product Comparison Matrix
- 5.3.1. Specifications
- 5.3.2. Market Positioning
- 5.3.3. Pricing
- 5.1. Competition structure
- 6. Global Smart Kitchen Appliances Market Analysis, by Product Type
- 6.1. Key Segment Analysis
- 6.2. Smart Kitchen Appliances Market Size (Volume (Thousand Units) and Value (US$ Bn)), Analysis, and Forecasts, by Product Type, 2021-2035
- 6.2.1. Smart Refrigerators
- 6.2.2. Smart Ovens & Cooktops
- 6.2.3. Smart Dishwashers
- 6.2.4. Smart Coffee Makers
- 6.2.5. Smart Microwaves
- 6.2.6. Smart Air Fryers
- 6.2.7. Smart Blenders & Food Processors
- 6.2.8. Smart Slow Cookers & Pressure Cookers
- 6.2.9. Smart Toasters
- 6.2.10. Smart Scales
- 6.2.11. Others
- 7. Global Smart Kitchen Appliances Market Analysis, by Technology
- 7.1. Key Segment Analysis
- 7.2. Smart Kitchen Appliances Market Size (Volume (Thousand Units) and Value (US$ Bn)), Analysis, and Forecasts, by Technology, 2021-2035
- 7.2.1. Smartphone Controlled
- 7.2.2. Voice Assistant Controlled
- 7.2.3. Touch Screen Interface
- 7.2.4. Remote Control via IoT Platforms
- 7.2.5. Hub-Based Connectivity
- 7.2.6. Others
- 8. Global Smart Kitchen Appliances Market Analysis, by Connectivity Type
- 8.1. Key Segment Analysis
- 8.2. Smart Kitchen Appliances Market Size (Volume (Thousand Units) and Value (US$ Bn)), Analysis, and Forecasts, by Connectivity Type, 2021-2035
- 8.2.1. Wi-Fi Enabled
- 8.2.2. Bluetooth Enabled
- 8.2.3. NFC Enabled
- 8.2.4. Zigbee
- 8.2.5. Z-Wave
- 8.2.6. Hybrid Connectivity
- 9. Global Smart Kitchen Appliances Market Analysis, by Application
- 9.1. Key Segment Analysis
- 9.2. Smart Kitchen Appliances Market Size (Volume (Thousand Units) and Value (US$ Bn)), Analysis, and Forecasts, by Application, 2021-2035
- 9.2.1. Cooking
- 9.2.2. Food Storage & Preservation
- 9.2.3. Food Preparation
- 9.2.4. Cleaning & Dishwashing
- 9.2.5. Beverage Preparation
- 9.2.6. Monitoring & Control
- 9.2.7. Food Processing
- 9.2.8. Others
- 10. Global Smart Kitchen Appliances Market Analysis, by End-users
- 10.1. Key Segment Analysis
- 10.2. Smart Kitchen Appliances Market Size (Volume (Thousand Units) and Value (US$ Bn)), Analysis, and Forecasts, by End-users, 2021-2035
- 10.2.1. Residential
- 10.2.1.1. Single-Family Homes
- 10.2.1.2. Apartments
- 10.2.1.3. Condominiums
- 10.2.1.4. Smart Homes
- 10.2.1.5. Others
- 10.2.2. Commercial
- 10.2.2.1. Restaurants & Cafes
- 10.2.2.2. Hotels & Resorts
- 10.2.2.3. Corporate Offices
- 10.2.2.4. Educational Institutions
- 10.2.2.5. Healthcare Facilities
- 10.2.2.6. Catering Services
- 10.2.2.7. Others
- 10.2.1. Residential
- 11. Global Smart Kitchen Appliances Market Analysis, by Installation Type
- 11.1. Key Segment Analysis
- 11.2. Smart Kitchen Appliances Market Size (Volume (Thousand Units) and Value (US$ Bn)), Analysis, and Forecasts, by Installation Type, 2021-2035
- 11.2.1. Built-In
- 11.2.2. Freestanding
- 11.2.3. Countertop
- 11.2.4. Under-Counter
- 12. Global Smart Kitchen Appliances Market Analysis, by Distribution Channel
- 12.1. Key Segment Analysis
- 12.2. Smart Kitchen Appliances Market Size (Volume (Thousand Units) and Value (US$ Bn)), Analysis, and Forecasts, by Distribution Channel, 2021-2035
- 12.2.1. Online
- 12.2.1.1. E-commerce Platforms
- 12.2.1.2. Company Websites
- 12.2.1.3. Online Specialty Stores
- 12.2.2. Offline
- 12.2.2.1. Supermarkets & Hypermarkets
- 12.2.2.2. Specialty Electronics Stores
- 12.2.2.3. Home Improvement Stores
- 12.2.2.4. Brand Exclusive Stores
- 12.2.1. Online
- 13. Global Smart Kitchen Appliances Market Analysis and Forecasts, by Region
- 13.1. Key Findings
- 13.2. Smart Kitchen Appliances Market Size (Volume (Thousand Units) and Value (US$ Bn)), Analysis, and Forecasts, by Region, 2021-2035
- 13.2.1. North America
- 13.2.2. Europe
- 13.2.3. Asia Pacific
- 13.2.4. Middle East
- 13.2.5. Africa
- 13.2.6. South America
- 14. North America Smart Kitchen Appliances Market Analysis
- 14.1. Key Segment Analysis
- 14.2. Regional Snapshot
- 14.3. North America Smart Kitchen Appliances Market Size (Volume (Thousand Units) and Value (US$ Bn)), Analysis, and Forecasts, 2021-2035
- 14.3.1. Product Type
- 14.3.2. Technology
- 14.3.3. Connectivity Type
- 14.3.4. Application
- 14.3.5. End-users
- 14.3.6. Installation Type
- 14.3.7. Distribution Channel
- 14.3.8. Country
- 14.3.8.1. USA
- 14.3.8.2. Canada
- 14.3.8.3. Mexico
- 14.4. USA Smart Kitchen Appliances Market
- 14.4.1. Country Segmental Analysis
- 14.4.2. Product Type
- 14.4.3. Technology
- 14.4.4. Connectivity Type
- 14.4.5. Application
- 14.4.6. End-users
- 14.4.7. Installation Type
- 14.4.8. Distribution Channel
- 14.5. Canada Smart Kitchen Appliances Market
- 14.5.1. Country Segmental Analysis
- 14.5.2. Product Type
- 14.5.3. Technology
- 14.5.4. Connectivity Type
- 14.5.5. Application
- 14.5.6. End-users
- 14.5.7. Installation Type
- 14.5.8. Distribution Channel
- 14.6. Mexico Smart Kitchen Appliances Market
- 14.6.1. Country Segmental Analysis
- 14.6.2. Product Type
- 14.6.3. Technology
- 14.6.4. Connectivity Type
- 14.6.5. Application
- 14.6.6. End-users
- 14.6.7. Installation Type
- 14.6.8. Distribution Channel
- 15. Europe Smart Kitchen Appliances Market Analysis
- 15.1. Key Segment Analysis
- 15.2. Regional Snapshot
- 15.3. Europe Smart Kitchen Appliances Market Size (Volume (Thousand Units) and Value (US$ Bn)), Analysis, and Forecasts, 2021-2035
- 15.3.1. Product Type
- 15.3.2. Technology
- 15.3.3. Connectivity Type
- 15.3.4. Application
- 15.3.5. End-users
- 15.3.6. Installation Type
- 15.3.7. Distribution Channel
- 15.3.8. Country
- 15.3.8.1. Germany
- 15.3.8.2. United Kingdom
- 15.3.8.3. France
- 15.3.8.4. Italy
- 15.3.8.5. Spain
- 15.3.8.6. Netherlands
- 15.3.8.7. Nordic Countries
- 15.3.8.8. Poland
- 15.3.8.9. Russia & CIS
- 15.3.8.10. Rest of Europe
- 15.4. Germany Smart Kitchen Appliances Market
- 15.4.1. Country Segmental Analysis
- 15.4.2. Product Type
- 15.4.3. Technology
- 15.4.4. Connectivity Type
- 15.4.5. Application
- 15.4.6. End-users
- 15.4.7. Installation Type
- 15.4.8. Distribution Channel
- 15.5. United Kingdom Smart Kitchen Appliances Market
- 15.5.1. Country Segmental Analysis
- 15.5.2. Product Type
- 15.5.3. Technology
- 15.5.4. Connectivity Type
- 15.5.5. Application
- 15.5.6. End-users
- 15.5.7. Installation Type
- 15.5.8. Distribution Channel
- 15.6. France Smart Kitchen Appliances Market
- 15.6.1. Country Segmental Analysis
- 15.6.2. Product Type
- 15.6.3. Technology
- 15.6.4. Connectivity Type
- 15.6.5. Application
- 15.6.6. End-users
- 15.6.7. Installation Type
- 15.6.8. Distribution Channel
- 15.7. Italy Smart Kitchen Appliances Market
- 15.7.1. Country Segmental Analysis
- 15.7.2. Product Type
- 15.7.3. Technology
- 15.7.4. Connectivity Type
- 15.7.5. Application
- 15.7.6. End-users
- 15.7.7. Installation Type
- 15.7.8. Distribution Channel
- 15.8. Spain Smart Kitchen Appliances Market
- 15.8.1. Country Segmental Analysis
- 15.8.2. Product Type
- 15.8.3. Technology
- 15.8.4. Connectivity Type
- 15.8.5. Application
- 15.8.6. End-users
- 15.8.7. Installation Type
- 15.8.8. Distribution Channel
- 15.9. Netherlands Smart Kitchen Appliances Market
- 15.9.1. Country Segmental Analysis
- 15.9.2. Product Type
- 15.9.3. Technology
- 15.9.4. Connectivity Type
- 15.9.5. Application
- 15.9.6. End-users
- 15.9.7. Installation Type
- 15.9.8. Distribution Channel
- 15.10. Nordic Countries Smart Kitchen Appliances Market
- 15.10.1. Country Segmental Analysis
- 15.10.2. Product Type
- 15.10.3. Technology
- 15.10.4. Connectivity Type
- 15.10.5. Application
- 15.10.6. End-users
- 15.10.7. Installation Type
- 15.10.8. Distribution Channel
- 15.11. Poland Smart Kitchen Appliances Market
- 15.11.1. Country Segmental Analysis
- 15.11.2. Product Type
- 15.11.3. Technology
- 15.11.4. Connectivity Type
- 15.11.5. Application
- 15.11.6. End-users
- 15.11.7. Installation Type
- 15.11.8. Distribution Channel
- 15.12. Russia & CIS Smart Kitchen Appliances Market
- 15.12.1. Country Segmental Analysis
- 15.12.2. Product Type
- 15.12.3. Technology
- 15.12.4. Connectivity Type
- 15.12.5. Application
- 15.12.6. End-users
- 15.12.7. Installation Type
- 15.12.8. Distribution Channel
- 15.13. Rest of Europe Smart Kitchen Appliances Market
- 15.13.1. Country Segmental Analysis
- 15.13.2. Product Type
- 15.13.3. Technology
- 15.13.4. Connectivity Type
- 15.13.5. Application
- 15.13.6. End-users
- 15.13.7. Installation Type
- 15.13.8. Distribution Channel
- 16. Asia Pacific Smart Kitchen Appliances Market Analysis
- 16.1. Key Segment Analysis
- 16.2. Regional Snapshot
- 16.3. Asia Pacific Smart Kitchen Appliances Market Size (Volume (Thousand Units) and Value (US$ Bn)), Analysis, and Forecasts, 2021-2035
- 16.3.1. Product Type
- 16.3.2. Technology
- 16.3.3. Connectivity Type
- 16.3.4. Application
- 16.3.5. End-users
- 16.3.6. Installation Type
- 16.3.7. Distribution Channel
- 16.3.8. Country
- 16.3.8.1. China
- 16.3.8.2. India
- 16.3.8.3. Japan
- 16.3.8.4. South Korea
- 16.3.8.5. Australia and New Zealand
- 16.3.8.6. Indonesia
- 16.3.8.7. Malaysia
- 16.3.8.8. Thailand
- 16.3.8.9. Vietnam
- 16.3.8.10. Rest of Asia Pacific
- 16.4. China Smart Kitchen Appliances Market
- 16.4.1. Country Segmental Analysis
- 16.4.2. Product Type
- 16.4.3. Technology
- 16.4.4. Connectivity Type
- 16.4.5. Application
- 16.4.6. End-users
- 16.4.7. Installation Type
- 16.4.8. Distribution Channel
- 16.5. India Smart Kitchen Appliances Market
- 16.5.1. Country Segmental Analysis
- 16.5.2. Product Type
- 16.5.3. Technology
- 16.5.4. Connectivity Type
- 16.5.5. Application
- 16.5.6. End-users
- 16.5.7. Installation Type
- 16.5.8. Distribution Channel
- 16.6. Japan Smart Kitchen Appliances Market
- 16.6.1. Country Segmental Analysis
- 16.6.2. Product Type
- 16.6.3. Technology
- 16.6.4. Connectivity Type
- 16.6.5. Application
- 16.6.6. End-users
- 16.6.7. Installation Type
- 16.6.8. Distribution Channel
- 16.7. South Korea Smart Kitchen Appliances Market
- 16.7.1. Country Segmental Analysis
- 16.7.2. Product Type
- 16.7.3. Technology
- 16.7.4. Connectivity Type
- 16.7.5. Application
- 16.7.6. End-users
- 16.7.7. Installation Type
- 16.7.8. Distribution Channel
- 16.8. Australia and New Zealand Smart Kitchen Appliances Market
- 16.8.1. Country Segmental Analysis
- 16.8.2. Product Type
- 16.8.3. Technology
- 16.8.4. Connectivity Type
- 16.8.5. Application
- 16.8.6. End-users
- 16.8.7. Installation Type
- 16.8.8. Distribution Channel
- 16.9. Indonesia Smart Kitchen Appliances Market
- 16.9.1. Country Segmental Analysis
- 16.9.2. Product Type
- 16.9.3. Technology
- 16.9.4. Connectivity Type
- 16.9.5. Application
- 16.9.6. End-users
- 16.9.7. Installation Type
- 16.9.8. Distribution Channel
- 16.10. Malaysia Smart Kitchen Appliances Market
- 16.10.1. Country Segmental Analysis
- 16.10.2. Product Type
- 16.10.3. Technology
- 16.10.4. Connectivity Type
- 16.10.5. Application
- 16.10.6. End-users
- 16.10.7. Installation Type
- 16.10.8. Distribution Channel
- 16.11. Thailand Smart Kitchen Appliances Market
- 16.11.1. Country Segmental Analysis
- 16.11.2. Product Type
- 16.11.3. Technology
- 16.11.4. Connectivity Type
- 16.11.5. Application
- 16.11.6. End-users
- 16.11.7. Installation Type
- 16.11.8. Distribution Channel
- 16.12. Vietnam Smart Kitchen Appliances Market
- 16.12.1. Country Segmental Analysis
- 16.12.2. Product Type
- 16.12.3. Technology
- 16.12.4. Connectivity Type
- 16.12.5. Application
- 16.12.6. End-users
- 16.12.7. Installation Type
- 16.12.8. Distribution Channel
- 16.13. Rest of Asia Pacific Smart Kitchen Appliances Market
- 16.13.1. Country Segmental Analysis
- 16.13.2. Product Type
- 16.13.3. Technology
- 16.13.4. Connectivity Type
- 16.13.5. Application
- 16.13.6. End-users
- 16.13.7. Installation Type
- 16.13.8. Distribution Channel
- 17. Middle East Smart Kitchen Appliances Market Analysis
- 17.1. Key Segment Analysis
- 17.2. Regional Snapshot
- 17.3. Middle East Smart Kitchen Appliances Market Size (Volume (Thousand Units) and Value (US$ Bn)), Analysis, and Forecasts, 2021-2035
- 17.3.1. Product Type
- 17.3.2. Technology
- 17.3.3. Connectivity Type
- 17.3.4. Application
- 17.3.5. End-users
- 17.3.6. Installation Type
- 17.3.7. Distribution Channel
- 17.3.8. Country
- 17.3.8.1. Turkey
- 17.3.8.2. UAE
- 17.3.8.3. Saudi Arabia
- 17.3.8.4. Israel
- 17.3.8.5. Rest of Middle East
- 17.4. Turkey Smart Kitchen Appliances Market
- 17.4.1. Country Segmental Analysis
- 17.4.2. Product Type
- 17.4.3. Technology
- 17.4.4. Connectivity Type
- 17.4.5. Application
- 17.4.6. End-users
- 17.4.7. Installation Type
- 17.4.8. Distribution Channel
- 17.5. UAE Smart Kitchen Appliances Market
- 17.5.1. Country Segmental Analysis
- 17.5.2. Product Type
- 17.5.3. Technology
- 17.5.4. Connectivity Type
- 17.5.5. Application
- 17.5.6. End-users
- 17.5.7. Installation Type
- 17.5.8. Distribution Channel
- 17.6. Saudi Arabia Smart Kitchen Appliances Market
- 17.6.1. Country Segmental Analysis
- 17.6.2. Product Type
- 17.6.3. Technology
- 17.6.4. Connectivity Type
- 17.6.5. Application
- 17.6.6. End-users
- 17.6.7. Installation Type
- 17.6.8. Distribution Channel
- 17.7. Israel Smart Kitchen Appliances Market
- 17.7.1. Country Segmental Analysis
- 17.7.2. Product Type
- 17.7.3. Technology
- 17.7.4. Connectivity Type
- 17.7.5. Application
- 17.7.6. End-users
- 17.7.7. Installation Type
- 17.7.8. Distribution Channel
- 17.8. Rest of Middle East Smart Kitchen Appliances Market
- 17.8.1. Country Segmental Analysis
- 17.8.2. Product Type
- 17.8.3. Technology
- 17.8.4. Connectivity Type
- 17.8.5. Application
- 17.8.6. End-users
- 17.8.7. Installation Type
- 17.8.8. Distribution Channel
- 18. Africa Smart Kitchen Appliances Market Analysis
- 18.1. Key Segment Analysis
- 18.2. Regional Snapshot
- 18.3. Africa Smart Kitchen Appliances Market Size (Volume (Thousand Units) and Value (US$ Bn)), Analysis, and Forecasts, 2021-2035
- 18.3.1. Product Type
- 18.3.2. Technology
- 18.3.3. Connectivity Type
- 18.3.4. Application
- 18.3.5. End-users
- 18.3.6. Installation Type
- 18.3.7. Distribution Channel
- 18.3.8. Country
- 18.3.8.1. South Africa
- 18.3.8.2. Egypt
- 18.3.8.3. Nigeria
- 18.3.8.4. Algeria
- 18.3.8.5. Rest of Africa
- 18.4. South Africa Smart Kitchen Appliances Market
- 18.4.1. Country Segmental Analysis
- 18.4.2. Product Type
- 18.4.3. Technology
- 18.4.4. Connectivity Type
- 18.4.5. Application
- 18.4.6. End-users
- 18.4.7. Installation Type
- 18.4.8. Distribution Channel
- 18.5. Egypt Smart Kitchen Appliances Market
- 18.5.1. Country Segmental Analysis
- 18.5.2. Product Type
- 18.5.3. Technology
- 18.5.4. Connectivity Type
- 18.5.5. Application
- 18.5.6. End-users
- 18.5.7. Installation Type
- 18.5.8. Distribution Channel
- 18.6. Nigeria Smart Kitchen Appliances Market
- 18.6.1. Country Segmental Analysis
- 18.6.2. Product Type
- 18.6.3. Technology
- 18.6.4. Connectivity Type
- 18.6.5. Application
- 18.6.6. End-users
- 18.6.7. Installation Type
- 18.6.8. Distribution Channel
- 18.7. Algeria Smart Kitchen Appliances Market
- 18.7.1. Country Segmental Analysis
- 18.7.2. Product Type
- 18.7.3. Technology
- 18.7.4. Connectivity Type
- 18.7.5. Application
- 18.7.6. End-users
- 18.7.7. Installation Type
- 18.7.8. Distribution Channel
- 18.8. Rest of Africa Smart Kitchen Appliances Market
- 18.8.1. Country Segmental Analysis
- 18.8.2. Product Type
- 18.8.3. Technology
- 18.8.4. Connectivity Type
- 18.8.5. Application
- 18.8.6. End-users
- 18.8.7. Installation Type
- 18.8.8. Distribution Channel
- 19. South America Smart Kitchen Appliances Market Analysis
- 19.1. Key Segment Analysis
- 19.2. Regional Snapshot
- 19.3. South America Smart Kitchen Appliances Market Size (Volume (Thousand Units) and Value (US$ Bn)), Analysis, and Forecasts, 2021-2035
- 19.3.1. Product Type
- 19.3.2. Technology
- 19.3.3. Connectivity Type
- 19.3.4. Application
- 19.3.5. End-users
- 19.3.6. Installation Type
- 19.3.7. Distribution Channel
- 19.3.8. Country
- 19.3.8.1. Brazil
- 19.3.8.2. Argentina
- 19.3.8.3. Rest of South America
- 19.4. Brazil Smart Kitchen Appliances Market
- 19.4.1. Country Segmental Analysis
- 19.4.2. Product Type
- 19.4.3. Technology
- 19.4.4. Connectivity Type
- 19.4.5. Application
- 19.4.6. End-users
- 19.4.7. Installation Type
- 19.4.8. Distribution Channel
- 19.5. Argentina Smart Kitchen Appliances Market
- 19.5.1. Country Segmental Analysis
- 19.5.2. Product Type
- 19.5.3. Technology
- 19.5.4. Connectivity Type
- 19.5.5. Application
- 19.5.6. End-users
- 19.5.7. Installation Type
- 19.5.8. Distribution Channel
- 19.6. Rest of South America Smart Kitchen Appliances Market
- 19.6.1. Country Segmental Analysis
- 19.6.2. Product Type
- 19.6.3. Technology
- 19.6.4. Connectivity Type
- 19.6.5. Application
- 19.6.6. End-users
- 19.6.7. Installation Type
- 19.6.8. Distribution Channel
- 20. Key Players/ Company Profile
- 20.1. Breville Group Limited
- 20.1.1. Company Details/ Overview
- 20.1.2. Company Financials
- 20.1.3. Key Customers and Competitors
- 20.1.4. Business/ Industry Portfolio
- 20.1.5. Product Portfolio/ Specification Details
- 20.1.6. Pricing Data
- 20.1.7. Strategic Overview
- 20.1.8. Recent Developments
- 20.2. BSH Home Appliances Corporation
- 20.3. Electrolux AB
- 20.4. Fisher & Paykel Appliances Limited
- 20.5. General Electric Company
- 20.6. Haier Group Corporation
- 20.7. Hitachi, Ltd.
- 20.8. Koninklijke Philips N.V.
- 20.9. LG Electronics Inc.
- 20.10. Midea Group Co., Ltd.
- 20.11. Miele & Cie. KG
- 20.12. Panasonic Corporation
- 20.13. Robert Bosch GmbH
- 20.14. Samsung Electronics Co., Ltd.
- 20.15. Sharp Corporation
- 20.16. Siemens AG
- 20.17. Smeg S.p.A.
- 20.18. Sub-Zero Group, Inc.
- 20.19. Toshiba Corporation
- 20.20. Viking Range, LLC
- 20.21. Whirlpool Corporation
- 20.22. Xiaomi Corporation
- 20.23. Other Key Players
- 20.1. Breville Group Limited
Note* - This is just tentative list of players. While providing the report, we will cover more number of players based on their revenue and share for each geography
Research Design
Our research design integrates both demand-side and supply-side analysis through a balanced combination of primary and secondary research methodologies. By utilizing both bottom-up and top-down approaches alongside rigorous data triangulation methods, we deliver robust market intelligence that supports strategic decision-making.
MarketGenics' comprehensive research design framework ensures the delivery of accurate, reliable, and actionable market intelligence. Through the integration of multiple research approaches, rigorous validation processes, and expert analysis, we provide our clients with the insights needed to make informed strategic decisions and capitalize on market opportunities.

MarketGenics leverages a dedicated industry panel of experts and a comprehensive suite of paid databases to effectively collect, consolidate, and analyze market intelligence.
Our approach has consistently proven to be reliable and effective in generating accurate market insights, identifying key industry trends, and uncovering emerging business opportunities.
Through both primary and secondary research, we capture and analyze critical company-level data such as manufacturing footprints, including technical centers, R&D facilities, sales offices, and headquarters.
Our expert panel further enhances our ability to estimate market size for specific brands based on validated field-level intelligence.
Our data mining techniques incorporate both parametric and non-parametric methods, allowing for structured data collection, sorting, processing, and cleaning.
Demand projections are derived from large-scale data sets analyzed through proprietary algorithms, culminating in robust and reliable market sizing.
Research Approach
The bottom-up approach builds market estimates by starting with the smallest addressable market units and systematically aggregating them to create comprehensive market size projections.
This method begins with specific, granular data points and builds upward to create the complete market landscape.
Customer Analysis → Segmental Analysis → Geographical Analysis
The top-down approach starts with the broadest possible market data and systematically narrows it down through a series of filters and assumptions to arrive at specific market segments or opportunities.
This method begins with the big picture and works downward to increasingly specific market slices.
TAM → SAM → SOM


Research Methods
Desk / Secondary Research
While analysing the market, we extensively study secondary sources, directories, and databases to identify and collect information useful for this technical, market-oriented, and commercial report. Secondary sources that we utilize are not only the public sources, but it is a combination of Open Source, Associations, Paid Databases, MG Repository & Knowledgebase, and others.
- Company websites, annual reports, financial reports, broker reports, and investor presentations
- National government documents, statistical databases and reports
- News articles, press releases and web-casts specific to the companies operating in the market, Magazines, reports, and others
- We gather information from commercial data sources for deriving company specific data such as segmental revenue, share for geography, product revenue, and others
- Internal and external proprietary databases (industry-specific), relevant patent, and regulatory databases
- Governing Bodies, Government Organizations
- Relevant Authorities, Country-specific Associations for Industries
We also employ the model mapping approach to estimate the product level market data through the players' product portfolio
Primary Research
Primary research/ interviews is vital in analyzing the market. Most of the cases involves paid primary interviews. Primary sources include primary interviews through e-mail interactions, telephonic interviews, surveys as well as face-to-face interviews with the different stakeholders across the value chain including several industry experts.
| Type of Respondents | Number of Primaries |
|---|---|
| Tier 2/3 Suppliers | ~20 |
| Tier 1 Suppliers | ~25 |
| End-users | ~25 |
| Industry Expert/ Panel/ Consultant | ~30 |
| Total | ~100 |
MG Knowledgebase
• Repository of industry blog, newsletter and case studies
• Online platform covering detailed market reports, and company profiles
Forecasting Factors and Models
Forecasting Factors
- Historical Trends – Past market patterns, cycles, and major events that shaped how markets behave over time. Understanding past trends helps predict future behavior.
- Industry Factors – Specific characteristics of the industry like structure, regulations, and innovation cycles that affect market dynamics.
- Macroeconomic Factors – Economic conditions like GDP growth, inflation, and employment rates that affect how much money people have to spend.
- Demographic Factors – Population characteristics like age, income, and location that determine who can buy your product.
- Technology Factors – How quickly people adopt new technology and how much technology infrastructure exists.
- Regulatory Factors – Government rules, laws, and policies that can help or restrict market growth.
- Competitive Factors – Analyzing competition structure such as degree of competition and bargaining power of buyers and suppliers.
Forecasting Models / Techniques
Multiple Regression Analysis
- Identify and quantify factors that drive market changes
- Statistical modeling to establish relationships between market drivers and outcomes
Time Series Analysis – Seasonal Patterns
- Understand regular cyclical patterns in market demand
- Advanced statistical techniques to separate trend, seasonal, and irregular components
Time Series Analysis – Trend Analysis
- Identify underlying market growth patterns and momentum
- Statistical analysis of historical data to project future trends
Expert Opinion – Expert Interviews
- Gather deep industry insights and contextual understanding
- In-depth interviews with key industry stakeholders
Multi-Scenario Development
- Prepare for uncertainty by modeling different possible futures
- Creating optimistic, pessimistic, and most likely scenarios
Time Series Analysis – Moving Averages
- Sophisticated forecasting for complex time series data
- Auto-regressive integrated moving average models with seasonal components
Econometric Models
- Apply economic theory to market forecasting
- Sophisticated economic models that account for market interactions
Expert Opinion – Delphi Method
- Harness collective wisdom of industry experts
- Structured, multi-round expert consultation process
Monte Carlo Simulation
- Quantify uncertainty and probability distributions
- Thousands of simulations with varying input parameters
Research Analysis
Our research framework is built upon the fundamental principle of validating market intelligence from both demand and supply perspectives. This dual-sided approach ensures comprehensive market understanding and reduces the risk of single-source bias.
Demand-Side Analysis: We understand end-user/application behavior, preferences, and market needs along with the penetration of the product for specific application.
Supply-Side Analysis: We estimate overall market revenue, analyze the segmental share along with industry capacity, competitive landscape, and market structure.
Validation & Evaluation
Data triangulation is a validation technique that uses multiple methods, sources, or perspectives to examine the same research question, thereby increasing the credibility and reliability of research findings. In market research, triangulation serves as a quality assurance mechanism that helps identify and minimize bias, validate assumptions, and ensure accuracy in market estimates.
- Data Source Triangulation – Using multiple data sources to examine the same phenomenon
- Methodological Triangulation – Using multiple research methods to study the same research question
- Investigator Triangulation – Using multiple researchers or analysts to examine the same data
- Theoretical Triangulation – Using multiple theoretical perspectives to interpret the same data

Custom Market Research Services
We will customise the research for you, in case the report listed above does not meet your requirements.
Get 10% Free Customisation