Social Commerce Market Size, Share & Trends Analysis Report Platform Type (Social Media Platforms, Messaging Platforms, Content Discovery Commerce, Live Streaming Platforms, Community-based Platforms, Others), Business Model, Product Type, Device Type, Content Type, Payment Method, Fulfillment Model, and Geography (North America, Europe, Asia Pacific, Middle East, Africa, and South America) – Global Industry Data, Trends, and Forecasts, 2026–2035
|
|
|
Segmental Data Insights |
|
|
Demand Trends |
|
|
Competitive Landscape |
|
|
Strategic Development |
|
|
Future Outlook & Opportunities |
|
Social Commerce Market Size, Share, and Growth
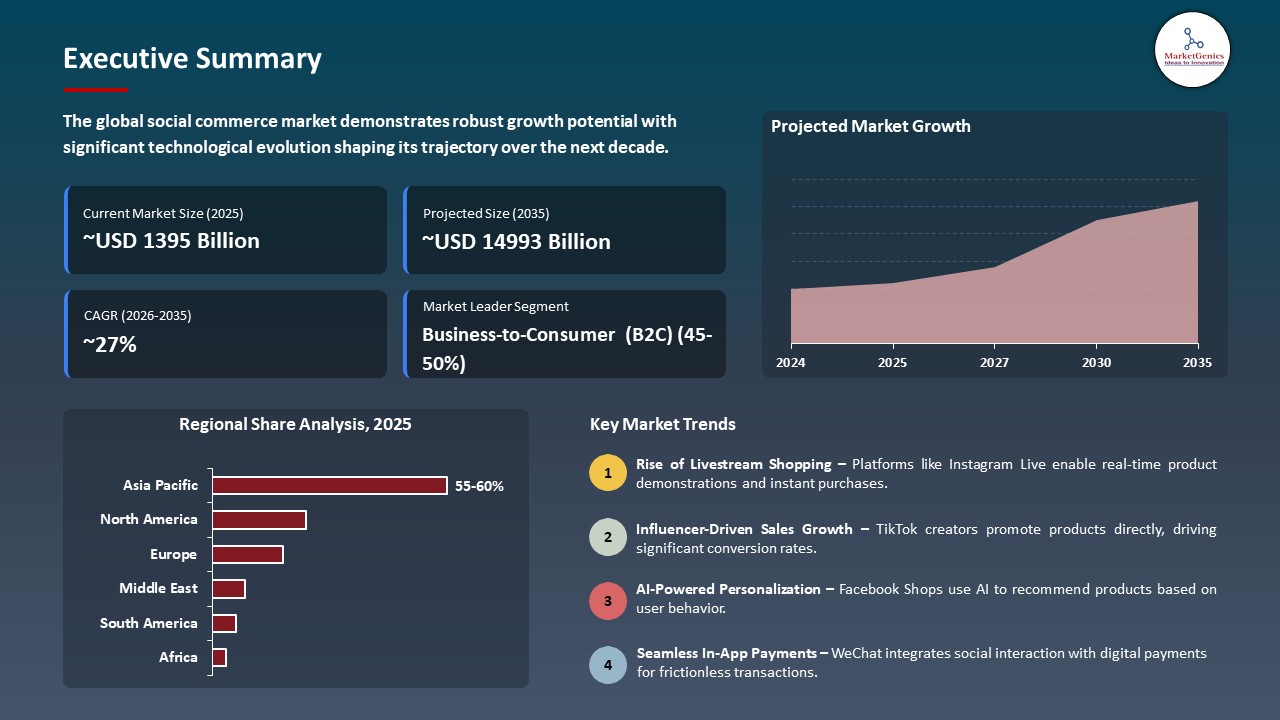
The global social commerce market is exhibiting strong growth, with an estimated value of USD 1395.4 billion in 2025 and USD 14993.1 billion by 2035, achieving a CAGR of 26.8%, during the forecast period. The global social commerce market is driven by growing smartphone and internet penetration, rising social media usage, influencer-driven marketing, integrated shopping features on platforms, AI-powered personalized recommendations, seamless mobile payments, and a shift toward interactive, engaging online shopping experiences, accelerating global adoption.
“For merchants, it gives them other channels to list a product in a similar fashion they would on their own Etsy site, while also enabling them to sell right where their customers spend a lot of their time being influenced about what to buy,” said James Lively, president of Zantler.
Major retailers are leveraging creator networks to power social commerce by combining both influencer-created and authentic content with smooth, in-store shopping experiences. For instance, in November 2025, the social commerce platform offered by Myntra has increased to approximately 10% of all sales, with millions of content creators posting and connecting products directly with checkout proving how social interaction transforms into quantifiable commerce. The use of creator-led social commerce improves consumer behavior, raises conversion rates, and generates quantifiable incremental revenue to retailers.
Additionally, the global brands are also strategizing to incorporate social commerce features directly into the social platforms to create sales and consumer interaction. For instance, TikTok Shop has emerged as a leading social commerce channel, with major brands expanding their presence and sales growth on the platform, contributing to its rapid adoption and rising share of total social commerce activity. The growth of shoppable social experiences can be used to increase the speed of revenue growth, enhance brand to consumer engagement, and competitive positioning in online retail.
The global social commerce market presents opportunities in adjacent segments such as livestream commerce, social influencer marketing platforms, mobile payment and digital wallet solutions, augmented reality (AR) shopping experiences, and cross-border e-commerce integration. By capitalizing on these areas, businesses are able to achieve increased engagement, incremental sales and revenue stream diversification. The expansion of the adjacent markets enhances the monetization pathways and the general growth of social commerce.
Social Commerce Market Dynamics and Trends
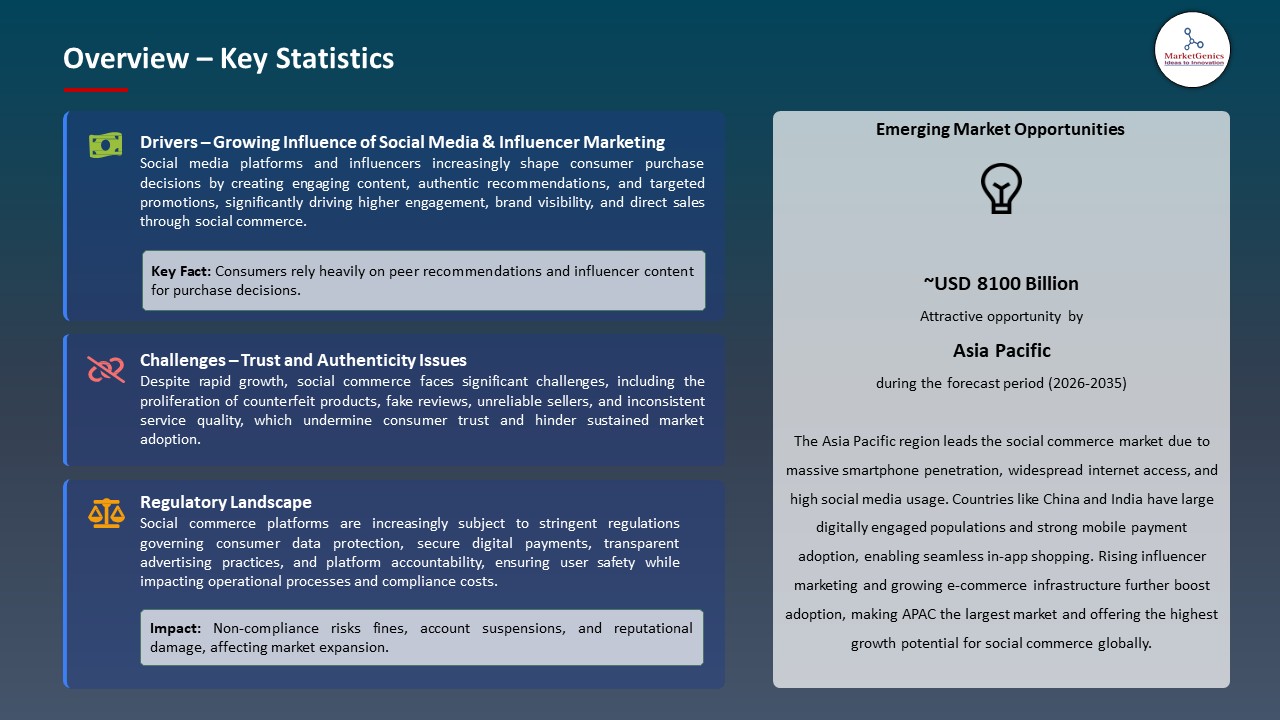
Driver: Strategic Expansion of Brand‑Led Direct Social Commerce Sales Channels
-
Global brands are introducing direct shopping features and in-built sale channels on social platforms to turn user interaction into quantifiable revenue. Through the interaction features and creator-created content, retailers can be able to lead consumers through product discovery right to the point of the purchase without leaving the social platform.
- For instance, the social commerce ecosystem of Myntra is contributing at least 10% of the total revenue today, powered by millions of content creators whose posts connect the products to the checkout with a single button press. The strategy builds stronger consumer-brand relationships and gives brands comprehensive real-time insights to enhance the effectiveness of marketing, merchandising, and product strategies. The development of social commerce channels is, hence, central to gaining the attention of modern consumers and stimulating sustainable growth of digital revenue.
- The strategy increases the growth of revenues faster, enhances customer interaction, and empower the digital commercial presence of the brands.
Restraint: Platform Content Quality and Trust Challenges Undermining Consumer Confidence
-
The high growth of social commerce has come with a lot of challenges associated with content quality, platform credibility, and regulatory adherence as the platforms seek to balance growth with effective moderation. Millions of listings have to be monitored and fraudulent behavior, fake products and breach of policy must be prevented which can compromise consumer confidence otherwise.
- For instance, TikTok Shop had to deal with increased fake listings and non-compliant sellers, which resulted in hundreds of thousands of accounts and millions of products being removed to protect consumers and ensure the integrity of the platform. These enforcement measures point to the difficulty of ensuring trust at scale and encouraging interaction.
- Quality and trust problems may also undermine consumer confidence, raise compliance costs and limit platform adoption.
Opportunity: Integration of AI‑Powered Personalization Enhancing Purchase Journeys
-
The social commerce market is a significant opportunity to utilize advanced artificial intelligence to bring very personalized shopping experiences that can align with the individual preferences and behaviors of consumers. The major platforms are also introducing AI-assisted recommenders, which process interactions between the user to display relevant products within the social feeds, thus making the process of discovering and buying products easier.
- For instance, Shopify has increased its AI potential to improve the product recommendations, content delivery, and user interface personalization so that merchants can offer dynamic and data-driven offers that are relevant to consumer interests in real time. The AI-based improvements minimize friction throughout the shopping experience, enhance the relevance of products, and optimize the chances of a conversion on each funnel stage.
- Consumer engagement, average order value, and elevated shopping rates are the results of AI-based personalization on all social commerce platforms.
Key Trend: Increasing Adoption of Livestream Shopping Events by Retail Brands Globally
-
Livestream commerce is emerging as a key trend within the global social commerce market, with retailers conducting real-time shopping events on social platforms to engage audiences and drive immediate transactions. For instance, AliExpress extended its livestream shopping plan on the Singles’ Day 2025, which featured a series of influencer-led events where products like Pop Mart collectibles were showcased, which saw significant growth in sales per year and increase consumer engagement in markets across the international markets.
- This strategy combines live product demonstrations, audience interaction and real-time purchasing, blending entertainment and commerce. These discovery experiences are replicative of in-store discovery, increase communication with consumers, and faster purchase decision-making, indicating the overall movement in favor of content-based, interactive shopping habits in social ecosystems.
- Livestream shopping enhances real-time consumer interaction, boosts impulse buying, and hastens the sales cycle of retail brands.
 Social Commerce Market Analysis and Segmental Data
Business-to-Consumer (B2C) Dominate Global Social Commerce Market
-
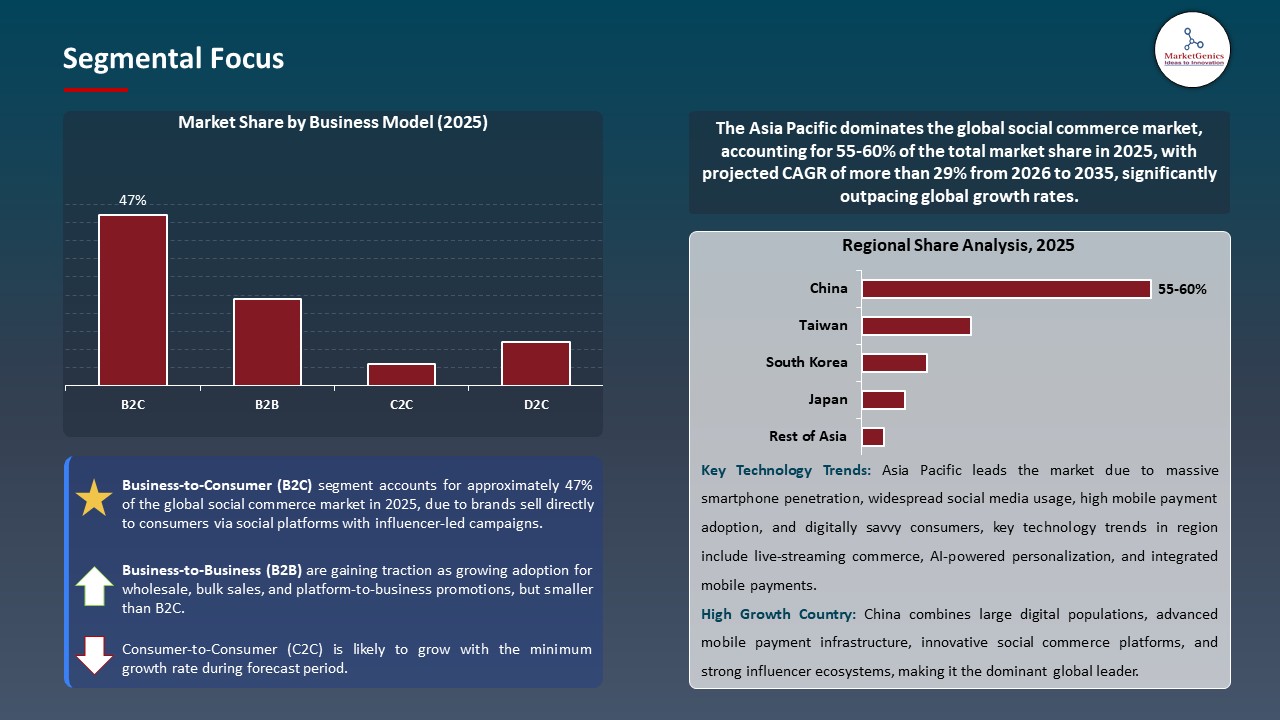
The business-to-consumer (B2C) segment dominates the global social commerce market, as wherein brands and retailers sell products at the consumer level through social media. This segment has the highest global proportion of social commerce revenues, which indicates high consumer interest in integrated in-app shopping experiences that minimize friction and simplify buying processes.
- For instance, Tik Tok Shop has developed its B2C business to a great extent, as by 2026 it is expected to sell more than 20 billion dollars, proving the effectiveness of the model to turn social interactions into direct transactions. The in-feed product linking features, livestream selling, and one-second checkouts help brands to attract a broad range of consumers, make purchases on impulse, and positively empower the online shopping experience.
- Leadership on the B2C segment will boost revenue generation, expedite market penetrations, and enhance direct brand-to-consumer interactions in social commerce ecosystems.
Asia Pacific Leads Global Social Commerce Market Demand
- Asia Pacific leads the social commerce is propelled by the fundamentally mobile-first consumer culture and is pervasive across social platforms. For instance, social commerce ecosystem of TikTok Shop links brands directly to millions of consumers with shoppable content and live commerce built into the platform, which will result in a large number of purchases and demonstrate a great regional adoption of social shopping solutions by global and regional brands.
- Additionally, social commerce partnerships such as the YouTube and Shopee integrated shopping service in Indonesia and Southeast Asia offer single social commerce experiences to users, enabling them to buy items that are featured in video content to expand their market access and facilitate adoption among consumers in the region.
- Mobile first behavior and strategic platform partnerships are engine of increased engagement, expansion of market reach and strengthening of Asia Pacific leadership in social commerce adoption.
Social Commerce Market Ecosystem
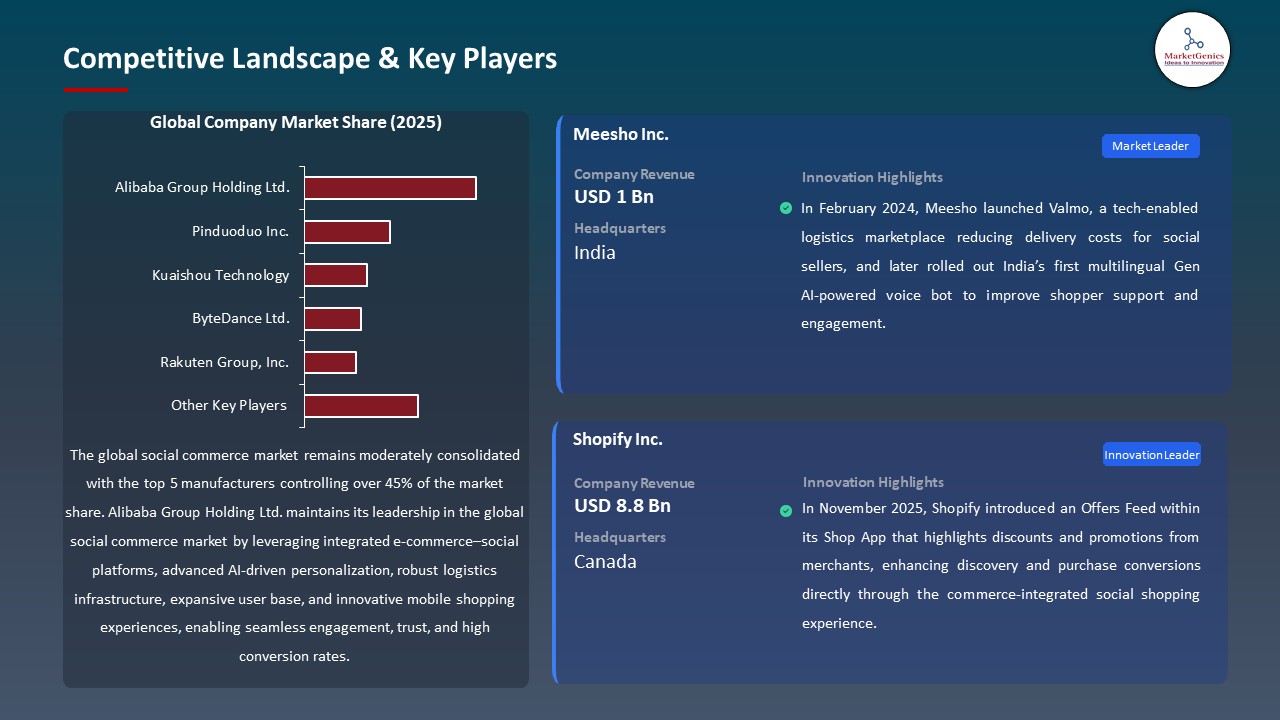
The global social commerce market is moderately consolidated, with leading companies such as Alibaba Group Holding Ltd., Pinduoduo Inc., Kuaishou Technology, ByteDance Ltd., and Rakuten Group, Inc. dominating it by providing sophisticated technologies like AI-based customization, integrated shopping platforms, and data analytics that enrich the user experience and optimize the buying journey across the social platforms.
These key players are becoming more and more concentrated on niche and specialized innovations, which add value and differentiate markets better. The group-buying mechanism of Pinduoduo is based on the cost savings and virality of social networks, and Alibaba adds video commerce and live-streaming to its e-commerce platform, which promotes immersive interactive shopping experiences.
Government bodies and institutions are also investing to support technological enhancement in this space. In February 2024, the Regulations on the Implementation of the Consumer Rights Protection Law of China established new tougher requirements of online commerce, enhancing the user confidence and responsibility of the platform, which has promoted innovation in consumer protection and transparency of transactions on social commerce platforms.
These control measures have enhanced consumer trust, increased platform credibility, and enhanced the pace at which safe, transparent social commerce deals are adopted throughout China.
 Recent Development and Strategic Overview:
-
In December 2025, Shopify introduced Shop Minis, an advanced immersive shopping platform within the Shop app, enabling developers to create interactive discovery tools, including visual search and AI-driven product recommendations, thereby enhancing social commerce engagement and driving higher merchant and consumer interaction.
- In November 2025, Meta Platforms implemented advanced social commerce capabilities on Facebook Marketplace, including Collections, collaborative purchasing functionalities, and AI-driven consumer insights, designed to enhance user engagement, facilitate interactive product discovery, and support seamless direct transaction execution.
Report Scope
|
Detail |
|
|
Market Size in 2025 |
USD 1395.4 Bn |
|
Market Forecast Value in 2035 |
USD 14993.1 Bn |
|
Growth Rate (CAGR) |
26.8% |
|
Forecast Period |
2026 – 2035 |
|
Historical Data Available for |
2021 – 2024 |
|
Market Size Units |
US$ Billion for Value |
|
Report Format |
Electronic (PDF) + Excel |
|
North America |
Europe |
Asia Pacific |
Middle East |
Africa |
South America |
|
|
|
|
|
|
|
Companies Covered |
|||||
|
|
|
|
|
|
Social Commerce Market Segmentation and Highlights
|
Segment |
Sub-segment |
|
Social Commerce Market, By Platform Type |
|
|
Social Commerce Market, By Business Model |
|
|
Social Commerce Market, By Product Type |
|
|
Social Commerce Market, By Device Type |
|
|
Social Commerce Market, By Content Type |
|
|
Social Commerce Market, By Payment Method |
|
|
Social Commerce Market, By Fulfillment Model |
|
Frequently Asked Questions
Table of Contents
- 1. Research Methodology and Assumptions
- 1.1. Definitions
- 1.2. Research Design and Approach
- 1.3. Data Collection Methods
- 1.4. Base Estimates and Calculations
- 1.5. Forecasting Models
- 1.5.1. Key Forecast Factors & Impact Analysis
- 1.6. Secondary Research
- 1.6.1. Open Sources
- 1.6.2. Paid Databases
- 1.6.3. Associations
- 1.7. Primary Research
- 1.7.1. Primary Sources
- 1.7.2. Primary Interviews with Stakeholders across Ecosystem
- 2. Executive Summary
- 2.1. Global Social Commerce Market Outlook
- 2.1.1. Social Commerce Market Size (Value - US$ Bn), and Forecasts, 2021-2035
- 2.1.2. Compounded Annual Growth Rate Analysis
- 2.1.3. Growth Opportunity Analysis
- 2.1.4. Segmental Share Analysis
- 2.1.5. Geographical Share Analysis
- 2.2. Market Analysis and Facts
- 2.3. Supply-Demand Analysis
- 2.4. Competitive Benchmarking
- 2.5. Go-to- Market Strategy
- 2.5.1. Customer/ End-use Industry Assessment
- 2.5.2. Growth Opportunity Data, 2026-2035
- 2.5.2.1. Regional Data
- 2.5.2.2. Country Data
- 2.5.2.3. Segmental Data
- 2.5.3. Identification of Potential Market Spaces
- 2.5.4. GAP Analysis
- 2.5.5. Potential Attractive Price Points
- 2.5.6. Prevailing Market Risks & Challenges
- 2.5.7. Preferred Sales & Marketing Strategies
- 2.5.8. Key Recommendations and Analysis
- 2.5.9. A Way Forward
- 2.1. Global Social Commerce Market Outlook
- 3. Industry Data and Premium Insights
- 3.1. Global Consumer Goods & Services Industry Overview, 2025
- 3.1.1. Consumer Goods & Services Ecosystem Analysis
- 3.1.2. Key Trends for Consumer Goods & Services Industry
- 3.1.3. Regional Distribution for Consumer Goods & Services Industry
- 3.2. Supplier Customer Data
- 3.3. Technology Roadmap and Developments
- 3.4. Trade Analysis
- 3.4.1. Import & Export Analysis, 2025
- 3.4.2. Top Importing Countries
- 3.4.3. Top Exporting Countries
- 3.5. Trump Tariff Impact Analysis
- 3.5.1. Manufacturer
- 3.5.1.1. Based on the component & Raw material
- 3.5.2. Supply Chain
- 3.5.3. End Consumer
- 3.5.1. Manufacturer
- 3.6. Raw Material Analysis
- 3.1. Global Consumer Goods & Services Industry Overview, 2025
- 4. Market Overview
- 4.1. Market Dynamics
- 4.1.1. Drivers
- 4.1.1.1. Rising global social media user base and smartphone penetration, enabling direct product discovery and purchases through social platforms
- 4.1.1.2. Growing influencer marketing and user-generated content, which strongly influence consumer purchase decisions
- 4.1.1.3. Increasing integration of in-app checkout, AI-driven recommendations, and digital payment solutions on social commerce platforms
- 4.1.2. Restraints
- 4.1.2.1. Data privacy and cybersecurity concerns related to personal and financial information shared on social platforms
- 4.1.2.2. Trust issues involving counterfeit products, fake reviews, and unreliable sellers affecting consumer confidence
- 4.1.1. Drivers
- 4.2. Key Trend Analysis
- 4.3. Regulatory Framework
- 4.3.1. Key Regulations, Norms, and Subsidies, by Key Countries
- 4.3.2. Tariffs and Standards
- 4.3.3. Impact Analysis of Regulations on the Market
- 4.4. Value Chain Analysis
- 4.5. Porter’s Five Forces Analysis
- 4.6. PESTEL Analysis
- 4.7. Global Social Commerce Market Demand
- 4.7.1. Historical Market Size – in Value (US$ Bn), 2020-2024
- 4.7.2. Current and Future Market Size – in Value (US$ Bn), 2026–2035
- 4.7.2.1. Y-o-Y Growth Trends
- 4.7.2.2. Absolute $ Opportunity Assessment
- 4.1. Market Dynamics
- 5. Competition Landscape
- 5.1. Competition structure
- 5.1.1. Fragmented v/s consolidated
- 5.2. Company Share Analysis, 2025
- 5.2.1. Global Company Market Share
- 5.2.2. By Region
- 5.2.2.1. North America
- 5.2.2.2. Europe
- 5.2.2.3. Asia Pacific
- 5.2.2.4. Middle East
- 5.2.2.5. Africa
- 5.2.2.6. South America
- 5.3. Product Comparison Matrix
- 5.3.1. Specifications
- 5.3.2. Market Positioning
- 5.3.3. Pricing
- 5.1. Competition structure
- 6. Global Social Commerce Market Analysis, by Platform Type
- 6.1. Key Segment Analysis
- 6.2. Social Commerce Market Size (Value - US$ Bn), Analysis, and Forecasts, by Platform Type, 2021-2035
- 6.2.1. Social Media Platforms
- 6.2.2. Messaging Platforms
- 6.2.3. Content Discovery Commerce
- 6.2.4. Live Streaming Platforms
- 6.2.5. Community-based Platforms
- 6.2.6. Others
- 7. Global Social Commerce Market Analysis, by Business Model
- 7.1. Key Segment Analysis
- 7.2. Social Commerce Market Size (Value - US$ Bn), Analysis, and Forecasts, by Business Model, 2021-2035
- 7.2.1. Business-to-Consumer (B2C)
- 7.2.2. Business-to-Business (B2B)
- 7.2.3. Consumer-to-Consumer (C2C)
- 7.2.4. Direct-to-Consumer (D2C)
- 8. Global Social Commerce Market Analysis, by Product Type
- 8.1. Key Segment Analysis
- 8.2. Social Commerce Market Size (Value - US$ Bn), Analysis, and Forecasts, by Product Type, 2021-2035
- 8.2.1. Physical Products
- 8.2.1.1. Fashion & Apparel
- 8.2.1.2. Beauty & Personal Care
- 8.2.1.3. Electronics & Gadgets
- 8.2.1.4. Home & Living
- 8.2.1.5. Food & Beverages
- 8.2.1.6. Health & Wellness Products
- 8.2.1.7. Toys & Games
- 8.2.1.8. Sports & Outdoor Equipment
- 8.2.1.9. Others
- 8.2.2. Digital Products
- 8.2.2.1. Digital Content
- 8.2.2.2. Software & Applications
- 8.2.2.3. E-books & Courses
- 8.2.2.4. Digital Art & NFTs
- 8.2.2.5. Others
- 8.2.3. Services
- 8.2.3.1. Professional Services
- 8.2.3.2. Personal Services
- 8.2.3.3. Experience & Events
- 8.2.3.4. Others
- 8.2.1. Physical Products
- 9. Global Social Commerce Market Analysis, by Device Type
- 9.1. Key Segment Analysis
- 9.2. Social Commerce Market Size (Value - US$ Bn), Analysis, and Forecasts, by Device Type, 2021-2035
- 9.2.1. Mobile Commerce
- 9.2.1.1. Smartphone
- 9.2.1.2. Tablet
- 9.2.2. Desktop Commerce
- 9.2.3. Wearable Device Commerce
- 9.2.4. Voice-activated Device Commerce
- 9.2.1. Mobile Commerce
- 10. Global Social Commerce Market Analysis, by Content Type
- 10.1. Key Segment Analysis
- 10.2. Social Commerce Market Size (Value - US$ Bn), Analysis, and Forecasts, by Content Type, 2021-2035
- 10.2.1. User-Generated Content (UGC)
- 10.2.1.1. Customer Reviews
- 10.2.1.2. Social Proof
- 10.2.1.3. Community Content
- 10.2.1.4. Others
- 10.2.2. Influencer Content
- 10.2.2.1. Macro-Influencers
- 10.2.2.2. Micro-Influencers
- 10.2.2.3. Nano-Influencers
- 10.2.2.4. Others
- 10.2.3. Brand-Generated Content
- 10.2.3.1. Shoppable Posts
- 10.2.3.2. Stories
- 10.2.3.3. Reels/Shorts
- 10.2.3.4. Others
- 10.2.4. Live Shopping Content
- 10.2.1. User-Generated Content (UGC)
- 11. Global Social Commerce Market Analysis, by Payment Method
- 11.1. Key Segment Analysis
- 11.2. Social Commerce Market Size (Value - US$ Bn), Analysis, and Forecasts, by Payment Method, 2021-2035
- 11.2.1. Digital Wallets
- 11.2.2. Credit/Debit Cards
- 11.2.3. Buy Now Pay Later (BNPL)
- 11.2.4. Bank Transfers
- 11.2.5. Cash on Delivery (COD)
- 11.2.6. Cryptocurrency
- 11.2.7. Others
- 12. Global Social Commerce Market Analysis, by Fulfillment Model
- 12.1. Key Segment Analysis
- 12.2. Social Commerce Market Size (Value - US$ Bn), Analysis, and Forecasts, by Fulfillment Model, 2021-2035
- 12.2.1. Marketplace Fulfillment
- 12.2.2. Direct Brand Fulfillment
- 12.2.3. Dropshipping
- 12.2.4. Platform-Managed Fulfillment
- 12.2.5. Hybrid Models
- 13. Global Social Commerce Market Analysis, by Region
- 13.1. Key Findings
- 13.2. Social Commerce Market Size (Value - US$ Bn), Analysis, and Forecasts, by Region, 2021-2035
- 13.2.1. North America
- 13.2.2. Europe
- 13.2.3. Asia Pacific
- 13.2.4. Middle East
- 13.2.5. Africa
- 13.2.6. South America
- 14. North America Social Commerce Market Analysis
- 14.1. Key Segment Analysis
- 14.2. Regional Snapshot
- 14.3. North America Social Commerce Market Size (Value - US$ Bn), Analysis, and Forecasts, 2021-2035
- 14.3.1. Platform Type
- 14.3.2. Business Model
- 14.3.3. Product Type
- 14.3.4. Device Type
- 14.3.5. Content Type
- 14.3.6. Payment Method
- 14.3.7. Fulfillment Model
- 14.3.8. Country
- 14.3.8.1. USA
- 14.3.8.2. Canada
- 14.3.8.3. Mexico
- 14.4. USA Social Commerce Market
- 14.4.1. Country Segmental Analysis
- 14.4.2. Platform Type
- 14.4.3. Business Model
- 14.4.4. Product Type
- 14.4.5. Device Type
- 14.4.6. Content Type
- 14.4.7. Payment Method
- 14.4.8. Fulfillment Model
- 14.5. Canada Social Commerce Market
- 14.5.1. Country Segmental Analysis
- 14.5.2. Platform Type
- 14.5.3. Business Model
- 14.5.4. Product Type
- 14.5.5. Device Type
- 14.5.6. Content Type
- 14.5.7. Payment Method
- 14.5.8. Fulfillment Model
- 14.6. Mexico Social Commerce Market
- 14.6.1. Country Segmental Analysis
- 14.6.2. Platform Type
- 14.6.3. Business Model
- 14.6.4. Product Type
- 14.6.5. Device Type
- 14.6.6. Content Type
- 14.6.7. Payment Method
- 14.6.8. Fulfillment Model
- 15. Europe Social Commerce Market Analysis
- 15.1. Key Segment Analysis
- 15.2. Regional Snapshot
- 15.3. Europe Social Commerce Market Size (Value - US$ Bn), Analysis, and Forecasts, 2021-2035
- 15.3.1. Platform Type
- 15.3.2. Business Model
- 15.3.3. Product Type
- 15.3.4. Device Type
- 15.3.5. Content Type
- 15.3.6. Payment Method
- 15.3.7. Fulfillment Model
- 15.3.8. Country
- 15.3.8.1. Germany
- 15.3.8.2. United Kingdom
- 15.3.8.3. France
- 15.3.8.4. Italy
- 15.3.8.5. Spain
- 15.3.8.6. Netherlands
- 15.3.8.7. Nordic Countries
- 15.3.8.8. Poland
- 15.3.8.9. Russia & CIS
- 15.3.8.10. Rest of Europe
- 15.4. Germany Social Commerce Market
- 15.4.1. Country Segmental Analysis
- 15.4.2. Platform Type
- 15.4.3. Business Model
- 15.4.4. Product Type
- 15.4.5. Device Type
- 15.4.6. Content Type
- 15.4.7. Payment Method
- 15.4.8. Fulfillment Model
- 15.5. United Kingdom Social Commerce Market
- 15.5.1. Country Segmental Analysis
- 15.5.2. Platform Type
- 15.5.3. Business Model
- 15.5.4. Product Type
- 15.5.5. Device Type
- 15.5.6. Content Type
- 15.5.7. Payment Method
- 15.5.8. Fulfillment Model
- 15.6. France Social Commerce Market
- 15.6.1. Country Segmental Analysis
- 15.6.2. Platform Type
- 15.6.3. Business Model
- 15.6.4. Product Type
- 15.6.5. Device Type
- 15.6.6. Content Type
- 15.6.7. Payment Method
- 15.6.8. Fulfillment Model
- 15.7. Italy Social Commerce Market
- 15.7.1. Country Segmental Analysis
- 15.7.2. Platform Type
- 15.7.3. Business Model
- 15.7.4. Product Type
- 15.7.5. Device Type
- 15.7.6. Content Type
- 15.7.7. Payment Method
- 15.7.8. Fulfillment Model
- 15.8. Spain Social Commerce Market
- 15.8.1. Country Segmental Analysis
- 15.8.2. Platform Type
- 15.8.3. Business Model
- 15.8.4. Product Type
- 15.8.5. Device Type
- 15.8.6. Content Type
- 15.8.7. Payment Method
- 15.8.8. Fulfillment Model
- 15.9. Netherlands Social Commerce Market
- 15.9.1. Country Segmental Analysis
- 15.9.2. Platform Type
- 15.9.3. Business Model
- 15.9.4. Product Type
- 15.9.5. Device Type
- 15.9.6. Content Type
- 15.9.7. Payment Method
- 15.9.8. Fulfillment Model
- 15.10. Nordic Countries Social Commerce Market
- 15.10.1. Country Segmental Analysis
- 15.10.2. Platform Type
- 15.10.3. Business Model
- 15.10.4. Product Type
- 15.10.5. Device Type
- 15.10.6. Content Type
- 15.10.7. Payment Method
- 15.10.8. Fulfillment Model
- 15.11. Poland Social Commerce Market
- 15.11.1. Country Segmental Analysis
- 15.11.2. Platform Type
- 15.11.3. Business Model
- 15.11.4. Product Type
- 15.11.5. Device Type
- 15.11.6. Content Type
- 15.11.7. Payment Method
- 15.11.8. Fulfillment Model
- 15.12. Russia & CIS Social Commerce Market
- 15.12.1. Country Segmental Analysis
- 15.12.2. Platform Type
- 15.12.3. Business Model
- 15.12.4. Product Type
- 15.12.5. Device Type
- 15.12.6. Content Type
- 15.12.7. Payment Method
- 15.12.8. Fulfillment Model
- 15.13. Rest of Europe Social Commerce Market
- 15.13.1. Country Segmental Analysis
- 15.13.2. Platform Type
- 15.13.3. Business Model
- 15.13.4. Product Type
- 15.13.5. Device Type
- 15.13.6. Content Type
- 15.13.7. Payment Method
- 15.13.8. Fulfillment Model
- 16. Asia Pacific Social Commerce Market Analysis
- 16.1. Key Segment Analysis
- 16.2. Regional Snapshot
- 16.3. Asia Pacific Social Commerce Market Size (Value - US$ Bn), Analysis, and Forecasts, 2021-2035
- 16.3.1. Platform Type
- 16.3.2. Business Model
- 16.3.3. Product Type
- 16.3.4. Device Type
- 16.3.5. Content Type
- 16.3.6. Payment Method
- 16.3.7. Fulfillment Model
- 16.3.8. Country
- 16.3.8.1. China
- 16.3.8.2. India
- 16.3.8.3. Japan
- 16.3.8.4. South Korea
- 16.3.8.5. Australia and New Zealand
- 16.3.8.6. Indonesia
- 16.3.8.7. Malaysia
- 16.3.8.8. Thailand
- 16.3.8.9. Vietnam
- 16.3.8.10. Rest of Asia Pacific
- 16.4. China Social Commerce Market
- 16.4.1. Country Segmental Analysis
- 16.4.2. Platform Type
- 16.4.3. Business Model
- 16.4.4. Product Type
- 16.4.5. Device Type
- 16.4.6. Content Type
- 16.4.7. Payment Method
- 16.4.8. Fulfillment Model
- 16.5. India Social Commerce Market
- 16.5.1. Country Segmental Analysis
- 16.5.2. Platform Type
- 16.5.3. Business Model
- 16.5.4. Product Type
- 16.5.5. Device Type
- 16.5.6. Content Type
- 16.5.7. Payment Method
- 16.5.8. Fulfillment Model
- 16.6. Japan Social Commerce Market
- 16.6.1. Country Segmental Analysis
- 16.6.2. Platform Type
- 16.6.3. Business Model
- 16.6.4. Product Type
- 16.6.5. Device Type
- 16.6.6. Content Type
- 16.6.7. Payment Method
- 16.6.8. Fulfillment Model
- 16.7. South Korea Social Commerce Market
- 16.7.1. Country Segmental Analysis
- 16.7.2. Platform Type
- 16.7.3. Business Model
- 16.7.4. Product Type
- 16.7.5. Device Type
- 16.7.6. Content Type
- 16.7.7. Payment Method
- 16.7.8. Fulfillment Model
- 16.8. Australia and New Zealand Social Commerce Market
- 16.8.1. Country Segmental Analysis
- 16.8.2. Platform Type
- 16.8.3. Business Model
- 16.8.4. Product Type
- 16.8.5. Device Type
- 16.8.6. Content Type
- 16.8.7. Payment Method
- 16.8.8. Fulfillment Model
- 16.9. Indonesia Social Commerce Market
- 16.9.1. Country Segmental Analysis
- 16.9.2. Platform Type
- 16.9.3. Business Model
- 16.9.4. Product Type
- 16.9.5. Device Type
- 16.9.6. Content Type
- 16.9.7. Payment Method
- 16.9.8. Fulfillment Model
- 16.10. Malaysia Social Commerce Market
- 16.10.1. Country Segmental Analysis
- 16.10.2. Platform Type
- 16.10.3. Business Model
- 16.10.4. Product Type
- 16.10.5. Device Type
- 16.10.6. Content Type
- 16.10.7. Payment Method
- 16.10.8. Fulfillment Model
- 16.11. Thailand Social Commerce Market
- 16.11.1. Country Segmental Analysis
- 16.11.2. Platform Type
- 16.11.3. Business Model
- 16.11.4. Product Type
- 16.11.5. Device Type
- 16.11.6. Content Type
- 16.11.7. Payment Method
- 16.11.8. Fulfillment Model
- 16.12. Vietnam Social Commerce Market
- 16.12.1. Country Segmental Analysis
- 16.12.2. Platform Type
- 16.12.3. Business Model
- 16.12.4. Product Type
- 16.12.5. Device Type
- 16.12.6. Content Type
- 16.12.7. Payment Method
- 16.12.8. Fulfillment Model
- 16.13. Rest of Asia Pacific Social Commerce Market
- 16.13.1. Country Segmental Analysis
- 16.13.2. Platform Type
- 16.13.3. Business Model
- 16.13.4. Product Type
- 16.13.5. Device Type
- 16.13.6. Content Type
- 16.13.7. Payment Method
- 16.13.8. Fulfillment Model
- 17. Middle East Social Commerce Market Analysis
- 17.1. Key Segment Analysis
- 17.2. Regional Snapshot
- 17.3. Middle East Social Commerce Market Size (Value - US$ Bn), Analysis, and Forecasts, 2021-2035
- 17.3.1. Platform Type
- 17.3.2. Business Model
- 17.3.3. Product Type
- 17.3.4. Device Type
- 17.3.5. Content Type
- 17.3.6. Payment Method
- 17.3.7. Fulfillment Model
- 17.3.8. Country
- 17.3.8.1. Turkey
- 17.3.8.2. UAE
- 17.3.8.3. Saudi Arabia
- 17.3.8.4. Israel
- 17.3.8.5. Rest of Middle East
- 17.4. Turkey Social Commerce Market
- 17.4.1. Country Segmental Analysis
- 17.4.2. Platform Type
- 17.4.3. Business Model
- 17.4.4. Product Type
- 17.4.5. Device Type
- 17.4.6. Content Type
- 17.4.7. Payment Method
- 17.4.8. Fulfillment Model
- 17.5. UAE Social Commerce Market
- 17.5.1. Country Segmental Analysis
- 17.5.2. Platform Type
- 17.5.3. Business Model
- 17.5.4. Product Type
- 17.5.5. Device Type
- 17.5.6. Content Type
- 17.5.7. Payment Method
- 17.5.8. Fulfillment Model
- 17.6. Saudi Arabia Social Commerce Market
- 17.6.1. Country Segmental Analysis
- 17.6.2. Platform Type
- 17.6.3. Business Model
- 17.6.4. Product Type
- 17.6.5. Device Type
- 17.6.6. Content Type
- 17.6.7. Payment Method
- 17.6.8. Fulfillment Model
- 17.7. Israel Social Commerce Market
- 17.7.1. Country Segmental Analysis
- 17.7.2. Platform Type
- 17.7.3. Business Model
- 17.7.4. Product Type
- 17.7.5. Device Type
- 17.7.6. Content Type
- 17.7.7. Payment Method
- 17.7.8. Fulfillment Model
- 17.8. Rest of Middle East Social Commerce Market
- 17.8.1. Country Segmental Analysis
- 17.8.2. Platform Type
- 17.8.3. Business Model
- 17.8.4. Product Type
- 17.8.5. Device Type
- 17.8.6. Content Type
- 17.8.7. Payment Method
- 17.8.8. Fulfillment Model
- 18. Africa Social Commerce Market Analysis
- 18.1. Key Segment Analysis
- 18.2. Regional Snapshot
- 18.3. Africa Social Commerce Market Size (Value - US$ Bn), Analysis, and Forecasts, 2021-2035
- 18.3.1. Platform Type
- 18.3.2. Business Model
- 18.3.3. Product Type
- 18.3.4. Device Type
- 18.3.5. Content Type
- 18.3.6. Payment Method
- 18.3.7. Fulfillment Model
- 18.3.8. Country
- 18.3.8.1. South Africa
- 18.3.8.2. Egypt
- 18.3.8.3. Nigeria
- 18.3.8.4. Algeria
- 18.3.8.5. Rest of Africa
- 18.4. South Africa Social Commerce Market
- 18.4.1. Country Segmental Analysis
- 18.4.2. Platform Type
- 18.4.3. Business Model
- 18.4.4. Product Type
- 18.4.5. Device Type
- 18.4.6. Content Type
- 18.4.7. Payment Method
- 18.4.8. Fulfillment Model
- 18.5. Egypt Social Commerce Market
- 18.5.1. Country Segmental Analysis
- 18.5.2. Platform Type
- 18.5.3. Business Model
- 18.5.4. Product Type
- 18.5.5. Device Type
- 18.5.6. Content Type
- 18.5.7. Payment Method
- 18.5.8. Fulfillment Model
- 18.6. Nigeria Social Commerce Market
- 18.6.1. Country Segmental Analysis
- 18.6.2. Platform Type
- 18.6.3. Business Model
- 18.6.4. Product Type
- 18.6.5. Device Type
- 18.6.6. Content Type
- 18.6.7. Payment Method
- 18.6.8. Fulfillment Model
- 18.7. Algeria Social Commerce Market
- 18.7.1. Country Segmental Analysis
- 18.7.2. Platform Type
- 18.7.3. Business Model
- 18.7.4. Product Type
- 18.7.5. Device Type
- 18.7.6. Content Type
- 18.7.7. Payment Method
- 18.7.8. Fulfillment Model
- 18.8. Rest of Africa Social Commerce Market
- 18.8.1. Country Segmental Analysis
- 18.8.2. Platform Type
- 18.8.3. Business Model
- 18.8.4. Product Type
- 18.8.5. Device Type
- 18.8.6. Content Type
- 18.8.7. Payment Method
- 18.8.8. Fulfillment Model
- 19. South America Social Commerce Market Analysis
- 19.1. Key Segment Analysis
- 19.2. Regional Snapshot
- 19.3. South America Social Commerce Market Size (Value - US$ Bn), Analysis, and Forecasts, 2021-2035
- 19.3.1. Platform Type
- 19.3.2. Business Model
- 19.3.3. Product Type
- 19.3.4. Device Type
- 19.3.5. Content Type
- 19.3.6. Payment Method
- 19.3.7. Fulfillment Model
- 19.3.8. Country
- 19.3.8.1. Brazil
- 19.3.8.2. Argentina
- 19.3.8.3. Rest of South America
- 19.4. Brazil Social Commerce Market
- 19.4.1. Country Segmental Analysis
- 19.4.2. Platform Type
- 19.4.3. Business Model
- 19.4.4. Product Type
- 19.4.5. Device Type
- 19.4.6. Content Type
- 19.4.7. Payment Method
- 19.4.8. Fulfillment Model
- 19.5. Argentina Social Commerce Market
- 19.5.1. Country Segmental Analysis
- 19.5.2. Platform Type
- 19.5.3. Business Model
- 19.5.4. Product Type
- 19.5.5. Device Type
- 19.5.6. Content Type
- 19.5.7. Payment Method
- 19.5.8. Fulfillment Model
- 19.6. Rest of South America Social Commerce Market
- 19.6.1. Country Segmental Analysis
- 19.6.2. Platform Type
- 19.6.3. Business Model
- 19.6.4. Product Type
- 19.6.5. Device Type
- 19.6.6. Content Type
- 19.6.7. Payment Method
- 19.6.8. Fulfillment Model
- 20. Key Players/ Company Profile
- 20.1. Alibaba Group Holding Ltd.
- 20.1.1. Company Details/ Overview
- 20.1.2. Company Financials
- 20.1.3. Key Customers and Competitors
- 20.1.4. Business/ Industry Portfolio
- 20.1.5. Product Portfolio/ Specification Details
- 20.1.6. Pricing Data
- 20.1.7. Strategic Overview
- 20.1.8. Recent Developments
- 20.2. Bambuser AB
- 20.3. Depop Ltd.
- 20.4. GOAT Group
- 20.5. Kuaishou Technology
- 20.6. Meesho Inc.
- 20.7. Meta Platforms Inc.
- 20.8. Pinduoduo Inc.
- 20.9. Pinterest Inc.
- 20.10. Poshmark, Inc.
- 20.11. Rakuten Group, Inc.
- 20.12. Shopify Inc.
- 20.13. TalkShopLive
- 20.14. TikTok (ByteDance Ltd.)
- 20.15. Whatnot Inc.
- 20.16. Xiaohongshu
- 20.17. YouTube (Google)
- 20.18. Other Key Players
- 20.1. Alibaba Group Holding Ltd.
Note* - This is just tentative list of players. While providing the report, we will cover more number of players based on their revenue and share for each geography
Research Design
Our research design integrates both demand-side and supply-side analysis through a balanced combination of primary and secondary research methodologies. By utilizing both bottom-up and top-down approaches alongside rigorous data triangulation methods, we deliver robust market intelligence that supports strategic decision-making.
MarketGenics' comprehensive research design framework ensures the delivery of accurate, reliable, and actionable market intelligence. Through the integration of multiple research approaches, rigorous validation processes, and expert analysis, we provide our clients with the insights needed to make informed strategic decisions and capitalize on market opportunities.

MarketGenics leverages a dedicated industry panel of experts and a comprehensive suite of paid databases to effectively collect, consolidate, and analyze market intelligence.
Our approach has consistently proven to be reliable and effective in generating accurate market insights, identifying key industry trends, and uncovering emerging business opportunities.
Through both primary and secondary research, we capture and analyze critical company-level data such as manufacturing footprints, including technical centers, R&D facilities, sales offices, and headquarters.
Our expert panel further enhances our ability to estimate market size for specific brands based on validated field-level intelligence.
Our data mining techniques incorporate both parametric and non-parametric methods, allowing for structured data collection, sorting, processing, and cleaning.
Demand projections are derived from large-scale data sets analyzed through proprietary algorithms, culminating in robust and reliable market sizing.
Research Approach
The bottom-up approach builds market estimates by starting with the smallest addressable market units and systematically aggregating them to create comprehensive market size projections.
This method begins with specific, granular data points and builds upward to create the complete market landscape.
Customer Analysis → Segmental Analysis → Geographical Analysis
The top-down approach starts with the broadest possible market data and systematically narrows it down through a series of filters and assumptions to arrive at specific market segments or opportunities.
This method begins with the big picture and works downward to increasingly specific market slices.
TAM → SAM → SOM


Research Methods
Desk / Secondary Research
While analysing the market, we extensively study secondary sources, directories, and databases to identify and collect information useful for this technical, market-oriented, and commercial report. Secondary sources that we utilize are not only the public sources, but it is a combination of Open Source, Associations, Paid Databases, MG Repository & Knowledgebase, and others.
- Company websites, annual reports, financial reports, broker reports, and investor presentations
- National government documents, statistical databases and reports
- News articles, press releases and web-casts specific to the companies operating in the market, Magazines, reports, and others
- We gather information from commercial data sources for deriving company specific data such as segmental revenue, share for geography, product revenue, and others
- Internal and external proprietary databases (industry-specific), relevant patent, and regulatory databases
- Governing Bodies, Government Organizations
- Relevant Authorities, Country-specific Associations for Industries
We also employ the model mapping approach to estimate the product level market data through the players' product portfolio
Primary Research
Primary research/ interviews is vital in analyzing the market. Most of the cases involves paid primary interviews. Primary sources include primary interviews through e-mail interactions, telephonic interviews, surveys as well as face-to-face interviews with the different stakeholders across the value chain including several industry experts.
| Type of Respondents | Number of Primaries |
|---|---|
| Tier 2/3 Suppliers | ~20 |
| Tier 1 Suppliers | ~25 |
| End-users | ~25 |
| Industry Expert/ Panel/ Consultant | ~30 |
| Total | ~100 |
MG Knowledgebase
• Repository of industry blog, newsletter and case studies
• Online platform covering detailed market reports, and company profiles
Forecasting Factors and Models
Forecasting Factors
- Historical Trends – Past market patterns, cycles, and major events that shaped how markets behave over time. Understanding past trends helps predict future behavior.
- Industry Factors – Specific characteristics of the industry like structure, regulations, and innovation cycles that affect market dynamics.
- Macroeconomic Factors – Economic conditions like GDP growth, inflation, and employment rates that affect how much money people have to spend.
- Demographic Factors – Population characteristics like age, income, and location that determine who can buy your product.
- Technology Factors – How quickly people adopt new technology and how much technology infrastructure exists.
- Regulatory Factors – Government rules, laws, and policies that can help or restrict market growth.
- Competitive Factors – Analyzing competition structure such as degree of competition and bargaining power of buyers and suppliers.
Forecasting Models / Techniques
Multiple Regression Analysis
- Identify and quantify factors that drive market changes
- Statistical modeling to establish relationships between market drivers and outcomes
Time Series Analysis – Seasonal Patterns
- Understand regular cyclical patterns in market demand
- Advanced statistical techniques to separate trend, seasonal, and irregular components
Time Series Analysis – Trend Analysis
- Identify underlying market growth patterns and momentum
- Statistical analysis of historical data to project future trends
Expert Opinion – Expert Interviews
- Gather deep industry insights and contextual understanding
- In-depth interviews with key industry stakeholders
Multi-Scenario Development
- Prepare for uncertainty by modeling different possible futures
- Creating optimistic, pessimistic, and most likely scenarios
Time Series Analysis – Moving Averages
- Sophisticated forecasting for complex time series data
- Auto-regressive integrated moving average models with seasonal components
Econometric Models
- Apply economic theory to market forecasting
- Sophisticated economic models that account for market interactions
Expert Opinion – Delphi Method
- Harness collective wisdom of industry experts
- Structured, multi-round expert consultation process
Monte Carlo Simulation
- Quantify uncertainty and probability distributions
- Thousands of simulations with varying input parameters
Research Analysis
Our research framework is built upon the fundamental principle of validating market intelligence from both demand and supply perspectives. This dual-sided approach ensures comprehensive market understanding and reduces the risk of single-source bias.
Demand-Side Analysis: We understand end-user/application behavior, preferences, and market needs along with the penetration of the product for specific application.
Supply-Side Analysis: We estimate overall market revenue, analyze the segmental share along with industry capacity, competitive landscape, and market structure.
Validation & Evaluation
Data triangulation is a validation technique that uses multiple methods, sources, or perspectives to examine the same research question, thereby increasing the credibility and reliability of research findings. In market research, triangulation serves as a quality assurance mechanism that helps identify and minimize bias, validate assumptions, and ensure accuracy in market estimates.
- Data Source Triangulation – Using multiple data sources to examine the same phenomenon
- Methodological Triangulation – Using multiple research methods to study the same research question
- Investigator Triangulation – Using multiple researchers or analysts to examine the same data
- Theoretical Triangulation – Using multiple theoretical perspectives to interpret the same data

Custom Market Research Services
We will customise the research for you, in case the report listed above does not meet your requirements.
Get 10% Free Customisation