Battery Energy Storage Market Size, Share & Trends Analysis Report by Battery Technology Type (Lithium-ion, Lead-acid, Flow Batteries, Solid-state Batteries, Sodium-ion Batteries, Advanced Chemistries (Thermal Energy Storage (TES), Compressed Air Energy Storage (CAES), etc.)), Discharge Time, Capacity Range, Installation Type, Application, End-users, Integration Level and Geography (North America, Europe, Asia Pacific, Middle East, Africa, and South America) – Global Industry Data, Trends, and Forecasts, 2026–2035
|
|
|
Segmental Data Insights |
|
|
Demand Trends |
|
|
Competitive Landscape |
|
|
Strategic Development |
|
|
Future Outlook & Opportunities |
|
Battery Energy Storage Market Size, Share, and Growth
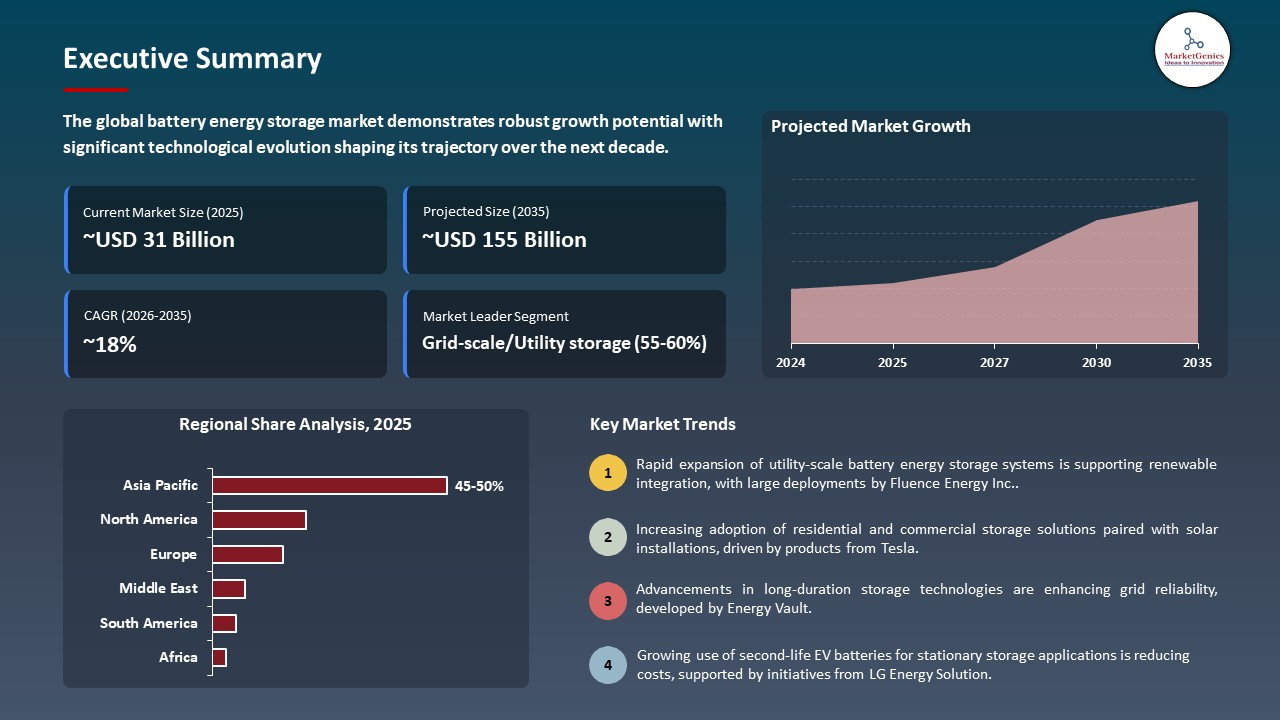
The global battery energy storage market is witnessing strong growth, valued at USD 30.7 billion in 2025 and projected to reach USD 155.3 billion by 2035, expanding at a CAGR of 17.6% during the forecast period. North America is the fastest-growing region due to large-scale renewable integration, substantial utility investments in energy storage infrastructure, and favorable regulatory incentives supporting grid modernization and decarbonization goals.
Luke Witmer, Vice President of Energy Storage Software Engineering at Wärtsilä, said, “Our industry is experiencing changes in policy and global trade. GEMS Pulse reduces risk and strengthens the long-term economics of clean energy. It gives customers real-time visibility and predictive intelligence so they can run their assets with confidence and speed, Batteries are fundamental to renewable energy integration and deliver real value, no matter how the market twists and turns or how policies evolve.”
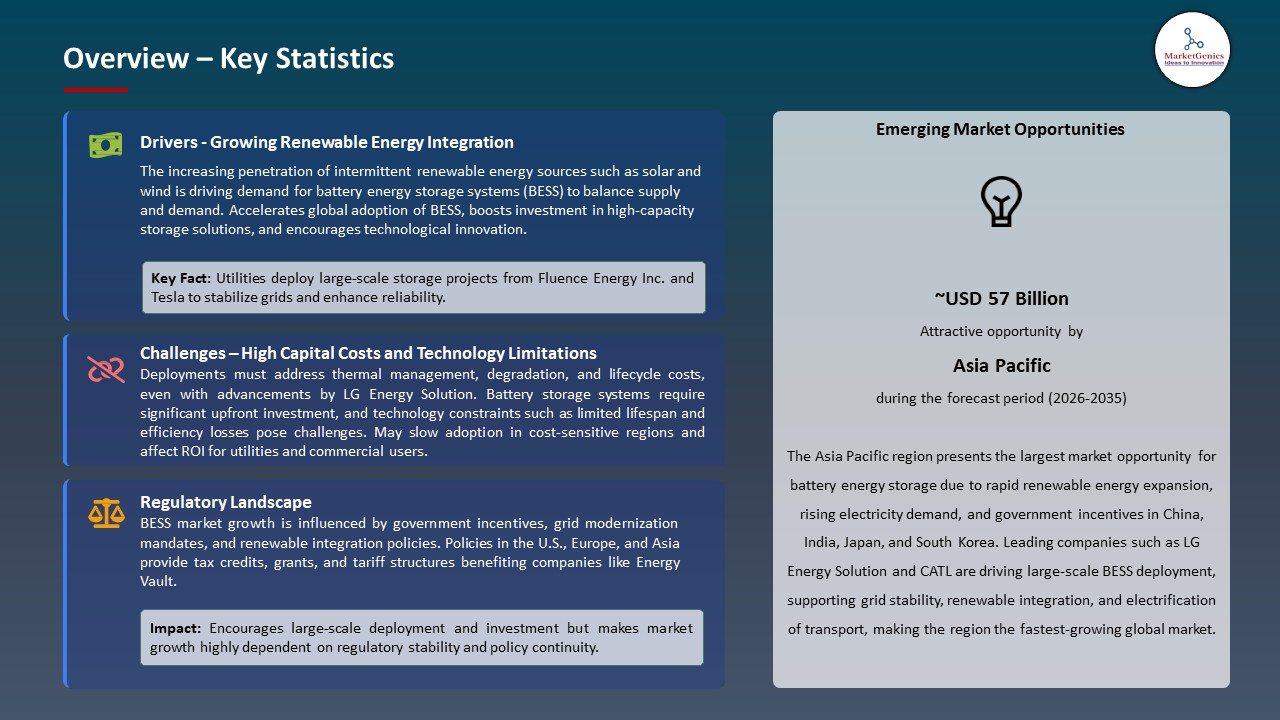
The increasing popularity of grid stability and reliability and the rapid adoption of renewable energy are driving the global battery energy storage (BESS) market. The storage systems are useful in utility-scale as they make it possible to regulate frequency, shave peaks, and reserve capacity so that the grids can cope with intermittency in terms of solar and wind energy. Energy storage is becoming a common practice in industrial and commercial industries so that the costs of operations can be minimized and to maintain constant power supply.
NextEra Energy collaborated in 2025 with Google Cloud to build multi-gigawatt data centers in the U.S. using a combination of AI-powered functionality with renewable energy and BESS infrastructure to streamline performance and grid resilience. Likewise, the Redwood Materials of Tesla co-founder JB Straubel recycled second-life EV batteries to build the largest AI-powered microgrid in North America, which combines 12MW of solar and 63MW of storage to supply clean energy which is both cost-effective and dispatchable. These inventions point to the fact that technology and tactical deployments are increasing storage capacity and efficiency.
Adjacent opportunities for the battery energy storage market include second-life EV batteries, microgrid development, behind-the-meter residential storage, utility-scale solar-plus-storage projects, and integration with electric vehicle charging infrastructure. These areas enable rapid deployment, cost optimization, and enhanced renewable integration, driving innovation and market expansion.
 Battery Energy Storage Market Dynamics and Trends
Driver: Expansion of Utility‑Scale Battery Energy Storage to Support Grid Reliability
-
The market is being driven by the rapid growth of utility-scale battery energy storage systems that allow power grids to accommodate growing renewable energy penetration whilst remaining stable. These are massive systems that supply much-needed services of frequency control, peak shearing, shifting loads, and reserve power which lessen curtailment of intermittent generation by the sun and wind.
- By making grids more resilient and operationalizing every aspect of the grid, utility-scale batteries can contribute to a stable supply of electricity, better energy dispatch and faster integration of renewable energy into industrial, commercial, and utility-scale sectors.
- In 2025, BYD deployed 12.5 GWh of BESS in five Saudi locations, facilitating the integration of large-scale renewable power sources, peak demand management, making it the largest grid-scale deployment of storage globally.
- The use of utility scale batteries is accelerating integration of renewable products and increasing reliability of the global grid.
Restraint: Supply Chain Volatility and Raw Material Pricing Impacting Project Costs
-
The supply chain is volatile in the battery energy storage market and the prices of raw materials especially lithium, cobalt, nickel and electrolytes are fluctuating and pose significant challenges to the sector. High-capacity and long-life batteries use these materials and events of interruption in mining, transportation, or politics may directly raise the cost of the project and put a hold on the system deployment.
- The manufacturers and developers are faced with uncertainties in procurement, inventory and logistics and balancing the increasing cost of the important components. Financial planning, contract negotiation, and economic viability of the large-scale storage projects can be influenced by price changes especially in the emerging markets.
- The supply chain stability and strategic sourcing are essential to the successful expansion of the battery energy storage industry of the world due to the possibility of also increasing project timelines, increasing operational budgets, and delayed investment returns.
Opportunity: Adoption of Second‑Life EV Batteries for Cost‑Effective Storage Solutions
-
Second-life electric vehicle (EV) battery acceptance is a large opportunity to the energy storage market with the second-life batteries offering low-cost alternatives to alternative battery systems. Reused EV batteries have the potential to offer grid, business, and industrial storage capacity reliably and prolong the life of the existing resources.
- Using used EV batteries, developers would be able to save on capital investment, decrease the environmental footprint, and contribute to the efforts of the circular economy. The strategy will also allow more rapid implementation of storage initiatives, greater grid flexibility, integration of renewable energies, and access to energy, as well as sustainable development of the sector.
- In 2025, Redwood Materials used EV batteries to drive AI data centers, making North America the largest microgrid, 12MW solar and 63MWh storage, which provides scalable and cost-effective 24/7 renewable energy to support the high-demand AI infrastructure.
- Second-life EV batteries are boosting sustainable, economical, and scalable energy storage implementation in industrial and grid applications.
Key Trend: Integration of AI and Predictive Analytics for Smarter Storage Operations
-
The combination of predictive analytics and artificial intelligence (AI) is changing the operation of energy storage by providing the ability to monitor the conditions in real-time, make more sophisticated predictions, and automatically dispatch stored energy. The technologies will be able to optimize battery behavior, predict maintenance, and increase grid reliability to ensure storage assets can work effectively in different demand and renewable generation conditions.
- Using AI-enabled insights, operators are able to cut operational expenses, maximize assets, and naturally merge storage with renewable energy sources, powering smarter, more resilient and flexible energy networks around the world.
- In 2025, Wärtsilas introduced GEMS Pulse, a predictive analytics platform that maximizes the performance and revenue of Battery Energy Storage (BESS) through the conversion of battery data into actionable insights, identification of anomalies, and optimization of operations throughout the system lifecycle.
- AI-based solutions are very beneficial in terms of improving energy storage efficiency, reliability, and profitability in utility and industrial sectors.
 Battery Energy Storage Market Analysis and Segmental Data
Grid-scale/Utility storage Dominate Global Battery Energy Storage Market
-
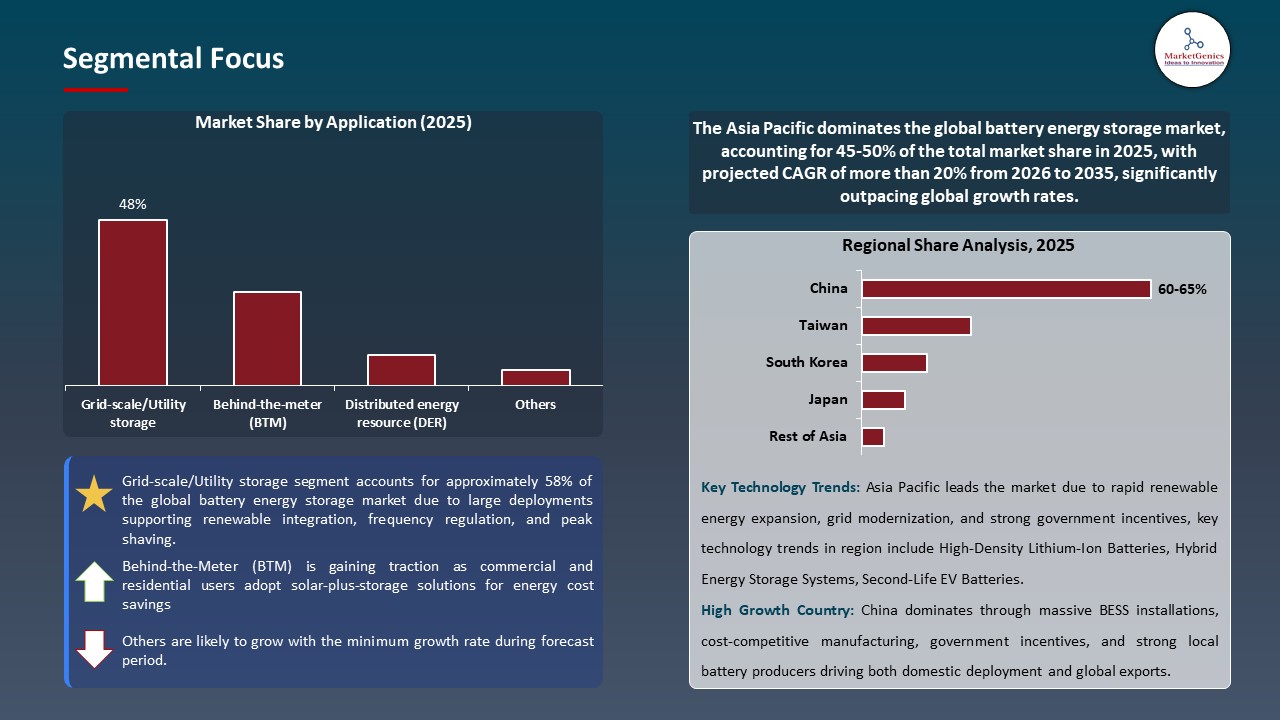
The grid-scale or utility storage segment dominates the global Battery Energy Storage market, holding the largest share due to its ability to provide large-scale energy management and support renewable integration. These systems contribute to stabilization of electricity grids by providing frequency regulation, peak shaving, load balancing and backup power which will provide reliability in areas with increasing renewable penetration.
- Storage projects in utilities scale have economies of scale and thus can be deployed cost-effectively in comparison to smaller residential or commercial projects. They also assist utility companies to manage distributed energy resources and curtail solar and wind energy.
- The utility-scale storage dominance is the issue that creates the large-scale utilization of renewable power sources and enhances grid stability across the globe.
Asia Pacific Leads Global Battery Energy Storage Market Demand
-
Asia Pacific leads the global Battery Energy Storage market due to its abundant renewable energy resources, rapid industrialization, and strong government support for clean energy initiatives. Large-scale battery storage projects are being aggressively pursued in countries like China, Japan and South Korea to stabilize the grids, to combine solar and wind energy and to satisfy the increased electricity demand in their countries fuelled by urbanization and electrification.
- The area is also insourced with strong manufacturing capacities especially in lithium-ion batteries and this will make it cost effective as well as quicker to roll out. Policies, subsidies and renewable portfolio standards also make the use of energy storage solution by the utilities and other private businesses more attractive.
- The leadership of Asia Pacific promotes energy transition globally and the massive implementation of battery energy storage solutions.
Battery Energy Storage Market Ecosystem
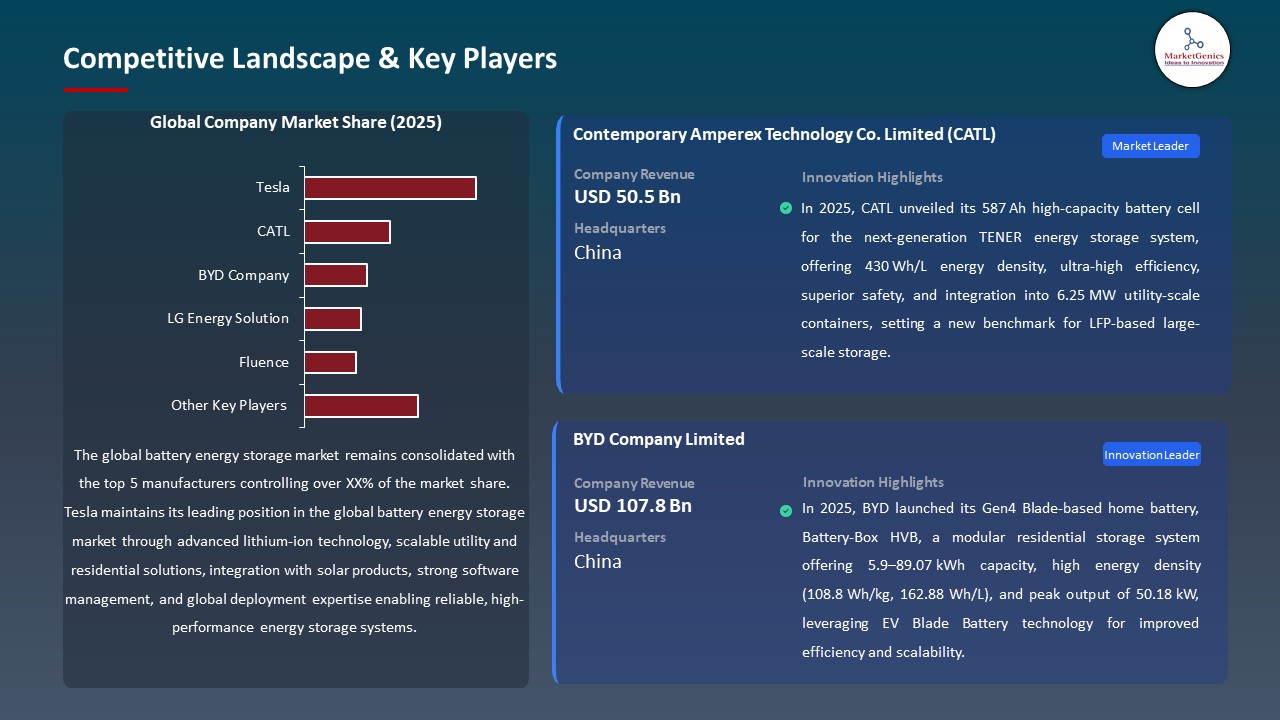
The global battery energy storage market is consolidated, with leading players including Tesla, CATL, BYD Company, LG Energy Solution, and Fluence. To sustain competitive advantage these companies, employ a variety of battery chemistries, modular storage technologies and vast global manufacturing and distribution networks. Their market leadership is enhanced by strategic partnerships with utilities, investments in high capacity renewable integration, and unceasing research and development on high capacity and long-life energy storage facilities.
The value chain goes through sourcing of raw materials (lithium, cobalt, nickel, electrolytes), cell manufacturing, module and pack assembly, integration of energy management systems, deployment and after sales services (performance monitoring, maintenance, and recycling). The stages are safe, thermal, energy and long-lived in residential, commercial and utility scales.
Barriers to entry are high due to capital intensive production, technological complexity, and high OEM supplier relationships. Differentiation, scalability, and sustainable development in Battery Energy Storage are still being led by innovations in solid-state batteries and high-energy-density chemistries and modular storage solutions.
 Recent Development and Strategic Overview:
-
In December 2025, RWE took the final investment decision for its Pembroke Battery Storage project in the UK, featuring a 350 MW peak output and 700 MWh lithium-ion storage capacity. The 212-container system will support the Pembroke Net Zero Centre, enhance grid reliability, and enable two hours of continuous power supply, with construction starting in H1 2026 and commissioning expected in H2 2028.
- In March 2026, ACME Solar Holdings commissioned a major 142.67 MW / 481.49 MWh battery Battery Energy Storage (BESS) project in Rajasthan, India, marking a significant deployment of utility‑scale storage capacity to support grid stability and renewable energy integration. The systems, connected to the inter‑state transmission network, will initially operate on a merchant basis and are planned for integration with firm and dispatchable renewable energy projects under long‑term power arrangements.
Report Scope
|
Detail |
|
|
Market Size in 2025 |
USD 46.9 Bn |
|
Market Forecast Value in 2035 |
USD 140.5 Bn |
|
Growth Rate (CAGR) |
11.6% |
|
Forecast Period |
2026 – 2035 |
|
Historical Data Available for |
2021 – 2024 |
|
Market Size Units |
US$ Billion for Value Thousand Units for Volume |
|
Report Format |
Electronic (PDF) + Excel |
|
North America |
Europe |
Asia Pacific |
Middle East |
Africa |
South America |
|
|
|
|
|
|
|
Companies Covered |
|||||
|
|
|
|
|
|
Battery Energy Storage Market Segmentation and Highlights
|
Segment |
Sub-segment |
|
Battery Energy Storage Market, By Battery Technology Type |
|
|
Battery Energy Storage Market, By Discharge Time |
|
|
Battery Energy Storage Market, By Capacity Range |
|
|
Battery Energy Storage Market, By Installation Type |
|
|
Battery Energy Storage Market, By Application |
|
|
Battery Energy Storage Market, By End-users |
|
Frequently Asked Questions
Table of Contents
- 1. Research Methodology and Assumptions
- 1.1. Definitions
- 1.2. Research Design and Approach
- 1.3. Data Collection Methods
- 1.4. Base Estimates and Calculations
- 1.5. Forecasting Models
- 1.5.1. Key Forecast Factors & Impact Analysis
- 1.6. Secondary Research
- 1.6.1. Open Sources
- 1.6.2. Paid Databases
- 1.6.3. Associations
- 1.7. Primary Research
- 1.7.1. Primary Sources
- 1.7.2. Primary Interviews with Stakeholders across Ecosystem
- 2. Executive Summary
- 2.1. Global Battery Energy Storage Market Outlook
- 2.1.1. Battery Energy Storage Market (Volume (Units) and Value (US$ Bn)), and Forecasts, 2021-2035
- 2.1.2. Compounded Annual Growth Rate Analysis
- 2.1.3. Growth Opportunity Analysis
- 2.1.4. Segmental Share Analysis
- 2.1.5. Geographical Share Analysis
- 2.2. Market Analysis and Facts
- 2.3. Supply-Demand Analysis
- 2.4. Competitive Benchmarking
- 2.5. Go-to- Market Strategy
- 2.5.1. Customer/ End-use Industry Assessment
- 2.5.2. Growth Opportunity Data, 2026-2035
- 2.5.2.1. Regional Data
- 2.5.2.2. Country Data
- 2.5.2.3. Segmental Data
- 2.5.3. Identification of Potential Market Spaces
- 2.5.4. GAP Analysis
- 2.5.5. Potential Attractive Price Points
- 2.5.6. Prevailing Market Risks & Challenges
- 2.5.7. Preferred Sales & Marketing Strategies
- 2.5.8. Key Recommendations and Analysis
- 2.5.9. A Way Forward
- 2.1. Global Battery Energy Storage Market Outlook
- 3. Industry Data and Premium Insights
- 3.1. Global Energy & Power Industry Overview, 2025
- 3.1.1. Energy & Power Industry Ecosystem Analysis
- 3.1.2. Key Trends for Energy & Power Industry
- 3.1.3. Regional Distribution for Energy & Power Industry
- 3.2. Supplier Customer Data
- 3.3. Technology Roadmap and Developments
- 3.4. Trade Analysis
- 3.4.1. Import & Export Analysis, 2025
- 3.4.2. Top Importing Countries
- 3.4.3. Top Exporting Countries
- 3.5. Trump Tariff Impact Analysis
- 3.5.1. Manufacturer
- 3.5.1.1. Based on the component & Raw material
- 3.5.2. Supply Chain
- 3.5.3. End Consumer
- 3.5.1. Manufacturer
- 3.6. Raw Material Analysis
- 3.1. Global Energy & Power Industry Overview, 2025
- 4. Market Overview
- 4.1. Market Dynamics
- 4.1.1. Drivers
- 4.1.1.1. Rapid expansion of utility-scale battery energy storage for grid flexibility.
- 4.1.1.2. Growing integration of renewable energy sources requiring reliable storage.
- 4.1.1.3. Technological advancements in high-capacity and long-life battery systems.
- 4.1.2. Restraints
- 4.1.2.1. Supply chain volatility and fluctuating raw material prices.
- 4.1.2.2. High upfront capital costs and complex installation requirements.
- 4.1.1. Drivers
- 4.2. Key Trend Analysis
- 4.3. Regulatory Framework
- 4.3.1. Key Regulations, Norms, and Subsidies, by Key Countries
- 4.3.2. Tariffs and Standards
- 4.3.3. Impact Analysis of Regulations on the Market
- 4.4. Ecosystem Analysis
- 4.5. Porter’s Five Forces Analysis
- 4.6. PESTEL Analysis
- 4.7. Global Battery Energy Storage Market Demand
- 4.7.1. Historical Market Size – (Volume (Units) and Value (US$ Bn)), 2020-2024
- 4.7.2. Current and Future Market Size – (Volume (Units) and Value (US$ Bn)), 2026–2035
- 4.7.2.1. Y-o-Y Growth Trends
- 4.7.2.2. Absolute $ Opportunity Assessment
- 4.1. Market Dynamics
- 5. Competition Landscape
- 5.1. Competition structure
- 5.1.1. Fragmented v/s consolidated
- 5.2. Company Share Analysis, 2025
- 5.2.1. Global Company Market Share
- 5.2.2. By Region
- 5.2.2.1. North America
- 5.2.2.2. Europe
- 5.2.2.3. Asia Pacific
- 5.2.2.4. Middle East
- 5.2.2.5. Africa
- 5.2.2.6. South America
- 5.3. Product Comparison Matrix
- 5.3.1. Specifications
- 5.3.2. Market Positioning
- 5.3.3. Pricing
- 5.1. Competition structure
- 6. Global Battery Energy Storage Market Analysis, by Battery Technology Type
- 6.1. Key Segment Analysis
- 6.2. Battery Energy Storage Market (Volume (Units) and Value (US$ Bn)), Analysis, and Forecasts, by Battery Technology Type, 2021-2035
- 6.2.1. Lithium-ion
- 6.2.1.1. Lithium Iron Phosphate (LFP)
- 6.2.1.2. Lithium Nickel Manganese Cobalt Oxide (NMC)
- 6.2.1.3. Lithium Nickel Cobalt Aluminum Oxide (NCA)
- 6.2.1.4. Lithium Cobalt Oxide (LCO)
- 6.2.1.5. Others
- 6.2.2. Lead-acid
- 6.2.2.1. Flooded Lead-Acid
- 6.2.2.2. Sealed Lead-Acid
- 6.2.2.3. Absorbent Glass Mat (AGM)
- 6.2.2.4. Others
- 6.2.3. Flow Batteries
- 6.2.3.1. Vanadium Redox
- 6.2.3.2. Zinc-Bromine
- 6.2.3.3. Iron-Air
- 6.2.3.4. Others
- 6.2.4. Solid-state Batteries
- 6.2.5. Sodium-ion Batteries
- 6.2.6. Advanced Chemistries (Thermal Energy Storage (TES), Compressed Air Energy Storage (CAES), etc.)
- 6.2.1. Lithium-ion
- 7. Global Battery Energy Storage Market Analysis, by Discharge Time
- 7.1. Key Segment Analysis
- 7.2. Battery Energy Storage Market (Volume (Units) and Value (US$ Bn)), Analysis, and Forecasts, by Discharge Time, 2021-2035
- 7.2.1. Short Duration (0-4 hours)
- 7.2.2. Medium Duration (4-12 hours)
- 7.2.3. Long Duration (12-24 hours)
- 8. Global Battery Energy Storage Market Analysis, Capacity Range
- 8.1. Key Segment Analysis
- 8.2. Battery Energy Storage Market (Volume (Units) and Value (US$ Bn)), Analysis, and Forecasts, by Capacity Range, 2021-2035
- 8.2.1. Up to 100 kWh
- 8.2.2. 100 kWh - 1 MWh
- 8.2.3. 1 MWh - 100 MWh
- 8.2.4. Above 100 MWh
- 9. Global Battery Energy Storage Market Analysis, by Installation Type
- 9.1. Key Segment Analysis
- 9.2. Battery Energy Storage Market (Volume (Units) and Value (US$ Bn)), Analysis, and Forecasts, by Installation Type, 2021-2035
- 9.2.1. On-grid/Grid-connected
- 9.2.2. Off-grid/Standalone
- 9.2.3. Hybrid
- 10. Global Battery Energy Storage Market Analysis, by Application
- 10.1. Key Segment Analysis
- 10.2. Battery Energy Storage Market (Volume (Units) and Value (US$ Bn)), Analysis, and Forecasts, by Application, 2021-2035
- 10.2.1. Grid-scale/Utility storage
- 10.2.2. Behind-the-meter (BTM)
- 10.2.3. Distributed energy resource (DER)
- 10.2.4. Microgrid applications
- 10.2.5. Vehicle-to-grid (V2G)
- 10.2.6. Standalone systems
- 10.2.7. Portable/Mobile Storage
- 10.2.8. Others
- 11. Global Battery Energy Storage Market Analysis, by End-users
- 11.1. Key Segment Analysis
- 11.2. Battery Energy Storage Market (Volume (Units) and Value (US$ Bn)), Analysis, and Forecasts, by End-users, 2021-2035
- 11.2.1. Renewable Energy Integration
- 11.2.2. Utility-scale Facilities
- 11.2.3. Commercial & Industrial
- 11.2.4. Residential & Distributed Energy
- 11.2.5. Microgrids
- 11.2.6. Transportation & Mobility
- 11.2.7. Government & Public Institutions
- 11.2.8. Remote & Off-Grid Applications
- 11.2.9. Others
- 12. Global Battery Energy Storage Market Analysis, by Integration Level
- 12.1. Key Segment Analysis
- 12.2. Battery Energy Storage Market (Volume (Units) and Value (US$ Bn)), Analysis, and Forecasts, by Integration Level, 2021-2035
- 12.2.1. Standalone BESS
- 12.2.2. Renewable-integrated
- 12.2.3. Grid-integrated Solutions
- 12.2.4. Hybrid Power Systems
- 12.2.5. Microgrid-integrated Systems
- 13. Global Battery Energy Storage Market Analysis and Forecasts, by Region
- 13.1. Key Findings
- 13.2. Battery Energy Storage Market (Volume (Units) and Value (US$ Bn)), Analysis, and Forecasts, by Region, 2021-2035
- 13.2.1. North America
- 13.2.2. Europe
- 13.2.3. Asia Pacific
- 13.2.4. Middle East
- 13.2.5. Africa
- 13.2.6. South America
- 14. North America Battery Energy Storage Market Analysis
- 14.1. Key Segment Analysis
- 14.2. Regional Snapshot
- 14.3. North America Battery Energy Storage Market (Volume (Units) and Value (US$ Bn)), Analysis, and Forecasts, 2021-2035
- 14.3.1. Battery Technology Type
- 14.3.2. Discharge Time
- 14.3.3. Capacity Range
- 14.3.4. Installation Type
- 14.3.5. Application
- 14.3.6. End-users
- 14.3.7. Integration Level
- 14.3.8. Country
- 14.3.8.1. USA
- 14.3.8.2. Canada
- 14.3.8.3. Mexico
- 14.4. USA Battery Energy Storage Market
- 14.4.1. Country Segmental Analysis
- 14.4.2. Battery Technology Type
- 14.4.3. Discharge Time
- 14.4.4. Capacity Range
- 14.4.5. Installation Type
- 14.4.6. Application
- 14.4.7. End-users
- 14.4.8. Integration Level
- 14.5. Canada Battery Energy Storage Market
- 14.5.1. Country Segmental Analysis
- 14.5.2. Battery Technology Type
- 14.5.3. Discharge Time
- 14.5.4. Capacity Range
- 14.5.5. Installation Type
- 14.5.6. Application
- 14.5.7. End-users
- 14.5.8. Integration Level
- 14.6. Mexico Battery Energy Storage Market
- 14.6.1. Country Segmental Analysis
- 14.6.2. Battery Technology Type
- 14.6.3. Discharge Time
- 14.6.4. Capacity Range
- 14.6.5. Installation Type
- 14.6.6. Application
- 14.6.7. End-users
- 14.6.8. Integration Level
- 15. Europe Battery Energy Storage Market Analysis
- 15.1. Key Segment Analysis
- 15.2. Regional Snapshot
- 15.3. Europe Battery Energy Storage Market (Volume (Units) and Value (US$ Bn)), Analysis, and Forecasts, 2021-2035
- 15.3.1. Battery Technology Type
- 15.3.2. Discharge Time
- 15.3.3. Capacity Range
- 15.3.4. Installation Type
- 15.3.5. Application
- 15.3.6. End-users
- 15.3.7. Integration Level
- 15.3.8. Country
- 15.3.8.1. Germany
- 15.3.8.2. United Kingdom
- 15.3.8.3. France
- 15.3.8.4. Italy
- 15.3.8.5. Spain
- 15.3.8.6. Netherlands
- 15.3.8.7. Nordic Countries
- 15.3.8.8. Poland
- 15.3.8.9. Russia & CIS
- 15.3.8.10. Rest of Europe
- 15.4. Germany Battery Energy Storage Market
- 15.4.1. Country Segmental Analysis
- 15.4.2. Battery Technology Type
- 15.4.3. Discharge Time
- 15.4.4. Capacity Range
- 15.4.5. Installation Type
- 15.4.6. Application
- 15.4.7. End-users
- 15.4.8. Integration Level
- 15.5. United Kingdom Battery Energy Storage Market
- 15.5.1. Country Segmental Analysis
- 15.5.2. Battery Technology Type
- 15.5.3. Discharge Time
- 15.5.4. Capacity Range
- 15.5.5. Installation Type
- 15.5.6. Application
- 15.5.7. End-users
- 15.5.8. Integration Level
- 15.6. France Battery Energy Storage Market
- 15.6.1. Country Segmental Analysis
- 15.6.2. Battery Technology Type
- 15.6.3. Discharge Time
- 15.6.4. Capacity Range
- 15.6.5. Installation Type
- 15.6.6. Application
- 15.6.7. End-users
- 15.6.8. Integration Level
- 15.7. Italy Battery Energy Storage Market
- 15.7.1. Country Segmental Analysis
- 15.7.2. Battery Technology Type
- 15.7.3. Discharge Time
- 15.7.4. Capacity Range
- 15.7.5. Installation Type
- 15.7.6. Application
- 15.7.7. End-users
- 15.7.8. Integration Level
- 15.8. Spain Battery Energy Storage Market
- 15.8.1. Country Segmental Analysis
- 15.8.2. Battery Technology Type
- 15.8.3. Discharge Time
- 15.8.4. Capacity Range
- 15.8.5. Installation Type
- 15.8.6. Application
- 15.8.7. End-users
- 15.8.8. Integration Level
- 15.9. Netherlands Battery Energy Storage Market
- 15.9.1. Country Segmental Analysis
- 15.9.2. Battery Technology Type
- 15.9.3. Discharge Time
- 15.9.4. Capacity Range
- 15.9.5. Installation Type
- 15.9.6. Application
- 15.9.7. End-users
- 15.9.8. Integration Level
- 15.10. Nordic Countries Battery Energy Storage Market
- 15.10.1. Country Segmental Analysis
- 15.10.2. Battery Technology Type
- 15.10.3. Discharge Time
- 15.10.4. Capacity Range
- 15.10.5. Installation Type
- 15.10.6. Application
- 15.10.7. End-users
- 15.10.8. Integration Level
- 15.11. Poland Battery Energy Storage Market
- 15.11.1. Country Segmental Analysis
- 15.11.2. Battery Technology Type
- 15.11.3. Discharge Time
- 15.11.4. Capacity Range
- 15.11.5. Installation Type
- 15.11.6. Application
- 15.11.7. End-users
- 15.11.8. Integration Level
- 15.12. Russia & CIS Battery Energy Storage Market
- 15.12.1. Country Segmental Analysis
- 15.12.2. Battery Technology Type
- 15.12.3. Discharge Time
- 15.12.4. Capacity Range
- 15.12.5. Installation Type
- 15.12.6. Application
- 15.12.7. End-users
- 15.12.8. Integration Level
- 15.13. Rest of Europe Battery Energy Storage Market
- 15.13.1. Country Segmental Analysis
- 15.13.2. Battery Technology Type
- 15.13.3. Discharge Time
- 15.13.4. Capacity Range
- 15.13.5. Installation Type
- 15.13.6. Application
- 15.13.7. End-users
- 15.13.8. Integration Level
- 16. Asia Pacific Battery Energy Storage Market Analysis
- 16.1. Key Segment Analysis
- 16.2. Regional Snapshot
- 16.3. Asia Pacific Battery Energy Storage Market (Volume (Units) and Value (US$ Bn)), Analysis, and Forecasts, 2021-2035
- 16.3.1. Battery Technology Type
- 16.3.2. Discharge Time
- 16.3.3. Capacity Range
- 16.3.4. Installation Type
- 16.3.5. Application
- 16.3.6. End-users
- 16.3.7. Integration Level
- 16.3.8. Country
- 16.3.8.1. China
- 16.3.8.2. India
- 16.3.8.3. Japan
- 16.3.8.4. South Korea
- 16.3.8.5. Australia and New Zealand
- 16.3.8.6. Indonesia
- 16.3.8.7. Malaysia
- 16.3.8.8. Thailand
- 16.3.8.9. Vietnam
- 16.3.8.10. Rest of Asia Pacific
- 16.4. China Battery Energy Storage Market
- 16.4.1. Country Segmental Analysis
- 16.4.2. Battery Technology Type
- 16.4.3. Discharge Time
- 16.4.4. Capacity Range
- 16.4.5. Installation Type
- 16.4.6. Application
- 16.4.7. End-users
- 16.4.8. Integration Level
- 16.5. India Battery Energy Storage Market
- 16.5.1. Country Segmental Analysis
- 16.5.2. Battery Technology Type
- 16.5.3. Discharge Time
- 16.5.4. Capacity Range
- 16.5.5. Installation Type
- 16.5.6. Application
- 16.5.7. End-users
- 16.5.8. Integration Level
- 16.6. Japan Battery Energy Storage Market
- 16.6.1. Country Segmental Analysis
- 16.6.2. Battery Technology Type
- 16.6.3. Discharge Time
- 16.6.4. Capacity Range
- 16.6.5. Installation Type
- 16.6.6. Application
- 16.6.7. End-users
- 16.6.8. Integration Level
- 16.7. South Korea Battery Energy Storage Market
- 16.7.1. Country Segmental Analysis
- 16.7.2. Battery Technology Type
- 16.7.3. Discharge Time
- 16.7.4. Capacity Range
- 16.7.5. Installation Type
- 16.7.6. Application
- 16.7.7. End-users
- 16.7.8. Integration Level
- 16.8. Australia and New Zealand Battery Energy Storage Market
- 16.8.1. Country Segmental Analysis
- 16.8.2. Battery Technology Type
- 16.8.3. Discharge Time
- 16.8.4. Capacity Range
- 16.8.5. Installation Type
- 16.8.6. Application
- 16.8.7. End-users
- 16.8.8. Integration Level
- 16.9. Indonesia Battery Energy Storage Market
- 16.9.1. Country Segmental Analysis
- 16.9.2. Battery Technology Type
- 16.9.3. Discharge Time
- 16.9.4. Capacity Range
- 16.9.5. Installation Type
- 16.9.6. Application
- 16.9.7. End-users
- 16.9.8. Integration Level
- 16.10. Malaysia Battery Energy Storage Market
- 16.10.1. Country Segmental Analysis
- 16.10.2. Battery Technology Type
- 16.10.3. Discharge Time
- 16.10.4. Capacity Range
- 16.10.5. Installation Type
- 16.10.6. Application
- 16.10.7. End-users
- 16.10.8. Integration Level
- 16.11. Thailand Battery Energy Storage Market
- 16.11.1. Country Segmental Analysis
- 16.11.2. Battery Technology Type
- 16.11.3. Discharge Time
- 16.11.4. Capacity Range
- 16.11.5. Installation Type
- 16.11.6. Application
- 16.11.7. End-users
- 16.11.8. Integration Level
- 16.12. Vietnam Battery Energy Storage Market
- 16.12.1. Country Segmental Analysis
- 16.12.2. Battery Technology Type
- 16.12.3. Discharge Time
- 16.12.4. Capacity Range
- 16.12.5. Installation Type
- 16.12.6. Application
- 16.12.7. End-users
- 16.12.8. Integration Level
- 16.13. Rest of Asia Pacific Battery Energy Storage Market
- 16.13.1. Country Segmental Analysis
- 16.13.2. Battery Technology Type
- 16.13.3. Discharge Time
- 16.13.4. Capacity Range
- 16.13.5. Installation Type
- 16.13.6. Application
- 16.13.7. End-users
- 16.13.8. Integration Level
- 17. Middle East Battery Energy Storage Market Analysis
- 17.1. Key Segment Analysis
- 17.2. Regional Snapshot
- 17.3. Middle East Battery Energy Storage Market (Volume (Units) and Value (US$ Bn)), Analysis, and Forecasts, 2021-2035
- 17.3.1. Battery Technology Type
- 17.3.2. Discharge Time
- 17.3.3. Capacity Range
- 17.3.4. Installation Type
- 17.3.5. Application
- 17.3.6. End-users
- 17.3.7. Integration Level
- 17.3.8. Country
- 17.3.8.1. Turkey
- 17.3.8.2. UAE
- 17.3.8.3. Saudi Arabia
- 17.3.8.4. Israel
- 17.3.8.5. Rest of Middle East
- 17.4. Turkey Battery Energy Storage Market
- 17.4.1. Country Segmental Analysis
- 17.4.2. Battery Technology Type
- 17.4.3. Discharge Time
- 17.4.4. Capacity Range
- 17.4.5. Installation Type
- 17.4.6. Application
- 17.4.7. End-users
- 17.4.8. Integration Level
- 17.5. UAE Battery Energy Storage Market
- 17.5.1. Country Segmental Analysis
- 17.5.2. Battery Technology Type
- 17.5.3. Discharge Time
- 17.5.4. Capacity Range
- 17.5.5. Installation Type
- 17.5.6. Application
- 17.5.7. End-users
- 17.5.8. Integration Level
- 17.6. Saudi Arabia Battery Energy Storage Market
- 17.6.1. Country Segmental Analysis
- 17.6.2. Battery Technology Type
- 17.6.3. Discharge Time
- 17.6.4. Capacity Range
- 17.6.5. Installation Type
- 17.6.6. Application
- 17.6.7. End-users
- 17.6.8. Integration Level
- 17.7. Israel Battery Energy Storage Market
- 17.7.1. Country Segmental Analysis
- 17.7.2. Battery Technology Type
- 17.7.3. Discharge Time
- 17.7.4. Capacity Range
- 17.7.5. Installation Type
- 17.7.6. Application
- 17.7.7. End-users
- 17.7.8. Integration Level
- 17.8. Rest of Middle East Battery Energy Storage Market
- 17.8.1. Country Segmental Analysis
- 17.8.2. Battery Technology Type
- 17.8.3. Discharge Time
- 17.8.4. Capacity Range
- 17.8.5. Installation Type
- 17.8.6. Application
- 17.8.7. End-users
- 17.8.8. Integration Level
- 18. Africa Battery Energy Storage Market Analysis
- 18.1. Key Segment Analysis
- 18.2. Regional Snapshot
- 18.3. Africa Battery Energy Storage Market (Volume (Units) and Value (US$ Bn)), Analysis, and Forecasts, 2021-2035
- 18.3.1. Battery Technology Type
- 18.3.2. Discharge Time
- 18.3.3. Capacity Range
- 18.3.4. Installation Type
- 18.3.5. Application
- 18.3.6. End-users
- 18.3.7. Integration Level
- 18.3.8. Country
- 18.3.8.1. South Africa
- 18.3.8.2. Egypt
- 18.3.8.3. Nigeria
- 18.3.8.4. Algeria
- 18.3.8.5. Rest of Africa
- 18.4. South Africa Battery Energy Storage Market
- 18.4.1. Country Segmental Analysis
- 18.4.2. Battery Technology Type
- 18.4.3. Discharge Time
- 18.4.4. Capacity Range
- 18.4.5. Installation Type
- 18.4.6. Application
- 18.4.7. End-users
- 18.4.8. Integration Level
- 18.5. Egypt Battery Energy Storage Market
- 18.5.1. Country Segmental Analysis
- 18.5.2. Battery Technology Type
- 18.5.3. Discharge Time
- 18.5.4. Capacity Range
- 18.5.5. Installation Type
- 18.5.6. Application
- 18.5.7. End-users
- 18.5.8. Integration Level
- 18.6. Nigeria Battery Energy Storage Market
- 18.6.1. Country Segmental Analysis
- 18.6.2. Battery Technology Type
- 18.6.3. Discharge Time
- 18.6.4. Capacity Range
- 18.6.5. Installation Type
- 18.6.6. Application
- 18.6.7. End-users
- 18.6.8. Integration Level
- 18.7. Algeria Battery Energy Storage Market
- 18.7.1. Country Segmental Analysis
- 18.7.2. Battery Technology Type
- 18.7.3. Discharge Time
- 18.7.4. Capacity Range
- 18.7.5. Installation Type
- 18.7.6. Application
- 18.7.7. End-users
- 18.7.8. Integration Level
- 18.8. Rest of Africa Battery Energy Storage Market
- 18.8.1. Country Segmental Analysis
- 18.8.2. Battery Technology Type
- 18.8.3. Discharge Time
- 18.8.4. Capacity Range
- 18.8.5. Installation Type
- 18.8.6. Application
- 18.8.7. End-users
- 18.8.8. Integration Level
- 19. South America Battery Energy Storage Market Analysis
- 19.1. Key Segment Analysis
- 19.2. Regional Snapshot
- 19.3. South America Battery Energy Storage Market (Volume (Units) and Value (US$ Bn)), Analysis, and Forecasts, 2021-2035
- 19.3.1. Battery Technology Type
- 19.3.2. Discharge Time
- 19.3.3. Capacity Range
- 19.3.4. Installation Type
- 19.3.5. Application
- 19.3.6. End-users
- 19.3.7. Integration Level
- 19.3.8. Country
- 19.3.8.1. Brazil
- 19.3.8.2. Argentina
- 19.3.8.3. Rest of South America
- 19.4. Brazil Battery Energy Storage Market
- 19.4.1. Country Segmental Analysis
- 19.4.2. Battery Technology Type
- 19.4.3. Discharge Time
- 19.4.4. Capacity Range
- 19.4.5. Installation Type
- 19.4.6. Application
- 19.4.7. End-users
- 19.4.8. Integration Level
- 19.5. Argentina Battery Energy Storage Market
- 19.5.1. Country Segmental Analysis
- 19.5.2. Battery Technology Type
- 19.5.3. Discharge Time
- 19.5.4. Capacity Range
- 19.5.5. Installation Type
- 19.5.6. Application
- 19.5.7. End-users
- 19.5.8. Integration Level
- 19.6. Rest of South America Battery Energy Storage Market
- 19.6.1. Country Segmental Analysis
- 19.6.2. Battery Technology Type
- 19.6.3. Discharge Time
- 19.6.4. Capacity Range
- 19.6.5. Installation Type
- 19.6.6. Application
- 19.6.7. End-users
- 19.6.8. Integration Level
- 20. Key Players/ Company Profile
- 20.1. Aggreko
- 20.1.1. Company Details/ Overview
- 20.1.2. Company Financials
- 20.1.3. Key Customers and Competitors
- 20.1.4. Business/ Industry Portfolio
- 20.1.5. Product Portfolio/ Specification Details
- 20.1.6. Pricing Data
- 20.1.7. Strategic Overview
- 20.1.8. Recent Developments
- 20.2. Ambri Incorporated
- 20.3. Briggs & Stratton Corporation
- 20.4. BYD Company
- 20.5. CATL
- 20.6. Ener-Core, Inc.
- 20.7. Enphase Energy, Inc.
- 20.8. Eos Energy Enterprises
- 20.9. Fluence
- 20.10. Form Energy
- 20.11. Gravitricity Ltd.
- 20.12. Highview Power
- 20.13. LG Energy Solution
- 20.14. Northvolt
- 20.15. Panasonic
- 20.16. Primus Power
- 20.17. Redflow Limited
- 20.18. Saft Batteries
- 20.19. Samsung SDI
- 20.20. Sunrun Inc.
- 20.21. Tesla
- 20.22. Wärtsilä
- 20.23. Other Key Players
- 20.1. Aggreko
Note* - This is just tentative list of players. While providing the report, we will cover more number of players based on their revenue and share for each geography
Research Design
Our research design integrates both demand-side and supply-side analysis through a balanced combination of primary and secondary research methodologies. By utilizing both bottom-up and top-down approaches alongside rigorous data triangulation methods, we deliver robust market intelligence that supports strategic decision-making.
MarketGenics' comprehensive research design framework ensures the delivery of accurate, reliable, and actionable market intelligence. Through the integration of multiple research approaches, rigorous validation processes, and expert analysis, we provide our clients with the insights needed to make informed strategic decisions and capitalize on market opportunities.

MarketGenics leverages a dedicated industry panel of experts and a comprehensive suite of paid databases to effectively collect, consolidate, and analyze market intelligence.
Our approach has consistently proven to be reliable and effective in generating accurate market insights, identifying key industry trends, and uncovering emerging business opportunities.
Through both primary and secondary research, we capture and analyze critical company-level data such as manufacturing footprints, including technical centers, R&D facilities, sales offices, and headquarters.
Our expert panel further enhances our ability to estimate market size for specific brands based on validated field-level intelligence.
Our data mining techniques incorporate both parametric and non-parametric methods, allowing for structured data collection, sorting, processing, and cleaning.
Demand projections are derived from large-scale data sets analyzed through proprietary algorithms, culminating in robust and reliable market sizing.
Research Approach
The bottom-up approach builds market estimates by starting with the smallest addressable market units and systematically aggregating them to create comprehensive market size projections.
This method begins with specific, granular data points and builds upward to create the complete market landscape.
Customer Analysis → Segmental Analysis → Geographical Analysis
The top-down approach starts with the broadest possible market data and systematically narrows it down through a series of filters and assumptions to arrive at specific market segments or opportunities.
This method begins with the big picture and works downward to increasingly specific market slices.
TAM → SAM → SOM


Research Methods
Desk / Secondary Research
While analysing the market, we extensively study secondary sources, directories, and databases to identify and collect information useful for this technical, market-oriented, and commercial report. Secondary sources that we utilize are not only the public sources, but it is a combination of Open Source, Associations, Paid Databases, MG Repository & Knowledgebase, and others.
- Company websites, annual reports, financial reports, broker reports, and investor presentations
- National government documents, statistical databases and reports
- News articles, press releases and web-casts specific to the companies operating in the market, Magazines, reports, and others
- We gather information from commercial data sources for deriving company specific data such as segmental revenue, share for geography, product revenue, and others
- Internal and external proprietary databases (industry-specific), relevant patent, and regulatory databases
- Governing Bodies, Government Organizations
- Relevant Authorities, Country-specific Associations for Industries
We also employ the model mapping approach to estimate the product level market data through the players' product portfolio
Primary Research
Primary research/ interviews is vital in analyzing the market. Most of the cases involves paid primary interviews. Primary sources include primary interviews through e-mail interactions, telephonic interviews, surveys as well as face-to-face interviews with the different stakeholders across the value chain including several industry experts.
| Type of Respondents | Number of Primaries |
|---|---|
| Tier 2/3 Suppliers | ~20 |
| Tier 1 Suppliers | ~25 |
| End-users | ~25 |
| Industry Expert/ Panel/ Consultant | ~30 |
| Total | ~100 |
MG Knowledgebase
• Repository of industry blog, newsletter and case studies
• Online platform covering detailed market reports, and company profiles
Forecasting Factors and Models
Forecasting Factors
- Historical Trends – Past market patterns, cycles, and major events that shaped how markets behave over time. Understanding past trends helps predict future behavior.
- Industry Factors – Specific characteristics of the industry like structure, regulations, and innovation cycles that affect market dynamics.
- Macroeconomic Factors – Economic conditions like GDP growth, inflation, and employment rates that affect how much money people have to spend.
- Demographic Factors – Population characteristics like age, income, and location that determine who can buy your product.
- Technology Factors – How quickly people adopt new technology and how much technology infrastructure exists.
- Regulatory Factors – Government rules, laws, and policies that can help or restrict market growth.
- Competitive Factors – Analyzing competition structure such as degree of competition and bargaining power of buyers and suppliers.
Forecasting Models / Techniques
Multiple Regression Analysis
- Identify and quantify factors that drive market changes
- Statistical modeling to establish relationships between market drivers and outcomes
Time Series Analysis – Seasonal Patterns
- Understand regular cyclical patterns in market demand
- Advanced statistical techniques to separate trend, seasonal, and irregular components
Time Series Analysis – Trend Analysis
- Identify underlying market growth patterns and momentum
- Statistical analysis of historical data to project future trends
Expert Opinion – Expert Interviews
- Gather deep industry insights and contextual understanding
- In-depth interviews with key industry stakeholders
Multi-Scenario Development
- Prepare for uncertainty by modeling different possible futures
- Creating optimistic, pessimistic, and most likely scenarios
Time Series Analysis – Moving Averages
- Sophisticated forecasting for complex time series data
- Auto-regressive integrated moving average models with seasonal components
Econometric Models
- Apply economic theory to market forecasting
- Sophisticated economic models that account for market interactions
Expert Opinion – Delphi Method
- Harness collective wisdom of industry experts
- Structured, multi-round expert consultation process
Monte Carlo Simulation
- Quantify uncertainty and probability distributions
- Thousands of simulations with varying input parameters
Research Analysis
Our research framework is built upon the fundamental principle of validating market intelligence from both demand and supply perspectives. This dual-sided approach ensures comprehensive market understanding and reduces the risk of single-source bias.
Demand-Side Analysis: We understand end-user/application behavior, preferences, and market needs along with the penetration of the product for specific application.
Supply-Side Analysis: We estimate overall market revenue, analyze the segmental share along with industry capacity, competitive landscape, and market structure.
Validation & Evaluation
Data triangulation is a validation technique that uses multiple methods, sources, or perspectives to examine the same research question, thereby increasing the credibility and reliability of research findings. In market research, triangulation serves as a quality assurance mechanism that helps identify and minimize bias, validate assumptions, and ensure accuracy in market estimates.
- Data Source Triangulation – Using multiple data sources to examine the same phenomenon
- Methodological Triangulation – Using multiple research methods to study the same research question
- Investigator Triangulation – Using multiple researchers or analysts to examine the same data
- Theoretical Triangulation – Using multiple theoretical perspectives to interpret the same data

Custom Market Research Services
We will customise the research for you, in case the report listed above does not meet your requirements.
Get 10% Free Customisation