DC Microgrid Market Size, Share & Trends Analysis Report by Grid Type (Off-grid DC Microgrid, On-grid DC Microgrid, Hybrid DC Microgrid), Power Source, Voltage Level, Connectivity, Component, Ownership Model, Technology, Communication Technology, End-use Industry, and Geography (North America, Europe, Asia Pacific, Middle East, Africa, and South America) – Global Industry Data, Trends, and Forecasts, 2026–2035
|
|
|
Segmental Data Insights |
|
|
Demand Trends |
|
|
Competitive Landscape |
|
|
Strategic Development |
|
|
Future Outlook & Opportunities |
|
DC Microgrid Market Size, Share, and Growth
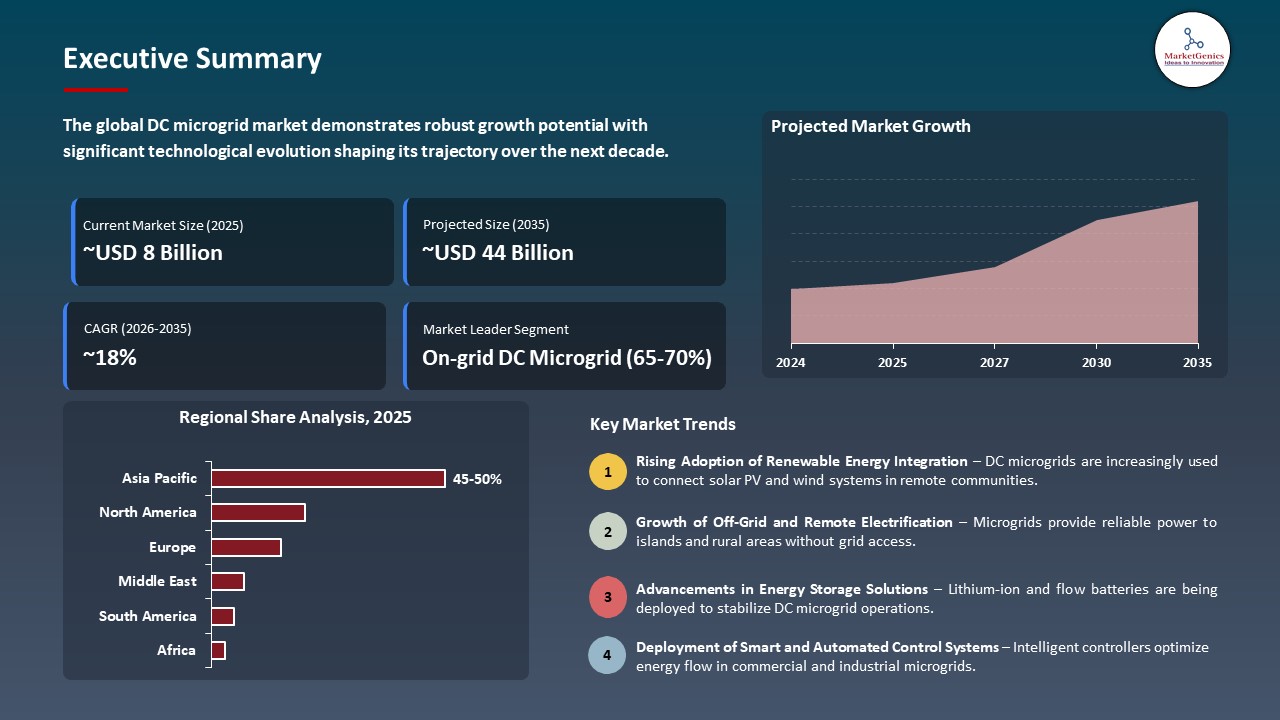
The global DC microgrid market is experiencing robust growth, with its estimated value of USD 8.3 billion in the year 2025 and USD 44.2 billion by the period 2035, registering a CAGR of 18.2%, during the forecast period. The global DC microgrid market, driven by rising renewable energy integration, rapid growth of data centers and EV infrastructure, higher efficiency of DC power for native loads, increasing need for reliable and resilient power systems, and government support for decarbonization, smart grids, and electrification across industrial, commercial, and remote applications.
Tomas Arhippainen, Head of Marine Service and Digital, ABB Marine & Ports said, “At ABB, we are fully committed to working with customers toward electrification. Modernization projects, in this case converting the complete power plant from AC to DC and integrating shore connection technology, play a significant part in those efforts, Amera is the first cruise ship to be retrofitted with Onboard DC Grid, making this a milestone project for us, Phoenix Reisen and indeed the cruise industry as a whole. This project proves that the benefits of increased efficiency and safety are available not only for newbuild, but also for existing vessels.”
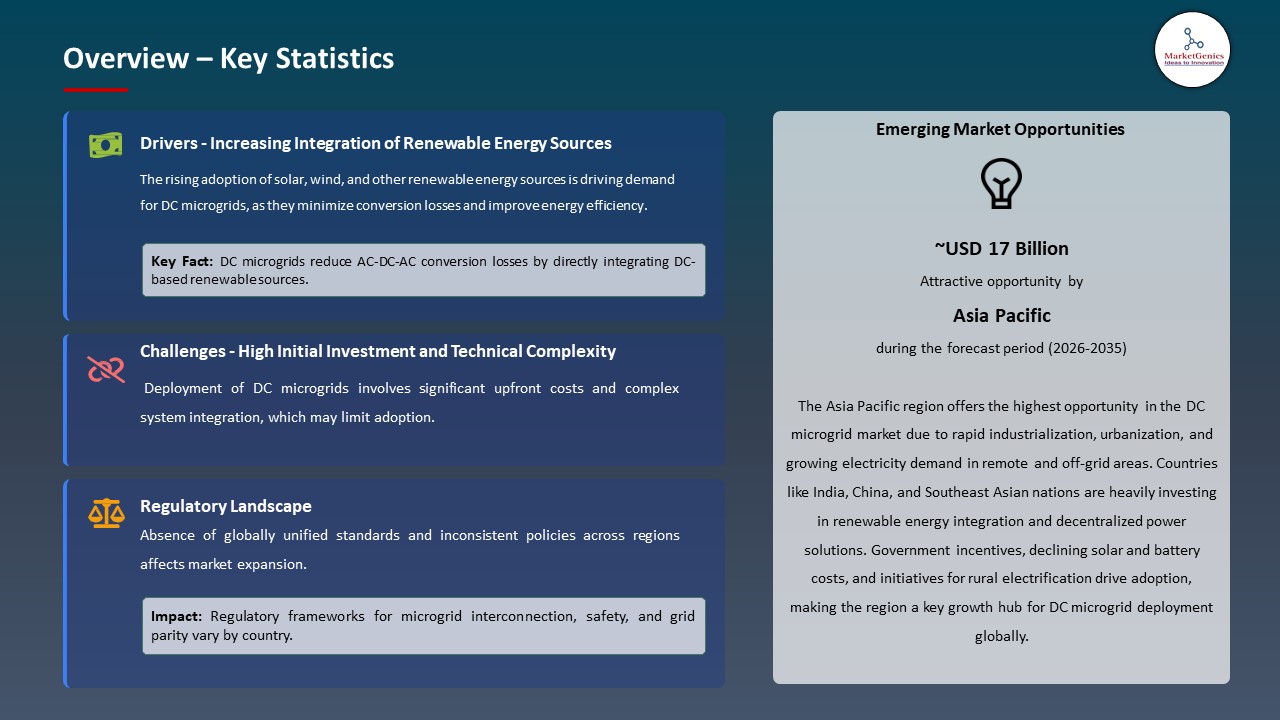
The DC microgrid market is majorly driven by the growing trends in integration of renewable energy and the growing need to have reliable and resilient energy. Implementation of solar PV, wind, and other renewable fuels DC microgrid implementation by making it possible to be able to completely integrate DC generation without extra conversion losses. For instance, in May 2024, Schneider Electric launched Villaya Flex microgrid, which incorporates off grid communities to provide them with clean, resilient power made of solar PV, battery storage, and smart controls with minimum conversion losses. This innovation is making resilient, high efficiency DC microgrids go global in a way that enhances the development of the decentralized renewable energy markets.
Additionally, the DC microgrid market is fueled by the increasing demand of energy resilience and reliability, as industries, remote communities, and critical infrastructure become more and more susceptible to demanding constant power. For instance, in 2024–2025, NTPC partnered with the Indian Army to deploy a 200-kW solar‑hydrogen microgrid in Chushul, Ladakh, providing stable, off‑grid power year-round and replacing diesel generators. This project demonstrates how resilient clean DC microgrids could be used in remote and extreme locations to provide reliable power, increasing the market adoption of this technology.
Adjacent opportunities in the global DC microgrid market include EV charging infrastructure, data centers and IT campuses, off-grid and rural electrification projects, industrial automation and smart factories, and military and disaster-resilient installations. DC microgrid efficiency and reliability can be used in these sectors. The move into these regions enhances the expansion and expedites market expansion.
DC Microgrid Market Dynamics and Trends
Driver: Increasing Government Mandates and Clean Energy Regulations
- DC microgrid solutions are growing faster due to government mandates and clean energy legislation, which are driving the decarbonization of the grid, grid resiliency, and energy security demanded by policymakers globally. These regulations have goals of integrating renewable energy, promoting energy efficiency, and developing incentives of modernizing infrastructure.
- In addition, these regulatory environments and incentive programs, major manufacturers are developing their solutions to conform to the requirements of compliance. As an example, in 2025, Schneider Electric launched a large project in the US to roll out resilient infrastructure solutions, such as DC microgrids, that are supported by federal and state-level incentives to modernize the energy system and enhance its reliability. The project enhances energy resilience of the U.S. and fastens the adoption of DC microgrids.
- Manufacturers will be able to increase the use of technology to better align solution applications with new compliance requirements, and address investment risks to facilitate the more widespread implementation of DC microgrid systems and sustainable, resilient, and cost-effective energy infrastructure solutions, thanks to this regulatory-based demand.
Restraint: High Initial Capital and Integration Complexity
-
The DC microgrid market faces significant challenges due to high initial capital requirements and integration complexity. Implementation of DC microgrid requires a significant initial cost investment in state-of-the-art equipment, such as high-efficiency converters, energy storage units, smart controllers, and special purpose wiring.
- These costs may be prohibitive especially to small and medium sized businesses or a community with minimal access to capital. Adoption is frequently hindered or postponed by the financial barrier even in situations where the benefits of the operations are obvious.
- In addition, the DC microgrid integration with an existing AC infrastructure or legacy energy system is highly engineering-intensive, carefully designed, and staffed, increasing the implementation time and the total cost of the project. For instance, Multiple European commercial microgrid initiatives suffered schedule slips and cost overruns because of intricate renewable integration.
- The presence of such technical and financial obstacles retards adoption despite benefits such as increased efficiency, reliability and sustainability.
- The challenges of high capital investment and complexity of integration are still limiting short-term expansion into the market, particularly in price-sensitive markets.
Opportunity: Expansion in Electric Vehicle (EV) Fast‑Charging Infrastructure
-
The global DC microgrid market is benefiting from expansion in electric vehicle (EV) fast‑charging infrastructure as a major adjacent opportunity. Direct powering of the fast chargers by DC microgrids can reduce conversion losses, enhance efficiencies, and incorporate on-site renewable generation and storage, which is best suited to expand the EV networks.
- For instance, in August 2024, Enteligent launched a DC‑powered EV charging solution that couples 25 kW DC fast chargers to a high-voltage DC bus connected to solar and energy storage. This setup enables more efficient, lower-loss fleet and commercial charging compared with traditional AC systems. This solution improves charging efficiency and reliability, accelerating the adoption of DC microgrids in expanding EV infrastructure.
- The use of DC microgrids in EV fast-charging system improves the efficiency of operations, minimizes energy waste, and ensures a sustainable rise of transportation, promoting the adoption of it on a larger market.
Key Trend: Hybrid Renewable and Storage Microgrid Deployments for Commercial Use
-
Hybrid renewable and storage microgrid solutions commercial deployments are becoming a major trend in the global DC microgrid market. These systems fulfill the increasing requirement of dependable, economical, and eco-friendly energy to the commercial and industrial complex energy-intensive plants, providing both operational sustainability and environmental gain.
- Hybrid microgrids combine multiple renewable generation sources, such as solar and wind, with battery energy storage systems (BESS) to balance supply, enhance resilience, and reduce dependency on the main grid. The method allows companies to attain sustainability goals without disrupting business operations in the high-demand settings.
- For instance, in November 2024, Tencent unveiled a hybrid microgrid (accessible on-site wind and solar PV) at its Huailai County data center in China with an on-site wind, solar PV, and BESS to supply about 10.99 MW of clean energy and 14 million kWh of energy each year. This implementation helped a great deal in both lowering carbon intensity and dependency on the main grid in sustaining key commercial processes.
- The embracing hybrid renewable and storage microgrids will improve the energy independence, promote business sustainability programs, and boost the development of DC microgrids in the market.
DC-Microgrid-Market Analysis and Segmental Data
On-grid DC Microgrid Dominate Global DC Microgrid Market
-
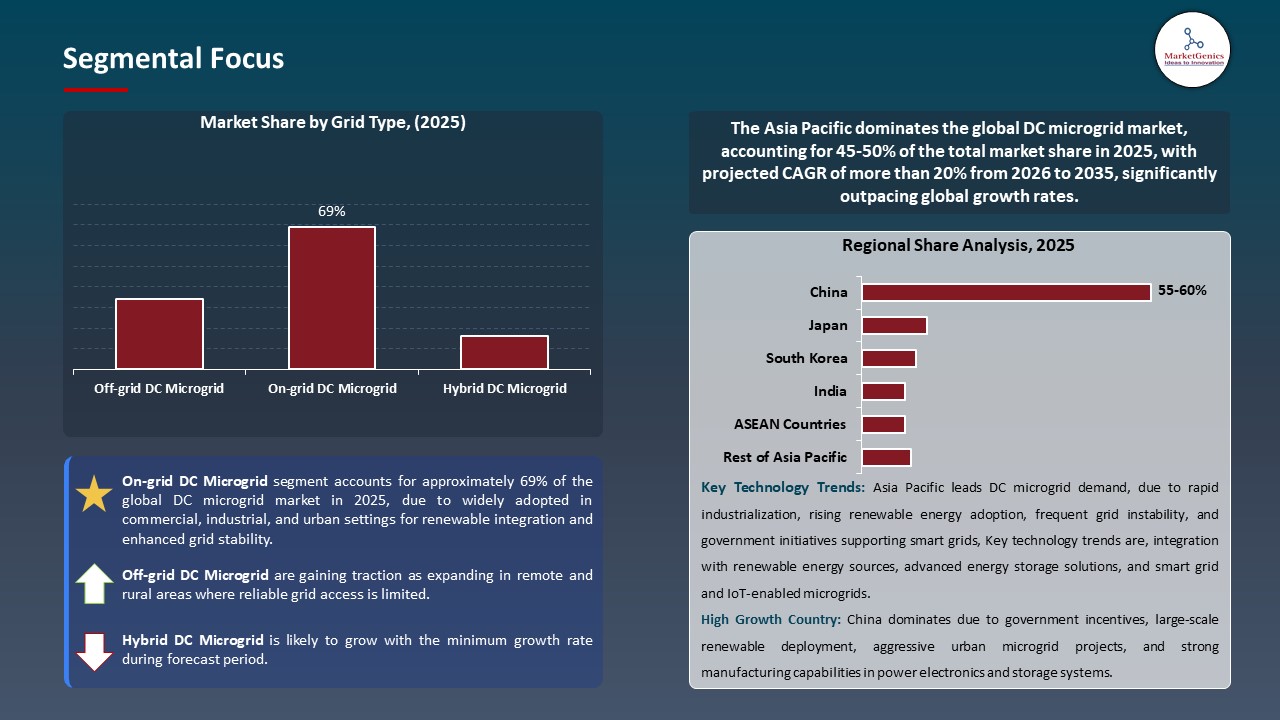
The on-grid DC microgrid segment dominates the global DC microgrid market, because of it can work together with the current utility grids and enhance the overall system efficiency and reliability. These systems enable them to have grid connectivity, and also enjoy decentralized power production, and enhanced energy control.
- On-grid DC microgrids support efficient integration of distributed energy resources, such as solar PV and battery storage, while minimizing power conversion losses. This makes them particularly attractive for commercial, industrial, and urban applications that require both operational flexibility and grid support.
- For instance, in 2024, SolarworX installed a DC microgrid in Mubanga, Zambia, with a DC microgrid based on solar and batteries which serves numerous consumer and prosumer connections with a connection to the local grid. The project illustrates a real-life application of on-grid DC microgrid structure that is scalable.
- On-grid DC microgrids offer a competitive advantage to the market through integrating renewable energy with efficiency and scalability, and grid reliability.
Asia Pacific Leads Global DC Microgrid Market Demand
-
Asia Pacific leads the DC Microgrid market, due to the accelerated industrialization and urban development of the Asian Pacific are creating high demand to have efficient and scalable power systems with DC micro grids sustaining energy intensive manufacturing, smart cities, and data centers and reducing conversion losses and enhancing reliability.
- For instance, in 2024, State Grid Qihe Power Supply Company introduced the first village-level digital DC microgrid in Shandong which combines solar PV, energy-storage, EV chargers, and DC loads into a 750 V DC network. This project intensifies the integration of energy efficiency and renewability, which makes Asia Pacific the pioneer in the global DC microgrid.
- Additionally, extensive government policies in favor of renewable energy, grid modernization especially in China, India, and Southeast Asia, has further catalyzed the application of DC microgrids to increase energy access, resilience and integration of distributed renewable resources.
- For instance, in 2024, NTPC, under India’s government-backed clean energy initiatives, deployed a solar-hydrogen microgrid in Ladakh to support rural and strategic electrification, demonstrating strong public-sector support for resilient, renewable-powered DC microgrid deployment in Asia Pacific.
- The high rate of industrialization and robust government support is making the Asia Pacific the center of DC microgrid deployment and development.
DC-Microgrid-Market Ecosystem
The global DC microgrid market is slightly consolidated, with high concentration among key players such as ABB Ltd., Schneider Electric SE, Siemens AG, Eaton Corporation, and Hitachi Energy Ltd., who dominate through strong technology portfolio, integrated energy management solutions, ability to execute international projects and continuous investment in innovation and strategic alliances. The concentration in the market makes it possible to quickly develop technology and implement it at large levels and increase competition on a new player.

Recent Development and Strategic Overview:
-
In November 2024, Eaton launched the xStorage battery energy storage system featuring built-in microgrid islanding, 250–1000 kWh modular capacity and Brightlayer digital monitoring targeted at rapid deployment of grid-interactive microgrids and commercial/residential DC/AC integration.
- In July 2024, ABB retrofitted cruise ship MS Amera with its Onboard DC Grid power distribution and shore-connection system, demonstrating retrofitability of DC microgrids for improved safety, efficiency and battery/fuel-cell integration on vessels. This shows DC microgrid tech moving from newbuilds to ship modernizations.
Report Scope
|
Detail |
|
|
Market Size in 2025 |
USD 8.3 Bn |
|
Market Forecast Value in 2035 |
USD 44.2 Bn |
|
Growth Rate (CAGR) |
18.2% |
|
Forecast Period |
2026 – 2035 |
|
Historical Data Available for |
2021 – 2024 |
|
Market Size Units |
US$ Billion for Value Thousand Units for Volume |
|
Report Format |
Electronic (PDF) + Excel |
|
North America |
Europe |
Asia Pacific |
Middle East |
Africa |
South America |
|
|
|
|
|
|
|
Companies Covered |
|||||
|
|
|
|
|
|
DC-Microgrid-Market Segmentation and Highlights
|
Segment |
Sub-segment |
|
DC Microgrid Market, By Grid Type |
|
|
DC Microgrid Market, By Power Source |
|
|
DC Microgrid Market, By Voltage Level |
|
|
DC Microgrid Market, By Connectivity |
|
|
DC Microgrid Market, By Component
|
|
|
DC Microgrid Market, By Capacity
|
|
|
DC Microgrid Market, By Ownership Model |
|
|
DC Microgrid Market, By Technology |
|
|
DC Microgrid Market, By Communication Technology |
|
|
DC Microgrid Market, By End-use Industry |
|
Frequently Asked Questions
Table of Contents
- 1. Research Methodology and Assumptions
- 1.1. Definitions
- 1.2. Research Design and Approach
- 1.3. Data Collection Methods
- 1.4. Base Estimates and Calculations
- 1.5. Forecasting Models
- 1.5.1. Key Forecast Factors & Impact Analysis
- 1.6. Secondary Research
- 1.6.1. Open Sources
- 1.6.2. Paid Databases
- 1.6.3. Associations
- 1.7. Primary Research
- 1.7.1. Primary Sources
- 1.7.2. Primary Interviews with Stakeholders across Ecosystem
- 2. Executive Summary
- 2.1. Global DC Microgrid Market Outlook
- 2.1.1. DC Microgrid Market Size (Volume – Thousand Units and Value – US$ Bn), and Forecasts, 2021-2035
- 2.1.2. Compounded Annual Growth Rate Analysis
- 2.1.3. Growth Opportunity Analysis
- 2.1.4. Segmental Share Analysis
- 2.1.5. Geographical Share Analysis
- 2.2. Market Analysis and Facts
- 2.3. Supply-Demand Analysis
- 2.4. Competitive Benchmarking
- 2.5. Go-to- Market Strategy
- 2.5.1. Customer/ End-use Industry Assessment
- 2.5.2. Growth Opportunity Data, 2026-2035
- 2.5.2.1. Regional Data
- 2.5.2.2. Country Data
- 2.5.2.3. Segmental Data
- 2.5.3. Identification of Potential Market Spaces
- 2.5.4. GAP Analysis
- 2.5.5. Potential Attractive Price Points
- 2.5.6. Prevailing Market Risks & Challenges
- 2.5.7. Preferred Sales & Marketing Strategies
- 2.5.8. Key Recommendations and Analysis
- 2.5.9. A Way Forward
- 2.1. Global DC Microgrid Market Outlook
- 3. Industry Data and Premium Insights
- 3.1. Global Energy & Power Industry Overview, 2025
- 3.1.1. Energy & Power Industry Ecosystem Analysis
- 3.1.2. Key Trends for Energy & Power Industry
- 3.1.3. Regional Distribution for Energy & Power Industry
- 3.2. Supplier Customer Data
- 3.3. Technology Roadmap and Developments
- 3.4. Trade Analysis
- 3.4.1. Import & Export Analysis, 2025
- 3.4.2. Top Importing Countries
- 3.4.3. Top Exporting Countries
- 3.5. Trump Tariff Impact Analysis
- 3.5.1. Manufacturer
- 3.5.1.1. Based on the component & Raw material
- 3.5.2. Supply Chain
- 3.5.3. End Consumer
- 3.5.1. Manufacturer
- 3.6. Raw Material Analysis
- 3.1. Global Energy & Power Industry Overview, 2025
- 4. Market Overview
- 4.1. Market Dynamics
- 4.1.1. Drivers
- 4.1.1.1. Increasing integration of renewable energy sources (solar, wind) to enhance efficiency and reduce conversion losses
- 4.1.1.2. Growing demand for energy resilience, reliability, and decentralized power in remote/off-grid and critical infrastructure applications
- 4.1.1.3. Advancements in power electronics, energy storage, and intelligent control systems
- 4.1.2. Restraints
- 4.1.2.1. High initial installation, integration, and maintenance costs
- 4.1.2.2. Lack of standardized regulatory frameworks and technical interoperability across regions
- 4.1.1. Drivers
- 4.2. Key Trend Analysis
- 4.3. Regulatory Framework
- 4.3.1. Key Regulations, Norms, and Subsidies, by Key Countries
- 4.3.2. Tariffs and Standards
- 4.3.3. Impact Analysis of Regulations on the Market
- 4.4. Value Chain Analysis
- 4.4.1. Components Suppliers
- 4.4.2. DC Microgrid Manufacturers
- 4.4.3. Technology Integrators
- 4.4.4. Distribution & Sales Channels
- 4.4.5. End-Users / Consumers
- 4.5. Cost Structure Analysis
- 4.5.1. Parameter’s Share for Cost Associated
- 4.5.2. COGP vs COGS
- 4.5.3. Profit Margin Analysis
- 4.6. Pricing Analysis
- 4.6.1. Regional Pricing Analysis
- 4.6.2. Segmental Pricing Trends
- 4.6.3. Factors Influencing Pricing
- 4.7. Porter’s Five Forces Analysis
- 4.8. PESTEL Analysis
- 4.9. Global DC Microgrid Market Demand
- 4.9.1. Historical Market Size – Volume (Thousand Units) and Value (US$ Bn), 2020-2024
- 4.9.2. Current and Future Market Size – Volume (Thousand Units) and Value (US$ Bn), 2026–2035
- 4.9.2.1. Y-o-Y Growth Trends
- 4.9.2.2. Absolute $ Opportunity Assessment
- 4.1. Market Dynamics
- 5. Competition Landscape
- 5.1. Competition structure
- 5.1.1. Fragmented v/s consolidated
- 5.2. Company Share Analysis, 2025
- 5.2.1. Global Company Market Share
- 5.2.2. By Region
- 5.2.2.1. North America
- 5.2.2.2. Europe
- 5.2.2.3. Asia Pacific
- 5.2.2.4. Middle East
- 5.2.2.5. Africa
- 5.2.2.6. South America
- 5.3. Product Comparison Matrix
- 5.3.1. Specifications
- 5.3.2. Market Positioning
- 5.3.3. Pricing
- 5.1. Competition structure
- 6. Global DC Microgrid Market Analysis, by Grid Type
- 6.1. Key Segment Analysis
- 6.2. DC Microgrid Market Size (Volume – Thousand Units and Value – US$ Bn), Analysis, and Forecasts, by Grid Type, 2021-2035
- 6.2.1. Off-grid DC Microgrid
- 6.2.2. On-grid DC Microgrid
- 6.2.3. Hybrid DC Microgrid
- 7. Global DC Microgrid Market Analysis, by Power Source
- 7.1. Key Segment Analysis
- 7.2. DC Microgrid Market Size (Volume – Thousand Units and Value – US$ Bn), Analysis, and Forecasts, by Power Source, 2021-2035
- 7.2.1. Solar Photovoltaic (PV)
- 7.2.2. Wind Energy
- 7.2.3. Diesel Generators
- 7.2.4. Natural Gas Generators
- 7.2.5. Fuel Cells
- 7.2.6. Battery Energy Storage Systems (BESS)
- 7.2.7. Hybrid Power Sources
- 8. Global DC Microgrid Market Analysis, by Voltage Level
- 8.1. Key Segment Analysis
- 8.2. DC Microgrid Market Size (Volume – Thousand Units and Value – US$ Bn), Analysis, and Forecasts, by Voltage Level, 2021-2035
- 8.2.1. Below 400V
- 8.2.2. 400V - 1000V
- 8.2.3. Above 1000V
- 9. Global DC Microgrid Market Analysis, by Connectivity
- 9.1. Key Segment Analysis
- 9.2. DC Microgrid Market Size (Volume – Thousand Units and Value – US$ Bn), Analysis, and Forecasts, by Connectivity, 2021-2035
- 9.2.1. Grid-connected Systems
- 9.2.2. Remote/Islanded Systems
- 9.2.3. Grid-interactive Systems
- 10. Global DC Microgrid Market Analysis, by Component
- 10.1. Key Segment Analysis
- 10.2. DC Microgrid Market Size (Volume – Thousand Units and Value – US$ Bn), Analysis, and Forecasts, by Component, 2021-2035
- 10.2.1. Power Generation Systems
- 10.2.1.1. Solar panels
- 10.2.1.2. Wind turbines
- 10.2.1.3. Diesel generators
- 10.2.1.4. Fuel cells
- 10.2.1.5. Others
- 10.2.2. Energy Storage Systems
- 10.2.2.1. Lithium-ion batteries
- 10.2.2.2. Lead-acid batteries
- 10.2.2.3. Flow batteries
- 10.2.2.4. Supercapacitors
- 10.2.2.5. Others
- 10.2.3. Power Conversion Systems
- 10.2.3.1. DC-DC converters
- 10.2.3.2. DC-AC inverters
- 10.2.3.3. Charge controllers
- 10.2.3.4. Others
- 10.2.4. Control & Monitoring Systems
- 10.2.4.1. SCADA systems
- 10.2.4.2. Energy management systems
- 10.2.4.3. Protection systems
- 10.2.4.4. Communication systems
- 10.2.4.5. Others
- 10.2.5. Distribution Systems
- 10.2.5.1. Switchgear
- 10.2.5.2. Cables and connectors
- 10.2.5.3. Protection devices
- 10.2.5.4. Others
- 10.2.1. Power Generation Systems
- 11. Global DC Microgrid Market Analysis, by Capacity
- 11.1. Key Segment Analysis
- 11.2. DC Microgrid Market Size (Volume – Thousand Units and Value – US$ Bn), Analysis, and Forecasts, by Capacity, 2021-2035
- 11.2.1. Below 5 kW
- 11.2.2. 5 kW - 50 kW
- 11.2.3. 50 kW - 500 kW
- 11.2.4. 500 kW - 5 MW
- 11.2.5. Above 5 MW
- 12. Global DC Microgrid Market Analysis, by Ownership Model
- 12.1. Key Segment Analysis
- 12.2. DC Microgrid Market Size (Volume – Thousand Units and Value – US$ Bn), Analysis, and Forecasts, by Ownership Model, 2021-2035
- 12.2.1. Utility-owned
- 12.2.2. Customer-owned
- 12.2.3. Third-party owned
- 12.2.4. Community-owned
- 12.2.5. Cooperative Models
- 13. Global DC Microgrid Market Analysis, by Technology
- 13.1. Key Segment Analysis
- 13.2. DC Microgrid Market Size (Volume – Thousand Units and Value – US$ Bn), Analysis, and Forecasts, by Technology, 2021-2035
- 13.2.1. AC-DC Hybrid Systems
- 13.2.2. Pure DC Distribution Systems
- 13.2.3. DC Bus Architecture
- 13.2.4. Distributed Energy Resource (DER) Integration
- 13.2.5. Smart Grid Enabled DC Microgrids
- 13.2.6. Blockchain-enabled DC Microgrids
- 14. Global DC Microgrid Market Analysis, by Communication Technology
- 14.1. Key Segment Analysis
- 14.2. DC Microgrid Market Size (Volume – Thousand Units and Value – US$ Bn), Analysis, and Forecasts, by Communication Technology, 2021-2035
- 14.2.1. Wired Communication
- 14.2.1.1. Ethernet
- 14.2.1.2. Power Line Communication (PLC)
- 14.2.1.3. Others
- 14.2.2. Wireless Communication
- 14.2.2.1. Wi-Fi
- 14.2.2.2. Zigbee
- 14.2.2.3. LoRa
- 14.2.2.4. Cellular (4G/5G)
- 14.2.2.5. Others
- 14.2.3. IoT-enabled Systems
- 14.2.1. Wired Communication
- 15. Global DC Microgrid Market Analysis, by End-use Industry
- 15.1. Key Segment Analysis
- 15.2. DC Microgrid Market Size (Volume – Thousand Units and Value – US$ Bn), Analysis, and Forecasts, by End-use Industry, 2021-2035
- 15.2.1. Commercial
- 15.2.1.1. Office Buildings
- 15.2.1.2. Shopping Malls & Retail Centers
- 15.2.1.3. Hospitals & Healthcare Facilities
- 15.2.1.4. Educational Institutions
- 15.2.1.5. Hotels & Hospitality
- 15.2.1.6. Data Centers
- 15.2.1.7. Others
- 15.2.2. Industrial
- 15.2.2.1. Manufacturing Plants
- 15.2.2.2. Oil & Gas Facilities
- 15.2.2.3. Mining Operations
- 15.2.2.4. Chemical Processing Plants
- 15.2.2.5. Pharmaceutical Manufacturing
- 15.2.2.6. Food & Beverage Processing
- 15.2.2.7. Others
- 15.2.3. Residential
- 15.2.3.1. Single-family Homes
- 15.2.3.2. Multi-family Apartments
- 15.2.3.3. Residential Complexes
- 15.2.3.4. Gated Communities
- 15.2.3.5. Remote Housing
- 15.2.3.6. Others
- 15.2.4. Military & Defense
- 15.2.4.1. Military Bases
- 15.2.4.2. Remote Defense Installations
- 15.2.4.3. Command Centers
- 15.2.4.4. Border Security Posts
- 15.2.4.5. Others
- 15.2.5. Telecommunications
- 15.2.5.1. Telecom Towers
- 15.2.5.2. 5G Infrastructure
- 15.2.5.3. Network Operation Centers
- 15.2.5.4. Remote Communication Sites
- 15.2.5.5. Others
- 15.2.6. Transportation
- 15.2.6.1. Electric Vehicle Charging Stations
- 15.2.6.2. Railway Systems
- 15.2.6.3. Ports & Harbors
- 15.2.6.4. Airports
- 15.2.6.5. Others
- 15.2.7. Institutional
- 15.2.7.1. Government Buildings
- 15.2.7.2. Research Laboratories
- 15.2.7.3. Emergency Services
- 15.2.7.4. Public Infrastructure
- 15.2.7.5. Others
- 15.2.8. Remote & Off-grid
- 15.2.8.1. Rural Electrification
- 15.2.8.2. Island Communities
- 15.2.8.3. Remote Villages
- 15.2.8.4. Mining Camps
- 15.2.8.5. Disaster Relief Camps
- 15.2.8.6. Others
- 15.2.9. Agriculture
- 15.2.9.1. Smart Farms
- 15.2.9.2. Irrigation Systems
- 15.2.9.3. Cold Storage Facilities
- 15.2.9.4. Agro-processing Units
- 15.2.9.5. Others
- 15.2.1. Commercial
- 16. Global DC Microgrid Market Analysis and Forecasts, by Region
- 16.1. Key Findings
- 16.2. DC Microgrid Market Size (Volume – Thousand Units and Value – US$ Bn), Analysis, and Forecasts, by Region, 2021-2035
- 16.2.1. North America
- 16.2.2. Europe
- 16.2.3. Asia Pacific
- 16.2.4. Middle East
- 16.2.5. Africa
- 16.2.6. South America
- 17. North America DC Microgrid Market Analysis
- 17.1. Key Segment Analysis
- 17.2. Regional Snapshot
- 17.3. North America DC Microgrid Market Size (Volume – Thousand Units and Value – US$ Bn), Analysis, and Forecasts, 2021-2035
- 17.3.1. Grid Type
- 17.3.2. Power Source
- 17.3.3. Voltage Level
- 17.3.4. Connectivity
- 17.3.5. Component
- 17.3.6. Capacity
- 17.3.7. Ownership Model
- 17.3.8. Technology
- 17.3.9. Communication Technology
- 17.3.10. End-use Industry
- 17.3.11. Country
- 17.3.11.1. USA
- 17.3.11.2. Canada
- 17.3.11.3. Mexico
- 17.4. USA DC Microgrid Market
- 17.4.1. Country Segmental Analysis
- 17.4.2. Grid Type
- 17.4.3. Power Source
- 17.4.4. Voltage Level
- 17.4.5. Connectivity
- 17.4.6. Component
- 17.4.7. Capacity
- 17.4.8. Ownership Model
- 17.4.9. Technology
- 17.4.10. Communication Technology
- 17.4.11. End-use Industry
- 17.5. Canada DC Microgrid Market
- 17.5.1. Country Segmental Analysis
- 17.5.2. Grid Type
- 17.5.3. Power Source
- 17.5.4. Voltage Level
- 17.5.5. Connectivity
- 17.5.6. Component
- 17.5.7. Capacity
- 17.5.8. Ownership Model
- 17.5.9. Technology
- 17.5.10. Communication Technology
- 17.5.11. End-use Industry
- 17.6. Mexico DC Microgrid Market
- 17.6.1. Country Segmental Analysis
- 17.6.2. Grid Type
- 17.6.3. Power Source
- 17.6.4. Voltage Level
- 17.6.5. Connectivity
- 17.6.6. Component
- 17.6.7. Capacity
- 17.6.8. Ownership Model
- 17.6.9. Technology
- 17.6.10. Communication Technology
- 17.6.11. End-use Industry
- 18. Europe DC Microgrid Market Analysis
- 18.1. Key Segment Analysis
- 18.2. Regional Snapshot
- 18.3. Europe DC Microgrid Market Size (Volume – Thousand Units and Value – US$ Bn), Analysis, and Forecasts, 2021-2035
- 18.3.1. Grid Type
- 18.3.2. Power Source
- 18.3.3. Voltage Level
- 18.3.4. Connectivity
- 18.3.5. Component
- 18.3.6. Capacity
- 18.3.7. Ownership Model
- 18.3.8. Technology
- 18.3.9. Communication Technology
- 18.3.10. End-use Industry
- 18.3.11. Country
- 18.3.11.1. Germany
- 18.3.11.2. United Kingdom
- 18.3.11.3. France
- 18.3.11.4. Italy
- 18.3.11.5. Spain
- 18.3.11.6. Netherlands
- 18.3.11.7. Nordic Countries
- 18.3.11.8. Poland
- 18.3.11.9. Russia & CIS
- 18.3.11.10. Rest of Europe
- 18.4. Germany DC Microgrid Market
- 18.4.1. Country Segmental Analysis
- 18.4.2. Grid Type
- 18.4.3. Power Source
- 18.4.4. Voltage Level
- 18.4.5. Connectivity
- 18.4.6. Component
- 18.4.7. Capacity
- 18.4.8. Ownership Model
- 18.4.9. Technology
- 18.4.10. Communication Technology
- 18.4.11. End-use Industry
- 18.5. United Kingdom DC Microgrid Market
- 18.5.1. Country Segmental Analysis
- 18.5.2. Grid Type
- 18.5.3. Power Source
- 18.5.4. Voltage Level
- 18.5.5. Connectivity
- 18.5.6. Component
- 18.5.7. Capacity
- 18.5.8. Ownership Model
- 18.5.9. Technology
- 18.5.10. Communication Technology
- 18.5.11. End-use Industry
- 18.6. France DC Microgrid Market
- 18.6.1. Country Segmental Analysis
- 18.6.2. Grid Type
- 18.6.3. Power Source
- 18.6.4. Voltage Level
- 18.6.5. Connectivity
- 18.6.6. Component
- 18.6.7. Capacity
- 18.6.8. Ownership Model
- 18.6.9. Technology
- 18.6.10. Communication Technology
- 18.6.11. End-use Industry
- 18.7. Italy DC Microgrid Market
- 18.7.1. Country Segmental Analysis
- 18.7.2. Grid Type
- 18.7.3. Power Source
- 18.7.4. Voltage Level
- 18.7.5. Connectivity
- 18.7.6. Component
- 18.7.7. Capacity
- 18.7.8. Ownership Model
- 18.7.9. Technology
- 18.7.10. Communication Technology
- 18.7.11. End-use Industry
- 18.8. Spain DC Microgrid Market
- 18.8.1. Country Segmental Analysis
- 18.8.2. Grid Type
- 18.8.3. Power Source
- 18.8.4. Voltage Level
- 18.8.5. Connectivity
- 18.8.6. Component
- 18.8.7. Capacity
- 18.8.8. Ownership Model
- 18.8.9. Technology
- 18.8.10. Communication Technology
- 18.8.11. End-use Industry
- 18.9. Netherlands DC Microgrid Market
- 18.9.1. Country Segmental Analysis
- 18.9.2. Grid Type
- 18.9.3. Power Source
- 18.9.4. Voltage Level
- 18.9.5. Connectivity
- 18.9.6. Component
- 18.9.7. Capacity
- 18.9.8. Ownership Model
- 18.9.9. Technology
- 18.9.10. Communication Technology
- 18.9.11. End-use Industry
- 18.10. Nordic Countries DC Microgrid Market
- 18.10.1. Country Segmental Analysis
- 18.10.2. Grid Type
- 18.10.3. Power Source
- 18.10.4. Voltage Level
- 18.10.5. Connectivity
- 18.10.6. Component
- 18.10.7. Capacity
- 18.10.8. Ownership Model
- 18.10.9. Technology
- 18.10.10. Communication Technology
- 18.10.11. End-use Industry
- 18.11. Poland DC Microgrid Market
- 18.11.1. Country Segmental Analysis
- 18.11.2. Grid Type
- 18.11.3. Power Source
- 18.11.4. Voltage Level
- 18.11.5. Connectivity
- 18.11.6. Component
- 18.11.7. Capacity
- 18.11.8. Ownership Model
- 18.11.9. Technology
- 18.11.10. Communication Technology
- 18.11.11. End-use Industry
- 18.12. Russia & CIS DC Microgrid Market
- 18.12.1. Country Segmental Analysis
- 18.12.2. Grid Type
- 18.12.3. Power Source
- 18.12.4. Voltage Level
- 18.12.5. Connectivity
- 18.12.6. Component
- 18.12.7. Capacity
- 18.12.8. Ownership Model
- 18.12.9. Technology
- 18.12.10. Communication Technology
- 18.12.11. End-use Industry
- 18.13. Rest of Europe DC Microgrid Market
- 18.13.1. Country Segmental Analysis
- 18.13.2. Grid Type
- 18.13.3. Power Source
- 18.13.4. Voltage Level
- 18.13.5. Connectivity
- 18.13.6. Component
- 18.13.7. Capacity
- 18.13.8. Ownership Model
- 18.13.9. Technology
- 18.13.10. Communication Technology
- 18.13.11. End-use Industry
- 19. Asia Pacific DC Microgrid Market Analysis
- 19.1. Key Segment Analysis
- 19.2. Regional Snapshot
- 19.3. Asia Pacific DC Microgrid Market Size (Volume – Thousand Units and Value – US$ Bn), Analysis, and Forecasts, 2021-2035
- 19.3.1. Grid Type
- 19.3.2. Power Source
- 19.3.3. Voltage Level
- 19.3.4. Connectivity
- 19.3.5. Component
- 19.3.6. Capacity
- 19.3.7. Ownership Model
- 19.3.8. Technology
- 19.3.9. Communication Technology
- 19.3.10. End-use Industry
- 19.3.11. Country
- 19.3.11.1. China
- 19.3.11.2. India
- 19.3.11.3. Japan
- 19.3.11.4. South Korea
- 19.3.11.5. Australia and New Zealand
- 19.3.11.6. Indonesia
- 19.3.11.7. Malaysia
- 19.3.11.8. Thailand
- 19.3.11.9. Vietnam
- 19.3.11.10. Rest of Asia Pacific
- 19.4. China DC Microgrid Market
- 19.4.1. Country Segmental Analysis
- 19.4.2. Grid Type
- 19.4.3. Power Source
- 19.4.4. Voltage Level
- 19.4.5. Connectivity
- 19.4.6. Component
- 19.4.7. Capacity
- 19.4.8. Ownership Model
- 19.4.9. Technology
- 19.4.10. Communication Technology
- 19.4.11. End-use Industry
- 19.5. India DC Microgrid Market
- 19.5.1. Country Segmental Analysis
- 19.5.2. Grid Type
- 19.5.3. Power Source
- 19.5.4. Voltage Level
- 19.5.5. Connectivity
- 19.5.6. Component
- 19.5.7. Capacity
- 19.5.8. Ownership Model
- 19.5.9. Technology
- 19.5.10. Communication Technology
- 19.5.11. End-use Industry
- 19.6. Japan DC Microgrid Market
- 19.6.1. Country Segmental Analysis
- 19.6.2. Grid Type
- 19.6.3. Power Source
- 19.6.4. Voltage Level
- 19.6.5. Connectivity
- 19.6.6. Component
- 19.6.7. Capacity
- 19.6.8. Ownership Model
- 19.6.9. Technology
- 19.6.10. Communication Technology
- 19.6.11. End-use Industry
- 19.7. South Korea DC Microgrid Market
- 19.7.1. Country Segmental Analysis
- 19.7.2. Grid Type
- 19.7.3. Power Source
- 19.7.4. Voltage Level
- 19.7.5. Connectivity
- 19.7.6. Component
- 19.7.7. Capacity
- 19.7.8. Ownership Model
- 19.7.9. Technology
- 19.7.10. Communication Technology
- 19.7.11. End-use Industry
- 19.8. Australia and New Zealand DC Microgrid Market
- 19.8.1. Country Segmental Analysis
- 19.8.2. Grid Type
- 19.8.3. Power Source
- 19.8.4. Voltage Level
- 19.8.5. Connectivity
- 19.8.6. Component
- 19.8.7. Capacity
- 19.8.8. Ownership Model
- 19.8.9. Technology
- 19.8.10. Communication Technology
- 19.8.11. End-use Industry
- 19.9. Indonesia DC Microgrid Market
- 19.9.1. Country Segmental Analysis
- 19.9.2. Grid Type
- 19.9.3. Power Source
- 19.9.4. Voltage Level
- 19.9.5. Connectivity
- 19.9.6. Component
- 19.9.7. Capacity
- 19.9.8. Ownership Model
- 19.9.9. Technology
- 19.9.10. Communication Technology
- 19.9.11. End-use Industry
- 19.10. Malaysia DC Microgrid Market
- 19.10.1. Country Segmental Analysis
- 19.10.2. Grid Type
- 19.10.3. Power Source
- 19.10.4. Voltage Level
- 19.10.5. Connectivity
- 19.10.6. Component
- 19.10.7. Capacity
- 19.10.8. Ownership Model
- 19.10.9. Technology
- 19.10.10. Communication Technology
- 19.10.11. End-use Industry
- 19.11. Thailand DC Microgrid Market
- 19.11.1. Country Segmental Analysis
- 19.11.2. Grid Type
- 19.11.3. Power Source
- 19.11.4. Voltage Level
- 19.11.5. Connectivity
- 19.11.6. Component
- 19.11.7. Capacity
- 19.11.8. Ownership Model
- 19.11.9. Technology
- 19.11.10. Communication Technology
- 19.11.11. End-use Industry
- 19.12. Vietnam DC Microgrid Market
- 19.12.1. Country Segmental Analysis
- 19.12.2. Grid Type
- 19.12.3. Power Source
- 19.12.4. Voltage Level
- 19.12.5. Connectivity
- 19.12.6. Component
- 19.12.7. Capacity
- 19.12.8. Ownership Model
- 19.12.9. Technology
- 19.12.10. Communication Technology
- 19.12.11. End-use Industry
- 19.13. Rest of Asia Pacific DC Microgrid Market
- 19.13.1. Country Segmental Analysis
- 19.13.2. Grid Type
- 19.13.3. Power Source
- 19.13.4. Voltage Level
- 19.13.5. Connectivity
- 19.13.6. Component
- 19.13.7. Capacity
- 19.13.8. Ownership Model
- 19.13.9. Technology
- 19.13.10. Communication Technology
- 19.13.11. End-use Industry
- 20. Middle East DC Microgrid Market Analysis
- 20.1. Key Segment Analysis
- 20.2. Regional Snapshot
- 20.3. Middle East DC Microgrid Market Size (Volume – Thousand Units and Value – US$ Bn), Analysis, and Forecasts, 2021-2035
- 20.3.1. Grid Type
- 20.3.2. Power Source
- 20.3.3. Voltage Level
- 20.3.4. Connectivity
- 20.3.5. Component
- 20.3.6. Capacity
- 20.3.7. Ownership Model
- 20.3.8. Technology
- 20.3.9. Communication Technology
- 20.3.10. End-use Industry
- 20.3.11. Country
- 20.3.11.1. Turkey
- 20.3.11.2. UAE
- 20.3.11.3. Saudi Arabia
- 20.3.11.4. Israel
- 20.3.11.5. Rest of Middle East
- 20.4. Turkey DC Microgrid Market
- 20.4.1. Country Segmental Analysis
- 20.4.2. Grid Type
- 20.4.3. Power Source
- 20.4.4. Voltage Level
- 20.4.5. Connectivity
- 20.4.6. Component
- 20.4.7. Capacity
- 20.4.8. Ownership Model
- 20.4.9. Technology
- 20.4.10. Communication Technology
- 20.4.11. End-use Industry
- 20.5. UAE DC Microgrid Market
- 20.5.1. Country Segmental Analysis
- 20.5.2. Grid Type
- 20.5.3. Power Source
- 20.5.4. Voltage Level
- 20.5.5. Connectivity
- 20.5.6. Component
- 20.5.7. Capacity
- 20.5.8. Ownership Model
- 20.5.9. Technology
- 20.5.10. Communication Technology
- 20.5.11. End-use Industry
- 20.6. Saudi Arabia DC Microgrid Market
- 20.6.1. Country Segmental Analysis
- 20.6.2. Grid Type
- 20.6.3. Power Source
- 20.6.4. Voltage Level
- 20.6.5. Connectivity
- 20.6.6. Component
- 20.6.7. Capacity
- 20.6.8. Ownership Model
- 20.6.9. Technology
- 20.6.10. Communication Technology
- 20.6.11. End-use Industry
- 20.7. Israel DC Microgrid Market
- 20.7.1. Country Segmental Analysis
- 20.7.2. Grid Type
- 20.7.3. Power Source
- 20.7.4. Voltage Level
- 20.7.5. Connectivity
- 20.7.6. Component
- 20.7.7. Capacity
- 20.7.8. Ownership Model
- 20.7.9. Technology
- 20.7.10. Communication Technology
- 20.7.11. End-use Industry
- 20.8. Rest of Middle East DC Microgrid Market
- 20.8.1. Country Segmental Analysis
- 20.8.2. Grid Type
- 20.8.3. Power Source
- 20.8.4. Voltage Level
- 20.8.5. Connectivity
- 20.8.6. Component
- 20.8.7. Capacity
- 20.8.8. Ownership Model
- 20.8.9. Technology
- 20.8.10. Communication Technology
- 20.8.11. End-use Industry
- 21. Africa DC Microgrid Market Analysis
- 21.1. Key Segment Analysis
- 21.2. Regional Snapshot
- 21.3. Africa DC Microgrid Market Size (Volume – Thousand Units and Value – US$ Bn), Analysis, and Forecasts, 2021-2035
- 21.3.1. Grid Type
- 21.3.2. Power Source
- 21.3.3. Voltage Level
- 21.3.4. Connectivity
- 21.3.5. Component
- 21.3.6. Capacity
- 21.3.7. Ownership Model
- 21.3.8. Technology
- 21.3.9. Communication Technology
- 21.3.10. End-use Industry
- 21.3.11. Country
- 21.3.11.1. South Africa
- 21.3.11.2. Egypt
- 21.3.11.3. Nigeria
- 21.3.11.4. Algeria
- 21.3.11.5. Rest of Africa
- 21.4. South Africa DC Microgrid Market
- 21.4.1. Country Segmental Analysis
- 21.4.2. Grid Type
- 21.4.3. Power Source
- 21.4.4. Voltage Level
- 21.4.5. Connectivity
- 21.4.6. Component
- 21.4.7. Capacity
- 21.4.8. Ownership Model
- 21.4.9. Technology
- 21.4.10. Communication Technology
- 21.4.11. End-use Industry
- 21.5. Egypt DC Microgrid Market
- 21.5.1. Country Segmental Analysis
- 21.5.2. Grid Type
- 21.5.3. Power Source
- 21.5.4. Voltage Level
- 21.5.5. Connectivity
- 21.5.6. Component
- 21.5.7. Capacity
- 21.5.8. Ownership Model
- 21.5.9. Technology
- 21.5.10. Communication Technology
- 21.5.11. End-use Industry
- 21.6. Nigeria DC Microgrid Market
- 21.6.1. Country Segmental Analysis
- 21.6.2. Grid Type
- 21.6.3. Power Source
- 21.6.4. Voltage Level
- 21.6.5. Connectivity
- 21.6.6. Component
- 21.6.7. Capacity
- 21.6.8. Ownership Model
- 21.6.9. Technology
- 21.6.10. Communication Technology
- 21.6.11. End-use Industry
- 21.7. Algeria DC Microgrid Market
- 21.7.1. Country Segmental Analysis
- 21.7.2. Grid Type
- 21.7.3. Power Source
- 21.7.4. Voltage Level
- 21.7.5. Connectivity
- 21.7.6. Component
- 21.7.7. Capacity
- 21.7.8. Ownership Model
- 21.7.9. Technology
- 21.7.10. Communication Technology
- 21.7.11. End-use Industry
- 21.8. Rest of Africa DC Microgrid Market
- 21.8.1. Country Segmental Analysis
- 21.8.2. Grid Type
- 21.8.3. Power Source
- 21.8.4. Voltage Level
- 21.8.5. Connectivity
- 21.8.6. Component
- 21.8.7. Capacity
- 21.8.8. Ownership Model
- 21.8.9. Technology
- 21.8.10. Communication Technology
- 21.8.11. End-use Industry
- 22. South America DC Microgrid Market Analysis
- 22.1. Key Segment Analysis
- 22.2. Regional Snapshot
- 22.3. South America DC Microgrid Market Size (Volume – Thousand Units and Value – US$ Bn), Analysis, and Forecasts, 2021-2035
- 22.3.1. Grid Type
- 22.3.2. Power Source
- 22.3.3. Voltage Level
- 22.3.4. Connectivity
- 22.3.5. Component
- 22.3.6. Capacity
- 22.3.7. Ownership Model
- 22.3.8. Technology
- 22.3.9. Communication Technology
- 22.3.10. End-use Industry
- 22.3.11. Country
- 22.3.11.1. Brazil
- 22.3.11.2. Argentina
- 22.3.11.3. Rest of South America
- 22.4. Brazil DC Microgrid Market
- 22.4.1. Country Segmental Analysis
- 22.4.2. Grid Type
- 22.4.3. Power Source
- 22.4.4. Voltage Level
- 22.4.5. Connectivity
- 22.4.6. Component
- 22.4.7. Capacity
- 22.4.8. Ownership Model
- 22.4.9. Technology
- 22.4.10. Communication Technology
- 22.4.11. End-use Industry
- 22.5. Argentina DC Microgrid Market
- 22.5.1. Country Segmental Analysis
- 22.5.2. Grid Type
- 22.5.3. Power Source
- 22.5.4. Voltage Level
- 22.5.5. Connectivity
- 22.5.6. Component
- 22.5.7. Capacity
- 22.5.8. Ownership Model
- 22.5.9. Technology
- 22.5.10. Communication Technology
- 22.5.11. End-use Industry
- 22.6. Rest of South America DC Microgrid Market
- 22.6.1. Country Segmental Analysis
- 22.6.2. Grid Type
- 22.6.3. Power Source
- 22.6.4. Voltage Level
- 22.6.5. Connectivity
- 22.6.6. Component
- 22.6.7. Capacity
- 22.6.8. Ownership Model
- 22.6.9. Technology
- 22.6.10. Communication Technology
- 22.6.11. End-use Industry
- 23. Key Players/ Company Profile
- 23.1. ABB Ltd.
- 23.1.1. Company Details/ Overview
- 23.1.2. Company Financials
- 23.1.3. Key Customers and Competitors
- 23.1.4. Business/ Industry Portfolio
- 23.1.5. Product Portfolio/ Specification Details
- 23.1.6. Pricing Data
- 23.1.7. Strategic Overview
- 23.1.8. Recent Developments
- 23.2. ABB Ltd.
- 23.3. Siemens AG
- 23.4. Schneider Electric SE
- 23.5. General Electric Company
- 23.6. Eaton Corporation
- 23.7. Honeywell International Inc.
- 23.8. Hitachi Energy Ltd.
- 23.9. Enphase Energy Inc.
- 23.10. SMA Solar Technology AG
- 23.11. Fronius International GmbH
- 23.12. Tesla Inc.
- 23.13. LG Energy Solution
- 23.14. Huawei Technologies Co. Ltd.
- 23.15. Delta Electronics Inc.
- 23.16. Mitsubishi Electric Corporation
- 23.17. Toshiba Corporation
- 23.18. NEC Corporation
- 23.19. S&C Electric Company
- 23.20. Princeton Power Systems
- 23.21. Pika Energy Inc.
- 23.22. Rolls-Royce Power Systems
- 23.23. Vertiv Group Corporation
- 23.24. Power Electronics S.L.
- 23.25. Other Key Players
- 23.1. ABB Ltd.
Note* - This is just tentative list of players. While providing the report, we will cover more number of players based on their revenue and share for each geography
Research Design
Our research design integrates both demand-side and supply-side analysis through a balanced combination of primary and secondary research methodologies. By utilizing both bottom-up and top-down approaches alongside rigorous data triangulation methods, we deliver robust market intelligence that supports strategic decision-making.
MarketGenics' comprehensive research design framework ensures the delivery of accurate, reliable, and actionable market intelligence. Through the integration of multiple research approaches, rigorous validation processes, and expert analysis, we provide our clients with the insights needed to make informed strategic decisions and capitalize on market opportunities.

MarketGenics leverages a dedicated industry panel of experts and a comprehensive suite of paid databases to effectively collect, consolidate, and analyze market intelligence.
Our approach has consistently proven to be reliable and effective in generating accurate market insights, identifying key industry trends, and uncovering emerging business opportunities.
Through both primary and secondary research, we capture and analyze critical company-level data such as manufacturing footprints, including technical centers, R&D facilities, sales offices, and headquarters.
Our expert panel further enhances our ability to estimate market size for specific brands based on validated field-level intelligence.
Our data mining techniques incorporate both parametric and non-parametric methods, allowing for structured data collection, sorting, processing, and cleaning.
Demand projections are derived from large-scale data sets analyzed through proprietary algorithms, culminating in robust and reliable market sizing.
Research Approach
The bottom-up approach builds market estimates by starting with the smallest addressable market units and systematically aggregating them to create comprehensive market size projections.
This method begins with specific, granular data points and builds upward to create the complete market landscape.
Customer Analysis → Segmental Analysis → Geographical Analysis
The top-down approach starts with the broadest possible market data and systematically narrows it down through a series of filters and assumptions to arrive at specific market segments or opportunities.
This method begins with the big picture and works downward to increasingly specific market slices.
TAM → SAM → SOM


Research Methods
Desk / Secondary Research
While analysing the market, we extensively study secondary sources, directories, and databases to identify and collect information useful for this technical, market-oriented, and commercial report. Secondary sources that we utilize are not only the public sources, but it is a combination of Open Source, Associations, Paid Databases, MG Repository & Knowledgebase, and others.
- Company websites, annual reports, financial reports, broker reports, and investor presentations
- National government documents, statistical databases and reports
- News articles, press releases and web-casts specific to the companies operating in the market, Magazines, reports, and others
- We gather information from commercial data sources for deriving company specific data such as segmental revenue, share for geography, product revenue, and others
- Internal and external proprietary databases (industry-specific), relevant patent, and regulatory databases
- Governing Bodies, Government Organizations
- Relevant Authorities, Country-specific Associations for Industries
We also employ the model mapping approach to estimate the product level market data through the players' product portfolio
Primary Research
Primary research/ interviews is vital in analyzing the market. Most of the cases involves paid primary interviews. Primary sources include primary interviews through e-mail interactions, telephonic interviews, surveys as well as face-to-face interviews with the different stakeholders across the value chain including several industry experts.
| Type of Respondents | Number of Primaries |
|---|---|
| Tier 2/3 Suppliers | ~20 |
| Tier 1 Suppliers | ~25 |
| End-users | ~25 |
| Industry Expert/ Panel/ Consultant | ~30 |
| Total | ~100 |
MG Knowledgebase
• Repository of industry blog, newsletter and case studies
• Online platform covering detailed market reports, and company profiles
Forecasting Factors and Models
Forecasting Factors
- Historical Trends – Past market patterns, cycles, and major events that shaped how markets behave over time. Understanding past trends helps predict future behavior.
- Industry Factors – Specific characteristics of the industry like structure, regulations, and innovation cycles that affect market dynamics.
- Macroeconomic Factors – Economic conditions like GDP growth, inflation, and employment rates that affect how much money people have to spend.
- Demographic Factors – Population characteristics like age, income, and location that determine who can buy your product.
- Technology Factors – How quickly people adopt new technology and how much technology infrastructure exists.
- Regulatory Factors – Government rules, laws, and policies that can help or restrict market growth.
- Competitive Factors – Analyzing competition structure such as degree of competition and bargaining power of buyers and suppliers.
Forecasting Models / Techniques
Multiple Regression Analysis
- Identify and quantify factors that drive market changes
- Statistical modeling to establish relationships between market drivers and outcomes
Time Series Analysis – Seasonal Patterns
- Understand regular cyclical patterns in market demand
- Advanced statistical techniques to separate trend, seasonal, and irregular components
Time Series Analysis – Trend Analysis
- Identify underlying market growth patterns and momentum
- Statistical analysis of historical data to project future trends
Expert Opinion – Expert Interviews
- Gather deep industry insights and contextual understanding
- In-depth interviews with key industry stakeholders
Multi-Scenario Development
- Prepare for uncertainty by modeling different possible futures
- Creating optimistic, pessimistic, and most likely scenarios
Time Series Analysis – Moving Averages
- Sophisticated forecasting for complex time series data
- Auto-regressive integrated moving average models with seasonal components
Econometric Models
- Apply economic theory to market forecasting
- Sophisticated economic models that account for market interactions
Expert Opinion – Delphi Method
- Harness collective wisdom of industry experts
- Structured, multi-round expert consultation process
Monte Carlo Simulation
- Quantify uncertainty and probability distributions
- Thousands of simulations with varying input parameters
Research Analysis
Our research framework is built upon the fundamental principle of validating market intelligence from both demand and supply perspectives. This dual-sided approach ensures comprehensive market understanding and reduces the risk of single-source bias.
Demand-Side Analysis: We understand end-user/application behavior, preferences, and market needs along with the penetration of the product for specific application.
Supply-Side Analysis: We estimate overall market revenue, analyze the segmental share along with industry capacity, competitive landscape, and market structure.
Validation & Evaluation
Data triangulation is a validation technique that uses multiple methods, sources, or perspectives to examine the same research question, thereby increasing the credibility and reliability of research findings. In market research, triangulation serves as a quality assurance mechanism that helps identify and minimize bias, validate assumptions, and ensure accuracy in market estimates.
- Data Source Triangulation – Using multiple data sources to examine the same phenomenon
- Methodological Triangulation – Using multiple research methods to study the same research question
- Investigator Triangulation – Using multiple researchers or analysts to examine the same data
- Theoretical Triangulation – Using multiple theoretical perspectives to interpret the same data

Custom Market Research Services
We will customise the research for you, in case the report listed above does not meet your requirements.
Get 10% Free Customisation