Digital Substation Market Size, Share & Trends Analysis Report by Voltage Level (Low Voltage, Medium Voltage, High Voltage, Extra High Voltage), Component, Communication Protocol, Installation Type, Rated Power, Substation Type, Connection Type, Application, End-Use Industry, and Geography (North America, Europe, Asia Pacific, Middle East, Africa, and South America) – Global Industry Data, Trends, and Forecasts, 2026–2035
|
|
|
Segmental Data Insights |
|
|
Demand Trends |
|
|
Competitive Landscape |
|
|
Strategic Development |
|
|
Future Outlook & Opportunities |
|
Digital Substation Market Size, Share, and Growth
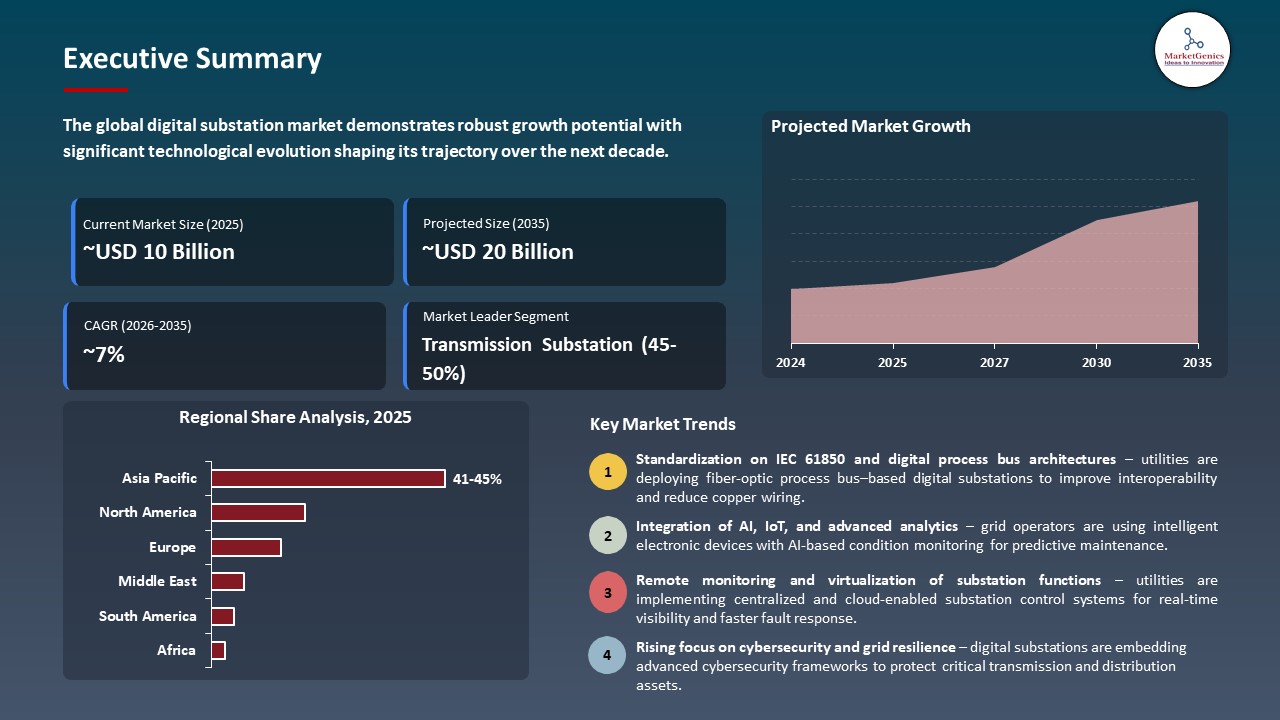
The global digital substation market is experiencing robust growth, with its estimated value of USD 9.7 billion in the year 2025 and USD 19.6 billion by the period 2035, registering a CAGR of 7.3%, during the forecast period. The global digital substation market, driven by the need for enhanced grid reliability, real-time monitoring, remote operation, reduced maintenance costs, integration of renewable energy, and improved efficiency through automation and intelligent data analytics.
Bob Yeager, president of Emerson's power and water business said, "Our next-generation platform will help modernize power and water operations, unlocking predictive strategies to help utilities meet the evolving pressures of the industries, Ovation 4.0 offers a single automation platform with real-time data, enabling customers to keep pace with rapidly changing markets, providing the insights they need to work smarter, better and faster."
The increasing need of digital substations, driven by the pursuit of grid modernity by the utilities and the implementation of real-time automation technologies to improve operational efficiency and reliability. For instance, in December 2024, Siemens published the SIProtec 5 V9.90 release that adds IEC 61850 process bus capability with increased commissioning speed, enhanced protection and better interoperability in digital substations. This update enhances grid reliability and speed up the use of the modern technologies of digital substations.
Additionally, the increased focus on predictive maintenance and lower operational expenses is pushing towards the use of digital substations. For instance, in 2025, ABB installed its IEC 61850-compliant Relion protection relay in several utility projects, which made it possible to monitor the conditions in real time and maintain the equipment on a case-by-case basis. This application reduces downtime and operation costs as well as expanding the integration of digital substations.
Key adjacent opportunities to the global digital substation market include smart grid solutions, energy storage systems, renewable integration platforms, IoT-enabled asset management, and predictive maintenance services. These sectors are the complements of digital substations they improve the efficiency, reliability, and sustainability of the grid. Utilizing these adjacent markets can accelerate the adoption of digital substations and increase access to revenue streams on the part of the utilities and the technology providers.
Digital Substation Market Dynamics and Trends
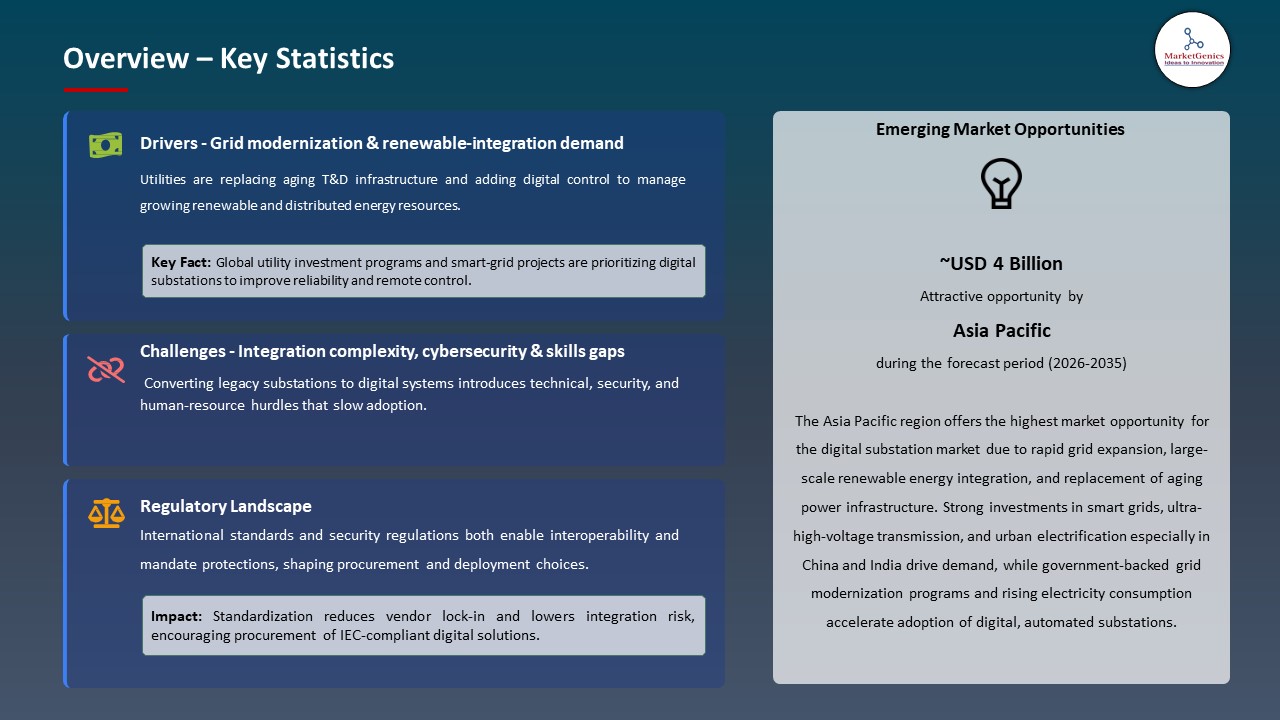
Driver: Robust Digital Integration for Operational Efficiency in Power Grids
-
The growing rate of grid-digitization and integrated substation automation platforms is a major contributor to the digital substation market. The needs of utilities have been shifting toward a more efficient operation, control of the systems in real-time, and better reliability, which have encouraged the investments into the technologies that may incorporate several functions of a substation into the unified digital infrastructure.
- For instance, in February 2024, GE Vernova introduced its GridBeats portfolio, a software-defined automation system that is intended to modernize digital substations. The platform uses AI and machine learning algorithms to maximize the performance of the grid including predictive insights, real time control and improved decision-making capabilities to utility operators.
- Moreover, GridBeats incorporates a high level of cybersecurity and offers complete grid visibility, where protection, control, and analytics are easily coordinated, and the utilities can easily manage variable loads and combine distributed energy resources effectively.
- These combined automation systems lower operation costs, enhance the overall grid stability, and increase the pace at which digital substations are adopted both in the transmission and distribution systems, which puts utilities in a more resilient and efficient position to manage energy.
Restraint: High Initial Capital Investment and Complex Integration Challenges
-
The digital substation market has certain limitations which are high initial cost and technical difficulty of adopting advanced digital technologies. To install fully functional digital substations, utilities will have to spend a lot of money on smart electronic equipment, fiber optic line, IEC 61850-based communication, and intelligent cybersecurity solutions.
- These investments may be prohibitive to smaller utilities and developing economies, as the budget constraints do not allow implementing advanced automation and monitoring toolsets. The elevated start-up cost usually compels small operators to postpone or reduce digital substation programmes.
- The need to integrate with legacy infrastructure further complicates the matter since retrofitting the existing substations is a complicated process that requires careful planning, sophisticated technical skills, and qualified professionals to promote compatibility and effective functioning. This integration issue may extend project schedules and risk operation at the time of deployment.
- These economic and technical challenges may slack market penetration and delay the analog to digital substation migration especially in economically sensitive parts, which restricts the total market development in the short run.
Opportunity: Expansion Through Intelligent Asset Management and Digital Twin Deployment
-
The digital substation market presents significant opportunities due to smart asset management and deployment of digital twins, which would allow utilities to optimize the performance of the equipment, lengthen equipment lifespan and decrease unwanted outages. Digital twins enable operators to monitor and control the activity of substations, as they offer a virtual representation of physical assets, which has become beneficial to control the work of these devices.
- Digital twins allow simulating different working conditions and forecasting the requirements of the maintenance process, as well as finding possible breakdowns before they happen. The proactive strategy lowers the amount of downtime, minimizes costs of maintenance, and improves the overall grid reliability, contributing to the transformation of the reactive maintenance strategy to a predictive one.
- For instance, in November 2025, Schneider Electric implemented its EcoStruxure Digital Twin solutions at a European utility’s high-voltage substation. The system combined real time sensor measurements with predictive analytics in order to monitor the transformer and breaker health, simulate load variations and optimize the energy flow.
- Implementation of digital twin technologies is also not only more efficient, but also allows implementing strategic planning and growing digital substation adoption.
Key Trend: Convergence of IoT, Edge Computing, and Predictive Analytics
-
A major trend in the digital substation market is the integration of IoT, edge computing, and predictive analytics to enhance operational efficiency, reliability, and real-time decision-making. IoT sensors at substations are connected to high resolution sensors that collect data on substation equipment such as transformers, circuit breakers and switchgears. These data are processed locally by edge computing, which minimizes the latency and allows prompt reactions to the abnormal conditions or faults.
- For instance, in May 2024, ABB implemented its Ability Edge Intelligence in one of the Scandinavian digital substation projects. The platform integrated the IoT-based monitoring with edge computing and predictive analytics to identify the anomalies of equipment in real-time, optimize the distribution of loads, and avoid the unplanned outages to achieve the resilience and efficiency of grid operations.
- Predictive analytics uses AI and machine learning algorithms to predict possible failures, optimize maintenance periods, and enhance the use of assets. This interoperability will make the grid smarter as well as hasten the adoption of digital substations across the globe.
Digital-Substation-Market Analysis and Segmental Data
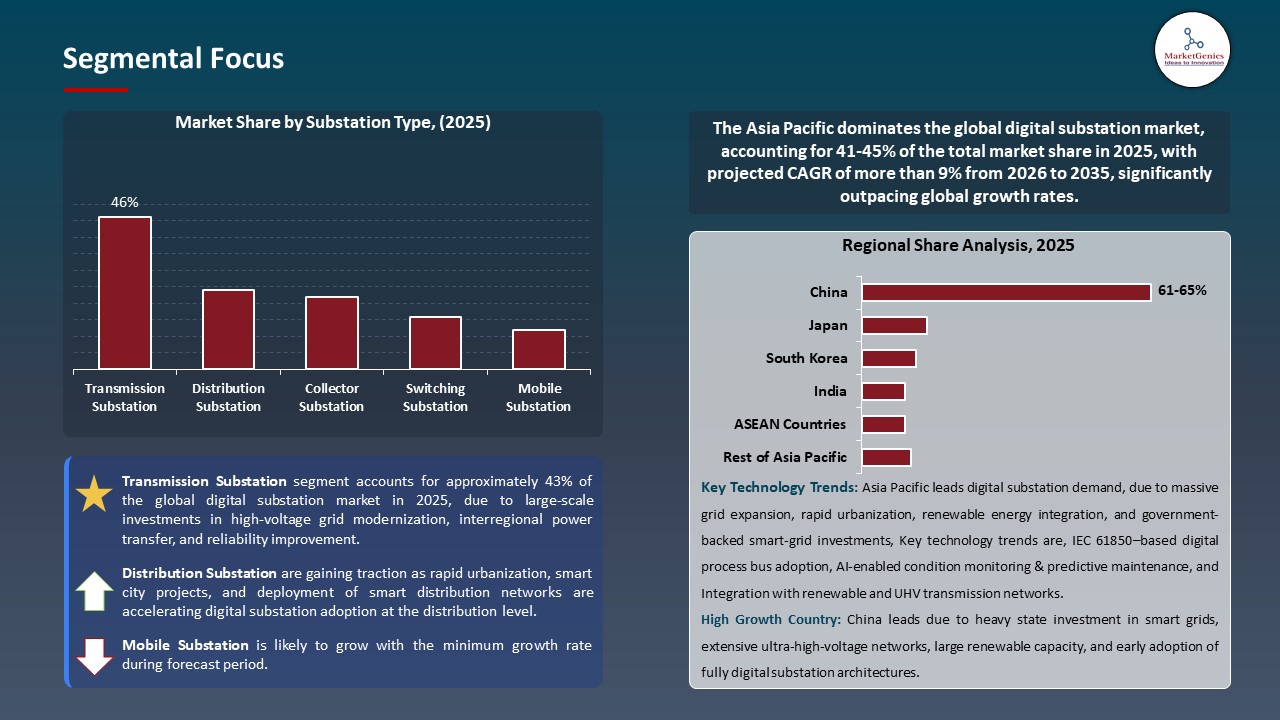
Transmission Substation Dominate Global Digital Substation Market
-
The transmission substation segment dominates the global digital substation market, as they are important in the high-voltage power transmission and the stability of the grid. To operate such substations, there is a need to have sophisticated automation, protection, and control systems to handle massive electric flows effectively and provide reliability on regional and national grids. In this segment, digital substations can be used to create real-time monitoring, fault detection and predictive maintenance which minimize the downtime and risk of operations.
- For instance, in 2025, Siemens launched its SIPROTEC 5 and SICAM products on a high-voltage transmission substation in Germany with digital protection relays, process-bus accommodated and remote monitoring. This deployment lasted to enhance the response to faults, interoperability, and to be able to incorporate renewable energy sources into the transmission system without any problem.
- The dominance of transmission substations promotes investment in advanced digital technologies, which contributes to the dynamics of the development and implementation of digital substation solutions globally.
Asia Pacific Leads Global Digital Substation Market Demand
-
Asia Pacific leads the digital substation market, due to the rapid process of urbanization and increased industrialization of the region which is driving investment in modern and automated substations to address the increasing electricity demand and enhance grid reliability. For instance, in 2024, the State grid Corporation of China installed Siemens SIPROTEC 5 digital substations to transform high voltage transmission networks, which improved its efficiency in operation, fault identification, and also remote monitoring.
- Moreover, the favorable government policies and renewable energy goals are motivating utility companies to implement digital substations to provide effective integration of solar and wind energy resources, as well as distributed energy resources. For instance, in 2025, the Power Grid Corporation in India installed ABB digital substations that met the requirements of IEC 61850 and National Smart grid mission, allowing predictive maintenance, high reliability, and effective integration of distributed energy resources.
- These drivers position Asia Pacific as the fastest-growing market for digital substations, accelerating adoption, enhancing grid reliability, and supporting large-scale renewable energy integration.
Digital-Substation-Market Ecosystem
The global digital substation market is moderately consolidated, with high concentration among key players such as Siemens AG, ABB Ltd., Schneider Electric SE, General Electric Company, and Hitachi Energy Ltd., who dominate through large product portfolio, best technological solutions, strategic alliances, and massive projects, which they can use to establish a good market presence and influence the industry standards.
Market consolidation enables the dominant industry participants to facilitate innovations, industry standards, and competitive advantages that influence the development of the digital substation industry and technological orientation in the global market.

Recent Development and Strategic Overview:
-
In March 2025, Systems with Intelligence (SWI) unveiled the DVS3000, an AI‑ready Digital Video Server designed for remote monitoring of substations (thermal + visual), supporting grid operations and digital inspection workflows; this enhances digital inspection readiness for utility substations.
- In June 2024, Emerson announced its Ovation 4.0 automation platform, introducing software‑defined, AI‑ready capabilities that help utilities and substations integrate real‑time data, predictive analytics, and unified automation a key digital grid infrastructure innovation impacting substation automation.
Report Scope
|
Detail |
|
|
Market Size in 2025 |
USD 9.7 Bn |
|
Market Forecast Value in 2035 |
USD 19.6Bn |
|
Growth Rate (CAGR) |
7.3% |
|
Forecast Period |
2026 – 2035 |
|
Historical Data Available for |
2021 – 2024 |
|
Market Size Units |
US$ Billion for Value Thousand Units for Volume |
|
Report Format |
Electronic (PDF) + Excel |
|
North America |
Europe |
Asia Pacific |
Middle East |
Africa |
South America |
|
|
|
|
|
|
|
Companies Covered |
|||||
|
|
|
|
|
|
Digital-Substation-Market Segmentation and Highlights
|
Segment |
Sub-segment |
|
Digital Substation Market, By Voltage Level |
|
|
Digital Substation Market, By Component |
|
|
Digital Substation Market, By Communication Protocol |
|
|
Digital Substation Market, By Installation Type |
|
|
Digital Substation Market, By Rated Power
|
|
|
Digital Substation Market, By Substation Type
|
|
|
Digital Substation Market, By Connection Type |
|
|
Digital Substation Market, By Application |
|
|
Digital Substation Market, By End-Use Industry |
|
Frequently Asked Questions
Table of Contents
- 1. Research Methodology and Assumptions
- 1.1. Definitions
- 1.2. Research Design and Approach
- 1.3. Data Collection Methods
- 1.4. Base Estimates and Calculations
- 1.5. Forecasting Models
- 1.5.1. Key Forecast Factors & Impact Analysis
- 1.6. Secondary Research
- 1.6.1. Open Sources
- 1.6.2. Paid Databases
- 1.6.3. Associations
- 1.7. Primary Research
- 1.7.1. Primary Sources
- 1.7.2. Primary Interviews with Stakeholders across Ecosystem
- 2. Executive Summary
- 2.1. Global Digital Substation Market Outlook
- 2.1.1. Digital Substation Market Size (Volume – Thousand Units and Value – US$ Bn), and Forecasts, 2021-2035
- 2.1.2. Compounded Annual Growth Rate Analysis
- 2.1.3. Growth Opportunity Analysis
- 2.1.4. Segmental Share Analysis
- 2.1.5. Geographical Share Analysis
- 2.2. Market Analysis and Facts
- 2.3. Supply-Demand Analysis
- 2.4. Competitive Benchmarking
- 2.5. Go-to- Market Strategy
- 2.5.1. Customer/ End-use Industry Assessment
- 2.5.2. Growth Opportunity Data, 2026-2035
- 2.5.2.1. Regional Data
- 2.5.2.2. Country Data
- 2.5.2.3. Segmental Data
- 2.5.3. Identification of Potential Market Spaces
- 2.5.4. GAP Analysis
- 2.5.5. Potential Attractive Price Points
- 2.5.6. Prevailing Market Risks & Challenges
- 2.5.7. Preferred Sales & Marketing Strategies
- 2.5.8. Key Recommendations and Analysis
- 2.5.9. A Way Forward
- 2.1. Global Digital Substation Market Outlook
- 3. Industry Data and Premium Insights
- 3.1. Global Energy & Power Industry Overview, 2025
- 3.1.1. Energy & Power Industry Ecosystem Analysis
- 3.1.2. Key Trends for Energy & Power Industry
- 3.1.3. Regional Distribution for Energy & Power Industry
- 3.2. Supplier Customer Data
- 3.3. Technology Roadmap and Developments
- 3.4. Trade Analysis
- 3.4.1. Import & Export Analysis, 2025
- 3.4.2. Top Importing Countries
- 3.4.3. Top Exporting Countries
- 3.5. Trump Tariff Impact Analysis
- 3.5.1. Manufacturer
- 3.5.1.1. Based on the component & Raw material
- 3.5.2. Supply Chain
- 3.5.3. End Consumer
- 3.5.1. Manufacturer
- 3.6. Raw Material Analysis
- 3.1. Global Energy & Power Industry Overview, 2025
- 4. Market Overview
- 4.1. Market Dynamics
- 4.1.1. Drivers
- 4.1.1.1. Grid modernization and replacement of aging transmission and distribution infrastructure
- 4.1.1.2. Increasing integration of renewable energy requiring advanced monitoring and control
- 4.1.1.3. Growing adoption of smart grids, IEC 61850 standards, and digital automation technologies
- 4.1.2. Restraints
- 4.1.2.1. High initial investment and implementation costs
- 4.1.2.2. Integration complexity with existing legacy substation infrastructure
- 4.1.1. Drivers
- 4.2. Key Trend Analysis
- 4.3. Regulatory Framework
- 4.3.1. Key Regulations, Norms, and Subsidies, by Key Countries
- 4.3.2. Tariffs and Standards
- 4.3.3. Impact Analysis of Regulations on the Market
- 4.4. Value Chain Analysis
- 4.4.1. Raw Material & Component Suppliers
- 4.4.2. Substation Equipment Manufacturers
- 4.4.3. Digital Solution Providers
- 4.4.4. End-users
- 4.5. Cost Structure Analysis
- 4.5.1. Parameter’s Share for Cost Associated
- 4.5.2. COGP vs COGS
- 4.5.3. Profit Margin Analysis
- 4.6. Pricing Analysis
- 4.6.1. Regional Pricing Analysis
- 4.6.2. Segmental Pricing Trends
- 4.6.3. Factors Influencing Pricing
- 4.7. Porter’s Five Forces Analysis
- 4.8. PESTEL Analysis
- 4.9. Global Digital Substation Market Demand
- 4.9.1. Historical Market Size – Volume (Thousand Units) and Value (US$ Bn), 2020-2024
- 4.9.2. Current and Future Market Size – Volume (Thousand Units) and Value (US$ Bn), 2026–2035
- 4.9.2.1. Y-o-Y Growth Trends
- 4.9.2.2. Absolute $ Opportunity Assessment
- 4.1. Market Dynamics
- 5. Competition Landscape
- 5.1. Competition structure
- 5.1.1. Fragmented v/s consolidated
- 5.2. Company Share Analysis, 2025
- 5.2.1. Global Company Market Share
- 5.2.2. By Region
- 5.2.2.1. North America
- 5.2.2.2. Europe
- 5.2.2.3. Asia Pacific
- 5.2.2.4. Middle East
- 5.2.2.5. Africa
- 5.2.2.6. South America
- 5.3. Product Comparison Matrix
- 5.3.1. Specifications
- 5.3.2. Market Positioning
- 5.3.3. Pricing
- 5.1. Competition structure
- 6. Global Digital Substation Market Analysis, by Voltage Level
- 6.1. Key Segment Analysis
- 6.2. Digital Substation Market Size (Volume – Thousand Units and Value – US$ Bn), Analysis, and Forecasts, by Voltage Level, 2021-2035
- 6.2.1. Low Voltage (LV)
- 6.2.1.1. Below 1 kV
- 6.2.1.2. 1 kV to 35 kV
- 6.2.2. Medium Voltage (MV)
- 6.2.2.1. 35 kV to 110 kV
- 6.2.2.2. 110 kV to 220 kV
- 6.2.3. High Voltage (HV)
- 6.2.3.1. 220 kV to 500 kV
- 6.2.3.2. Above 500 kV
- 6.2.4. Extra High Voltage (EHV)
- 6.2.4.1. 765 kV and above
- 6.2.1. Low Voltage (LV)
- 7. Global Digital Substation Market Analysis, by Component
- 7.1. Key Segment Analysis
- 7.2. Digital Substation Market Size (Volume – Thousand Units and Value – US$ Bn), Analysis, and Forecasts, by Component, 2021-2035
- 7.2.1. Hardware
- 7.2.1.1. Intelligent Electronic Devices (IEDs)
- 7.2.1.2. Merging Units
- 7.2.1.3. Communication Networks
- 7.2.1.4. Digital Relays
- 7.2.1.5. Process Bus
- 7.2.1.6. Station Bus
- 7.2.1.7. Digital Transformers
- 7.2.1.8. Others
- 7.2.2. Software
- 7.2.2.1. SCADA Systems
- 7.2.2.2. Substation Automation Software
- 7.2.2.3. Asset Management Software
- 7.2.2.4. Monitoring & Diagnostics Software
- 7.2.2.5. Others
- 7.2.3. Services
- 7.2.3.1. Installation & Commissioning
- 7.2.3.2. Maintenance & Support
- 7.2.3.3. Consulting Services
- 7.2.3.4. Training Services
- 7.2.3.5. Others
- 7.2.1. Hardware
- 8. Global Digital Substation Market Analysis, by Communication Protocol
- 8.1. Key Segment Analysis
- 8.2. Digital Substation Market Size (Volume – Thousand Units and Value – US$ Bn), Analysis, and Forecasts, by Communication Protocol, 2021-2035
- 8.2.1. IEC 61850
- 8.2.1.1. GOOSE (Generic Object-Oriented Substation Event)
- 8.2.1.2. MMS (Manufacturing Message Specification)
- 8.2.1.3. SMV (Sampled Measured Values)
- 8.2.1.4. Others
- 8.2.2. DNP3
- 8.2.3. Modbus
- 8.2.4. Profibus
- 8.2.5. OPC UA
- 8.2.6. Ethernet/IP
- 8.2.1. IEC 61850
- 9. Global Digital Substation Market Analysis, by Installation Type
- 9.1. Key Segment Analysis
- 9.2. Digital Substation Market Size (Volume – Thousand Units and Value – US$ Bn), Analysis, and Forecasts, by Installation Type, 2021-2035
- 9.2.1. Greenfield Installation
- 9.2.2. Brownfield Retrofitting/Upgradation
- 10. Global Digital Substation Market Analysis, by Rated Power
- 10.1. Key Segment Analysis
- 10.2. Digital Substation Market Size (Volume – Thousand Units and Value – US$ Bn), Analysis, and Forecasts, by Rated Power, 2021-2035
- 10.2.1. Below 100 MVA
- 10.2.2. 100 MVA to 500 MVA
- 10.2.3. 500 MVA to 1000 MVA
- 10.2.4. Above 1000 MVA
- 11. Global Digital Substation Market Analysis, by Substation Type
- 11.1. Key Segment Analysis
- 11.2. Digital Substation Market Size (Volume – Thousand Units and Value – US$ Bn), Analysis, and Forecasts, by Substation Type, 2021-2035
- 11.2.1. Transmission Substation
- 11.2.2. Distribution Substation
- 11.2.3. Collector Substation
- 11.2.4. Switching Substation
- 11.2.5. Mobile Substation
- 12. Global Digital Substation Market Analysis, by Connection Type
- 12.1. Key Segment Analysis
- 12.2. Digital Substation Market Size (Volume – Thousand Units and Value – US$ Bn), Analysis, and Forecasts, by Connection Type, 2021-2035
- 12.2.1. Grid-Connected
- 12.2.2. Off-Grid/Islanded
- 12.2.3. Hybrid Connection
- 13. Global Digital Substation Market Analysis and Forecasts, by Application
- 13.1. Key Findings
- 13.2. Digital Substation Market Size (Volume – Thousand Units and Value – US$ Bn), Analysis, and Forecasts, by Application, 2021-2035
- 13.2.1. Power Generation
- 13.2.2. Power Transmission
- 13.2.3. Power Distribution
- 13.2.4. Industrial Power Systems
- 13.2.5. Railway Electrification
- 13.2.6. Metro & Urban Transit
- 13.2.7. Smart Grid Integration
- 13.2.8. Others
- 14. Global Digital Substation Market Analysis and Forecasts, by End-Use Industry
- 14.1. Key Findings
- 14.2. Digital Substation Market Size (Volume – Thousand Units and Value – US$ Bn), Analysis, and Forecasts, by End-Use Industry, 2021-2035
- 14.2.1. Utilities & Power Generation
- 14.2.2. Renewable Energy
- 14.2.3. Oil & Gas
- 14.2.4. Manufacturing
- 14.2.5. Transportation & Infrastructure
- 14.2.6. Commercial & Residential
- 14.2.7. Marine & Defense
- 14.2.8. Mining & Metals
- 14.2.9. Other Industries
- 15. Global Digital Substation Market Analysis and Forecasts, by Region
- 15.1. Key Findings
- 15.2. Digital Substation Market Size (Volume – Thousand Units and Value – US$ Bn), Analysis, and Forecasts, by Region, 2021-2035
- 15.2.1. North America
- 15.2.2. Europe
- 15.2.3. Asia Pacific
- 15.2.4. Middle East
- 15.2.5. Africa
- 15.2.6. South America
- 16. North America Digital Substation Market Analysis
- 16.1. Key Segment Analysis
- 16.2. Regional Snapshot
- 16.3. North America Digital Substation Market Size (Volume – Thousand Units and Value – US$ Bn), Analysis, and Forecasts, 2021-2035
- 16.3.1. Voltage Level
- 16.3.2. Component
- 16.3.3. Communication Protocol
- 16.3.4. Installation Type
- 16.3.5. Rated Power
- 16.3.6. Substation Type
- 16.3.7. Connection Type
- 16.3.8. Application
- 16.3.9. End-Use Industry
- 16.3.10. Country
- 16.3.10.1. USA
- 16.3.10.2. Canada
- 16.3.10.3. Mexico
- 16.4. USA Digital Substation Market
- 16.4.1. Country Segmental Analysis
- 16.4.2. Voltage Level
- 16.4.3. Component
- 16.4.4. Communication Protocol
- 16.4.5. Installation Type
- 16.4.6. Rated Power
- 16.4.7. Substation Type
- 16.4.8. Connection Type
- 16.4.9. Application
- 16.4.10. End-Use Industry
- 16.5. Canada Digital Substation Market
- 16.5.1. Country Segmental Analysis
- 16.5.2. Voltage Level
- 16.5.3. Component
- 16.5.4. Communication Protocol
- 16.5.5. Installation Type
- 16.5.6. Rated Power
- 16.5.7. Substation Type
- 16.5.8. Connection Type
- 16.5.9. Application
- 16.5.10. End-Use Industry
- 16.6. Mexico Digital Substation Market
- 16.6.1. Country Segmental Analysis
- 16.6.2. Voltage Level
- 16.6.3. Component
- 16.6.4. Communication Protocol
- 16.6.5. Installation Type
- 16.6.6. Rated Power
- 16.6.7. Substation Type
- 16.6.8. Connection Type
- 16.6.9. Application
- 16.6.10. End-Use Industry
- 17. Europe Digital Substation Market Analysis
- 17.1. Key Segment Analysis
- 17.2. Regional Snapshot
- 17.3. Europe Digital Substation Market Size (Volume – Thousand Units and Value – US$ Bn), Analysis, and Forecasts, 2021-2035
- 17.3.1. Voltage Level
- 17.3.2. Component
- 17.3.3. Communication Protocol
- 17.3.4. Installation Type
- 17.3.5. Rated Power
- 17.3.6. Substation Type
- 17.3.7. Connection Type
- 17.3.8. Application
- 17.3.9. End-Use Industry
- 17.3.10. Country
- 17.3.10.1. Germany
- 17.3.10.2. United Kingdom
- 17.3.10.3. France
- 17.3.10.4. Italy
- 17.3.10.5. Spain
- 17.3.10.6. Netherlands
- 17.3.10.7. Nordic Countries
- 17.3.10.8. Poland
- 17.3.10.9. Russia & CIS
- 17.3.10.10. Rest of Europe
- 17.4. Germany Digital Substation Market
- 17.4.1. Country Segmental Analysis
- 17.4.2. Voltage Level
- 17.4.3. Component
- 17.4.4. Communication Protocol
- 17.4.5. Installation Type
- 17.4.6. Rated Power
- 17.4.7. Substation Type
- 17.4.8. Connection Type
- 17.4.9. Application
- 17.4.10. End-Use Industry
- 17.5. United Kingdom Digital Substation Market
- 17.5.1. Country Segmental Analysis
- 17.5.2. Voltage Level
- 17.5.3. Component
- 17.5.4. Communication Protocol
- 17.5.5. Installation Type
- 17.5.6. Rated Power
- 17.5.7. Substation Type
- 17.5.8. Connection Type
- 17.5.9. Application
- 17.5.10. End-Use Industry
- 17.6. France Digital Substation Market
- 17.6.1. Country Segmental Analysis
- 17.6.2. Voltage Level
- 17.6.3. Component
- 17.6.4. Communication Protocol
- 17.6.5. Installation Type
- 17.6.6. Rated Power
- 17.6.7. Substation Type
- 17.6.8. Connection Type
- 17.6.9. Application
- 17.6.10. End-Use Industry
- 17.7. Italy Digital Substation Market
- 17.7.1. Country Segmental Analysis
- 17.7.2. Voltage Level
- 17.7.3. Component
- 17.7.4. Communication Protocol
- 17.7.5. Installation Type
- 17.7.6. Rated Power
- 17.7.7. Substation Type
- 17.7.8. Connection Type
- 17.7.9. Application
- 17.7.10. End-Use Industry
- 17.8. Spain Digital Substation Market
- 17.8.1. Country Segmental Analysis
- 17.8.2. Voltage Level
- 17.8.3. Component
- 17.8.4. Communication Protocol
- 17.8.5. Installation Type
- 17.8.6. Rated Power
- 17.8.7. Substation Type
- 17.8.8. Connection Type
- 17.8.9. Application
- 17.8.10. End-Use Industry
- 17.9. Netherlands Digital Substation Market
- 17.9.1. Country Segmental Analysis
- 17.9.2. Voltage Level
- 17.9.3. Component
- 17.9.4. Communication Protocol
- 17.9.5. Installation Type
- 17.9.6. Rated Power
- 17.9.7. Substation Type
- 17.9.8. Connection Type
- 17.9.9. Application
- 17.9.10. End-Use Industry
- 17.10. Nordic Countries Digital Substation Market
- 17.10.1. Country Segmental Analysis
- 17.10.2. Voltage Level
- 17.10.3. Component
- 17.10.4. Communication Protocol
- 17.10.5. Installation Type
- 17.10.6. Rated Power
- 17.10.7. Substation Type
- 17.10.8. Connection Type
- 17.10.9. Application
- 17.10.10. End-Use Industry
- 17.11. Poland Digital Substation Market
- 17.11.1. Country Segmental Analysis
- 17.11.2. Voltage Level
- 17.11.3. Component
- 17.11.4. Communication Protocol
- 17.11.5. Installation Type
- 17.11.6. Rated Power
- 17.11.7. Substation Type
- 17.11.8. Connection Type
- 17.11.9. Application
- 17.11.10. End-Use Industry
- 17.12. Russia & CIS Digital Substation Market
- 17.12.1. Country Segmental Analysis
- 17.12.2. Voltage Level
- 17.12.3. Component
- 17.12.4. Communication Protocol
- 17.12.5. Installation Type
- 17.12.6. Rated Power
- 17.12.7. Substation Type
- 17.12.8. Connection Type
- 17.12.9. Application
- 17.12.10. End-Use Industry
- 17.13. Rest of Europe Digital Substation Market
- 17.13.1. Country Segmental Analysis
- 17.13.2. Voltage Level
- 17.13.3. Component
- 17.13.4. Communication Protocol
- 17.13.5. Installation Type
- 17.13.6. Rated Power
- 17.13.7. Substation Type
- 17.13.8. Connection Type
- 17.13.9. Application
- 17.13.10. End-Use Industry
- 18. Asia Pacific Digital Substation Market Analysis
- 18.1. Key Segment Analysis
- 18.2. Regional Snapshot
- 18.3. Asia Pacific Digital Substation Market Size (Volume – Thousand Units and Value – US$ Bn), Analysis, and Forecasts, 2021-2035
- 18.3.1. Voltage Level
- 18.3.2. Component
- 18.3.3. Communication Protocol
- 18.3.4. Installation Type
- 18.3.5. Rated Power
- 18.3.6. Substation Type
- 18.3.7. Connection Type
- 18.3.8. Application
- 18.3.9. End-Use Industry
- 18.3.10. Country
- 18.3.10.1. China
- 18.3.10.2. India
- 18.3.10.3. Japan
- 18.3.10.4. South Korea
- 18.3.10.5. Australia and New Zealand
- 18.3.10.6. Indonesia
- 18.3.10.7. Malaysia
- 18.3.10.8. Thailand
- 18.3.10.9. Vietnam
- 18.3.10.10. Rest of Asia Pacific
- 18.4. China Digital Substation Market
- 18.4.1. Country Segmental Analysis
- 18.4.2. Voltage Level
- 18.4.3. Component
- 18.4.4. Communication Protocol
- 18.4.5. Installation Type
- 18.4.6. Rated Power
- 18.4.7. Substation Type
- 18.4.8. Connection Type
- 18.4.9. Application
- 18.4.10. End-Use Industry
- 18.5. India Digital Substation Market
- 18.5.1. Country Segmental Analysis
- 18.5.2. Voltage Level
- 18.5.3. Component
- 18.5.4. Communication Protocol
- 18.5.5. Installation Type
- 18.5.6. Rated Power
- 18.5.7. Substation Type
- 18.5.8. Connection Type
- 18.5.9. Application
- 18.5.10. End-Use Industry
- 18.6. Japan Digital Substation Market
- 18.6.1. Country Segmental Analysis
- 18.6.2. Voltage Level
- 18.6.3. Component
- 18.6.4. Communication Protocol
- 18.6.5. Installation Type
- 18.6.6. Rated Power
- 18.6.7. Substation Type
- 18.6.8. Connection Type
- 18.6.9. Application
- 18.6.10. End-Use Industry
- 18.7. South Korea Digital Substation Market
- 18.7.1. Country Segmental Analysis
- 18.7.2. Voltage Level
- 18.7.3. Component
- 18.7.4. Communication Protocol
- 18.7.5. Installation Type
- 18.7.6. Rated Power
- 18.7.7. Substation Type
- 18.7.8. Connection Type
- 18.7.9. Application
- 18.7.10. End-Use Industry
- 18.8. Australia and New Zealand Digital Substation Market
- 18.8.1. Country Segmental Analysis
- 18.8.2. Voltage Level
- 18.8.3. Component
- 18.8.4. Communication Protocol
- 18.8.5. Installation Type
- 18.8.6. Rated Power
- 18.8.7. Substation Type
- 18.8.8. Connection Type
- 18.8.9. Application
- 18.8.10. End-Use Industry
- 18.9. Indonesia Digital Substation Market
- 18.9.1. Country Segmental Analysis
- 18.9.2. Voltage Level
- 18.9.3. Component
- 18.9.4. Communication Protocol
- 18.9.5. Installation Type
- 18.9.6. Rated Power
- 18.9.7. Substation Type
- 18.9.8. Connection Type
- 18.9.9. Application
- 18.9.10. End-Use Industry
- 18.10. Malaysia Digital Substation Market
- 18.10.1. Country Segmental Analysis
- 18.10.2. Voltage Level
- 18.10.3. Component
- 18.10.4. Communication Protocol
- 18.10.5. Installation Type
- 18.10.6. Rated Power
- 18.10.7. Substation Type
- 18.10.8. Connection Type
- 18.10.9. Application
- 18.10.10. End-Use Industry
- 18.11. Thailand Digital Substation Market
- 18.11.1. Country Segmental Analysis
- 18.11.2. Voltage Level
- 18.11.3. Component
- 18.11.4. Communication Protocol
- 18.11.5. Installation Type
- 18.11.6. Rated Power
- 18.11.7. Substation Type
- 18.11.8. Connection Type
- 18.11.9. Application
- 18.11.10. End-Use Industry
- 18.12. Vietnam Digital Substation Market
- 18.12.1. Country Segmental Analysis
- 18.12.2. Voltage Level
- 18.12.3. Component
- 18.12.4. Communication Protocol
- 18.12.5. Installation Type
- 18.12.6. Rated Power
- 18.12.7. Substation Type
- 18.12.8. Connection Type
- 18.12.9. Application
- 18.12.10. End-Use Industry
- 18.13. Rest of Asia Pacific Digital Substation Market
- 18.13.1. Country Segmental Analysis
- 18.13.2. Voltage Level
- 18.13.3. Component
- 18.13.4. Communication Protocol
- 18.13.5. Installation Type
- 18.13.6. Rated Power
- 18.13.7. Substation Type
- 18.13.8. Connection Type
- 18.13.9. Application
- 18.13.10. End-Use Industry
- 19. Middle East Digital Substation Market Analysis
- 19.1. Key Segment Analysis
- 19.2. Regional Snapshot
- 19.3. Middle East Digital Substation Market Size (Volume – Thousand Units and Value – US$ Bn), Analysis, and Forecasts, 2021-2035
- 19.3.1. Voltage Level
- 19.3.2. Component
- 19.3.3. Communication Protocol
- 19.3.4. Installation Type
- 19.3.5. Rated Power
- 19.3.6. Substation Type
- 19.3.7. Connection Type
- 19.3.8. Application
- 19.3.9. End-Use Industry
- 19.3.10. Country
- 19.3.10.1. Turkey
- 19.3.10.2. UAE
- 19.3.10.3. Saudi Arabia
- 19.3.10.4. Israel
- 19.3.10.5. Rest of Middle East
- 19.4. Turkey Digital Substation Market
- 19.4.1. Country Segmental Analysis
- 19.4.2. Voltage Level
- 19.4.3. Component
- 19.4.4. Communication Protocol
- 19.4.5. Installation Type
- 19.4.6. Rated Power
- 19.4.7. Substation Type
- 19.4.8. Connection Type
- 19.4.9. Application
- 19.4.10. End-Use Industry
- 19.5. UAE Digital Substation Market
- 19.5.1. Country Segmental Analysis
- 19.5.2. Voltage Level
- 19.5.3. Component
- 19.5.4. Communication Protocol
- 19.5.5. Installation Type
- 19.5.6. Rated Power
- 19.5.7. Substation Type
- 19.5.8. Connection Type
- 19.5.9. Application
- 19.5.10. End-Use Industry
- 19.6. Saudi Arabia Digital Substation Market
- 19.6.1. Country Segmental Analysis
- 19.6.2. Voltage Level
- 19.6.3. Component
- 19.6.4. Communication Protocol
- 19.6.5. Installation Type
- 19.6.6. Rated Power
- 19.6.7. Substation Type
- 19.6.8. Connection Type
- 19.6.9. Application
- 19.6.10. End-Use Industry
- 19.7. Israel Digital Substation Market
- 19.7.1. Country Segmental Analysis
- 19.7.2. Voltage Level
- 19.7.3. Component
- 19.7.4. Communication Protocol
- 19.7.5. Installation Type
- 19.7.6. Rated Power
- 19.7.7. Substation Type
- 19.7.8. Connection Type
- 19.7.9. Application
- 19.7.10. End-Use Industry
- 19.8. Rest of Middle East Digital Substation Market
- 19.8.1. Country Segmental Analysis
- 19.8.2. Voltage Level
- 19.8.3. Component
- 19.8.4. Communication Protocol
- 19.8.5. Installation Type
- 19.8.6. Rated Power
- 19.8.7. Substation Type
- 19.8.8. Connection Type
- 19.8.9. Application
- 19.8.10. End-Use Industry
- 20. Africa Digital Substation Market Analysis
- 20.1. Key Segment Analysis
- 20.2. Regional Snapshot
- 20.3. Africa Digital Substation Market Size (Volume – Thousand Units and Value – US$ Bn), Analysis, and Forecasts, 2021-2035
- 20.3.1. Voltage Level
- 20.3.2. Component
- 20.3.3. Communication Protocol
- 20.3.4. Installation Type
- 20.3.5. Rated Power
- 20.3.6. Substation Type
- 20.3.7. Connection Type
- 20.3.8. Application
- 20.3.9. End-Use Industry
- 20.3.10. Country
- 20.3.10.1. South Africa
- 20.3.10.2. Egypt
- 20.3.10.3. Nigeria
- 20.3.10.4. Algeria
- 20.3.10.5. Rest of Africa
- 20.4. South Africa Digital Substation Market
- 20.4.1. Country Segmental Analysis
- 20.4.2. Voltage Level
- 20.4.3. Component
- 20.4.4. Communication Protocol
- 20.4.5. Installation Type
- 20.4.6. Rated Power
- 20.4.7. Substation Type
- 20.4.8. Connection Type
- 20.4.9. Application
- 20.4.10. End-Use Industry
- 20.5. Egypt Digital Substation Market
- 20.5.1. Country Segmental Analysis
- 20.5.2. Voltage Level
- 20.5.3. Component
- 20.5.4. Communication Protocol
- 20.5.5. Installation Type
- 20.5.6. Rated Power
- 20.5.7. Substation Type
- 20.5.8. Connection Type
- 20.5.9. Application
- 20.5.10. End-Use Industry
- 20.6. Nigeria Digital Substation Market
- 20.6.1. Country Segmental Analysis
- 20.6.2. Voltage Level
- 20.6.3. Component
- 20.6.4. Communication Protocol
- 20.6.5. Installation Type
- 20.6.6. Rated Power
- 20.6.7. Substation Type
- 20.6.8. Connection Type
- 20.6.9. Application
- 20.6.10. End-Use Industry
- 20.7. Algeria Digital Substation Market
- 20.7.1. Country Segmental Analysis
- 20.7.2. Voltage Level
- 20.7.3. Component
- 20.7.4. Communication Protocol
- 20.7.5. Installation Type
- 20.7.6. Rated Power
- 20.7.7. Substation Type
- 20.7.8. Connection Type
- 20.7.9. Application
- 20.7.10. End-Use Industry
- 20.8. Rest of Africa Digital Substation Market
- 20.8.1. Country Segmental Analysis
- 20.8.2. Voltage Level
- 20.8.3. Component
- 20.8.4. Communication Protocol
- 20.8.5. Installation Type
- 20.8.6. Rated Power
- 20.8.7. Substation Type
- 20.8.8. Connection Type
- 20.8.9. Application
- 20.8.10. End-Use Industry
- 21. South America Digital Substation Market Analysis
- 21.1. Key Segment Analysis
- 21.2. Regional Snapshot
- 21.3. South America Digital Substation Market Size (Volume – Thousand Units and Value – US$ Bn), Analysis, and Forecasts, 2021-2035
- 21.3.1. Voltage Level
- 21.3.2. Component
- 21.3.3. Communication Protocol
- 21.3.4. Installation Type
- 21.3.5. Rated Power
- 21.3.6. Substation Type
- 21.3.7. Connection Type
- 21.3.8. Application
- 21.3.9. End-Use Industry
- 21.3.10. Country
- 21.3.10.1. Brazil
- 21.3.10.2. Argentina
- 21.3.10.3. Rest of South America
- 21.4. Brazil Digital Substation Market
- 21.4.1. Country Segmental Analysis
- 21.4.2. Voltage Level
- 21.4.3. Component
- 21.4.4. Communication Protocol
- 21.4.5. Installation Type
- 21.4.6. Rated Power
- 21.4.7. Substation Type
- 21.4.8. Connection Type
- 21.4.9. Application
- 21.4.10. End-Use Industry
- 21.5. Argentina Digital Substation Market
- 21.5.1. Country Segmental Analysis
- 21.5.2. Voltage Level
- 21.5.3. Component
- 21.5.4. Communication Protocol
- 21.5.5. Installation Type
- 21.5.6. Rated Power
- 21.5.7. Substation Type
- 21.5.8. Connection Type
- 21.5.9. Application
- 21.5.10. End-Use Industry
- 21.6. Rest of South America Digital Substation Market
- 21.6.1. Country Segmental Analysis
- 21.6.2. Voltage Level
- 21.6.3. Component
- 21.6.4. Communication Protocol
- 21.6.5. Installation Type
- 21.6.6. Rated Power
- 21.6.7. Substation Type
- 21.6.8. Connection Type
- 21.6.9. Application
- 21.6.10. End-Use Industry
- 22. Key Players/ Company Profile
- 22.1. ABB Ltd.
- 22.1.1. Company Details/ Overview
- 22.1.2. Company Financials
- 22.1.3. Key Customers and Competitors
- 22.1.4. Business/ Industry Portfolio
- 22.1.5. Product Portfolio/ Specification Details
- 22.1.6. Pricing Data
- 22.1.7. Strategic Overview
- 22.1.8. Recent Developments
- 22.2. CG Power and Industrial Solutions Limited
- 22.3. Cisco Systems Inc.
- 22.4. Crompton Greaves Consumer Electricals Limited
- 22.5. Eaton Corporation
- 22.6. Emerson Electric Co.
- 22.7. General Electric Company
- 22.8. Hitachi Energy Ltd.
- 22.9. Honeywell International Inc.
- 22.10. Hyosung Heavy Industries
- 22.11. Ingeteam Power Technology
- 22.12. Larsen & Toubro Limited
- 22.13. Lucy Electric
- 22.14. Mitsubishi Electric Corporation
- 22.15. NR Electric Co., Ltd.
- 22.16. Schneider Electric SE
- 22.17. Schweitzer Engineering Laboratories (SEL)
- 22.18. Siemens AG
- 22.19. Tebian Electric Apparatus Stock Co., Ltd. (TBEA)
- 22.20. Toshiba Corporation
- 22.21. Troax Group AB
- 22.22. XJ Group Corporation
- 22.23. Other Key Players
- 22.1. ABB Ltd.
Note* - This is just tentative list of players. While providing the report, we will cover more number of players based on their revenue and share for each geography
Research Design
Our research design integrates both demand-side and supply-side analysis through a balanced combination of primary and secondary research methodologies. By utilizing both bottom-up and top-down approaches alongside rigorous data triangulation methods, we deliver robust market intelligence that supports strategic decision-making.
MarketGenics' comprehensive research design framework ensures the delivery of accurate, reliable, and actionable market intelligence. Through the integration of multiple research approaches, rigorous validation processes, and expert analysis, we provide our clients with the insights needed to make informed strategic decisions and capitalize on market opportunities.

MarketGenics leverages a dedicated industry panel of experts and a comprehensive suite of paid databases to effectively collect, consolidate, and analyze market intelligence.
Our approach has consistently proven to be reliable and effective in generating accurate market insights, identifying key industry trends, and uncovering emerging business opportunities.
Through both primary and secondary research, we capture and analyze critical company-level data such as manufacturing footprints, including technical centers, R&D facilities, sales offices, and headquarters.
Our expert panel further enhances our ability to estimate market size for specific brands based on validated field-level intelligence.
Our data mining techniques incorporate both parametric and non-parametric methods, allowing for structured data collection, sorting, processing, and cleaning.
Demand projections are derived from large-scale data sets analyzed through proprietary algorithms, culminating in robust and reliable market sizing.
Research Approach
The bottom-up approach builds market estimates by starting with the smallest addressable market units and systematically aggregating them to create comprehensive market size projections.
This method begins with specific, granular data points and builds upward to create the complete market landscape.
Customer Analysis → Segmental Analysis → Geographical Analysis
The top-down approach starts with the broadest possible market data and systematically narrows it down through a series of filters and assumptions to arrive at specific market segments or opportunities.
This method begins with the big picture and works downward to increasingly specific market slices.
TAM → SAM → SOM


Research Methods
Desk / Secondary Research
While analysing the market, we extensively study secondary sources, directories, and databases to identify and collect information useful for this technical, market-oriented, and commercial report. Secondary sources that we utilize are not only the public sources, but it is a combination of Open Source, Associations, Paid Databases, MG Repository & Knowledgebase, and others.
- Company websites, annual reports, financial reports, broker reports, and investor presentations
- National government documents, statistical databases and reports
- News articles, press releases and web-casts specific to the companies operating in the market, Magazines, reports, and others
- We gather information from commercial data sources for deriving company specific data such as segmental revenue, share for geography, product revenue, and others
- Internal and external proprietary databases (industry-specific), relevant patent, and regulatory databases
- Governing Bodies, Government Organizations
- Relevant Authorities, Country-specific Associations for Industries
We also employ the model mapping approach to estimate the product level market data through the players' product portfolio
Primary Research
Primary research/ interviews is vital in analyzing the market. Most of the cases involves paid primary interviews. Primary sources include primary interviews through e-mail interactions, telephonic interviews, surveys as well as face-to-face interviews with the different stakeholders across the value chain including several industry experts.
| Type of Respondents | Number of Primaries |
|---|---|
| Tier 2/3 Suppliers | ~20 |
| Tier 1 Suppliers | ~25 |
| End-users | ~25 |
| Industry Expert/ Panel/ Consultant | ~30 |
| Total | ~100 |
MG Knowledgebase
• Repository of industry blog, newsletter and case studies
• Online platform covering detailed market reports, and company profiles
Forecasting Factors and Models
Forecasting Factors
- Historical Trends – Past market patterns, cycles, and major events that shaped how markets behave over time. Understanding past trends helps predict future behavior.
- Industry Factors – Specific characteristics of the industry like structure, regulations, and innovation cycles that affect market dynamics.
- Macroeconomic Factors – Economic conditions like GDP growth, inflation, and employment rates that affect how much money people have to spend.
- Demographic Factors – Population characteristics like age, income, and location that determine who can buy your product.
- Technology Factors – How quickly people adopt new technology and how much technology infrastructure exists.
- Regulatory Factors – Government rules, laws, and policies that can help or restrict market growth.
- Competitive Factors – Analyzing competition structure such as degree of competition and bargaining power of buyers and suppliers.
Forecasting Models / Techniques
Multiple Regression Analysis
- Identify and quantify factors that drive market changes
- Statistical modeling to establish relationships between market drivers and outcomes
Time Series Analysis – Seasonal Patterns
- Understand regular cyclical patterns in market demand
- Advanced statistical techniques to separate trend, seasonal, and irregular components
Time Series Analysis – Trend Analysis
- Identify underlying market growth patterns and momentum
- Statistical analysis of historical data to project future trends
Expert Opinion – Expert Interviews
- Gather deep industry insights and contextual understanding
- In-depth interviews with key industry stakeholders
Multi-Scenario Development
- Prepare for uncertainty by modeling different possible futures
- Creating optimistic, pessimistic, and most likely scenarios
Time Series Analysis – Moving Averages
- Sophisticated forecasting for complex time series data
- Auto-regressive integrated moving average models with seasonal components
Econometric Models
- Apply economic theory to market forecasting
- Sophisticated economic models that account for market interactions
Expert Opinion – Delphi Method
- Harness collective wisdom of industry experts
- Structured, multi-round expert consultation process
Monte Carlo Simulation
- Quantify uncertainty and probability distributions
- Thousands of simulations with varying input parameters
Research Analysis
Our research framework is built upon the fundamental principle of validating market intelligence from both demand and supply perspectives. This dual-sided approach ensures comprehensive market understanding and reduces the risk of single-source bias.
Demand-Side Analysis: We understand end-user/application behavior, preferences, and market needs along with the penetration of the product for specific application.
Supply-Side Analysis: We estimate overall market revenue, analyze the segmental share along with industry capacity, competitive landscape, and market structure.
Validation & Evaluation
Data triangulation is a validation technique that uses multiple methods, sources, or perspectives to examine the same research question, thereby increasing the credibility and reliability of research findings. In market research, triangulation serves as a quality assurance mechanism that helps identify and minimize bias, validate assumptions, and ensure accuracy in market estimates.
- Data Source Triangulation – Using multiple data sources to examine the same phenomenon
- Methodological Triangulation – Using multiple research methods to study the same research question
- Investigator Triangulation – Using multiple researchers or analysts to examine the same data
- Theoretical Triangulation – Using multiple theoretical perspectives to interpret the same data

Custom Market Research Services
We will customise the research for you, in case the report listed above does not meet your requirements.
Get 10% Free Customisation