Digital Twin for Manufacturing Market Size, Share & Trends Analysis Report by Component (Software, Services), Technology, Application, Deployment Mode, Enterprise Size, Manufacturing Type, Connectivity Type, Data Source, Integration Level, Complexity Level, Update Frequency, Rated Capacity (Production Volume), End-users and Geography (North America, Europe, Asia Pacific, Middle East, Africa, and South America) – Global Industry Data, Trends, and Forecasts, 2026–2035
|
|
|
Segmental Data Insights |
|
|
Demand Trends |
|
|
Competitive Landscape |
|
|
Strategic Development |
|
|
Future Outlook & Opportunities |
|
Digital Twin for Manufacturing Market Size, Share, and Growth
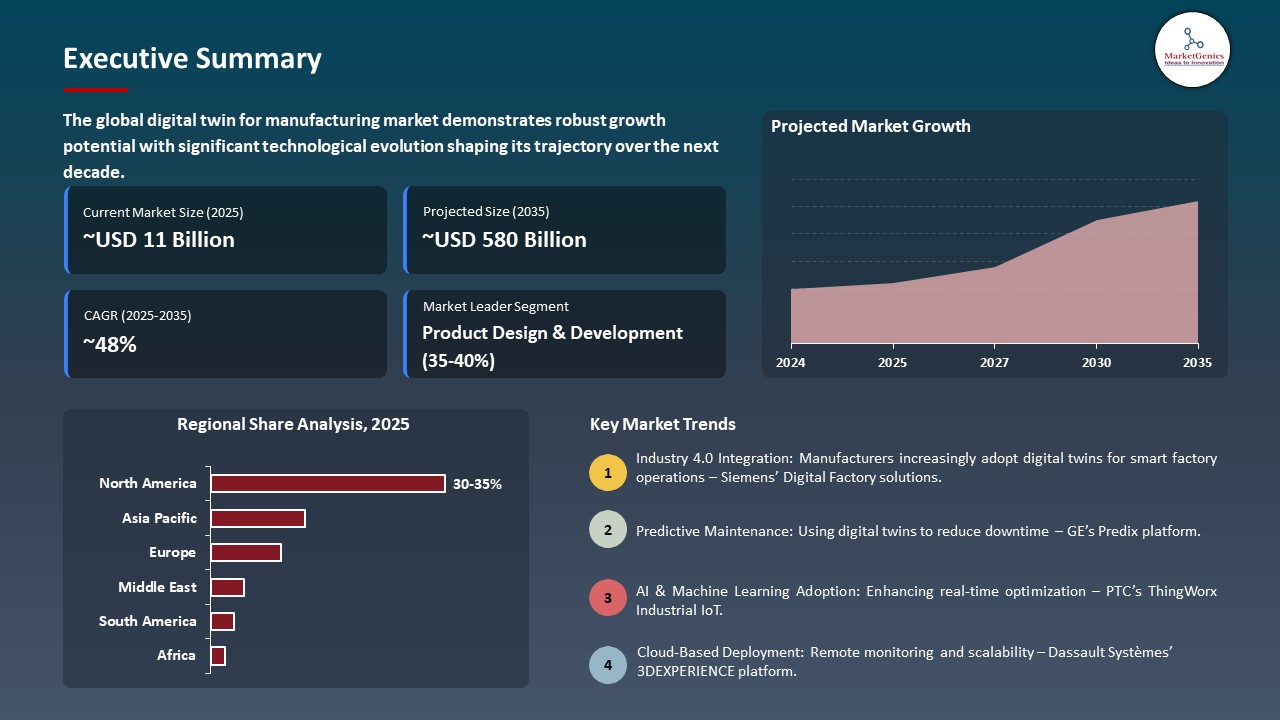
The global digital twin for manufacturing market is witnessing strong growth, valued at USD 11.2 billion in 2025 and projected to reach USD 580.2 billion by 2035, expanding at a CAGR of 48.4% during the forecast period. Asia Pacific is the fastest-growing region in the digital twin for manufacturing market due to rapid industrialization, increasing automation adoption, and supportive government initiatives driving digital transformation.
Sébastien Joly, Manufacturing Industries Sector Strategy Director at Dassault Systèmes, said, “Our virtual twin experiences are catalysts for transformation. By combining modeling, simulation, data-science & AI-generated content, they enable us to drive unprecedented advancements in design, engineering, manufacturing and beyond. With virtual twins, we are redefining what's possible, setting new standards for industry and shaping the future of technology”.
The increasing demand of real-time visibility in multi-site manufacturing processes is fueling the digital twin for manufacturing market where manufacturers are demanding the ability to monitor production lines, equipment operation, and supply chain operations in real-time and across multiple locations. Digital twins will facilitate centralized monitoring, predictive maintenance, and real-time decision-making, minimizing downtime, maximizing resource utilization, and making operations more efficient and also facilitating global cooperation and providing a standardized quality across all plants.
Digital twin for manufacturing market partnerships enhance growth through innovation, real-time data sharing, and faster digital twin implementation across the complex industries. An example is the collaboration between NVIDIA and Foxconn in 2025 of factory digital twins based on Omniverse at a Foxconn plant in Houston. The alliance enables simulation and optimization as well as AI-based robotics integration of large-scale production, and this cross-industrial collaboration enhances smart factory versatility and productivity in manufacturing in North America.
AI and predictive analytics integration are also a major opportunity of the digital twin for manufacturing market, with the integration of digital twins with AI allowing real-time monitoring, predictive maintenance, and control of quality. The data-driven insights, anomaly detection, and automated decision-making will help manufacturers to optimize operations, minimize downtime, and improve resource efficiency by applying their capabilities across production lines and supply chains. To stay relevant, an example is SAS introduced AI-driven digital twin solutions on Unreal Engine in 2025, which allowed manufacturers to simulate and optimize the production strategies in realistic virtual environments and improve operational efficiency, reduce risks, and process planning.
Digital Twin for Manufacturing Market Dynamics and Trends
Driver: Rising Digital Twin Adoption in Automotive & Electronics Manufacturing
-
Rising use of digital twin in automotive and electronics production is a high-potential growth driver of the digital twin for manufacturing market since these industries require perfection to the extreme, rapid innovation rates and high production throughput.
- The automotive and electronics industries are increasingly adopting the use of digital twins to virtually design products, simulate production lines, test automation systems, and validate performance prior to physical deployment. This assists in cutting expensive prototyping, minimizing defects, enhancing first-time-right manufacturing and shortening time-to-market.
- In its iFACTORY strategy, BMW is industrializing its Virtual Factory with digital twins in 30+ production locations worldwide in 2025. The platform provides real-time simulation of layouts, robotics, logistics and manual operations with the help of NVIDIA Omniverse. Automated virtual checks of collisions now take BMW 3 days rather than 4 weeks and the project is set to result in up to 30 percent of cost cuts in production planning, which strongly favors the growing use of digital twins in manufacturing automobiles.
- The rapid expansion of EVs, semiconductors, electronics, and interconnected devices is intensifying the need for real-time simulation, flexible manufacturing, and continuous optimization to remain competitive.
Restraint: Integration Challenges with Legacy Infrastructure Restrain Market Growth
-
Complexity in connecting digital twins with existing manufacturing systems is also a key bottleneck to the digital twin for manufacturing market since much of the current manufacturing infrastructure is old and is powered by proprietary equipment, with a fragmented software ecosystem and a lack of integration.
- Legacy systems like PLCs, SCADA, MES and ERP are typically not providing standard data formats, real-time connections, and it can be challenging and time-intensive to have seamless data integration. Substandard data quality, absence of interoperability among vendors, and unavailable sensors also contribute to the development of precise and real-time digital twins. This results in increased cost of implementation, lengthy deployment schedules and reliance on system integrators. These challenges may slow down adoption or limit twins to pilot projects only in small and mid-sized manufacturers.
- Interconnecting legacy machines with the digital twin platform presents more vulnerability to cyber-attacks and operational interference, as the older hardware was never intended to be integrated with current security policies. This causes data integrity, production safety, and unplanned down time during the integration and testing.
- The complexity of integration is another important technical and financial obstacle to the large-scale implementation of digital twins.
Opportunity: Growing Adoption of Cloud-Based and SaaS Digital Twin Platforms
-
Growing Adoption of cloud based and SaaS digital twin solutions is a big opportunity to the digital twin for manufacturing market since these solutions reduce the barrier to entry of the digital twin to both small and large manufacturers.
- Cloud and SaaS solutions do not require the heavy on-premise infrastructure, minimize initial costs, and can be deployed quickly across multiple locations. They also support real-time data gathering, centralized analytics and remote-controlled observation, which boosts scalability and cooperation in the international business.
- Also, subscription models enable small and medium enterprises to obtain high-tech simulation and predictive maintenance without extensive capital investment. Cloud-based digital twins are becoming more appealing to manufacturers who need rapid adoption and unceasing innovation due to their flexibility, scalability, and affordability.
- HCLTech, together with AWS, debuted in 2025, MetaTwin, a cloud-based digital twin solution, which unites real-time IoT data, immersive XR visualization, and AI-based virtual assistants. It allows the manufacturers to replicate operations and optimize processes, perform virtual training, and make data-driven decisions, proving the increasing popularity of cloud-based and SaaS digital twin solutions.
- The adoption of a digital twin technology in manufacturing industries is expanding, accelerating, and becoming cost-effective, due to cloud-based and SaaS digital twin platforms.
Key Trend: Next-Generation Digital Twins Powered by XR and Immersive Visualization
-
XR/Immersive Visualization is becoming an important trend in the digital twin for manufacturing market, with manufacturers adopting extended reality (AR, VR, and MR) in relation to digital twins.
- XR allows virtually viewing production lines, equipment, and operational processes in a 3D, interactive environment that allows engineers and operators to replace the physical factory walkthrough, training, and simulations without interfering with the actual operation. This improves the capacity of workforce, minimizes errors, and speed of making decisions by furnishing real time, spatially precise information about complicated manufacturing areas.
- Businesses are able to test new layouts, streamline processes and test safety measures virtually, which helps minimize downtime and operational expenses considerably. Remote collaboration among plants on a global scale is also a trend underpinning XR-based digital twins, and it is an essential source of smart, connected, and efficient manufacturing.
- Siemens introduced Teamcenter Digital Reality Viewer, the NVIDIA Omniverse-integrated system to offer engineers and manufacturers with photo-realistic and physics-based digital twins in 2025. The platform provides real-time visualization, immersive interaction, and secure collaboration throughout the product lifecycle, eliminating the need to rely on physical prototypes, improving time-to-market, and enhancing design and production decision-making.
- XR and immersive visualization are transforming the manufacturing sector's usage of digital twins, improving safety, speed, and cost-effectiveness in operations design and training.
Digital-Twin-for-Manufacturing-Market Analysis and Segmental Data
Product Design & Development Dominate Global Digital Twin for Manufacturing Market
-
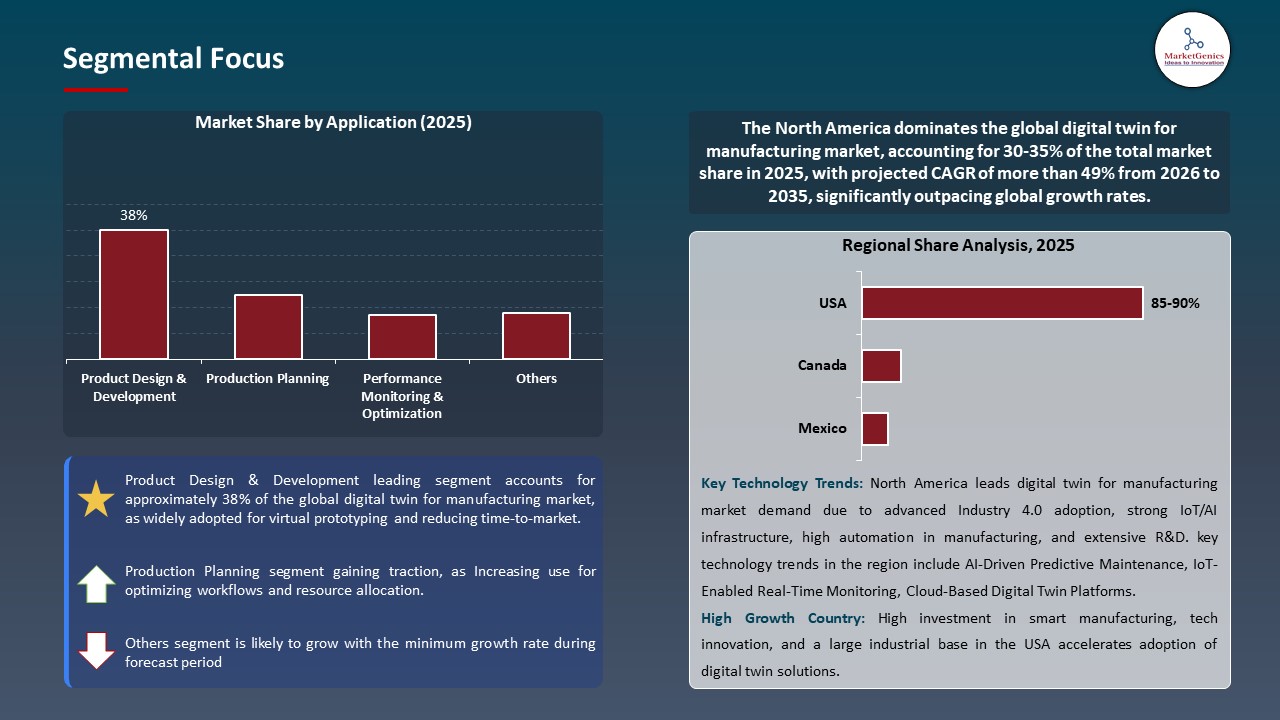
Product design & development dominates global digital twin for manufacturing market as the leading segment, driven by manufacturers’ need to accelerate innovation, reduce design errors, and optimize product performance before physical production.
- Digital twins enable engineers to develop virtual prototypes, model real-world conditions, and test various design alternatives in a cost-effective and short time. This ability eliminates the need to use costly physical prototypes, minimizes the development time and provides first-time-right manufacturing.
- The increased complexity of products in automotive, electronics, and industrial machinery is a further reinforcement of this segment as manufacturers are increasingly using digital twins to validate designs, integrate both IoT and sensor data, and interact with teams around the globe.
- JetZero collaborated with Siemens to use the Xcelerator platform and digital twins to design and simulate its blended-wing aircraft and Factory of the Future. The virtual simulations also helped the company to de-risk manufacturing, eliminate design testing, and run manufacturing processes before actual construction.
- Digital twin adoption therefore continues to be a core application and growth driver via product design and development.
North America Leads Global Digital Twin for Manufacturing Market Demand
-
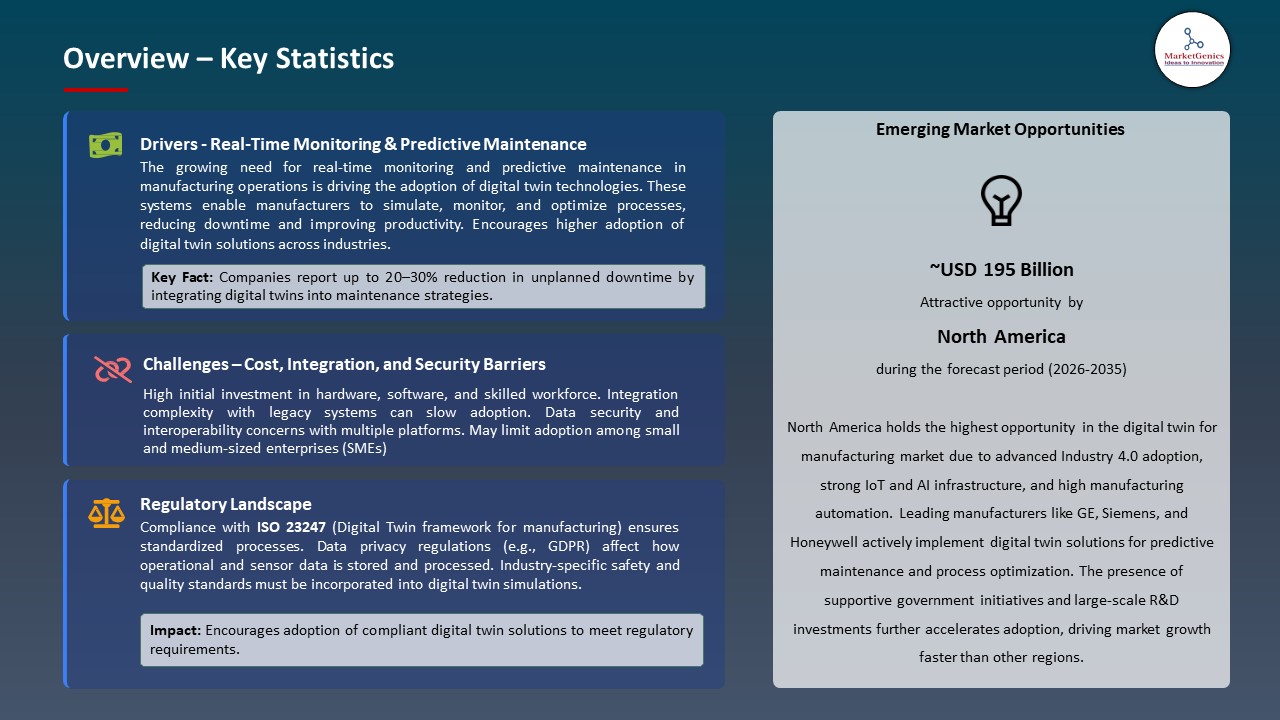
North America leads global digital twin for manufacturing market demand due to its well-established industrial base, rapid adoption of advanced manufacturing technologies, and strong presence of key digital twin solution providers. The region’s focus on Industry 4.0, smart factories, and predictive maintenance drives demand for digital twin platforms across automotive, aerospace, electronics, and heavy machinery sectors.
- Investments in cloud-based solutions, IoT integration, and immersive XR visualization can further speed up the adoption process by providing real-time monitoring, simulation, and optimization of the processes. Also, there are proactive governmental policies and robust research and development in the U.S. and Canada, which promote the early adoption of technologies of the digital twin.
- In 2025, manufacturers such as Caterpillar, Lucid Motors, Toyota, and Foxconn in the United States used NVIDIA Omniverse and Siemens Xcelerator digital twins to simulate factory scale, predictive maintenance, robotics controlled by AI, and optimization of supply chains. Foxconn digitized its plant in Houston, and Toyota and Lucid optimized their activities virtually, which indicates the leadership of North America and high demand of smart manufacturing with advanced digital twins.
- These efforts highlight the role of North America as the most dominant region in manufacturing with a desire to use digital twins.
Digital-Twin-for-Manufacturing-Market Ecosystem
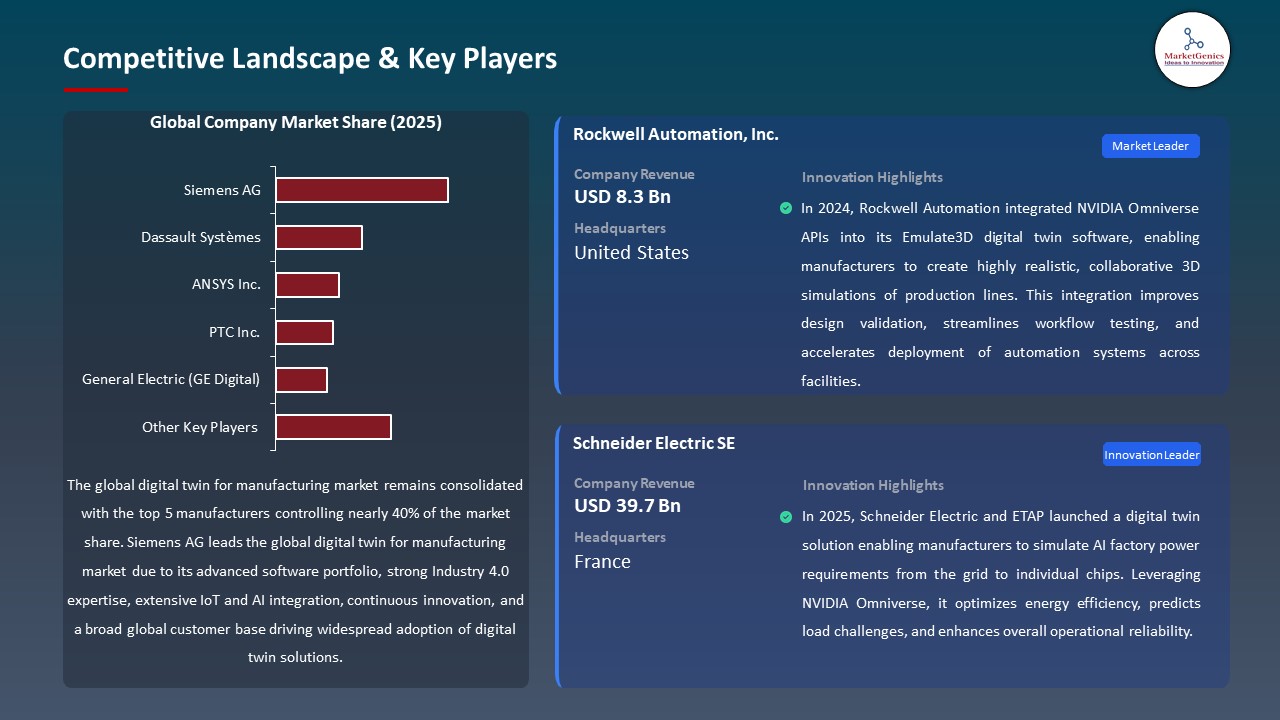
The global Digital Twin for Manufacturing Market is highly consolidated, with major players including Siemens AG, Dassault Systèmes, ANSYS Inc., PTC Inc., and General Electric (GE Digital) dominating the landscape. The companies are leading with end-to-end digital twin and industrial automation systems, extensive global distribution networks and integrated solutions that integrate IIoT, AI-driven analytics, simulation software, and robotics to create a streamlined operational process, minimise downtime, and maximise production.
The market value chain includes software and platform development, integration of IIoT devices, cloud and edge computing infrastructure, system implementation, employee training, and after-deployment services, e.g. predictive maintenance, performance monitoring, and lifecycle analytics.
Barriers to entry remain high because of secure, scalable, and technologically advanced digital twin solutions and established relationships with customers. There is a persistent lack of innovations in AI, digital twin modeling, XR visualization, edge computing, and cloud-enabled manufacturing solutions in automotive, aerospace, electronics, and heavy machinery markets that are driving the market.
Recent Development and Strategic Overview:
-
In February 2025, Peaxy rolled out its industry-first Hydrogen Digital Twin with a client in the Fortune 200 segment, which allowed simulation and optimization of integrated renewable hydrogen plants. The solution offered system holistic modeling throughout the hydrogen value chain enabling clients to optimize their plants design, improve their operations, and shorten the project implementation. The major characteristics were 3D dynamic plant layouts, physics-based simulation, and real-time KPIs, including Levelized Cost of Hydrogen (LCOH).
- In March 2025, Ericsson, Volvo Group India and Bharti Airtel collaborated to investigate Digital Twin and XR technologies across 5G Advanced. The partnership is aimed at immersive industrial metaverse solutions, real-time process optimization, and training employees in the factory and R&D center of Volvo in Bangalore. The initiative is powered by ultra-low latency 5G network of Airtel, providing support to real-time simulation, design prototyping, and virtual testing of scenario in what-if conditions, to boost operational efficiency, foster innovation, and accelerate the integration of Industry 4.0 in the Indian manufacturing industry.
Report Scope
|
Detail |
|
|
Market Size in 2025 |
USD 11.2 Bn |
|
Market Forecast Value in 2035 |
USD 580.2 Bn |
|
Growth Rate (CAGR) |
48.4% |
|
Forecast Period |
2026 – 2035 |
|
Historical Data Available for |
2021 – 2024 |
|
Market Size Units |
US$ Billion for Value |
|
Report Format |
Electronic (PDF) + Excel |
|
North America |
Europe |
Asia Pacific |
Middle East |
Africa |
South America |
|
|
|
|
|
|
|
Companies Covered |
|||||
|
|
|
|
|
|
Digital-Twin-for-Manufacturing-Market Segmentation and Highlights
|
Segment |
Sub-segment |
|
Digital Twin for Manufacturing Market, By Component |
|
|
Digital Twin for Manufacturing Market, By Technology |
|
|
Digital Twin for Manufacturing Market, By Application |
|
|
Digital Twin for Manufacturing Market, By Deployment Mode |
|
|
Digital Twin for Manufacturing Market, By Enterprise Size |
|
|
Digital Twin for Manufacturing Market, By Manufacturing Type |
|
|
Digital Twin for Manufacturing Market, By Connectivity Type |
|
|
Digital Twin for Manufacturing Market, By Data Source |
|
|
Digital Twin for Manufacturing Market, By Integration Level |
|
|
Digital Twin for Manufacturing Market, By Complexity Level |
|
|
Digital Twin for Manufacturing Market, By Update Frequency |
|
|
Digital Twin for Manufacturing Market, By Rated Capacity (Production Volume) |
|
|
Digital Twin for Manufacturing Market, By End-users |
|
Frequently Asked Questions
Table of Contents
- 1. Research Methodology and Assumptions
- 1.1. Definitions
- 1.2. Research Design and Approach
- 1.3. Data Collection Methods
- 1.4. Base Estimates and Calculations
- 1.5. Forecasting Models
- 1.5.1. Key Forecast Factors & Impact Analysis
- 1.6. Secondary Research
- 1.6.1. Open Sources
- 1.6.2. Paid Databases
- 1.6.3. Associations
- 1.7. Primary Research
- 1.7.1. Primary Sources
- 1.7.2. Primary Interviews with Stakeholders across Ecosystem
- 2. Executive Summary
- 2.1. Global Digital Twin for Manufacturing Market Outlook
- 2.1.1. Digital Twin for Manufacturing Market Size Value (US$ Bn), and Forecasts, 2021-2035
- 2.1.2. Compounded Annual Growth Rate Analysis
- 2.1.3. Growth Opportunity Analysis
- 2.1.4. Segmental Share Analysis
- 2.1.5. Geographical Share Analysis
- 2.2. Market Analysis and Facts
- 2.3. Supply-Demand Analysis
- 2.4. Competitive Benchmarking
- 2.5. Go-to- Market Strategy
- 2.5.1. Customer/ End-use Industry Assessment
- 2.5.2. Growth Opportunity Data, 2026-2035
- 2.5.2.1. Regional Data
- 2.5.2.2. Country Data
- 2.5.2.3. Segmental Data
- 2.5.3. Identification of Potential Market Spaces
- 2.5.4. GAP Analysis
- 2.5.5. Potential Attractive Price Points
- 2.5.6. Prevailing Market Risks & Challenges
- 2.5.7. Preferred Sales & Marketing Strategies
- 2.5.8. Key Recommendations and Analysis
- 2.5.9. A Way Forward
- 2.1. Global Digital Twin for Manufacturing Market Outlook
- 3. Industry Data and Premium Insights
- 3.1. Global Automation & Process Control Industry Overview, 2025
- 3.1.1. Automation & Process Control Industry Ecosystem Analysis
- 3.1.2. Key Trends for Automation & Process Control Industry
- 3.1.3. Regional Distribution for Automation & Process Control Industry
- 3.2. Supplier Customer Data
- 3.3. Technology Roadmap and Developments
- 3.4. Trade Analysis
- 3.4.1. Import & Export Analysis, 2025
- 3.4.2. Top Importing Countries
- 3.4.3. Top Exporting Countries
- 3.5. Trump Tariff Impact Analysis
- 3.5.1. Manufacturer
- 3.5.1.1. Based on the component & Raw material
- 3.5.2. Supply Chain
- 3.5.3. End Consumer
- 3.5.1. Manufacturer
- 3.6. Raw Material Analysis
- 3.1. Global Automation & Process Control Industry Overview, 2025
- 4. Market Overview
- 4.1. Market Dynamics
- 4.1.1. Drivers
- 4.1.1.1. Acceleration of Industry 4.0 and IIoT-enabled smart manufacturing
- 4.1.1.2. Adoption of predictive maintenance to reduce downtime and optimize assets
- 4.1.1.3. Integration with AI / ML for predictive analytics and real‑time optimization
- 4.1.2. Restraints
- 4.1.2.1. Cybersecurity risks, data privacy, and vulnerability of interconnected systems
- 4.1.2.2. High implementation costs and complex integration with legacy systems
- 4.1.1. Drivers
- 4.2. Key Trend Analysis
- 4.3. Regulatory Framework
- 4.3.1. Key Regulations, Norms, and Subsidies, by Key Countries
- 4.3.2. Tariffs and Standards
- 4.3.3. Impact Analysis of Regulations on the Market
- 4.4. Value Chain Analysis
- 4.4.1. Raw Materials / Data Sources
- 4.4.2. System Integration & Implementation
- 4.4.3. Distribution & Deployment
- 4.4.4. End-Users
- 4.5. Porter’s Five Forces Analysis
- 4.6. PESTEL Analysis
- 4.7. Global Digital Twin for Manufacturing Market Demand
- 4.7.1. Historical Market Size – Value (US$ Bn), 2020-2024
- 4.7.2. Current and Future Market Size - Value (US$ Bn), 2026–2035
- 4.7.2.1. Y-o-Y Growth Trends
- 4.7.2.2. Absolute $ Opportunity Assessment
- 4.1. Market Dynamics
- 5. Competition Landscape
- 5.1. Competition structure
- 5.1.1. Fragmented v/s consolidated
- 5.2. Company Share Analysis, 2025
- 5.2.1. Global Company Market Share
- 5.2.2. By Region
- 5.2.2.1. North America
- 5.2.2.2. Europe
- 5.2.2.3. Asia Pacific
- 5.2.2.4. Middle East
- 5.2.2.5. Africa
- 5.2.2.6. South America
- 5.3. Product Comparison Matrix
- 5.3.1. Specifications
- 5.3.2. Market Positioning
- 5.3.3. Pricing
- 5.1. Competition structure
- 6. Global Digital Twin for Manufacturing Market Analysis, by Component
- 6.1. Key Segment Analysis
- 6.2. Digital Twin for Manufacturing Market Size Value (US$ Bn), Analysis, and Forecasts, by Component, 2021-2035
- 6.2.1. Software
- 6.2.1.1. Simulation Software
- 6.2.1.2. Data Analytics Software
- 6.2.1.3. Visualization Software
- 6.2.1.4. Integration Software
- 6.2.1.5. Others
- 6.2.2. Services
- 6.2.2.1. Professional Services
- 6.2.2.1.1. Consulting Services
- 6.2.2.1.2. Implementation Services
- 6.2.2.1.3. Training & Support
- 6.2.2.2. Managed Services
- 6.2.2.1. Professional Services
- 6.2.1. Software
- 7. Global Digital Twin for Manufacturing Market Analysis, by Technology
- 7.1. Key Segment Analysis
- 7.2. Digital Twin for Manufacturing Market Size Value (US$ Bn), Analysis, and Forecasts, by Technology, 2021-2035
- 7.2.1. Internet of Things (IoT)
- 7.2.2. Artificial Intelligence (AI) & Machine Learning (ML)
- 7.2.3. Cloud Computing
- 7.2.4. Big Data Analytics
- 7.2.5. Augmented Reality (AR) & Virtual Reality (VR)
- 7.2.6. Blockchain
- 7.2.7. Others
- 8. Global Digital Twin for Manufacturing Market Analysis, by Application
- 8.1. Key Segment Analysis
- 8.2. Digital Twin for Manufacturing Market Size Value (US$ Bn), Analysis, and Forecasts, by Application, 2021-2035
- 8.2.1. Product Design & Development
- 8.2.2. Production Planning
- 8.2.3. Performance Monitoring & Optimization
- 8.2.4. Predictive Maintenance
- 8.2.5. Inventory Management
- 8.2.6. Supply Chain Management
- 8.2.7. Quality Management
- 8.2.8. Others
- 9. Global Digital Twin for Manufacturing Market Analysis, by Deployment Mode
- 9.1. Key Segment Analysis
- 9.2. Digital Twin for Manufacturing Market Size Value (US$ Bn), Analysis, and Forecasts, by Deployment Mode, 2021-2035
- 9.2.1. On-Premises
- 9.2.2. Cloud-Based
- 9.2.3. Edge Computing
- 10. Global Digital Twin for Manufacturing Market Analysis, by Enterprise Size
- 10.1. Key Segment Analysis
- 10.2. Digital Twin for Manufacturing Market Size Value (US$ Bn), Analysis, and Forecasts, by Enterprise Size, 2021-2035
- 10.2.1. Large Enterprises
- 10.2.2. Small and Medium Enterprises (SMEs)
- 11. Global Digital Twin for Manufacturing Market Analysis, by Manufacturing Type
- 11.1. Key Segment Analysis
- 11.2. Digital Twin for Manufacturing Market Size Value (US$ Bn), Analysis, and Forecasts, by Manufacturing Type, 2021-2035
- 11.2.1. Discrete Manufacturing
- 11.2.1.1. Automotive Manufacturing
- 11.2.1.2. Aerospace Manufacturing
- 11.2.1.3. Electronics Manufacturing
- 11.2.1.4. Machinery Manufacturing
- 11.2.1.5. Others
- 11.2.2. Process Manufacturing
- 11.2.2.1. Chemical Manufacturing
- 11.2.2.2. Pharmaceutical Manufacturing
- 11.2.2.3. Food & Beverage Manufacturing
- 11.2.2.4. Oil & Gas Manufacturing
- 11.2.2.5. Others
- 11.2.1. Discrete Manufacturing
- 12. Global Digital Twin for Manufacturing Market Analysis, by Connectivity Type
- 12.1. Key Segment Analysis
- 12.2. Digital Twin for Manufacturing Market Size Value (US$ Bn), Analysis, and Forecasts, by Connectivity Type, 2021-2035
- 12.2.1. Wired Connectivity
- 12.2.2. Wireless Connectivity
- 12.2.2.1. Wi-Fi
- 12.2.2.2. Bluetooth
- 12.2.2.3. Cellular (4G/5G)
- 12.2.2.4. LPWAN
- 12.2.2.5. Others
- 13. Global Digital Twin for Manufacturing Market Analysis, by Data Source
- 13.1. Key Segment Analysis
- 13.2. Digital Twin for Manufacturing Market Size Value (US$ Bn), Analysis, and Forecasts, by Data Source, 2021-2035
- 13.2.1. Real-time Sensor Data
- 13.2.2. Historical Data
- 13.2.3. Simulation Data
- 13.2.4. External Data Sources
- 14. Global Digital Twin for Manufacturing Market Analysis, by Integration Level
- 14.1. Key Segment Analysis
- 14.2. Digital Twin for Manufacturing Market Size Value (US$ Bn), Analysis, and Forecasts, by Integration Level, 2021-2035
- 14.2.1. Stand-alone Systems
- 14.2.2. Partially Integrated Systems
- 14.2.3. Fully Integrated Systems
- 15. Global Digital Twin for Manufacturing Market Analysis, by Complexity Level
- 15.1. Key Segment Analysis
- 15.2. Digital Twin for Manufacturing Market Size Value (US$ Bn), Analysis, and Forecasts, by Complexity Level, 2021-2035
- 15.2.1. Component/Part Level
- 15.2.2. Product Level
- 15.2.3. System Level
- 15.2.4. Process Level
- 15.2.5. Factory Level
- 16. Global Digital Twin for Manufacturing Market Analysis, by Update Frequency
- 16.1. Key Segment Analysis
- 16.2. Digital Twin for Manufacturing Market Size Value (US$ Bn), Analysis, and Forecasts, by Update Frequency, 2021-2035
- 16.2.1. Real-time Updates
- 16.2.2. Near Real-time Updates
- 16.2.3. Batch Updates
- 16.2.4. Periodic Updates
- 17. Global Digital Twin for Manufacturing Market Analysis, by Rated Capacity (Production Volume)
- 17.1. Key Segment Analysis
- 17.2. Digital Twin for Manufacturing Market Size Value (US$ Bn), Analysis, and Forecasts, by Rated Capacity (Production Volume), 2021-2035
- 17.2.1. < 10,000 units/year
- 17.2.2. 10,000 - 100,000 units/year
- 17.2.3. 100,000 - 500,000 units/year
- 17.2.4. > 500,000 units/year
- 18. Global Digital Twin for Manufacturing Market Analysis, by End-users
- 18.1. Key Segment Analysis
- 18.2. Digital Twin for Manufacturing Market Size Value (US$ Bn), Analysis, and Forecasts, by End-users, 2021-2035
- 18.2.1. Automotive
- 18.2.2. Aerospace & Defense
- 18.2.3. Electronics & Semiconductors
- 18.2.4. Pharmaceuticals & Life Sciences
- 18.2.5. Chemical & Petrochemical
- 18.2.6. Metal & Mining
- 18.2.7. Energy & Utilities
- 18.2.8. Consumer Goods
- 18.2.9. Medical Devices
- 18.2.10. Machinery & Equipment
- 18.2.11. Other End-users
- 19. Global Digital Twin for Manufacturing Market Analysis and Forecasts, by Region
- 19.1. Key Findings
- 19.2. Digital Twin for Manufacturing Market Size Value (US$ Bn), Analysis, and Forecasts, by Region, 2021-2035
- 19.2.1. North America
- 19.2.2. Europe
- 19.2.3. Asia Pacific
- 19.2.4. Middle East
- 19.2.5. Africa
- 19.2.6. South America
- 20. North America Digital Twin for Manufacturing Market Analysis
- 20.1. Key Segment Analysis
- 20.2. Regional Snapshot
- 20.3. North America Digital Twin for Manufacturing Market Size Value (US$ Bn), Analysis, and Forecasts, 2021-2035
- 20.3.1. Component
- 20.3.2. Technology
- 20.3.3. Application
- 20.3.4. Deployment Mode
- 20.3.5. Enterprise Size
- 20.3.6. Manufacturing Type
- 20.3.7. Connectivity Type
- 20.3.8. Data Source
- 20.3.9. Integration Level
- 20.3.10. Complexity Level
- 20.3.11. Update Frequency
- 20.3.12. Rated Capacity (Production Volume)
- 20.3.13. End-users
- 20.3.14. Country
- 20.3.14.1. USA
- 20.3.14.2. Canada
- 20.3.14.3. Mexico
- 20.4. USA Digital Twin for Manufacturing Market
- 20.4.1. Country Segmental Analysis
- 20.4.2. Component
- 20.4.3. Technology
- 20.4.4. Application
- 20.4.5. Deployment Mode
- 20.4.6. Enterprise Size
- 20.4.7. Manufacturing Type
- 20.4.8. Connectivity Type
- 20.4.9. Data Source
- 20.4.10. Integration Level
- 20.4.11. Complexity Level
- 20.4.12. Update Frequency
- 20.4.13. Rated Capacity (Production Volume)
- 20.4.14. End-users
- 20.5. Canada Digital Twin for Manufacturing Market
- 20.5.1. Country Segmental Analysis
- 20.5.2. Component
- 20.5.3. Technology
- 20.5.4. Application
- 20.5.5. Deployment Mode
- 20.5.6. Enterprise Size
- 20.5.7. Manufacturing Type
- 20.5.8. Connectivity Type
- 20.5.9. Data Source
- 20.5.10. Integration Level
- 20.5.11. Complexity Level
- 20.5.12. Update Frequency
- 20.5.13. Rated Capacity (Production Volume)
- 20.5.14. End-users
- 20.6. Mexico Digital Twin for Manufacturing Market
- 20.6.1. Country Segmental Analysis
- 20.6.2. Component
- 20.6.3. Technology
- 20.6.4. Application
- 20.6.5. Deployment Mode
- 20.6.6. Enterprise Size
- 20.6.7. Manufacturing Type
- 20.6.8. Connectivity Type
- 20.6.9. Data Source
- 20.6.10. Integration Level
- 20.6.11. Complexity Level
- 20.6.12. Update Frequency
- 20.6.13. Rated Capacity (Production Volume)
- 20.6.14. End-users
- 21. Europe Digital Twin for Manufacturing Market Analysis
- 21.1. Key Segment Analysis
- 21.2. Regional Snapshot
- 21.3. Europe Digital Twin for Manufacturing Market Size Value (US$ Bn), Analysis, and Forecasts, 2021-2035
- 21.3.1. Component
- 21.3.2. Technology
- 21.3.3. Application
- 21.3.4. Deployment Mode
- 21.3.5. Enterprise Size
- 21.3.6. Manufacturing Type
- 21.3.7. Connectivity Type
- 21.3.8. Data Source
- 21.3.9. Integration Level
- 21.3.10. Complexity Level
- 21.3.11. Update Frequency
- 21.3.12. Rated Capacity (Production Volume)
- 21.3.13. End-users
- 21.3.14. Country
- 21.3.14.1. Germany
- 21.3.14.2. United Kingdom
- 21.3.14.3. France
- 21.3.14.4. Italy
- 21.3.14.5. Spain
- 21.3.14.6. Netherlands
- 21.3.14.7. Nordic Countries
- 21.3.14.8. Poland
- 21.3.14.9. Russia & CIS
- 21.3.14.10. Rest of Europe
- 21.4. Germany Digital Twin for Manufacturing Market
- 21.4.1. Country Segmental Analysis
- 21.4.2. Component
- 21.4.3. Technology
- 21.4.4. Application
- 21.4.5. Deployment Mode
- 21.4.6. Enterprise Size
- 21.4.7. Manufacturing Type
- 21.4.8. Connectivity Type
- 21.4.9. Data Source
- 21.4.10. Integration Level
- 21.4.11. Complexity Level
- 21.4.12. Update Frequency
- 21.4.13. Rated Capacity (Production Volume)
- 21.4.14. End-users
- 21.5. United Kingdom Digital Twin for Manufacturing Market
- 21.5.1. Country Segmental Analysis
- 21.5.2. Component
- 21.5.3. Technology
- 21.5.4. Application
- 21.5.5. Deployment Mode
- 21.5.6. Enterprise Size
- 21.5.7. Manufacturing Type
- 21.5.8. Connectivity Type
- 21.5.9. Data Source
- 21.5.10. Integration Level
- 21.5.11. Complexity Level
- 21.5.12. Update Frequency
- 21.5.13. Rated Capacity (Production Volume)
- 21.5.14. End-users
- 21.6. France Digital Twin for Manufacturing Market
- 21.6.1. Country Segmental Analysis
- 21.6.2. Component
- 21.6.3. Technology
- 21.6.4. Application
- 21.6.5. Deployment Mode
- 21.6.6. Enterprise Size
- 21.6.7. Manufacturing Type
- 21.6.8. Connectivity Type
- 21.6.9. Data Source
- 21.6.10. Integration Level
- 21.6.11. Complexity Level
- 21.6.12. Update Frequency
- 21.6.13. Rated Capacity (Production Volume)
- 21.6.14. End-users
- 21.7. Italy Digital Twin for Manufacturing Market
- 21.7.1. Country Segmental Analysis
- 21.7.2. Component
- 21.7.3. Technology
- 21.7.4. Application
- 21.7.5. Deployment Mode
- 21.7.6. Enterprise Size
- 21.7.7. Manufacturing Type
- 21.7.8. Connectivity Type
- 21.7.9. Data Source
- 21.7.10. Integration Level
- 21.7.11. Complexity Level
- 21.7.12. Update Frequency
- 21.7.13. Rated Capacity (Production Volume)
- 21.7.14. End-users
- 21.8. Spain Digital Twin for Manufacturing Market
- 21.8.1. Country Segmental Analysis
- 21.8.2. Component
- 21.8.3. Technology
- 21.8.4. Application
- 21.8.5. Deployment Mode
- 21.8.6. Enterprise Size
- 21.8.7. Manufacturing Type
- 21.8.8. Connectivity Type
- 21.8.9. Data Source
- 21.8.10. Integration Level
- 21.8.11. Complexity Level
- 21.8.12. Update Frequency
- 21.8.13. Rated Capacity (Production Volume)
- 21.8.14. End-users
- 21.9. Netherlands Digital Twin for Manufacturing Market
- 21.9.1. Country Segmental Analysis
- 21.9.2. Component
- 21.9.3. Technology
- 21.9.4. Application
- 21.9.5. Deployment Mode
- 21.9.6. Enterprise Size
- 21.9.7. Manufacturing Type
- 21.9.8. Connectivity Type
- 21.9.9. Data Source
- 21.9.10. Integration Level
- 21.9.11. Complexity Level
- 21.9.12. Update Frequency
- 21.9.13. Rated Capacity (Production Volume)
- 21.9.14. End-users
- 21.10. Nordic Countries Digital Twin for Manufacturing Market
- 21.10.1. Country Segmental Analysis
- 21.10.2. Component
- 21.10.3. Technology
- 21.10.4. Application
- 21.10.5. Deployment Mode
- 21.10.6. Enterprise Size
- 21.10.7. Manufacturing Type
- 21.10.8. Connectivity Type
- 21.10.9. Data Source
- 21.10.10. Integration Level
- 21.10.11. Complexity Level
- 21.10.12. Update Frequency
- 21.10.13. Rated Capacity (Production Volume)
- 21.10.14. End-users
- 21.11. Poland Digital Twin for Manufacturing Market
- 21.11.1. Country Segmental Analysis
- 21.11.2. Component
- 21.11.3. Technology
- 21.11.4. Application
- 21.11.5. Deployment Mode
- 21.11.6. Enterprise Size
- 21.11.7. Manufacturing Type
- 21.11.8. Connectivity Type
- 21.11.9. Data Source
- 21.11.10. Integration Level
- 21.11.11. Complexity Level
- 21.11.12. Update Frequency
- 21.11.13. Rated Capacity (Production Volume)
- 21.11.14. End-users
- 21.12. Russia & CIS Digital Twin for Manufacturing Market
- 21.12.1. Country Segmental Analysis
- 21.12.2. Component
- 21.12.3. Technology
- 21.12.4. Application
- 21.12.5. Deployment Mode
- 21.12.6. Enterprise Size
- 21.12.7. Manufacturing Type
- 21.12.8. Connectivity Type
- 21.12.9. Data Source
- 21.12.10. Integration Level
- 21.12.11. Complexity Level
- 21.12.12. Update Frequency
- 21.12.13. Rated Capacity (Production Volume)
- 21.12.14. End-users
- 21.13. Rest of Europe Digital Twin for Manufacturing Market
- 21.13.1. Country Segmental Analysis
- 21.13.2. Component
- 21.13.3. Technology
- 21.13.4. Application
- 21.13.5. Deployment Mode
- 21.13.6. Enterprise Size
- 21.13.7. Manufacturing Type
- 21.13.8. Connectivity Type
- 21.13.9. Data Source
- 21.13.10. Integration Level
- 21.13.11. Complexity Level
- 21.13.12. Update Frequency
- 21.13.13. Rated Capacity (Production Volume)
- 21.13.14. End-users
- 22. Asia Pacific Digital Twin for Manufacturing Market Analysis
- 22.1. Key Segment Analysis
- 22.2. Regional Snapshot
- 22.3. Asia Pacific Digital Twin for Manufacturing Market Size Value (US$ Bn), Analysis, and Forecasts, 2021-2035
- 22.3.1. Component
- 22.3.2. Technology
- 22.3.3. Application
- 22.3.4. Deployment Mode
- 22.3.5. Enterprise Size
- 22.3.6. Manufacturing Type
- 22.3.7. Connectivity Type
- 22.3.8. Data Source
- 22.3.9. Integration Level
- 22.3.10. Complexity Level
- 22.3.11. Update Frequency
- 22.3.12. Rated Capacity (Production Volume)
- 22.3.13. End-users
- 22.3.14. Country
- 22.3.14.1. China
- 22.3.14.2. India
- 22.3.14.3. Japan
- 22.3.14.4. South Korea
- 22.3.14.5. Australia and New Zealand
- 22.3.14.6. Indonesia
- 22.3.14.7. Malaysia
- 22.3.14.8. Thailand
- 22.3.14.9. Vietnam
- 22.3.14.10. Rest of Asia Pacific
- 22.4. China Digital Twin for Manufacturing Market
- 22.4.1. Country Segmental Analysis
- 22.4.2. Component
- 22.4.3. Technology
- 22.4.4. Application
- 22.4.5. Deployment Mode
- 22.4.6. Enterprise Size
- 22.4.7. Manufacturing Type
- 22.4.8. Connectivity Type
- 22.4.9. Data Source
- 22.4.10. Integration Level
- 22.4.11. Complexity Level
- 22.4.12. Update Frequency
- 22.4.13. Rated Capacity (Production Volume)
- 22.4.14. End-users
- 22.5. India Digital Twin for Manufacturing Market
- 22.5.1. Country Segmental Analysis
- 22.5.2. Component
- 22.5.3. Technology
- 22.5.4. Application
- 22.5.5. Deployment Mode
- 22.5.6. Enterprise Size
- 22.5.7. Manufacturing Type
- 22.5.8. Connectivity Type
- 22.5.9. Data Source
- 22.5.10. Integration Level
- 22.5.11. Complexity Level
- 22.5.12. Update Frequency
- 22.5.13. Rated Capacity (Production Volume)
- 22.5.14. End-users
- 22.6. Japan Digital Twin for Manufacturing Market
- 22.6.1. Country Segmental Analysis
- 22.6.2. Component
- 22.6.3. Technology
- 22.6.4. Application
- 22.6.5. Deployment Mode
- 22.6.6. Enterprise Size
- 22.6.7. Manufacturing Type
- 22.6.8. Connectivity Type
- 22.6.9. Data Source
- 22.6.10. Integration Level
- 22.6.11. Complexity Level
- 22.6.12. Update Frequency
- 22.6.13. Rated Capacity (Production Volume)
- 22.6.14. End-users
- 22.7. South Korea Digital Twin for Manufacturing Market
- 22.7.1. Country Segmental Analysis
- 22.7.2. Component
- 22.7.3. Technology
- 22.7.4. Application
- 22.7.5. Deployment Mode
- 22.7.6. Enterprise Size
- 22.7.7. Manufacturing Type
- 22.7.8. Connectivity Type
- 22.7.9. Data Source
- 22.7.10. Integration Level
- 22.7.11. Complexity Level
- 22.7.12. Update Frequency
- 22.7.13. Rated Capacity (Production Volume)
- 22.7.14. End-users
- 22.8. Australia and New Zealand Digital Twin for Manufacturing Market
- 22.8.1. Country Segmental Analysis
- 22.8.2. Component
- 22.8.3. Technology
- 22.8.4. Application
- 22.8.5. Deployment Mode
- 22.8.6. Enterprise Size
- 22.8.7. Manufacturing Type
- 22.8.8. Connectivity Type
- 22.8.9. Data Source
- 22.8.10. Integration Level
- 22.8.11. Complexity Level
- 22.8.12. Update Frequency
- 22.8.13. Rated Capacity (Production Volume)
- 22.8.14. End-users
- 22.9. Indonesia Digital Twin for Manufacturing Market
- 22.9.1. Country Segmental Analysis
- 22.9.2. Component
- 22.9.3. Technology
- 22.9.4. Application
- 22.9.5. Deployment Mode
- 22.9.6. Enterprise Size
- 22.9.7. Manufacturing Type
- 22.9.8. Connectivity Type
- 22.9.9. Data Source
- 22.9.10. Integration Level
- 22.9.11. Complexity Level
- 22.9.12. Update Frequency
- 22.9.13. Rated Capacity (Production Volume)
- 22.9.14. End-users
- 22.10. Malaysia Digital Twin for Manufacturing Market
- 22.10.1. Country Segmental Analysis
- 22.10.2. Component
- 22.10.3. Technology
- 22.10.4. Application
- 22.10.5. Deployment Mode
- 22.10.6. Enterprise Size
- 22.10.7. Manufacturing Type
- 22.10.8. Connectivity Type
- 22.10.9. Data Source
- 22.10.10. Integration Level
- 22.10.11. Complexity Level
- 22.10.12. Update Frequency
- 22.10.13. Rated Capacity (Production Volume)
- 22.10.14. End-users
- 22.11. Thailand Digital Twin for Manufacturing Market
- 22.11.1. Country Segmental Analysis
- 22.11.2. Component
- 22.11.3. Technology
- 22.11.4. Application
- 22.11.5. Deployment Mode
- 22.11.6. Enterprise Size
- 22.11.7. Manufacturing Type
- 22.11.8. Connectivity Type
- 22.11.9. Data Source
- 22.11.10. Integration Level
- 22.11.11. Complexity Level
- 22.11.12. Update Frequency
- 22.11.13. Rated Capacity (Production Volume)
- 22.11.14. End-users
- 22.12. Vietnam Digital Twin for Manufacturing Market
- 22.12.1. Country Segmental Analysis
- 22.12.2. Component
- 22.12.3. Technology
- 22.12.4. Application
- 22.12.5. Deployment Mode
- 22.12.6. Enterprise Size
- 22.12.7. Manufacturing Type
- 22.12.8. Connectivity Type
- 22.12.9. Data Source
- 22.12.10. Integration Level
- 22.12.11. Complexity Level
- 22.12.12. Update Frequency
- 22.12.13. Rated Capacity (Production Volume)
- 22.12.14. End-users
- 22.13. Rest of Asia Pacific Digital Twin for Manufacturing Market
- 22.13.1. Country Segmental Analysis
- 22.13.2. Component
- 22.13.3. Technology
- 22.13.4. Application
- 22.13.5. Deployment Mode
- 22.13.6. Enterprise Size
- 22.13.7. Manufacturing Type
- 22.13.8. Connectivity Type
- 22.13.9. Data Source
- 22.13.10. Integration Level
- 22.13.11. Complexity Level
- 22.13.12. Update Frequency
- 22.13.13. Rated Capacity (Production Volume)
- 22.13.14. End-users
- 23. Middle East Digital Twin for Manufacturing Market Analysis
- 23.1. Key Segment Analysis
- 23.2. Regional Snapshot
- 23.3. Middle East Digital Twin for Manufacturing Market Size Value (US$ Bn), Analysis, and Forecasts, 2021-2035
- 23.3.1. Component
- 23.3.2. Technology
- 23.3.3. Application
- 23.3.4. Deployment Mode
- 23.3.5. Enterprise Size
- 23.3.6. Manufacturing Type
- 23.3.7. Connectivity Type
- 23.3.8. Data Source
- 23.3.9. Integration Level
- 23.3.10. Complexity Level
- 23.3.11. Update Frequency
- 23.3.12. Rated Capacity (Production Volume)
- 23.3.13. End-users
- 23.3.14. Country
- 23.3.14.1. Turkey
- 23.3.14.2. UAE
- 23.3.14.3. Saudi Arabia
- 23.3.14.4. Israel
- 23.3.14.5. Rest of Middle East
- 23.4. Turkey Digital Twin for Manufacturing Market
- 23.4.1. Country Segmental Analysis
- 23.4.2. Component
- 23.4.3. Technology
- 23.4.4. Application
- 23.4.5. Deployment Mode
- 23.4.6. Enterprise Size
- 23.4.7. Manufacturing Type
- 23.4.8. Connectivity Type
- 23.4.9. Data Source
- 23.4.10. Integration Level
- 23.4.11. Complexity Level
- 23.4.12. Update Frequency
- 23.4.13. Rated Capacity (Production Volume)
- 23.4.14. End-users
- 23.5. UAE Digital Twin for Manufacturing Market
- 23.5.1. Country Segmental Analysis
- 23.5.2. Component
- 23.5.3. Technology
- 23.5.4. Application
- 23.5.5. Deployment Mode
- 23.5.6. Enterprise Size
- 23.5.7. Manufacturing Type
- 23.5.8. Connectivity Type
- 23.5.9. Data Source
- 23.5.10. Integration Level
- 23.5.11. Complexity Level
- 23.5.12. Update Frequency
- 23.5.13. Rated Capacity (Production Volume)
- 23.5.14. End-users
- 23.6. Saudi Arabia Digital Twin for Manufacturing Market
- 23.6.1. Country Segmental Analysis
- 23.6.2. Component
- 23.6.3. Technology
- 23.6.4. Application
- 23.6.5. Deployment Mode
- 23.6.6. Enterprise Size
- 23.6.7. Manufacturing Type
- 23.6.8. Connectivity Type
- 23.6.9. Data Source
- 23.6.10. Integration Level
- 23.6.11. Complexity Level
- 23.6.12. Update Frequency
- 23.6.13. Rated Capacity (Production Volume)
- 23.6.14. End-users
- 23.7. Israel Digital Twin for Manufacturing Market
- 23.7.1. Country Segmental Analysis
- 23.7.2. Component
- 23.7.3. Technology
- 23.7.4. Application
- 23.7.5. Deployment Mode
- 23.7.6. Enterprise Size
- 23.7.7. Manufacturing Type
- 23.7.8. Connectivity Type
- 23.7.9. Data Source
- 23.7.10. Integration Level
- 23.7.11. Complexity Level
- 23.7.12. Update Frequency
- 23.7.13. Rated Capacity (Production Volume)
- 23.7.14. End-users
- 23.8. Rest of Middle East Digital Twin for Manufacturing Market
- 23.8.1. Country Segmental Analysis
- 23.8.2. Component
- 23.8.3. Technology
- 23.8.4. Application
- 23.8.5. Deployment Mode
- 23.8.6. Enterprise Size
- 23.8.7. Manufacturing Type
- 23.8.8. Connectivity Type
- 23.8.9. Data Source
- 23.8.10. Integration Level
- 23.8.11. Complexity Level
- 23.8.12. Update Frequency
- 23.8.13. Rated Capacity (Production Volume)
- 23.8.14. End-users
- 24. Africa Digital Twin for Manufacturing Market Analysis
- 24.1. Key Segment Analysis
- 24.2. Regional Snapshot
- 24.3. Africa Digital Twin for Manufacturing Market Size Value (US$ Bn), Analysis, and Forecasts, 2021-2035
- 24.3.1. Component
- 24.3.2. Technology
- 24.3.3. Application
- 24.3.4. Deployment Mode
- 24.3.5. Enterprise Size
- 24.3.6. Manufacturing Type
- 24.3.7. Connectivity Type
- 24.3.8. Data Source
- 24.3.9. Integration Level
- 24.3.10. Complexity Level
- 24.3.11. Update Frequency
- 24.3.12. Rated Capacity (Production Volume)
- 24.3.13. End-users
- 24.3.14. Country
- 24.3.14.1. South Africa
- 24.3.14.2. Egypt
- 24.3.14.3. Nigeria
- 24.3.14.4. Algeria
- 24.3.14.5. Rest of Africa
- 24.4. South Africa Digital Twin for Manufacturing Market
- 24.4.1. Country Segmental Analysis
- 24.4.2. Component
- 24.4.3. Technology
- 24.4.4. Application
- 24.4.5. Deployment Mode
- 24.4.6. Enterprise Size
- 24.4.7. Manufacturing Type
- 24.4.8. Connectivity Type
- 24.4.9. Data Source
- 24.4.10. Integration Level
- 24.4.11. Complexity Level
- 24.4.12. Update Frequency
- 24.4.13. Rated Capacity (Production Volume)
- 24.4.14. End-users
- 24.5. Egypt Digital Twin for Manufacturing Market
- 24.5.1. Country Segmental Analysis
- 24.5.2. Component
- 24.5.3. Technology
- 24.5.4. Application
- 24.5.5. Deployment Mode
- 24.5.6. Enterprise Size
- 24.5.7. Manufacturing Type
- 24.5.8. Connectivity Type
- 24.5.9. Data Source
- 24.5.10. Integration Level
- 24.5.11. Complexity Level
- 24.5.12. Update Frequency
- 24.5.13. Rated Capacity (Production Volume)
- 24.5.14. End-users
- 24.6. Nigeria Digital Twin for Manufacturing Market
- 24.6.1. Country Segmental Analysis
- 24.6.2. Component
- 24.6.3. Technology
- 24.6.4. Application
- 24.6.5. Deployment Mode
- 24.6.6. Enterprise Size
- 24.6.7. Manufacturing Type
- 24.6.8. Connectivity Type
- 24.6.9. Data Source
- 24.6.10. Integration Level
- 24.6.11. Complexity Level
- 24.6.12. Update Frequency
- 24.6.13. Rated Capacity (Production Volume)
- 24.6.14. End-users
- 24.7. Algeria Digital Twin for Manufacturing Market
- 24.7.1. Country Segmental Analysis
- 24.7.2. Component
- 24.7.3. Technology
- 24.7.4. Application
- 24.7.5. Deployment Mode
- 24.7.6. Enterprise Size
- 24.7.7. Manufacturing Type
- 24.7.8. Connectivity Type
- 24.7.9. Data Source
- 24.7.10. Integration Level
- 24.7.11. Complexity Level
- 24.7.12. Update Frequency
- 24.7.13. Rated Capacity (Production Volume)
- 24.7.14. End-users
- 24.8. Rest of Africa Digital Twin for Manufacturing Market
- 24.8.1. Country Segmental Analysis
- 24.8.2. Component
- 24.8.3. Technology
- 24.8.4. Application
- 24.8.5. Deployment Mode
- 24.8.6. Enterprise Size
- 24.8.7. Manufacturing Type
- 24.8.8. Connectivity Type
- 24.8.9. Data Source
- 24.8.10. Integration Level
- 24.8.11. Complexity Level
- 24.8.12. Update Frequency
- 24.8.13. Rated Capacity (Production Volume)
- 24.8.14. End-users
- 25. South America Digital Twin for Manufacturing Market Analysis
- 25.1. Key Segment Analysis
- 25.2. Regional Snapshot
- 25.3. South America Digital Twin for Manufacturing Market Size Value (US$ Bn), Analysis, and Forecasts, 2021-2035
- 25.3.1. Component
- 25.3.2. Technology
- 25.3.3. Application
- 25.3.4. Deployment Mode
- 25.3.5. Enterprise Size
- 25.3.6. Manufacturing Type
- 25.3.7. Connectivity Type
- 25.3.8. Data Source
- 25.3.9. Integration Level
- 25.3.10. Complexity Level
- 25.3.11. Update Frequency
- 25.3.12. Rated Capacity (Production Volume)
- 25.3.13. End-users
- 25.3.14. Country
- 25.3.14.1. Brazil
- 25.3.14.2. Argentina
- 25.3.14.3. Rest of South America
- 25.4. Brazil Digital Twin for Manufacturing Market
- 25.4.1. Country Segmental Analysis
- 25.4.2. Component
- 25.4.3. Technology
- 25.4.4. Application
- 25.4.5. Deployment Mode
- 25.4.6. Enterprise Size
- 25.4.7. Manufacturing Type
- 25.4.8. Connectivity Type
- 25.4.9. Data Source
- 25.4.10. Integration Level
- 25.4.11. Complexity Level
- 25.4.12. Update Frequency
- 25.4.13. Rated Capacity (Production Volume)
- 25.4.14. End-users
- 25.5. Argentina Digital Twin for Manufacturing Market
- 25.5.1. Country Segmental Analysis
- 25.5.2. Component
- 25.5.3. Technology
- 25.5.4. Application
- 25.5.5. Deployment Mode
- 25.5.6. Enterprise Size
- 25.5.7. Manufacturing Type
- 25.5.8. Connectivity Type
- 25.5.9. Data Source
- 25.5.10. Integration Level
- 25.5.11. Complexity Level
- 25.5.12. Update Frequency
- 25.5.13. Rated Capacity (Production Volume)
- 25.5.14. End-users
- 25.6. Rest of South America Digital Twin for Manufacturing Market
- 25.6.1. Country Segmental Analysis
- 25.6.2. Component
- 25.6.3. Technology
- 25.6.4. Application
- 25.6.5. Deployment Mode
- 25.6.6. Enterprise Size
- 25.6.7. Manufacturing Type
- 25.6.8. Connectivity Type
- 25.6.9. Data Source
- 25.6.10. Integration Level
- 25.6.11. Complexity Level
- 25.6.12. Update Frequency
- 25.6.13. Rated Capacity (Production Volume)
- 25.6.14. End-users
- 26. Key Players/ Company Profile
- 26.1. ABB Ltd.
- 26.1.1. Company Details/ Overview
- 26.1.2. Company Financials
- 26.1.3. Key Customers and Competitors
- 26.1.4. Business/ Industry Portfolio
- 26.1.5. Product Portfolio/ Specification Details
- 26.1.6. Pricing Data
- 26.1.7. Strategic Overview
- 26.1.8. Recent Developments
- 26.2. ANSYS Inc.
- 26.3. Autodesk Inc.
- 26.4. Aveva Group
- 26.5. Bentley Systems
- 26.6. Bosch Rexroth
- 26.7. Dassault Systèmes
- 26.8. Emerson Electric
- 26.9. Fujitsu Limited
- 26.10. General Electric (GE Digital)
- 26.11. Hexagon AB
- 26.12. Honeywell International
- 26.13. IBM Corporation
- 26.14. Microsoft Corporation
- 26.15. Oracle Corporation
- 26.16. PTC Inc.
- 26.17. Rockwell Automation
- 26.18. SAP SE
- 26.19. Schneider Electric
- 26.20. Siemens AG
- 26.21. Other Key Players
- 26.1. ABB Ltd.
Note* - This is just tentative list of players. While providing the report, we will cover more number of players based on their revenue and share for each geography
Research Design
Our research design integrates both demand-side and supply-side analysis through a balanced combination of primary and secondary research methodologies. By utilizing both bottom-up and top-down approaches alongside rigorous data triangulation methods, we deliver robust market intelligence that supports strategic decision-making.
MarketGenics' comprehensive research design framework ensures the delivery of accurate, reliable, and actionable market intelligence. Through the integration of multiple research approaches, rigorous validation processes, and expert analysis, we provide our clients with the insights needed to make informed strategic decisions and capitalize on market opportunities.

MarketGenics leverages a dedicated industry panel of experts and a comprehensive suite of paid databases to effectively collect, consolidate, and analyze market intelligence.
Our approach has consistently proven to be reliable and effective in generating accurate market insights, identifying key industry trends, and uncovering emerging business opportunities.
Through both primary and secondary research, we capture and analyze critical company-level data such as manufacturing footprints, including technical centers, R&D facilities, sales offices, and headquarters.
Our expert panel further enhances our ability to estimate market size for specific brands based on validated field-level intelligence.
Our data mining techniques incorporate both parametric and non-parametric methods, allowing for structured data collection, sorting, processing, and cleaning.
Demand projections are derived from large-scale data sets analyzed through proprietary algorithms, culminating in robust and reliable market sizing.
Research Approach
The bottom-up approach builds market estimates by starting with the smallest addressable market units and systematically aggregating them to create comprehensive market size projections.
This method begins with specific, granular data points and builds upward to create the complete market landscape.
Customer Analysis → Segmental Analysis → Geographical Analysis
The top-down approach starts with the broadest possible market data and systematically narrows it down through a series of filters and assumptions to arrive at specific market segments or opportunities.
This method begins with the big picture and works downward to increasingly specific market slices.
TAM → SAM → SOM


Research Methods
Desk / Secondary Research
While analysing the market, we extensively study secondary sources, directories, and databases to identify and collect information useful for this technical, market-oriented, and commercial report. Secondary sources that we utilize are not only the public sources, but it is a combination of Open Source, Associations, Paid Databases, MG Repository & Knowledgebase, and others.
- Company websites, annual reports, financial reports, broker reports, and investor presentations
- National government documents, statistical databases and reports
- News articles, press releases and web-casts specific to the companies operating in the market, Magazines, reports, and others
- We gather information from commercial data sources for deriving company specific data such as segmental revenue, share for geography, product revenue, and others
- Internal and external proprietary databases (industry-specific), relevant patent, and regulatory databases
- Governing Bodies, Government Organizations
- Relevant Authorities, Country-specific Associations for Industries
We also employ the model mapping approach to estimate the product level market data through the players' product portfolio
Primary Research
Primary research/ interviews is vital in analyzing the market. Most of the cases involves paid primary interviews. Primary sources include primary interviews through e-mail interactions, telephonic interviews, surveys as well as face-to-face interviews with the different stakeholders across the value chain including several industry experts.
| Type of Respondents | Number of Primaries |
|---|---|
| Tier 2/3 Suppliers | ~20 |
| Tier 1 Suppliers | ~25 |
| End-users | ~25 |
| Industry Expert/ Panel/ Consultant | ~30 |
| Total | ~100 |
MG Knowledgebase
• Repository of industry blog, newsletter and case studies
• Online platform covering detailed market reports, and company profiles
Forecasting Factors and Models
Forecasting Factors
- Historical Trends – Past market patterns, cycles, and major events that shaped how markets behave over time. Understanding past trends helps predict future behavior.
- Industry Factors – Specific characteristics of the industry like structure, regulations, and innovation cycles that affect market dynamics.
- Macroeconomic Factors – Economic conditions like GDP growth, inflation, and employment rates that affect how much money people have to spend.
- Demographic Factors – Population characteristics like age, income, and location that determine who can buy your product.
- Technology Factors – How quickly people adopt new technology and how much technology infrastructure exists.
- Regulatory Factors – Government rules, laws, and policies that can help or restrict market growth.
- Competitive Factors – Analyzing competition structure such as degree of competition and bargaining power of buyers and suppliers.
Forecasting Models / Techniques
Multiple Regression Analysis
- Identify and quantify factors that drive market changes
- Statistical modeling to establish relationships between market drivers and outcomes
Time Series Analysis – Seasonal Patterns
- Understand regular cyclical patterns in market demand
- Advanced statistical techniques to separate trend, seasonal, and irregular components
Time Series Analysis – Trend Analysis
- Identify underlying market growth patterns and momentum
- Statistical analysis of historical data to project future trends
Expert Opinion – Expert Interviews
- Gather deep industry insights and contextual understanding
- In-depth interviews with key industry stakeholders
Multi-Scenario Development
- Prepare for uncertainty by modeling different possible futures
- Creating optimistic, pessimistic, and most likely scenarios
Time Series Analysis – Moving Averages
- Sophisticated forecasting for complex time series data
- Auto-regressive integrated moving average models with seasonal components
Econometric Models
- Apply economic theory to market forecasting
- Sophisticated economic models that account for market interactions
Expert Opinion – Delphi Method
- Harness collective wisdom of industry experts
- Structured, multi-round expert consultation process
Monte Carlo Simulation
- Quantify uncertainty and probability distributions
- Thousands of simulations with varying input parameters
Research Analysis
Our research framework is built upon the fundamental principle of validating market intelligence from both demand and supply perspectives. This dual-sided approach ensures comprehensive market understanding and reduces the risk of single-source bias.
Demand-Side Analysis: We understand end-user/application behavior, preferences, and market needs along with the penetration of the product for specific application.
Supply-Side Analysis: We estimate overall market revenue, analyze the segmental share along with industry capacity, competitive landscape, and market structure.
Validation & Evaluation
Data triangulation is a validation technique that uses multiple methods, sources, or perspectives to examine the same research question, thereby increasing the credibility and reliability of research findings. In market research, triangulation serves as a quality assurance mechanism that helps identify and minimize bias, validate assumptions, and ensure accuracy in market estimates.
- Data Source Triangulation – Using multiple data sources to examine the same phenomenon
- Methodological Triangulation – Using multiple research methods to study the same research question
- Investigator Triangulation – Using multiple researchers or analysts to examine the same data
- Theoretical Triangulation – Using multiple theoretical perspectives to interpret the same data

Custom Market Research Services
We will customise the research for you, in case the report listed above does not meet your requirements.
Get 10% Free Customisation