Floating Solar Market Size, Share & Trends Analysis Report by Type (Stationary Floating Solar Systems, Tracking Floating Solar Systems), Capacity, Component, Technology, Connectivity, Location, Installation Type, Structure Type, Panel Type, Application/ Installation Site, End-Use Industry and Geography (North America, Europe, Asia Pacific, Middle East, Africa, and South America) – Global Industry Data, Trends, and Forecasts, 2026–2035
|
Market Structure & Evolution |
|
|
Segmental Data Insights |
|
|
Demand Trends |
|
|
Competitive Landscape |
|
|
Strategic Development |
|
|
Future Outlook & Opportunities |
|
Floating Solar Market Size, Share, and Growth
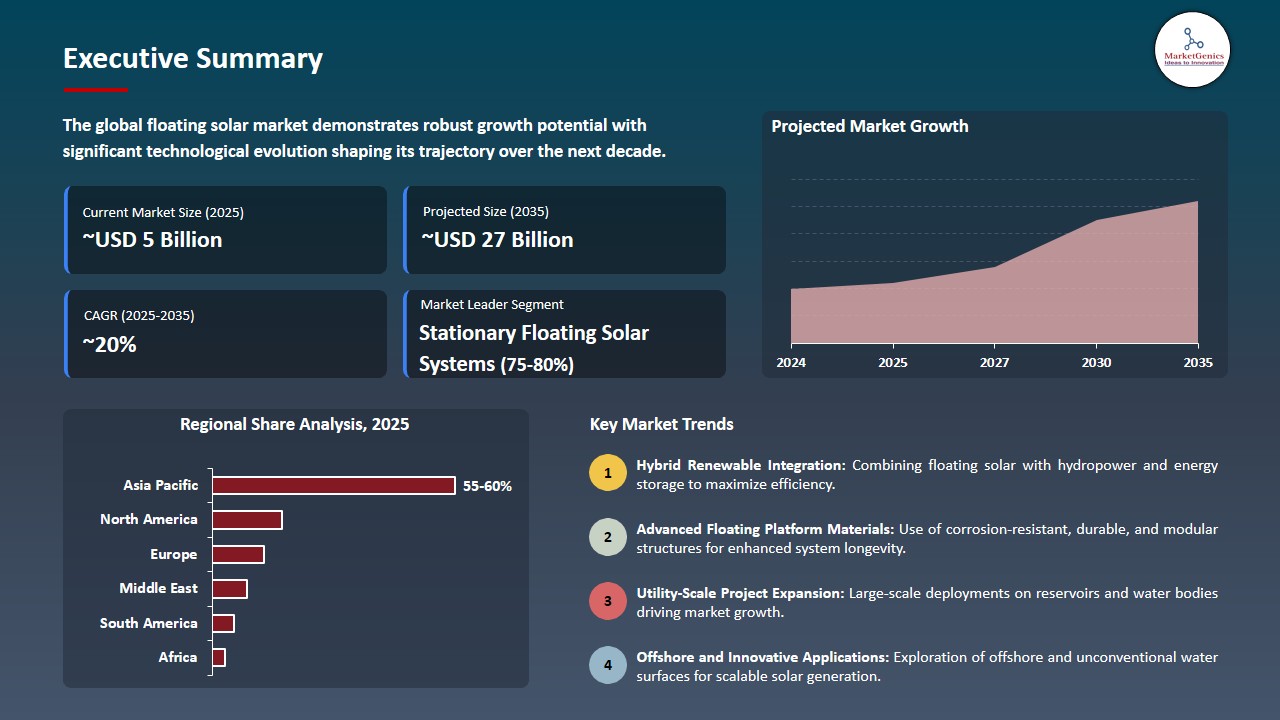
The global floating solar market is experiencing robust growth, with its estimated value of USD 4.6 billion in the year 2025 and USD 27.1 billion by 2035, registering a CAGR of 19.5% during the forecast period. The global floating solar market is expanding rapidly worldwide because multiple factors which include large-scale renewable energy adoption and floating photovoltaic system technological advancements drive market growth.
Lionel Yap who serves as Renewable Energy Regional Manager for JJ-LAPP explained that their partnership to develop floating solar technology will speed up the establishment of sustainable energy systems throughout important markets. The partnership between Tonking New Energy and our company will enable us to implement efficient clean energy solutions through our distribution network.
Governments and utilities are turning to water-based solar installations to harness renewable energy without the need for additional land acquisition which enhances project feasibility and accelerates deployment. The Uttar Pradesh authorities approved a 20 MW floating solar plant at Chilua Tal near Gorakhpur which uses water surfaces to produce clean energy that meets local energy needs.
Technological innovations are also boosting market momentum. Manufacturers have developed advanced floating platforms through their research efforts which resulted in new materials development and UV and corrosion resistant flotation systems creation and modular design systems that simplify installation and maintenance and improve system durability. Floating solar systems achieve reliable performance through their advancements which enable operation in diverse environmental conditions that range from calm reservoirs to challenging offshore waters.
Utility-scale projects show increasing investment through their expanding project pipeline. The 145 MW floating solar plant at Cirata in Indonesia achieved financial close during 2025 which became one of Southeast Asia's largest floating solar installations and demonstrated the worldwide transition towards scalable renewable energy infrastructure development.
The market potential of the business expands through adjacent opportunities which include hybrid floating-hydro systems and durable materials and integrated energy solutions. The developers use these innovations to create clean energy solutions which deliver efficiency and resilience and cost savings to their clients while supporting worldwide adoption of low-carbon energy systems.
Floating Solar Market Dynamics and Trends
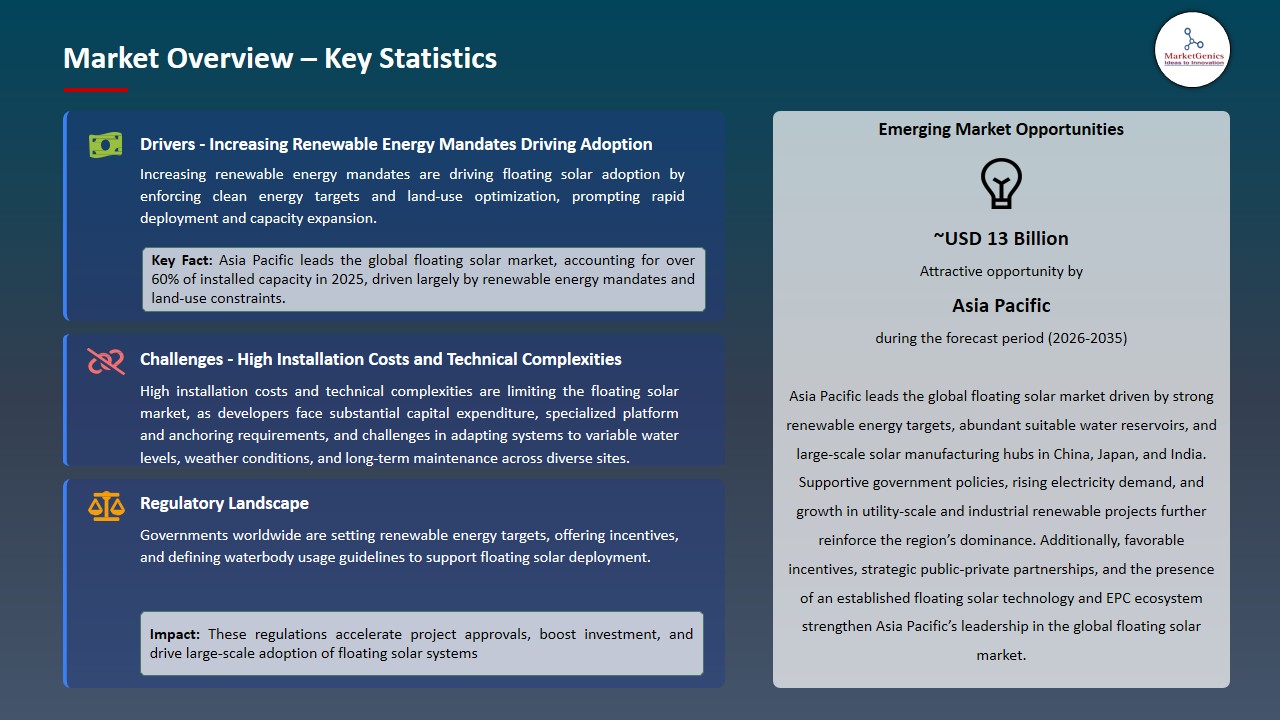
Driver: Increasing Renewable Energy Mandates Driving Adoption of Floating Solar Systems
-
The worldwide floating solar market experiences growth because governments implement stricter renewable energy targets while establishing policies that support this technology, which enables them to achieve their decarbonization targets while building renewable energy capacity with minimal land requirements.
- The use of floating solar technology enables better resource management of underused waterways which include reservoirs and lakes, thus helping to solve land availability problems that arise in urban areas with high population density. Government incentives such as feed-in tariffs and tax credits and simplified permitting procedures throughout Asia Pacific and Europe and North America create an environment that speeds up floating solar project approvals while attracting private sector funding.
- The utility-scale and hybrid renewable project industry shows increased market acceptance of floating solar technology which helps to meet energy needs while decreasing environmental effects through its implementation into mixed clean energy systems that include hydropower and energy storage solutions. All these factors are likely to continue to escalate the growth of the floating solar market.
Restraint: High Installation Costs and Technical Complexities Limiting Adoption
-
Floating solar systems are in high demand, but their widespread deployment is challenging due to higher upfront installation and maintenance costs when compared with conventional solar technologies installed directly onto the ground. The use of specialized floating structures, corrosion-proof materials, and anchoring systems contributes to much greater capital expenditure and project development complexity.
- The technical challenges associated with developing systems that are designed to tolerate variable water level fluctuations, weather fluctuations and biofouling add to project operations costs and requirement for highly skilled individuals, making it unattractive for smaller developers and investors operating in low-cost markets.
- Additional environmental and permitting challenges can cause lengthy delays to project schedules and increase costs, including aquatic ecosystem impact assessments and extensive regulatory scrutiny with respect to appropriate use of waterbodies. All these elements are expected to restrict the expansion of the floating solar market.
Opportunity: Expansion in Utility‑Scale and Industrial Renewable Projects
-
Floating solar is being rapidly expanded into utility scale renewable energy projects due to many industrial decarbonization efforts and rapid expansion of utility scale renewables. This expansion presents significant opportunities for floating solar as deployment areas are available where there is no more land for traditional solar (due to limited resources).
- Floating solar is now being explored by many emerging economies in Southeast Asia, Latin America and Africa as a way of expanding energy access while using less fossil fuel and taking advantage of existing large reservoirs and irrigation systems.
- Additionally, the ability to meet water management goals (i.e. by reducing the amount of water that evaporates from existing dams and/or reservoirs), provides additional justification for floating solar as both an energy production project and a means of conserving some amount of water. All these advancements are likely to create more opportunities in future for floating solar market.
Key Trend: Technological Innovation and Hybrid Renewable Integration
-
There have been many advancements in terms of the efficiency of photovoltaics and the materials used for floating platforms such as HDPE (high-density polyethylene) along with new anchor systems that are being introduced into the marketplace, all improving system performance, durability, and cost.
- Hybrid combinations of float-mounted solar energy with hydropower and energy storage systems are becoming more viable in order to improve grid stability while utilizing existing infrastructure at its maximum capacity.
- Several new pilot programs are being established in offshore locations to develop speculative modular designs that will decrease installation complexity and increase scalability will show that the floating solar market is progressing to much broader applications beyond inland freshwater locations, such as brackish or saltwater bodies. All these elements are expected to influence significant trends in the floating solar market.
Floating Solar Market Analysis and Segmental Data
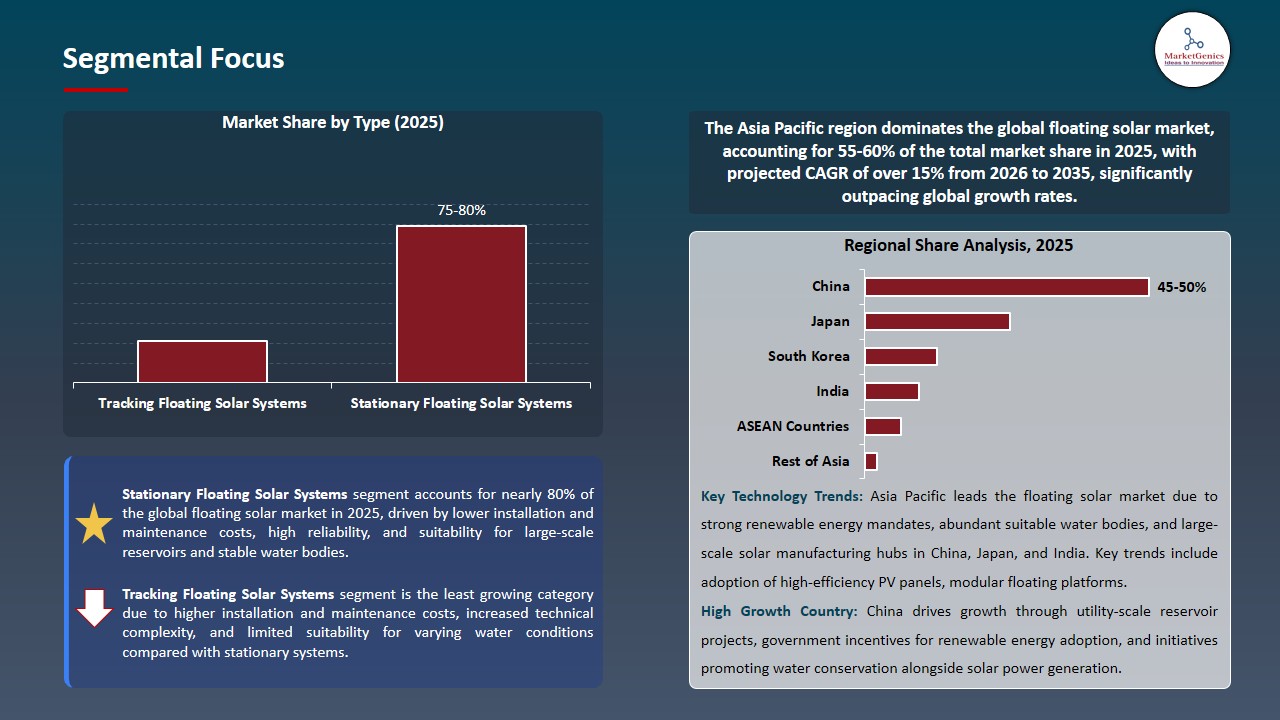
Stationary Floating Solar Systems Dominates Global Floating Solar Market amid Rising Renewable Energy Demand and Technological Advancements
-
Attributed to the increasing global demand for renewable energy and improved technology, stationary floating solar systems are becoming the dominant technology in the worldwide floating solar market. They are cheaper to produce and install than tracking systems; therefore, they have lower operating costs and maintenance needs compared to tracking systems.
- Additionally, they can be successfully used on large bodies of stable water such as lakes and reservoirs because of the stabilizing effect of the water, and they will produce more energy because the water cools the solar systems.
- The technology for fixed floating solar systems is well-established, and the installation cost for a utility-scale fixed floating solar system is considerably cheaper than for tracking systems; this is evident in the significant new deployment of fixed floating solar systems in major reservoirs in Asia Pacific reported in recent news releases, which solidifies stationary floating solar systems position as an industry leader within the floating solar market.
Asia Pacific Dominates Floating Solar Market amid Rapid Renewable Energy Expansion and Favorable Government Policies
-
The floating solar market in the Asia Pacific region leads the industry because Asian countries develop clean energy solutions to meet growing electricity needs while avoiding land use conflicts. The combination of strong policy backing and high financial support has fast-tracked floating solar system installation across China Japan India Indonesia and Vietnam while Asia Pacific will emerge as the primary driver of worldwide capacity expansion during the next ten years.
- The region demonstrates its dedication to sustainable energy objectives through its commitment to develop new solutions and build more utility-scale facilities which receive backing from both public and private sectors, according to market expansion forecasts and rising hybrid renewable energy system adoption. The region's continual strengthening is current global leadership in floating solar market.
Floating Solar Market Ecosystem
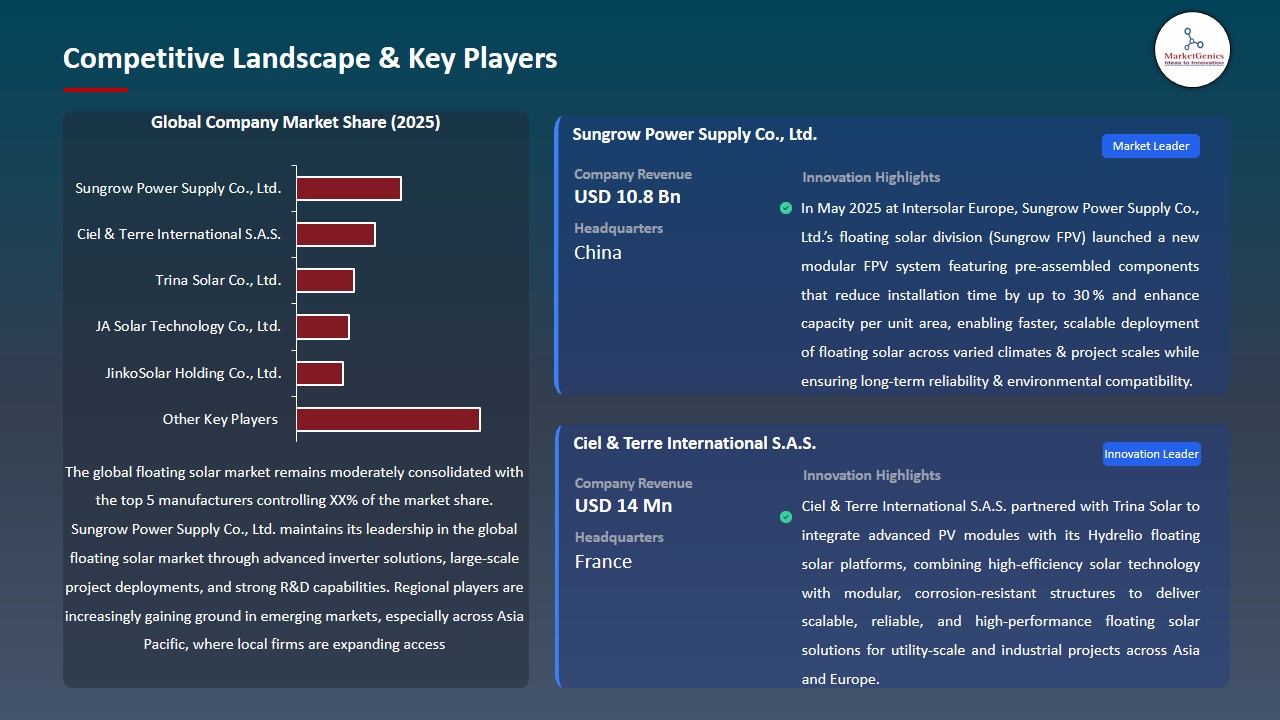
The global floating solar market is moderately consolidated, with Tier‑1 players like Sungrow Power, Ciel & Terre, Trina Solar, and JA Solar dominating globally, while Tier‑2 and Tier‑3 firms such as Vikram Solar and Sharp compete regionally with niche offerings.
The critical value chain aspects of this business operation involve the production of floating platforms and anchoring systems and the execution of EPC project delivery, which create value through their technological advancements and operational execution. The recent example of KPI Green Energy acquiring a 142 MW floating solar EPC contract from GSECL in India demonstrates the strategic value of EPC operations.
Recent Development and Strategic Overview:
-
In November 2025, Ciel & Terre introduced its innovative rail-based floating solar system called WattRack which utilizes modular platforms to create adaptable systems that enable various water body installations and maintenance procedures. The new system allows for project execution to happen faster while guaranteeing better energy production results throughout its lifespan without needing additional land use, which shows how the market now prefers floating solutions that customers can easily use.
- In November 2025, Indonesia started building a 92-megawatt floating solar power facility at the Saguling Reservoir located in West Java, which uses fixed floating solar systems to optimize water surface area for extensive clean energy production. The project demonstrates how fixed floating systems deliver practical renewable energy solutions which need minimal maintenance to achieve high energy production capacity, thus enabling faster growth of energy technologies in developing markets.
Report Scope
|
Attribute |
Detail |
|
Market Size in 2025 |
USD 4.6 Bn |
|
Market Forecast Value in 2035 |
USD 27.1 Bn |
|
Growth Rate (CAGR) |
19.5% |
|
Forecast Period |
2026 – 2035 |
|
Historical Data Available for |
2021 – 2024 |
|
Market Size Units |
USD Bn for Value Thousand Units for Volume |
|
Report Format |
Electronic (PDF) + Excel |
|
Regions and Countries Covered |
|||||
|
North America |
Europe |
Asia Pacific |
Middle East |
Africa |
South America |
|
|
|
|
|
|
|
Companies Covered |
|||||
|
|
|
|
|
|
Floating Solar Market Segmentation and Highlights
|
Segment |
Sub-segment |
|
Floating Solar Market, By Type |
|
|
Floating Solar Market, By Capacity |
|
|
Floating Solar Market, By Component |
|
|
Floating Solar Market, By Technology |
|
|
Floating Solar Market, By Connectivity |
|
|
Floating Solar Market, By Location |
|
|
Floating Solar Market, By Installation Type |
|
|
Floating Solar Market, By Structure Type |
|
|
Floating Solar Market, By Panel Type |
|
|
Floating Solar Market, By Application/ Installation Site |
|
|
Floating Solar Market, By End-Use Industry |
|
Frequently Asked Questions
Table of Contents
- 1. Research Methodology and Assumptions
- 1.1. Definitions
- 1.2. Research Design and Approach
- 1.3. Data Collection Methods
- 1.4. Base Estimates and Calculations
- 1.5. Forecasting Models
- 1.5.1. Key Forecast Factors & Impact Analysis
- 1.6. Secondary Research
- 1.6.1. Open Sources
- 1.6.2. Paid Databases
- 1.6.3. Associations
- 1.7. Primary Research
- 1.7.1. Primary Sources
- 1.7.2. Primary Interviews with Stakeholders across Ecosystem
- 2. Executive Summary
- 2.1. Global Floating Solar Market Outlook
- 2.1.1. Floating Solar Market Size (Volume – Thousand Units and Value – US$ Bn), and Forecasts, 2021-2035
- 2.1.2. Compounded Annual Growth Rate Analysis
- 2.1.3. Growth Opportunity Analysis
- 2.1.4. Segmental Share Analysis
- 2.1.5. Geographical Share Analysis
- 2.2. Market Analysis and Facts
- 2.3. Supply-Demand Analysis
- 2.4. Competitive Benchmarking
- 2.5. Go-to- Market Strategy
- 2.5.1. Customer/ End-use Industry Assessment
- 2.5.2. Growth Opportunity Data, 2026-2035
- 2.5.2.1. Regional Data
- 2.5.2.2. Country Data
- 2.5.2.3. Segmental Data
- 2.5.3. Identification of Potential Market Spaces
- 2.5.4. GAP Analysis
- 2.5.5. Potential Attractive Price Points
- 2.5.6. Prevailing Market Risks & Challenges
- 2.5.7. Preferred Sales & Marketing Strategies
- 2.5.8. Key Recommendations and Analysis
- 2.5.9. A Way Forward
- 2.1. Global Floating Solar Market Outlook
- 3. Industry Data and Premium Insights
- 3.1. Global Energy & Power Industry Overview, 2025
- 3.1.1. Energy & Power Industry Analysis
- 3.1.2. Key Trends for Energy & Power Industry
- 3.1.3. Regional Distribution for Energy & Power Industry
- 3.2. Supplier Customer Data
- 3.3. Technology Roadmap and Developments
- 3.4. Trade Analysis
- 3.4.1. Import & Export Analysis, 2025
- 3.4.2. Top Importing Countries
- 3.4.3. Top Exporting Countries
- 3.5. Trump Tariff Impact Analysis
- 3.5.1. Manufacturer
- 3.5.1.1. Based on the component & Raw material
- 3.5.2. Supply Chain
- 3.5.3. End Consumer
- 3.5.1. Manufacturer
- 3.6. Raw Material Analysis
- 3.1. Global Energy & Power Industry Overview, 2025
- 4. Market Overview
- 4.1. Market Dynamics
- 4.1.1. Drivers
- 4.1.1.1. Rising renewable energy targets and decarbonization goals are accelerating floating solar adoption globally.
- 4.1.1.2. Land scarcity and availability of underutilized water bodies are driving deployment of water-based solar systems.
- 4.1.1.3. Advancements in floating platform technology and hybrid solar-hydro integration are improving efficiency and scalability.
- 4.1.2. Restraints
- 4.1.2.1. High installation and maintenance costs compared to ground-mounted solar limit widespread adoption.
- 4.1.2.2. Technical complexities related to anchoring, water variability, and environmental conditions pose challenges.
- 4.1.1. Drivers
- 4.2. Key Trend Analysis
- 4.3. Regulatory Framework
- 4.3.1. Key Regulations, Norms, and Subsidies, by Key Countries
- 4.3.2. Tariffs and Standards
- 4.3.3. Impact Analysis of Regulations on the Market
- 4.4. Value Chain Analysis
- 4.4.1. Identify Activities
- 4.4.2. Analyze Value and Costs
- 4.4.3. Benchmark Performance
- 4.4.4. Optimize and Innovate
- 4.4.5. Evaluate Customer Value
- 4.5. Cost Structure Analysis
- 4.5.1. Parameter’s Share for Cost Associated
- 4.5.2. COGP vs COGS
- 4.5.3. Profit Margin Analysis
- 4.6. Pricing Analysis
- 4.6.1. Regional Pricing Analysis
- 4.6.2. Segmental Pricing Trends
- 4.6.3. Factors Influencing Pricing
- 4.7. Porter’s Five Forces Analysis
- 4.8. PESTEL Analysis
- 4.9. Global Floating Solar Market Demand
- 4.9.1. Historical Market Size – Volume (Thousand Units) & Value (US$ Bn), 2020-2024
- 4.9.2. Current and Future Market Size – Volume (Thousand Units) & Value (US$ Bn), 2026–2035
- 4.9.2.1. Y-o-Y Growth Trends
- 4.9.2.2. Absolute $ Opportunity Assessment
- 4.1. Market Dynamics
- 5. Competition Landscape
- 5.1. Competition structure
- 5.1.1. Fragmented v/s consolidated
- 5.2. Company Share Analysis, 2025
- 5.2.1. Global Company Market Share
- 5.2.2. By Region
- 5.2.2.1. North America
- 5.2.2.2. Europe
- 5.2.2.3. Asia Pacific
- 5.2.2.4. Middle East
- 5.2.2.5. Africa
- 5.2.2.6. South America
- 5.3. Product Comparison Matrix
- 5.3.1. Specifications
- 5.3.2. Market Positioning
- 5.3.3. Pricing
- 5.1. Competition structure
- 6. Global Floating Solar Market Analysis, by Type
- 6.1. Key Segment Analysis
- 6.2. Floating Solar Market Size (Volume – Thousand Units and Value – US$ Bn), Analysis, and Forecasts, by Type, 2021-2035
- 6.2.1. Stationary Floating Solar Systems
- 6.2.2. Tracking Floating Solar Systems
- 7. Global Floating Solar Market Analysis, by Capacity
- 7.1. Key Segment Analysis
- 7.2. Floating Solar Market Size (Volume – Thousand Units and Value – US$ Bn), Analysis, and Forecasts, by Capacity, 2021-2035
- 7.2.1. Up to 500 kW
- 7.2.2. 500 kW – 1 MW
- 7.2.3. 1 MW – 5 MW
- 7.2.4. Above 5 MW
- 8. Global Floating Solar Market Analysis, by Component
- 8.1. Key Segment Analysis
- 8.2. Floating Solar Market Size (Volume – Thousand Units and Value – US$ Bn), Analysis, and Forecasts, by Component, 2021-2035
- 8.2.1. Photovoltaic (PV) Modules
- 8.2.2. Floating Structures (Pontoons/Floaters)
- 8.2.3. Inverters
- 8.2.4. Mooring & Anchoring Systems
- 8.2.5. Electrical Components (Cables, Connectors, Transformers)
- 8.2.6. Others
- 9. Global Floating Solar Market Analysis, by Technology
- 9.1. Key Segment Analysis
- 9.2. Floating Solar Market Size (Value – US$ Bn), Analysis, and Forecasts, by Technology, 2021-2035
- 9.2.1. Photovoltaic (PV)
- 9.2.2. Concentrated Photovoltaics (CPV)
- 9.2.3. Concentrated Solar Power (CSP)
- 9.2.4. Others
- 10. Global Floating Solar Market Analysis, by Connectivity
- 10.1. Key Segment Analysis
- 10.2. Floating Solar Market Size (Volume – Thousand Units and Value – US$ Bn), Analysis, and Forecasts, by Connectivity, 2021-2035
- 10.2.1. On-Grid Systems
- 10.2.2. Off-Grid Systems
- 11. Global Floating Solar Market Analysis, by Location
- 11.1. Key Segment Analysis
- 11.2. Floating Solar Market Size (Volume – Thousand Units and Value – US$ Bn), Analysis, and Forecasts, by Location, 2021-2035
- 11.2.1. Inland Water Bodies
- 11.2.2. Offshore/ Coastal Water Bodies
- 12. Global Floating Solar Market Analysis, by Installation Type
- 12.1. Key Segment Analysis
- 12.2. Floating Solar Market Size (Volume – Thousand Units and Value – US$ Bn), Analysis, and Forecasts, by Installation Type, 2021-2035
- 12.2.1. New Installations
- 12.2.2. Retrofitting Existing Water Bodies
- 13. Global Floating Solar Market Analysis and Forecasts, by Structure Type
- 13.1. Key Findings
- 13.2. Floating Solar Market Size (Volume – Thousand Units and Value – US$ Bn), Analysis, and Forecasts, by Structure Type, 2021-2035
- 13.2.1. Fixed Tilt Structures
- 13.2.2. Tracking Structures
- 14. Global Floating Solar Market Analysis and Forecasts, by Panel Type
- 14.1. Key Findings
- 14.2. Floating Solar Market Size (Volume – Thousand Units and Value – US$ Bn), Analysis, and Forecasts, by Panel Type, 2021-2035
- 14.2.1. Monocrystalline
- 14.2.2. Polycrystalline
- 14.2.3. Thin Film
- 15. Global Floating Solar Market Analysis and Forecasts, by Application/ Installation Site
- 15.1. Key Findings
- 15.2. Floating Solar Market Size (Volume – Thousand Units and Value – US$ Bn), Analysis, and Forecasts, by Application/ Installation Site, 2021-2035
- 15.2.1. Hydropower Reservoirs
- 15.2.2. Irrigation Ponds
- 15.2.3. Water Treatment Plants
- 15.2.4. Industrial Water Bodies
- 15.2.5. Lakes & Natural Water Bodies
- 15.2.6. Coastal Areas
- 15.2.7. Others
- 16. Global Floating Solar Market Analysis and Forecasts, by End-Use Industry
- 16.1. Key Findings
- 16.2. Floating Solar Market Size (Volume – Thousand Units and Value – US$ Bn), Analysis, and Forecasts, by Panel Type, 2021-2035
- 16.2.1. Utility
- 16.2.2. Commercial
- 16.2.3. Industrial
- 17. Global Floating Solar Market Analysis and Forecasts, by Region
- 17.1. Key Findings
- 17.2. Floating Solar Market Size (Volume – Thousand Units and Value – US$ Bn), Analysis, and Forecasts, by Region, 2021-2035
- 17.2.1. North America
- 17.2.2. Europe
- 17.2.3. Asia Pacific
- 17.2.4. Middle East
- 17.2.5. Africa
- 17.2.6. South America
- 18. North America Floating Solar Market Analysis
- 18.1. Key Segment Analysis
- 18.2. Regional Snapshot
- 18.3. North America Floating Solar Market Size (Volume – Thousand Units and Value – US$ Bn), Analysis, and Forecasts, 2021-2035
- 18.3.1. Type
- 18.3.2. Capacity
- 18.3.3. Component
- 18.3.4. Technology
- 18.3.5. Connectivity
- 18.3.6. Location
- 18.3.7. Installation Type
- 18.3.8. Structure Type
- 18.3.9. Panel Type
- 18.3.10. Application/ Installation Site
- 18.3.11. End-Use Industry
- 18.3.12. Country
- 18.3.12.1. USA
- 18.3.12.2. Canada
- 18.3.12.3. Mexico
- 18.4. USA Floating Solar Market
- 18.4.1. Country Segmental Analysis
- 18.4.2. Type
- 18.4.3. Capacity
- 18.4.4. Component
- 18.4.5. Technology
- 18.4.6. Connectivity
- 18.4.7. Location
- 18.4.8. Installation Type
- 18.4.9. Structure Type
- 18.4.10. Panel Type
- 18.4.11. Application/ Installation Site
- 18.4.12. End-Use Industry
- 18.5. Canada Floating Solar Market
- 18.5.1. Country Segmental Analysis
- 18.5.2. Type
- 18.5.3. Capacity
- 18.5.4. Component
- 18.5.5. Technology
- 18.5.6. Connectivity
- 18.5.7. Location
- 18.5.8. Installation Type
- 18.5.9. Structure Type
- 18.5.10. Panel Type
- 18.5.11. Application/ Installation Site
- 18.5.12. End-Use Industry
- 18.6. Mexico Floating Solar Market
- 18.6.1. Country Segmental Analysis
- 18.6.2. Type
- 18.6.3. Capacity
- 18.6.4. Component
- 18.6.5. Technology
- 18.6.6. Connectivity
- 18.6.7. Location
- 18.6.8. Installation Type
- 18.6.9. Structure Type
- 18.6.10. Panel Type
- 18.6.11. Application/ Installation Site
- 18.6.12. End-Use Industry
- 19. Europe Floating Solar Market Analysis
- 19.1. Key Segment Analysis
- 19.2. Regional Snapshot
- 19.3. Europe Floating Solar Market Size (Volume – Thousand Units and Value – US$ Bn), Analysis, and Forecasts, 2021-2035
- 19.3.1. Type
- 19.3.2. Capacity
- 19.3.3. Component
- 19.3.4. Technology
- 19.3.5. Connectivity
- 19.3.6. Location
- 19.3.7. Installation Type
- 19.3.8. Structure Type
- 19.3.9. Panel Type
- 19.3.10. Application/ Installation Site
- 19.3.11. End-Use Industry
- 19.3.12. Country
- 19.3.12.1. Germany
- 19.3.12.2. United Kingdom
- 19.3.12.3. France
- 19.3.12.4. Italy
- 19.3.12.5. Spain
- 19.3.12.6. Netherlands
- 19.3.12.7. Nordic Countries
- 19.3.12.8. Poland
- 19.3.12.9. Russia & CIS
- 19.3.12.10. Rest of Europe
- 19.4. Germany Floating Solar Market
- 19.4.1. Country Segmental Analysis
- 19.4.2. Type
- 19.4.3. Capacity
- 19.4.4. Component
- 19.4.5. Technology
- 19.4.6. Connectivity
- 19.4.7. Location
- 19.4.8. Installation Type
- 19.4.9. Structure Type
- 19.4.10. Panel Type
- 19.4.11. Application/ Installation Site
- 19.4.12. End-Use Industry
- 19.5. United Kingdom Floating Solar Market
- 19.5.1. Country Segmental Analysis
- 19.5.2. Type
- 19.5.3. Capacity
- 19.5.4. Component
- 19.5.5. Technology
- 19.5.6. Connectivity
- 19.5.7. Location
- 19.5.8. Installation Type
- 19.5.9. Structure Type
- 19.5.10. Panel Type
- 19.5.11. Application/ Installation Site
- 19.5.12. End-Use Industry
- 19.6. France Floating Solar Market
- 19.6.1. Country Segmental Analysis
- 19.6.2. Type
- 19.6.3. Capacity
- 19.6.4. Component
- 19.6.5. Technology
- 19.6.6. Connectivity
- 19.6.7. Location
- 19.6.8. Installation Type
- 19.6.9. Structure Type
- 19.6.10. Panel Type
- 19.6.11. Application/ Installation Site
- 19.6.12. End-Use Industry
- 19.7. Italy Floating Solar Market
- 19.7.1. Country Segmental Analysis
- 19.7.2. Type
- 19.7.3. Capacity
- 19.7.4. Component
- 19.7.5. Technology
- 19.7.6. Connectivity
- 19.7.7. Location
- 19.7.8. Installation Type
- 19.7.9. Structure Type
- 19.7.10. Panel Type
- 19.7.11. Application/ Installation Site
- 19.7.12. End-Use Industry
- 19.8. Spain Floating Solar Market
- 19.8.1. Country Segmental Analysis
- 19.8.2. Type
- 19.8.3. Capacity
- 19.8.4. Component
- 19.8.5. Technology
- 19.8.6. Connectivity
- 19.8.7. Location
- 19.8.8. Installation Type
- 19.8.9. Structure Type
- 19.8.10. Panel Type
- 19.8.11. Application/ Installation Site
- 19.8.12. End-Use Industry
- 19.9. Netherlands Floating Solar Market
- 19.9.1. Country Segmental Analysis
- 19.9.2. Type
- 19.9.3. Capacity
- 19.9.4. Component
- 19.9.5. Technology
- 19.9.6. Connectivity
- 19.9.7. Location
- 19.9.8. Installation Type
- 19.9.9. Structure Type
- 19.9.10. Panel Type
- 19.9.11. Application/ Installation Site
- 19.9.12. End-Use Industry
- 19.10. Nordic Countries Floating Solar Market
- 19.10.1. Country Segmental Analysis
- 19.10.2. Type
- 19.10.3. Capacity
- 19.10.4. Component
- 19.10.5. Technology
- 19.10.6. Connectivity
- 19.10.7. Location
- 19.10.8. Installation Type
- 19.10.9. Structure Type
- 19.10.10. Panel Type
- 19.10.11. Application/ Installation Site
- 19.10.12. End-Use Industry
- 19.11. Poland Floating Solar Market
- 19.11.1. Country Segmental Analysis
- 19.11.2. Type
- 19.11.3. Capacity
- 19.11.4. Component
- 19.11.5. Technology
- 19.11.6. Connectivity
- 19.11.7. Location
- 19.11.8. Installation Type
- 19.11.9. Structure Type
- 19.11.10. Panel Type
- 19.11.11. Application/ Installation Site
- 19.11.12. End-Use Industry
- 19.12. Russia & CIS Floating Solar Market
- 19.12.1. Country Segmental Analysis
- 19.12.2. Type
- 19.12.3. Capacity
- 19.12.4. Component
- 19.12.5. Technology
- 19.12.6. Connectivity
- 19.12.7. Location
- 19.12.8. Installation Type
- 19.12.9. Structure Type
- 19.12.10. Panel Type
- 19.12.11. Application/ Installation Site
- 19.12.12. End-Use Industry
- 19.13. Rest of Europe Floating Solar Market
- 19.13.1. Country Segmental Analysis
- 19.13.2. Type
- 19.13.3. Capacity
- 19.13.4. Component
- 19.13.5. Technology
- 19.13.6. Connectivity
- 19.13.7. Location
- 19.13.8. Installation Type
- 19.13.9. Structure Type
- 19.13.10. Panel Type
- 19.13.11. Application/ Installation Site
- 19.13.12. End-Use Industry
- 20. Asia Pacific Floating Solar Market Analysis
- 20.1. Key Segment Analysis
- 20.2. Regional Snapshot
- 20.3. Asia Pacific Floating Solar Market Size (Volume – Thousand Units and Value – US$ Bn), Analysis, and Forecasts, 2021-2035
- 20.3.1. Type
- 20.3.2. Capacity
- 20.3.3. Component
- 20.3.4. Technology
- 20.3.5. Connectivity
- 20.3.6. Location
- 20.3.7. Installation Type
- 20.3.8. Structure Type
- 20.3.9. Panel Type
- 20.3.10. Application/ Installation Site
- 20.3.11. End-Use Industry
- 20.3.12. Country
- 20.3.12.1. China
- 20.3.12.2. India
- 20.3.12.3. Japan
- 20.3.12.4. South Korea
- 20.3.12.5. Australia and New Zealand
- 20.3.12.6. Indonesia
- 20.3.12.7. Malaysia
- 20.3.12.8. Thailand
- 20.3.12.9. Vietnam
- 20.3.12.10. Rest of Asia Pacific
- 20.4. China Floating Solar Market
- 20.4.1. Country Segmental Analysis
- 20.4.2. Type
- 20.4.3. Capacity
- 20.4.4. Component
- 20.4.5. Technology
- 20.4.6. Connectivity
- 20.4.7. Location
- 20.4.8. Installation Type
- 20.4.9. Structure Type
- 20.4.10. Panel Type
- 20.4.11. Application/ Installation Site
- 20.4.12. End-Use Industry
- 20.5. India Floating Solar Market
- 20.5.1. Country Segmental Analysis
- 20.5.2. Type
- 20.5.3. Capacity
- 20.5.4. Component
- 20.5.5. Technology
- 20.5.6. Connectivity
- 20.5.7. Location
- 20.5.8. Installation Type
- 20.5.9. Structure Type
- 20.5.10. Panel Type
- 20.5.11. Application/ Installation Site
- 20.5.12. End-Use Industry
- 20.6. Japan Floating Solar Market
- 20.6.1. Country Segmental Analysis
- 20.6.2. Type
- 20.6.3. Capacity
- 20.6.4. Component
- 20.6.5. Technology
- 20.6.6. Connectivity
- 20.6.7. Location
- 20.6.8. Installation Type
- 20.6.9. Structure Type
- 20.6.10. Panel Type
- 20.6.11. Application/ Installation Site
- 20.6.12. End-Use Industry
- 20.7. South Korea Floating Solar Market
- 20.7.1. Country Segmental Analysis
- 20.7.2. Type
- 20.7.3. Capacity
- 20.7.4. Component
- 20.7.5. Technology
- 20.7.6. Connectivity
- 20.7.7. Location
- 20.7.8. Installation Type
- 20.7.9. Structure Type
- 20.7.10. Panel Type
- 20.7.11. Application/ Installation Site
- 20.7.12. End-Use Industry
- 20.8. Australia and New Zealand Floating Solar Market
- 20.8.1. Country Segmental Analysis
- 20.8.2. Type
- 20.8.3. Capacity
- 20.8.4. Component
- 20.8.5. Technology
- 20.8.6. Connectivity
- 20.8.7. Location
- 20.8.8. Installation Type
- 20.8.9. Structure Type
- 20.8.10. Panel Type
- 20.8.11. Application/ Installation Site
- 20.8.12. End-Use Industry
- 20.9. Indonesia Floating Solar Market
- 20.9.1. Country Segmental Analysis
- 20.9.2. Type
- 20.9.3. Capacity
- 20.9.4. Component
- 20.9.5. Technology
- 20.9.6. Connectivity
- 20.9.7. Location
- 20.9.8. Installation Type
- 20.9.9. Structure Type
- 20.9.10. Panel Type
- 20.9.11. Application/ Installation Site
- 20.9.12. End-Use Industry
- 20.10. Malaysia Floating Solar Market
- 20.10.1. Country Segmental Analysis
- 20.10.2. Type
- 20.10.3. Capacity
- 20.10.4. Component
- 20.10.5. Technology
- 20.10.6. Connectivity
- 20.10.7. Location
- 20.10.8. Installation Type
- 20.10.9. Structure Type
- 20.10.10. Panel Type
- 20.10.11. Application/ Installation Site
- 20.10.12. End-Use Industry
- 20.11. Thailand Floating Solar Market
- 20.11.1. Country Segmental Analysis
- 20.11.2. Type
- 20.11.3. Capacity
- 20.11.4. Component
- 20.11.5. Technology
- 20.11.6. Connectivity
- 20.11.7. Location
- 20.11.8. Installation Type
- 20.11.9. Structure Type
- 20.11.10. Panel Type
- 20.11.11. Application/ Installation Site
- 20.11.12. End-Use Industry
- 20.12. Vietnam Floating Solar Market
- 20.12.1. Country Segmental Analysis
- 20.12.2. Type
- 20.12.3. Capacity
- 20.12.4. Component
- 20.12.5. Technology
- 20.12.6. Connectivity
- 20.12.7. Location
- 20.12.8. Installation Type
- 20.12.9. Structure Type
- 20.12.10. Panel Type
- 20.12.11. Application/ Installation Site
- 20.12.12. End-Use Industry
- 20.13. Rest of Asia Pacific Floating Solar Market
- 20.13.1. Country Segmental Analysis
- 20.13.2. Type
- 20.13.3. Capacity
- 20.13.4. Component
- 20.13.5. Technology
- 20.13.6. Connectivity
- 20.13.7. Location
- 20.13.8. Installation Type
- 20.13.9. Structure Type
- 20.13.10. Panel Type
- 20.13.11. Application/ Installation Site
- 20.13.12. End-Use Industry
- 21. Middle East Floating Solar Market Analysis
- 21.1. Key Segment Analysis
- 21.2. Regional Snapshot
- 21.3. Middle East Floating Solar Market Size (Volume – Thousand Units and Value – US$ Bn), Analysis, and Forecasts, 2021-2035
- 21.3.1. Type
- 21.3.2. Capacity
- 21.3.3. Component
- 21.3.4. Technology
- 21.3.5. Connectivity
- 21.3.6. Location
- 21.3.7. Installation Type
- 21.3.8. Structure Type
- 21.3.9. Panel Type
- 21.3.10. Application/ Installation Site
- 21.3.11. End-Use Industry
- 21.3.12. Country
- 21.3.12.1. Turkey
- 21.3.12.2. UAE
- 21.3.12.3. Saudi Arabia
- 21.3.12.4. Israel
- 21.3.12.5. Rest of Middle East
- 21.4. Turkey Floating Solar Market
- 21.4.1. Country Segmental Analysis
- 21.4.2. Type
- 21.4.3. Capacity
- 21.4.4. Component
- 21.4.5. Technology
- 21.4.6. Connectivity
- 21.4.7. Location
- 21.4.8. Installation Type
- 21.4.9. Structure Type
- 21.4.10. Panel Type
- 21.4.11. Application/ Installation Site
- 21.4.12. End-Use Industry
- 21.5. UAE Floating Solar Market
- 21.5.1. Country Segmental Analysis
- 21.5.2. Type
- 21.5.3. Capacity
- 21.5.4. Component
- 21.5.5. Technology
- 21.5.6. Connectivity
- 21.5.7. Location
- 21.5.8. Installation Type
- 21.5.9. Structure Type
- 21.5.10. Panel Type
- 21.5.11. Application/ Installation Site
- 21.5.12. End-Use Industry
- 21.6. Saudi Arabia Floating Solar Market
- 21.6.1. Country Segmental Analysis
- 21.6.2. Type
- 21.6.3. Capacity
- 21.6.4. Component
- 21.6.5. Technology
- 21.6.6. Connectivity
- 21.6.7. Location
- 21.6.8. Installation Type
- 21.6.9. Structure Type
- 21.6.10. Panel Type
- 21.6.11. Application/ Installation Site
- 21.6.12. End-Use Industry
- 21.7. Israel Floating Solar Market
- 21.7.1. Country Segmental Analysis
- 21.7.2. Type
- 21.7.3. Capacity
- 21.7.4. Component
- 21.7.5. Technology
- 21.7.6. Connectivity
- 21.7.7. Location
- 21.7.8. Installation Type
- 21.7.9. Structure Type
- 21.7.10. Panel Type
- 21.7.11. Application/ Installation Site
- 21.7.12. End-Use Industry
- 21.8. Rest of Middle East Floating Solar Market
- 21.8.1. Country Segmental Analysis
- 21.8.2. Type
- 21.8.3. Capacity
- 21.8.4. Component
- 21.8.5. Technology
- 21.8.6. Connectivity
- 21.8.7. Location
- 21.8.8. Installation Type
- 21.8.9. Structure Type
- 21.8.10. Panel Type
- 21.8.11. Application/ Installation Site
- 21.8.12. End-Use Industry
- 22. Africa Floating Solar Market Analysis
- 22.1. Key Segment Analysis
- 22.2. Regional Snapshot
- 22.3. Africa Floating Solar Market Size (Volume – Thousand Units and Value – US$ Bn), Analysis, and Forecasts, 2021-2035
- 22.3.1. Type
- 22.3.2. Capacity
- 22.3.3. Component
- 22.3.4. Technology
- 22.3.5. Connectivity
- 22.3.6. Location
- 22.3.7. Installation Type
- 22.3.8. Structure Type
- 22.3.9. Panel Type
- 22.3.10. Application/ Installation Site
- 22.3.11. End-Use Industry
- 22.3.12. Country
- 22.3.12.1. South Africa
- 22.3.12.2. Egypt
- 22.3.12.3. Nigeria
- 22.3.12.4. Algeria
- 22.3.12.5. Rest of Africa
- 22.4. South Africa Floating Solar Market
- 22.4.1. Country Segmental Analysis
- 22.4.2. Type
- 22.4.3. Capacity
- 22.4.4. Component
- 22.4.5. Technology
- 22.4.6. Connectivity
- 22.4.7. Location
- 22.4.8. Installation Type
- 22.4.9. Structure Type
- 22.4.10. Panel Type
- 22.4.11. Application/ Installation Site
- 22.4.12. End-Use Industry
- 22.5. Egypt Floating Solar Market
- 22.5.1. Country Segmental Analysis
- 22.5.2. Type
- 22.5.3. Capacity
- 22.5.4. Component
- 22.5.5. Technology
- 22.5.6. Connectivity
- 22.5.7. Location
- 22.5.8. Installation Type
- 22.5.9. Structure Type
- 22.5.10. Panel Type
- 22.5.11. Application/ Installation Site
- 22.5.12. End-Use Industry
- 22.6. Nigeria Floating Solar Market
- 22.6.1. Country Segmental Analysis
- 22.6.2. Type
- 22.6.3. Capacity
- 22.6.4. Component
- 22.6.5. Technology
- 22.6.6. Connectivity
- 22.6.7. Location
- 22.6.8. Installation Type
- 22.6.9. Structure Type
- 22.6.10. Panel Type
- 22.6.11. Application/ Installation Site
- 22.6.12. End-Use Industry
- 22.7. Algeria Floating Solar Market
- 22.7.1. Country Segmental Analysis
- 22.7.2. Type
- 22.7.3. Capacity
- 22.7.4. Component
- 22.7.5. Technology
- 22.7.6. Connectivity
- 22.7.7. Location
- 22.7.8. Installation Type
- 22.7.9. Structure Type
- 22.7.10. Panel Type
- 22.7.11. Application/ Installation Site
- 22.7.12. End-Use Industry
- 22.8. Rest of Africa Floating Solar Market
- 22.8.1. Country Segmental Analysis
- 22.8.2. Type
- 22.8.3. Capacity
- 22.8.4. Component
- 22.8.5. Technology
- 22.8.6. Connectivity
- 22.8.7. Location
- 22.8.8. Installation Type
- 22.8.9. Structure Type
- 22.8.10. Panel Type
- 22.8.11. Application/ Installation Site
- 22.8.12. End-Use Industry
- 23. South America Floating Solar Market Analysis
- 23.1. Key Segment Analysis
- 23.2. Regional Snapshot
- 23.3. South America Floating Solar Market Size (Volume – Thousand Units and Value – US$ Bn), Analysis, and Forecasts, 2021-2035
- 23.3.1. Type
- 23.3.2. Capacity
- 23.3.3. Component
- 23.3.4. Technology
- 23.3.5. Connectivity
- 23.3.6. Location
- 23.3.7. Installation Type
- 23.3.8. Structure Type
- 23.3.9. Panel Type
- 23.3.10. Application/ Installation Site
- 23.3.11. End-Use Industry
- 23.3.12. Country
- 23.3.12.1. Brazil
- 23.3.12.2. Argentina
- 23.3.12.3. Rest of South America
- 23.4. Brazil Floating Solar Market
- 23.4.1. Country Segmental Analysis
- 23.4.2. Type
- 23.4.3. Capacity
- 23.4.4. Component
- 23.4.5. Technology
- 23.4.6. Connectivity
- 23.4.7. Location
- 23.4.8. Installation Type
- 23.4.9. Structure Type
- 23.4.10. Panel Type
- 23.4.11. Application/ Installation Site
- 23.4.12. End-Use Industry
- 23.5. Argentina Floating Solar Market
- 23.5.1. Country Segmental Analysis
- 23.5.2. Type
- 23.5.3. Capacity
- 23.5.4. Component
- 23.5.5. Technology
- 23.5.6. Connectivity
- 23.5.7. Location
- 23.5.8. Installation Type
- 23.5.9. Structure Type
- 23.5.10. Panel Type
- 23.5.11. Application/ Installation Site
- 23.5.12. End-Use Industry
- 23.6. Rest of South America Floating Solar Market
- 23.6.1. Country Segmental Analysis
- 23.6.2. Type
- 23.6.3. Capacity
- 23.6.4. Component
- 23.6.5. Technology
- 23.6.6. Connectivity
- 23.6.7. Location
- 23.6.8. Installation Type
- 23.6.9. Structure Type
- 23.6.10. Panel Type
- 23.6.11. Application/ Installation Site
- 23.6.12. End-Use Industry
- 24. Key Players/ Company Profile
- 24.1. Adtech Systems Limited
- 24.1.1. Company Details/ Overview
- 24.1.2. Company Financials
- 24.1.3. Key Customers and Competitors
- 24.1.4. Business/ Industry Portfolio
- 24.1.5. Product Portfolio/ Specification Details
- 24.1.6. Pricing Data
- 24.1.7. Strategic Overview
- 24.1.8. Recent Developments
- 24.2. Canadian Solar Inc.
- 24.3. Ciel & Terre International S.A.S.
- 24.4. First Solar, Inc.
- 24.5. Hanwha Solutions Corporation (Q CELLS)
- 24.6. JA Solar Technology Co., Ltd.
- 24.7. JinkoSolar Holding Co., Ltd.
- 24.8. KYOCERA Corporation
- 24.9. LONGi Green Energy Technology Co., Ltd.
- 24.10. Ocean Sun AS
- 24.11. Pristine Sun Corporation
- 24.12. Sharp Corporation
- 24.13. Sungrow Power Supply Co., Ltd.
- 24.14. Swimsol GmbH
- 24.15. Tata Power Solar Systems Ltd.
- 24.16. Trina Solar Co., Ltd.
- 24.17. Vikram Solar Limited
- 24.18. Waaree Energies Ltd.
- 24.19. Wuxi Suntech Power Co., Ltd.
- 24.20. Yellow Tropus Pvt. Ltd.
- 24.21. Other Key Players
- 24.1. Adtech Systems Limited
Note* - This is just tentative list of players. While providing the report, we will cover more number of players based on their revenue and share for each geography
Research Design
Our research design integrates both demand-side and supply-side analysis through a balanced combination of primary and secondary research methodologies. By utilizing both bottom-up and top-down approaches alongside rigorous data triangulation methods, we deliver robust market intelligence that supports strategic decision-making.
MarketGenics' comprehensive research design framework ensures the delivery of accurate, reliable, and actionable market intelligence. Through the integration of multiple research approaches, rigorous validation processes, and expert analysis, we provide our clients with the insights needed to make informed strategic decisions and capitalize on market opportunities.

MarketGenics leverages a dedicated industry panel of experts and a comprehensive suite of paid databases to effectively collect, consolidate, and analyze market intelligence.
Our approach has consistently proven to be reliable and effective in generating accurate market insights, identifying key industry trends, and uncovering emerging business opportunities.
Through both primary and secondary research, we capture and analyze critical company-level data such as manufacturing footprints, including technical centers, R&D facilities, sales offices, and headquarters.
Our expert panel further enhances our ability to estimate market size for specific brands based on validated field-level intelligence.
Our data mining techniques incorporate both parametric and non-parametric methods, allowing for structured data collection, sorting, processing, and cleaning.
Demand projections are derived from large-scale data sets analyzed through proprietary algorithms, culminating in robust and reliable market sizing.
Research Approach
The bottom-up approach builds market estimates by starting with the smallest addressable market units and systematically aggregating them to create comprehensive market size projections.
This method begins with specific, granular data points and builds upward to create the complete market landscape.
Customer Analysis → Segmental Analysis → Geographical Analysis
The top-down approach starts with the broadest possible market data and systematically narrows it down through a series of filters and assumptions to arrive at specific market segments or opportunities.
This method begins with the big picture and works downward to increasingly specific market slices.
TAM → SAM → SOM


Research Methods
Desk / Secondary Research
While analysing the market, we extensively study secondary sources, directories, and databases to identify and collect information useful for this technical, market-oriented, and commercial report. Secondary sources that we utilize are not only the public sources, but it is a combination of Open Source, Associations, Paid Databases, MG Repository & Knowledgebase, and others.
- Company websites, annual reports, financial reports, broker reports, and investor presentations
- National government documents, statistical databases and reports
- News articles, press releases and web-casts specific to the companies operating in the market, Magazines, reports, and others
- We gather information from commercial data sources for deriving company specific data such as segmental revenue, share for geography, product revenue, and others
- Internal and external proprietary databases (industry-specific), relevant patent, and regulatory databases
- Governing Bodies, Government Organizations
- Relevant Authorities, Country-specific Associations for Industries
We also employ the model mapping approach to estimate the product level market data through the players' product portfolio
Primary Research
Primary research/ interviews is vital in analyzing the market. Most of the cases involves paid primary interviews. Primary sources include primary interviews through e-mail interactions, telephonic interviews, surveys as well as face-to-face interviews with the different stakeholders across the value chain including several industry experts.
| Type of Respondents | Number of Primaries |
|---|---|
| Tier 2/3 Suppliers | ~20 |
| Tier 1 Suppliers | ~25 |
| End-users | ~25 |
| Industry Expert/ Panel/ Consultant | ~30 |
| Total | ~100 |
MG Knowledgebase
• Repository of industry blog, newsletter and case studies
• Online platform covering detailed market reports, and company profiles
Forecasting Factors and Models
Forecasting Factors
- Historical Trends – Past market patterns, cycles, and major events that shaped how markets behave over time. Understanding past trends helps predict future behavior.
- Industry Factors – Specific characteristics of the industry like structure, regulations, and innovation cycles that affect market dynamics.
- Macroeconomic Factors – Economic conditions like GDP growth, inflation, and employment rates that affect how much money people have to spend.
- Demographic Factors – Population characteristics like age, income, and location that determine who can buy your product.
- Technology Factors – How quickly people adopt new technology and how much technology infrastructure exists.
- Regulatory Factors – Government rules, laws, and policies that can help or restrict market growth.
- Competitive Factors – Analyzing competition structure such as degree of competition and bargaining power of buyers and suppliers.
Forecasting Models / Techniques
Multiple Regression Analysis
- Identify and quantify factors that drive market changes
- Statistical modeling to establish relationships between market drivers and outcomes
Time Series Analysis – Seasonal Patterns
- Understand regular cyclical patterns in market demand
- Advanced statistical techniques to separate trend, seasonal, and irregular components
Time Series Analysis – Trend Analysis
- Identify underlying market growth patterns and momentum
- Statistical analysis of historical data to project future trends
Expert Opinion – Expert Interviews
- Gather deep industry insights and contextual understanding
- In-depth interviews with key industry stakeholders
Multi-Scenario Development
- Prepare for uncertainty by modeling different possible futures
- Creating optimistic, pessimistic, and most likely scenarios
Time Series Analysis – Moving Averages
- Sophisticated forecasting for complex time series data
- Auto-regressive integrated moving average models with seasonal components
Econometric Models
- Apply economic theory to market forecasting
- Sophisticated economic models that account for market interactions
Expert Opinion – Delphi Method
- Harness collective wisdom of industry experts
- Structured, multi-round expert consultation process
Monte Carlo Simulation
- Quantify uncertainty and probability distributions
- Thousands of simulations with varying input parameters
Research Analysis
Our research framework is built upon the fundamental principle of validating market intelligence from both demand and supply perspectives. This dual-sided approach ensures comprehensive market understanding and reduces the risk of single-source bias.
Demand-Side Analysis: We understand end-user/application behavior, preferences, and market needs along with the penetration of the product for specific application.
Supply-Side Analysis: We estimate overall market revenue, analyze the segmental share along with industry capacity, competitive landscape, and market structure.
Validation & Evaluation
Data triangulation is a validation technique that uses multiple methods, sources, or perspectives to examine the same research question, thereby increasing the credibility and reliability of research findings. In market research, triangulation serves as a quality assurance mechanism that helps identify and minimize bias, validate assumptions, and ensure accuracy in market estimates.
- Data Source Triangulation – Using multiple data sources to examine the same phenomenon
- Methodological Triangulation – Using multiple research methods to study the same research question
- Investigator Triangulation – Using multiple researchers or analysts to examine the same data
- Theoretical Triangulation – Using multiple theoretical perspectives to interpret the same data

Custom Market Research Services
We will customise the research for you, in case the report listed above does not meet your requirements.
Get 10% Free Customisation