Industrial AR and VR Systems Market Size, Share & Trends Analysis Report by Offering (Hardware, Software, Services), Device Type, Technology, Deployment Mode, Enterprise Size, Connectivity, Application, Industry Vertical and Geography (North America, Europe, Asia Pacific, Middle East, Africa, and South America) – Global Industry Data, Trends, and Forecasts, 2026–2035
|
Market Structure & Evolution |
|
|
Segmental Data Insights |
|
|
Demand Trends |
|
|
Competitive Landscape |
|
|
Strategic Development |
|
|
Future Outlook & Opportunities |
|
Industrial AR and VR Systems Market Size, Share, and Growth
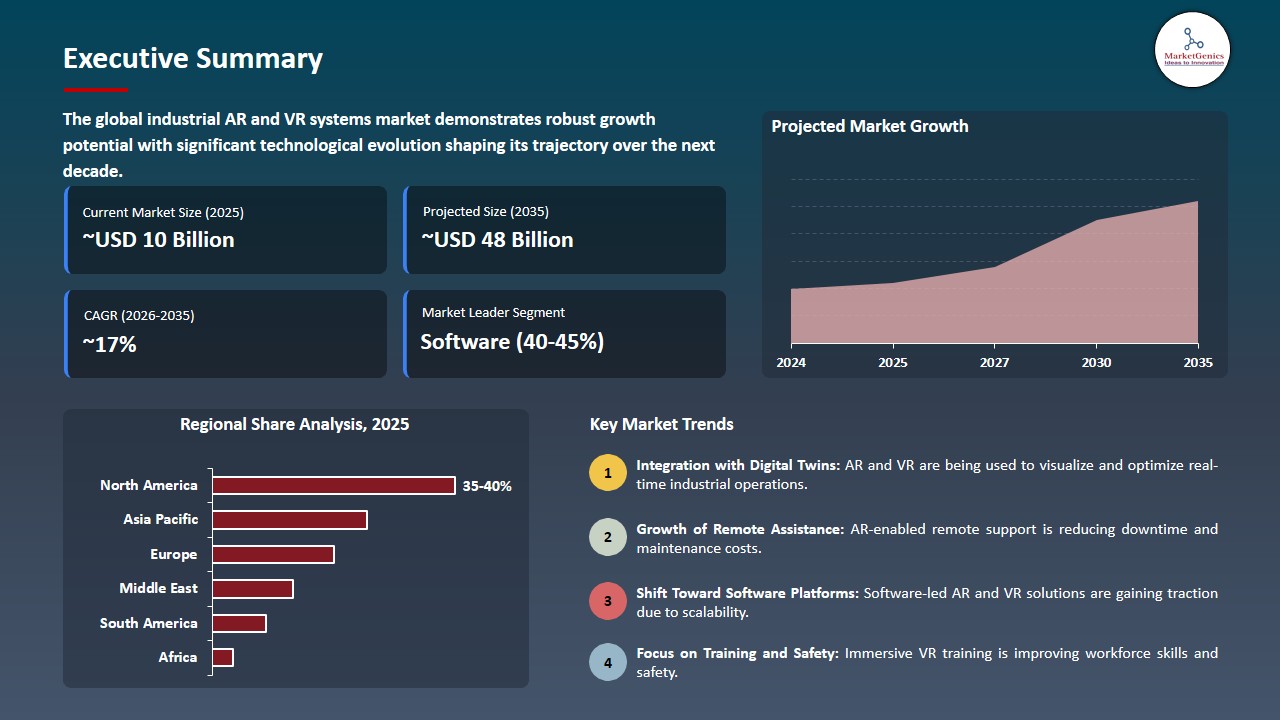
The global industrial AR and VR systems market is experiencing robust growth, with its estimated value of USD 9.8 billion in the year 2025 and USD 47.9 billion by 2035, registering a CAGR of 17.2% during the forecast period. There is a rapid expansion in the industrial AR and VR systems market.
Jim Heppelmann, CEO and President of PTC, remarked, “Augmented reality is likely to serve as the new interface connecting humans and machines.” He highlighted that industrial AR solutions are changing the way frontline workers engage with equipment, providing real-time assistance, enhancing service precision, and speeding up training procedures
These immersive technologies are reliable and efficient solutions for today's industrial sector and have received broad acceptance, with numerous examples of deployment in many industries. Notably, Siemens utilizing industrial AR and VR solutions for virtual commissioning, maintenance planning, and workforce training in many manufacturing companies to reduce machine downtime and improve accuracy in manufacturing.
Likewise, PTC also utilizes its Vuforia platform to provide step-by-step AR work instructions and remote expert assistance to improve the first-time fix rate and operational efficiency. The growth of AR and VR-enabled training and visualization tools continues to be fueled by an increase in adoption of smart manufacturing, digital twin applications, and industrial Internet of Things (IIoT) platforms due to industries having to address the challenges associated with a shortage of skilled workers and operating in complex environments with their equipment.
Additionally, the increase in workplace safety compliance and the mandate to reduce on-site risk is likely to drive companies to invest in immersive simulation-based training versus traditional methods. The cumulative effects of advancements in technology, pressure to achieve operating efficiencies, and workforce transformation initiatives are creating sustained growth opportunities for the industrial AR and VR systems market, providing measurable benefits in terms of safety, productivity, and cost effectiveness.
The opportunities that exist within the industrial AR and VR market are the development of virtual training simulators, remote maintenance applications/platforms, digital twin visualization solutions, industrial wearable devices, and spatial analysis tools/solutions.
Industrial AR and VR Systems Market Dynamics and Trends
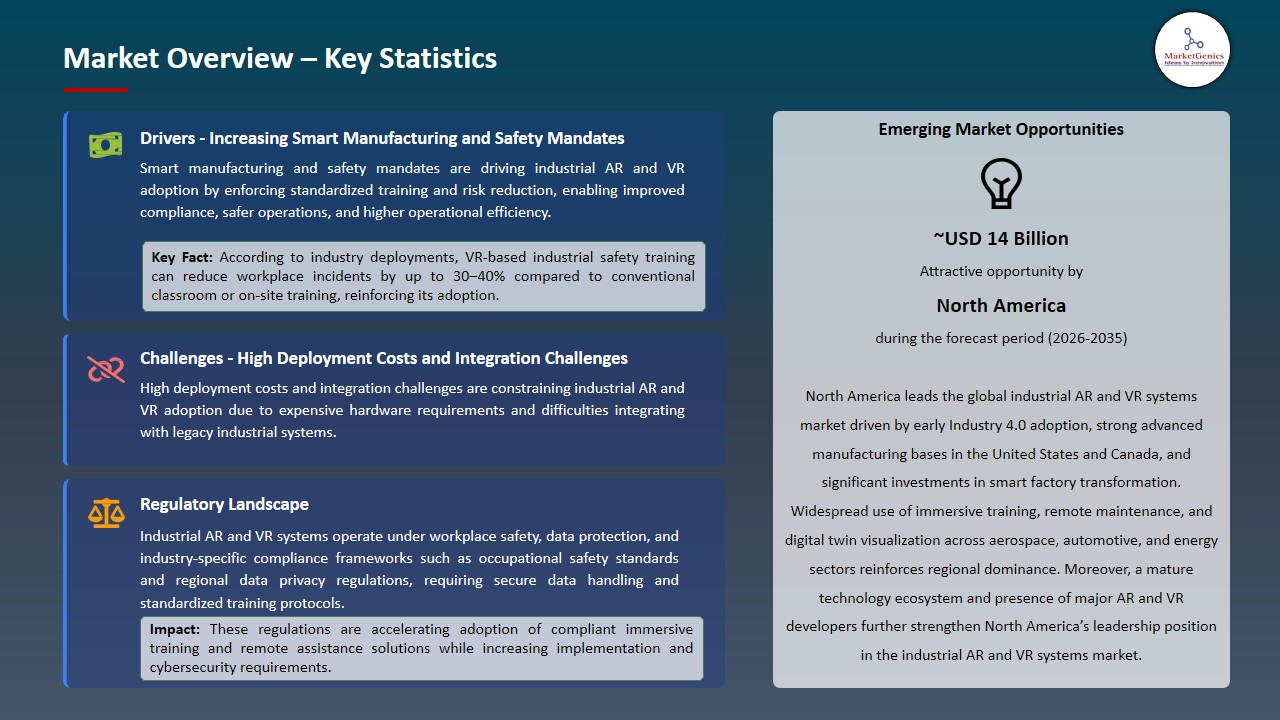
Driver: Increasing Smart Manufacturing and Safety Mandates Driving Adoption of Industrial AR and VR Systems
-
The industrial AR and VR systems context is witnessing enormous rapid growth as companies begin to invest in smart manufacturing and there is a rise in worker safety regulatory requirements within developed nations overall, particularly those governed by regulatory agencies in North America and Europe.
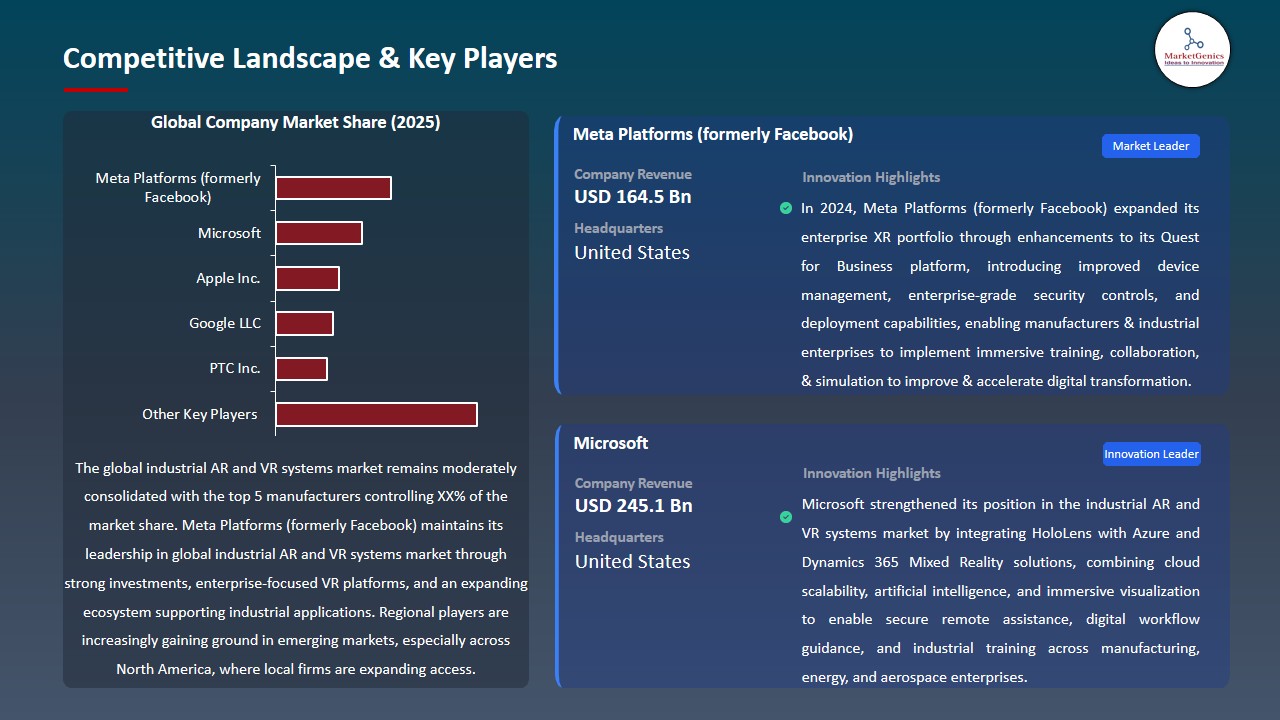
- The focus of these agencies has primarily been on standardizing training, reducing hazards, and utilizing digital documentation; as such, these agencies are creating a favorable environment for manufacturers to adopt immersive AR & VR based training and inspection technologies. In early 2024, Microsoft established numerous industrial applications for its HoloLens platform.
- This was accomplished through partnerships with both manufacturing and energy companies to allow for hands-free compliance inspections, remote expert guidance, and safety audits, this is evidence of a broader trend towards immersive operations enabled through compliance.
- AR and VR adoption is likely to continue to increase because of the growing complexity of industrial assets and dependence on digital workflows. All these factors are likely to continue to escalate the growth of the industrial AR and VR systems market.
Restraint: High Deployment Costs and Integration Challenges Limiting Widespread Adoption
-
Implementation is difficult despite high demand for AR and VR technology because of the high cost of the initial investment, limitations of existing hardware, and complexity of integrating AR and VR platforms with legacy manufacturing execution (MES) systems and enterprise resource planning (ERP) software.
- Many small- and medium-sized manufacturers also face barriers to implementing AR/VR due to a lack of employee readiness, network infrastructure requirements, and insufficient in-house experience with using immersive technologies. This has resulted in impediments to large-scale implementation from happening in these markets.
- Return on investment combined with cyber security, device durability, and user acceptance is likely to continue to be a critical priority (constraint) for AR/VR implementation, particularly in industries where cost sensitivity is important. All these elements are expected to restrict the expansion of the industrial AR and VR systems market.
Opportunity: Expansion Across Emerging Markets and Industrial Workforce Upskilling Programs
-
Digital manufacturing and workforce skills improvement projects in emerging markets around Asia-Pacific, Latin America and the Middle East have initiated new opportunities for industrial AR and VR solution development. Moreover, governments and industrial associations are advocating for the use of virtual training tools to alleviate the shortage of skilled workers and better maintain productivity in business operations.
- Global technology vendors and industrial companies are partnering with each other to deploy cloud-based and device independent AR and VR applications. For example, Meta has developed an enterprise-specific VR application that is used for industrial safety training and simulation.
- These kinds of business partnerships offer growth opportunities for companies that either provide scalable training simulation solutions, offer remote user support, or develop digital twin or digital modeling capabilities. And thus, is expected to create more opportunities in future for industrial AR and VR systems market.
Key Trend: Convergence of Digital Twins, AI, and Wearable AR Devices Shaping Market Evolution
-
The industrial AR and VR systems market is witnessing a significant trend where immersive technologies are integrating with other systems such as digital twins, artificial intelligence, and industrial Internet of Things (IoT) platforms. Artificial intelligence (AI)-driven contextual guidance and real-time data overlays support better decision-making on the factory floor.
- Combining wearable AR devices with predictive analytics facilitates proactive maintenance, faster troubleshooting, and lower error rates. This convergence is reshaping AR and VR, which were previously viewed as distinct visualization technologies, to become fundamental elements of global industrial digital transformation strategies. All these elements are expected to influence significant trends in the industrial AR and VR systems market.
Industrial AR and VR Systems Market Analysis and Segmental Data
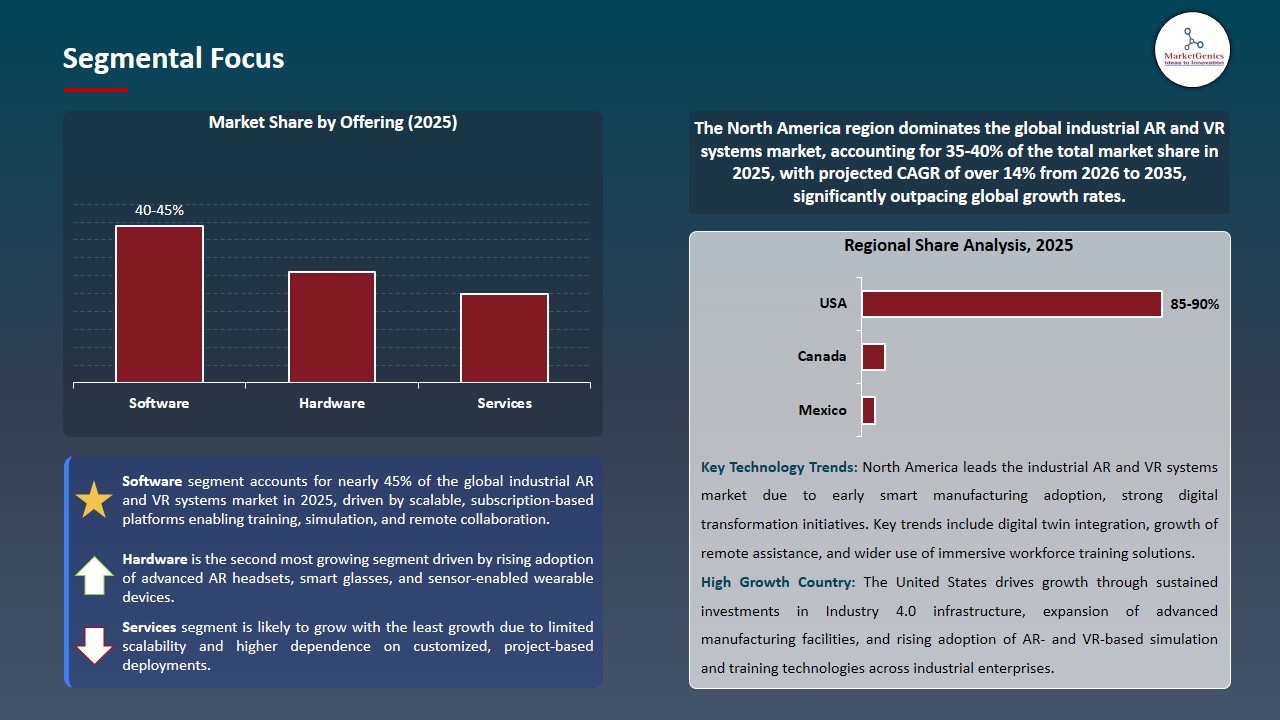
Software Segment Dominates Global Industrial AR and VR Systems Market amid Growing Digital Workflow Adoption
-
Due to their incremental licensing models, and easier-to-integrate with existing industrial systems e.g., product lifecycle management, manufacturing execution systems, industrial IoTs, software is leading the way in the acceptance of AR & VR, as they assist companies in the visualization/simulation/remote collaboration of products prior to undergoing extensive hardware machine overhauls and thus are more economical for enterprises in 2024.
- For example, in 2024, Dassault Systems, the world's leading supplier of 3D software apps, expanded its suite of applications on the 3DEXPERIENCE platform by adding immersive virtual twin- technology to support manufacturers' industrial training, factory planning and operational optimization, which indicates the increased interest in software led AR and/or VR deployments as the primary method in their progression along their own digital transformation journeys in the Industrial marketplace.
- Further, because of continual updates, Cloud delivery, and the ability to run on multiple-device platforms, the software segment continues to lead the way in accelerating digital transformations through-out the industrial market is likely to further supplement the overall growth of the industrial AR and VR systems market opportunity.
North America Dominates Industrial AR and VR Systems Market amid Early Adoption of Industry 4.0 and Strong Industrial Digitalization Investments
-
North America is the current leader for the industrial AR & VR systems market attributed to the region's early adoption of Industry 4.0 and investment into industrial digitalization. The region has a strong technological infrastructure, high levels of deployment of smart manufacturing and substantial investment in immersive technology within the Automotive, Aerospace and Energy Industries.
- Manufacturers & technology companies across the United States are the leaders in using AR & VR technologies to assist in Training, Maintenance and Real-Time Operations because of their Access to robust 5G Networks and highly skilled labor. For instance, in 2024, North America is expected to be the largest contributor to the industrial metaverse & AR/VR manufacturing segments.
- Owing to their investments into being Proactive in Industry 4.0 and continued investments into digital transformation. The large number of significant technology manufacturers and favorable investment environment is expected to continue to support North America's leadership position in industrial AR & VR systems market.
Industrial AR and VR Systems Market Ecosystem
The industrial AR and VR systems market is moderately consolidated comprising a medium concentration of companies (a mix of Tier 1 companies like Microsoft and Siemens alongside smaller companies at Tier 2 or Tier 3) supplying either complete solutions or specific applications. Competition is based on software differentiation rather than hardware size.
There are three primary nodes in the AR/VR value chain - platform and application development, system integration, and deployment - and in 2024 Siemens added an immersive visualization component to its Xcelerator portfolio, enhancing ecosystem innovation via faculty simulation and workforce training. This increased the overall level of competitive intensity in industrial AR and VR systems market.
Recent Development and Strategic Overview:
-
In March 2024, NVIDIA increased its use of Omnivore's industrial level by allowing real-time, physically accurate simulations of factories and robotic systems through the Omnivore's digital twin system. This enables manufacturers to connect digital twins to live data from IoT platforms, allowing for collaborative virtual testing, layout optimization, and predictive maintenance, enabling teams who are working on different sites or in different countries to work together to perform these functions without impacting operations physically.
- In February 2024, Unity enhanced its Unity Industry Solutions by including new enhanced tools to create immersive AR/VR training and simulation applications that can be used worldwide by manufacturers who are developing, testing, and providing operator training for their employees. These new features will enable the creation of interoperable, device-agnostic immersive training applications, reducing the need for physical prototypes while also improving knowledge transfer and consistency in the operations of global manufacturing organizations.
Report Scope
|
Attribute |
Detail |
|
Market Size in 2025 |
USD 9.8 Bn |
|
Market Forecast Value in 2035 |
USD 47.9 Bn |
|
Growth Rate (CAGR) |
17.2% |
|
Forecast Period |
2026 – 2035 |
|
Historical Data Available for |
2021 – 2024 |
|
Market Size Units |
USD Bn for Value Thousand Units for Volume |
|
Report Format |
Electronic (PDF) + Excel |
|
Regions and Countries Covered |
|||||
|
North America |
Europe |
Asia Pacific |
Middle East |
Africa |
South America |
|
|
|
|
|
|
|
Companies Covered |
|||||
|
|
|
|
|
|
Industrial AR and VR Systems Market Segmentation and Highlights
|
Segment |
Sub-segment |
|
Industrial AR and VR Systems Market, By Offering |
|
|
Industrial AR and VR Systems Market, By Device Type |
|
|
Industrial AR and VR Systems Market, By Technology |
|
|
Industrial AR and VR Systems Market, By Deployment Mode |
|
|
Industrial AR and VR Systems Market, By Enterprise Size |
|
|
Industrial AR and VR Systems Market, By Connectivity |
|
|
Industrial AR and VR Systems Market, By Application |
|
|
Industrial AR and VR Systems Market, By Industry Vertical |
|
Frequently Asked Questions
Table of Contents
- 1. Research Methodology and Assumptions
- 1.1. Definitions
- 1.2. Research Design and Approach
- 1.3. Data Collection Methods
- 1.4. Base Estimates and Calculations
- 1.5. Forecasting Models
- 1.5.1. Key Forecast Factors & Impact Analysis
- 1.6. Secondary Research
- 1.6.1. Open Sources
- 1.6.2. Paid Databases
- 1.6.3. Associations
- 1.7. Primary Research
- 1.7.1. Primary Sources
- 1.7.2. Primary Interviews with Stakeholders across Ecosystem
- 2. Executive Summary
- 2.1. Global Industrial AR and VR Systems Market Outlook
- 2.1.1. Industrial AR and VR Systems Market Size (Volume - Thousand Units & Value - US$ Bn), and Forecasts, 2021-2035
- 2.1.2. Compounded Annual Growth Rate Analysis
- 2.1.3. Growth Opportunity Analysis
- 2.1.4. Segmental Share Analysis
- 2.1.5. Geographical Share Analysis
- 2.2. Market Analysis and Facts
- 2.3. Supply-Demand Analysis
- 2.4. Competitive Benchmarking
- 2.5. Go-to- Market Strategy
- 2.5.1. Customer/ End-use Industry Assessment
- 2.5.2. Growth Opportunity Data, 2026-2035
- 2.5.2.1. Regional Data
- 2.5.2.2. Country Data
- 2.5.2.3. Segmental Data
- 2.5.3. Identification of Potential Market Spaces
- 2.5.4. GAP Analysis
- 2.5.5. Potential Attractive Price Points
- 2.5.6. Prevailing Market Risks & Challenges
- 2.5.7. Preferred Sales & Marketing Strategies
- 2.5.8. Key Recommendations and Analysis
- 2.5.9. A Way Forward
- 2.1. Global Industrial AR and VR Systems Market Outlook
- 3. Industry Data and Premium Insights
- 3.1. Global Industrial Machinery Industry Overview, 2025
- 3.1.1. Industrial Machinery Industry Analysis
- 3.1.2. Key Trends for Industrial Machinery Industry
- 3.1.3. Regional Distribution for Industrial Machinery Industry
- 3.2. Supplier Customer Data
- 3.3. Technology Roadmap and Developments
- 3.4. Trade Analysis
- 3.4.1. Import & Export Analysis, 2025
- 3.4.2. Top Importing Countries
- 3.4.3. Top Exporting Countries
- 3.5. Trump Tariff Impact Analysis
- 3.5.1. Manufacturer
- 3.5.1.1. Based on the component & Raw material
- 3.5.2. Supply Chain
- 3.5.3. End Consumer
- 3.5.1. Manufacturer
- 3.6. Raw Material Analysis
- 3.1. Global Industrial Machinery Industry Overview, 2025
- 4. Market Overview
- 4.1. Market Dynamics
- 4.1.1. Drivers
- 4.1.1.1. Smart manufacturing and Industry 4.0 adoption driving immersive training and remote assistance.
- 4.1.1.2. Demand for improved productivity, safety, and workforce upskilling.
- 4.1.1.3. Advancements in AR wearables, cloud, and artificial intelligence integration.
- 4.1.2. Restraints
- 4.1.2.1. High deployment costs limiting small and medium-sized enterprise adoption.
- 4.1.2.2. Integration challenges with legacy industrial systems.
- 4.1.2.3. Device limitations and cybersecurity concerns.
- 4.1.1. Drivers
- 4.2. Key Trend Analysis
- 4.3. Regulatory Framework
- 4.3.1. Key Regulations, Norms, and Subsidies, by Key Countries
- 4.3.2. Tariffs and Standards
- 4.3.3. Impact Analysis of Regulations on the Market
- 4.4. Value Chain Analysis
- 4.4.1. Component Suppliers
- 4.4.2. System Integrators/ Technology Providers
- 4.4.3. Industrial AR and VR Systems Manufacturers
- 4.4.4. Distributors
- 4.4.5. End Users
- 4.5. Cost Structure Analysis
- 4.5.1. Parameter’s Share for Cost Associated
- 4.5.2. COGP vs COGS
- 4.5.3. Profit Margin Analysis
- 4.6. Pricing Analysis
- 4.6.1. Regional Pricing Analysis
- 4.6.2. Segmental Pricing Trends
- 4.6.3. Factors Influencing Pricing
- 4.7. Porter’s Five Forces Analysis
- 4.8. PESTEL Analysis
- 4.9. Global Industrial AR and VR Systems Market Demand
- 4.9.1. Historical Market Size – Volume (Thousand Units) & Value (US$ Bn), 2020-2024
- 4.9.2. Current and Future Market Size – Volume (Thousand Units) & Value (US$ Bn), 2026–2035
- 4.9.2.1. Y-o-Y Growth Trends
- 4.9.2.2. Absolute $ Opportunity Assessment
- 4.1. Market Dynamics
- 5. Competition Landscape
- 5.1. Competition structure
- 5.1.1. Fragmented v/s consolidated
- 5.2. Company Share Analysis, 2025
- 5.2.1. Global Company Market Share
- 5.2.2. By Region
- 5.2.2.1. North America
- 5.2.2.2. Europe
- 5.2.2.3. Asia Pacific
- 5.2.2.4. Middle East
- 5.2.2.5. Africa
- 5.2.2.6. South America
- 5.3. Product Comparison Matrix
- 5.3.1. Specifications
- 5.3.2. Market Positioning
- 5.3.3. Pricing
- 5.1. Competition structure
- 6. Global Industrial AR and VR Systems Market Analysis, by Offering
- 6.1. Key Segment Analysis
- 6.2. Industrial AR and VR Systems Market Size (Volume - Thousand Units & Value - US$ Bn), Analysis, and Forecasts, by Offering, 2021-2035
- 6.2.1. Hardware
- 6.2.1.1. Headsets/Smart Glasses
- 6.2.1.2. Sensors & Trackers
- 6.2.1.3. Controllers & Input Devices
- 6.2.1.4. Cameras & Depth Sensors
- 6.2.1.5. Optical Displays & Lenses
- 6.2.1.6. Wearables (Haptic Gloves, Vests)
- 6.2.1.7. Processing Units/Edge Computing Devices
- 6.2.1.8. Connectivity Modules (Wi-Fi, 5G, Bluetooth)
- 6.2.1.9. Others
- 6.2.2. Software
- 6.2.2.1. AR/VR Platforms & SDKs
- 6.2.2.2. Visualization & 3D Modeling Software
- 6.2.2.3. Simulation & Training Software
- 6.2.2.4. Analytics & Insights Software
- 6.2.2.5. Content Creation & Authoring Tools
- 6.2.2.6. Integration Middleware
- 6.2.2.7. Security & Data Protection Software
- 6.2.2.8. Others
- 6.2.3. Services
- 6.2.3.1. Implementation & Deployment
- 6.2.3.2. Consulting & Advisory
- 6.2.3.3. Custom Development
- 6.2.3.4. System Integration
- 6.2.3.5. Training & Support
- 6.2.3.6. Maintenance & Upgrades
- 6.2.3.7. Managed Services
- 6.2.3.8. Content Development Services
- 6.2.3.9. Others
- 6.2.1. Hardware
- 7. Global Industrial AR and VR Systems Market Analysis, by Device Type
- 7.1. Key Segment Analysis
- 7.2. Industrial AR and VR Systems Market Size (Volume - Thousand Units & Value - US$ Bn), Analysis, and Forecasts, by Device Type, 2021-2035
- 7.2.1. Head-Mounted Displays (HMDs)
- 7.2.2. Head-Up Displays (HUDs)
- 7.2.3. Handheld Devices
- 7.2.4. Projection-Based Systems
- 7.2.5. CAVE (Cave Automatic Virtual Environment) Systems
- 7.2.6. Others
- 8. Global Industrial AR and VR Systems Market Analysis, by Technology
- 8.1. Key Segment Analysis
- 8.2. Industrial AR and VR Systems Market Size (Volume - Thousand Units & Value - US$ Bn), Analysis, and Forecasts, by Technology, 2021-2035
- 8.2.1. Augmented Reality (AR)
- 8.2.2. Virtual Reality (VR)
- 8.2.3. Mixed Reality (MR)
- 8.2.4. Extended Reality (XR)
- 8.2.5. Others
- 9. Global Industrial AR and VR Systems Market Analysis, by Deployment Mode
- 9.1. Key Segment Analysis
- 9.2. Industrial AR and VR Systems Market Size (Volume - Thousand Units & Value - US$ Bn), Analysis, and Forecasts, by Deployment Mode, 2021-2035
- 9.2.1. On-Premise
- 9.2.2. Cloud-Based
- 9.2.3. Hybrid
- 10. Global Industrial AR and VR Systems Market Analysis, by Enterprise Size
- 10.1. Key Segment Analysis
- 10.2. Industrial AR and VR Systems Market Size (Volume - Thousand Units & Value - US$ Bn), Analysis, and Forecasts, by Enterprise Size, 2021-2035
- 10.2.1. Large Enterprises
- 10.2.2. Small & Medium Enterprises (SMEs)
- 11. Global Industrial AR and VR Systems Market Analysis, by Connectivity
- 11.1. Key Segment Analysis
- 11.2. Industrial AR and VR Systems Market Size (Volume - Thousand Units & Value - US$ Bn), Analysis, and Forecasts, by Connectivity, 2021-2035
- 11.2.1. Wired Systems
- 11.2.2. Wireless Systems
- 11.2.3. 5G-Enabled Systems
- 12. Global Industrial AR and VR Systems Market Analysis, by Application
- 12.1. Key Segment Analysis
- 12.2. Industrial AR and VR Systems Market Size (Volume - Thousand Units & Value - US$ Bn), Analysis, and Forecasts, by Application, 2021-2035
- 12.2.1. Training & Simulation
- 12.2.2. Maintenance & Repair
- 12.2.3. Design & Prototyping
- 12.2.4. Remote Assistance
- 12.2.5. Quality Inspection
- 12.2.6. Assembly & Manufacturing Support
- 12.2.7. Logistics & Warehousing
- 12.2.8. Others
- 13. Global Industrial AR and VR Systems Market Analysis and Forecasts, by Industry Vertical
- 13.1. Key Findings
- 13.2. Industrial AR and VR Systems Market Size (Volume - Thousand Units & Value - US$ Bn), Analysis, and Forecasts, by Industry Vertical, 2021-2035
- 13.2.1. Manufacturing
- 13.2.2. Automotive
- 13.2.3. Aerospace & Defense
- 13.2.4. Energy & Utilities
- 13.2.5. Healthcare
- 13.2.6. Construction
- 13.2.7. Oil & Gas
- 13.2.8. Mining
- 13.2.9. Logistics & Transportation
- 13.2.10. Others
- 14. Global Industrial AR and VR Systems Market Analysis and Forecasts, by Region
- 14.1. Key Findings
- 14.2. Industrial AR and VR Systems Market Size (Volume - Thousand Units & Value - US$ Bn), Analysis, and Forecasts, by Region, 2021-2035
- 14.2.1. North America
- 14.2.2. Europe
- 14.2.3. Asia Pacific
- 14.2.4. Middle East
- 14.2.5. Africa
- 14.2.6. South America
- 15. North America Industrial AR and VR Systems Market Analysis
- 15.1. Key Segment Analysis
- 15.2. Regional Snapshot
- 15.3. North America Industrial AR and VR Systems Market Size (Volume - Thousand Units & Value - US$ Bn), Analysis, and Forecasts, 2021-2035
- 15.3.1. Offering
- 15.3.2. Device Type
- 15.3.3. Technology
- 15.3.4. Deployment Mode
- 15.3.5. Enterprise Size
- 15.3.6. Connectivity
- 15.3.7. Application
- 15.3.8. Industry Vertical
- 15.3.9. Country
- 15.3.9.1. USA
- 15.3.9.2. Canada
- 15.3.9.3. Mexico
- 15.4. USA Industrial AR and VR Systems Market
- 15.4.1. Country Segmental Analysis
- 15.4.2. Offering
- 15.4.3. Device Type
- 15.4.4. Technology
- 15.4.5. Deployment Mode
- 15.4.6. Enterprise Size
- 15.4.7. Connectivity
- 15.4.8. Application
- 15.4.9. Industry Vertical
- 15.5. Canada Industrial AR and VR Systems Market
- 15.5.1. Country Segmental Analysis
- 15.5.2. Offering
- 15.5.3. Device Type
- 15.5.4. Technology
- 15.5.5. Deployment Mode
- 15.5.6. Enterprise Size
- 15.5.7. Connectivity
- 15.5.8. Application
- 15.5.9. Industry Vertical
- 15.6. Mexico Industrial AR and VR Systems Market
- 15.6.1. Country Segmental Analysis
- 15.6.2. Offering
- 15.6.3. Device Type
- 15.6.4. Technology
- 15.6.5. Deployment Mode
- 15.6.6. Enterprise Size
- 15.6.7. Connectivity
- 15.6.8. Application
- 15.6.9. Industry Vertical
- 16. Europe Industrial AR and VR Systems Market Analysis
- 16.1. Key Segment Analysis
- 16.2. Regional Snapshot
- 16.3. Europe Industrial AR and VR Systems Market Size (Volume - Thousand Units & Value - US$ Bn), Analysis, and Forecasts, 2021-2035
- 16.3.1. Offering
- 16.3.2. Device Type
- 16.3.3. Technology
- 16.3.4. Deployment Mode
- 16.3.5. Enterprise Size
- 16.3.6. Connectivity
- 16.3.7. Application
- 16.3.8. Industry Vertical
- 16.3.9. Country
- 16.3.9.1. Germany
- 16.3.9.2. United Kingdom
- 16.3.9.3. France
- 16.3.9.4. Italy
- 16.3.9.5. Spain
- 16.3.9.6. Netherlands
- 16.3.9.7. Nordic Countries
- 16.3.9.8. Poland
- 16.3.9.9. Russia & CIS
- 16.3.9.10. Rest of Europe
- 16.4. Germany Industrial AR and VR Systems Market
- 16.4.1. Country Segmental Analysis
- 16.4.2. Offering
- 16.4.3. Device Type
- 16.4.4. Technology
- 16.4.5. Deployment Mode
- 16.4.6. Enterprise Size
- 16.4.7. Connectivity
- 16.4.8. Application
- 16.4.9. Industry Vertical
- 16.5. United Kingdom Industrial AR and VR Systems Market
- 16.5.1. Country Segmental Analysis
- 16.5.2. Offering
- 16.5.3. Device Type
- 16.5.4. Technology
- 16.5.5. Deployment Mode
- 16.5.6. Enterprise Size
- 16.5.7. Connectivity
- 16.5.8. Application
- 16.5.9. Industry Vertical
- 16.6. France Industrial AR and VR Systems Market
- 16.6.1. Country Segmental Analysis
- 16.6.2. Offering
- 16.6.3. Device Type
- 16.6.4. Technology
- 16.6.5. Deployment Mode
- 16.6.6. Enterprise Size
- 16.6.7. Connectivity
- 16.6.8. Application
- 16.6.9. Industry Vertical
- 16.7. Italy Industrial AR and VR Systems Market
- 16.7.1. Country Segmental Analysis
- 16.7.2. Offering
- 16.7.3. Device Type
- 16.7.4. Technology
- 16.7.5. Deployment Mode
- 16.7.6. Enterprise Size
- 16.7.7. Connectivity
- 16.7.8. Application
- 16.7.9. Industry Vertical
- 16.8. Spain Industrial AR and VR Systems Market
- 16.8.1. Country Segmental Analysis
- 16.8.2. Offering
- 16.8.3. Device Type
- 16.8.4. Technology
- 16.8.5. Deployment Mode
- 16.8.6. Enterprise Size
- 16.8.7. Connectivity
- 16.8.8. Application
- 16.8.9. Industry Vertical
- 16.9. Netherlands Industrial AR and VR Systems Market
- 16.9.1. Country Segmental Analysis
- 16.9.2. Offering
- 16.9.3. Device Type
- 16.9.4. Technology
- 16.9.5. Deployment Mode
- 16.9.6. Enterprise Size
- 16.9.7. Connectivity
- 16.9.8. Application
- 16.9.9. Industry Vertical
- 16.10. Nordic Countries Industrial AR and VR Systems Market
- 16.10.1. Country Segmental Analysis
- 16.10.2. Offering
- 16.10.3. Device Type
- 16.10.4. Technology
- 16.10.5. Deployment Mode
- 16.10.6. Enterprise Size
- 16.10.7. Connectivity
- 16.10.8. Application
- 16.10.9. Industry Vertical
- 16.11. Poland Industrial AR and VR Systems Market
- 16.11.1. Country Segmental Analysis
- 16.11.2. Offering
- 16.11.3. Device Type
- 16.11.4. Technology
- 16.11.5. Deployment Mode
- 16.11.6. Enterprise Size
- 16.11.7. Connectivity
- 16.11.8. Application
- 16.11.9. Industry Vertical
- 16.12. Russia & CIS Industrial AR and VR Systems Market
- 16.12.1. Country Segmental Analysis
- 16.12.2. Offering
- 16.12.3. Device Type
- 16.12.4. Technology
- 16.12.5. Deployment Mode
- 16.12.6. Enterprise Size
- 16.12.7. Connectivity
- 16.12.8. Application
- 16.12.9. Industry Vertical
- 16.13. Rest of Europe Industrial AR and VR Systems Market
- 16.13.1. Country Segmental Analysis
- 16.13.2. Offering
- 16.13.3. Device Type
- 16.13.4. Technology
- 16.13.5. Deployment Mode
- 16.13.6. Enterprise Size
- 16.13.7. Connectivity
- 16.13.8. Application
- 16.13.9. Industry Vertical
- 17. Asia Pacific Industrial AR and VR Systems Market Analysis
- 17.1. Key Segment Analysis
- 17.2. Regional Snapshot
- 17.3. Asia Pacific Industrial AR and VR Systems Market Size (Volume - Thousand Units & Value - US$ Bn), Analysis, and Forecasts, 2021-2035
- 17.3.1. Offering
- 17.3.2. Device Type
- 17.3.3. Technology
- 17.3.4. Deployment Mode
- 17.3.5. Enterprise Size
- 17.3.6. Connectivity
- 17.3.7. Application
- 17.3.8. Industry Vertical
- 17.3.9. Country
- 17.3.9.1. China
- 17.3.9.2. India
- 17.3.9.3. Japan
- 17.3.9.4. South Korea
- 17.3.9.5. Australia and New Zealand
- 17.3.9.6. Indonesia
- 17.3.9.7. Malaysia
- 17.3.9.8. Thailand
- 17.3.9.9. Vietnam
- 17.3.9.10. Rest of Asia Pacific
- 17.4. China Industrial AR and VR Systems Market
- 17.4.1. Country Segmental Analysis
- 17.4.2. Offering
- 17.4.3. Device Type
- 17.4.4. Technology
- 17.4.5. Deployment Mode
- 17.4.6. Enterprise Size
- 17.4.7. Connectivity
- 17.4.8. Application
- 17.4.9. Industry Vertical
- 17.5. India Industrial AR and VR Systems Market
- 17.5.1. Country Segmental Analysis
- 17.5.2. Offering
- 17.5.3. Device Type
- 17.5.4. Technology
- 17.5.5. Deployment Mode
- 17.5.6. Enterprise Size
- 17.5.7. Connectivity
- 17.5.8. Application
- 17.5.9. Industry Vertical
- 17.6. Japan Industrial AR and VR Systems Market
- 17.6.1. Country Segmental Analysis
- 17.6.2. Offering
- 17.6.3. Device Type
- 17.6.4. Technology
- 17.6.5. Deployment Mode
- 17.6.6. Enterprise Size
- 17.6.7. Connectivity
- 17.6.8. Application
- 17.6.9. Industry Vertical
- 17.7. South Korea Industrial AR and VR Systems Market
- 17.7.1. Country Segmental Analysis
- 17.7.2. Offering
- 17.7.3. Device Type
- 17.7.4. Technology
- 17.7.5. Deployment Mode
- 17.7.6. Enterprise Size
- 17.7.7. Connectivity
- 17.7.8. Application
- 17.7.9. Industry Vertical
- 17.8. Australia and New Zealand Industrial AR and VR Systems Market
- 17.8.1. Country Segmental Analysis
- 17.8.2. Offering
- 17.8.3. Device Type
- 17.8.4. Technology
- 17.8.5. Deployment Mode
- 17.8.6. Enterprise Size
- 17.8.7. Connectivity
- 17.8.8. Application
- 17.8.9. Industry Vertical
- 17.9. Indonesia Industrial AR and VR Systems Market
- 17.9.1. Country Segmental Analysis
- 17.9.2. Offering
- 17.9.3. Device Type
- 17.9.4. Technology
- 17.9.5. Deployment Mode
- 17.9.6. Enterprise Size
- 17.9.7. Connectivity
- 17.9.8. Application
- 17.9.9. Industry Vertical
- 17.10. Malaysia Industrial AR and VR Systems Market
- 17.10.1. Country Segmental Analysis
- 17.10.2. Offering
- 17.10.3. Device Type
- 17.10.4. Technology
- 17.10.5. Deployment Mode
- 17.10.6. Enterprise Size
- 17.10.7. Connectivity
- 17.10.8. Application
- 17.10.9. Industry Vertical
- 17.11. Thailand Industrial AR and VR Systems Market
- 17.11.1. Country Segmental Analysis
- 17.11.2. Offering
- 17.11.3. Device Type
- 17.11.4. Technology
- 17.11.5. Deployment Mode
- 17.11.6. Enterprise Size
- 17.11.7. Connectivity
- 17.11.8. Application
- 17.11.9. Industry Vertical
- 17.12. Vietnam Industrial AR and VR Systems Market
- 17.12.1. Country Segmental Analysis
- 17.12.2. Offering
- 17.12.3. Device Type
- 17.12.4. Technology
- 17.12.5. Deployment Mode
- 17.12.6. Enterprise Size
- 17.12.7. Connectivity
- 17.12.8. Application
- 17.12.9. Industry Vertical
- 17.13. Rest of Asia Pacific Industrial AR and VR Systems Market
- 17.13.1. Country Segmental Analysis
- 17.13.2. Offering
- 17.13.3. Device Type
- 17.13.4. Technology
- 17.13.5. Deployment Mode
- 17.13.6. Enterprise Size
- 17.13.7. Connectivity
- 17.13.8. Application
- 17.13.9. Industry Vertical
- 18. Middle East Industrial AR and VR Systems Market Analysis
- 18.1. Key Segment Analysis
- 18.2. Regional Snapshot
- 18.3. Middle East Industrial AR and VR Systems Market Size (Volume - Thousand Units & Value - US$ Bn), Analysis, and Forecasts, 2021-2035
- 18.3.1. Offering
- 18.3.2. Device Type
- 18.3.3. Technology
- 18.3.4. Deployment Mode
- 18.3.5. Enterprise Size
- 18.3.6. Connectivity
- 18.3.7. Application
- 18.3.8. Industry Vertical
- 18.3.9. Country
- 18.3.9.1. Turkey
- 18.3.9.2. UAE
- 18.3.9.3. Saudi Arabia
- 18.3.9.4. Israel
- 18.3.9.5. Rest of Middle East
- 18.4. Turkey Industrial AR and VR Systems Market
- 18.4.1. Country Segmental Analysis
- 18.4.2. Type
- 18.4.3. Device Type
- 18.4.4. Payload Capacity
- 18.4.5. Range
- 18.4.6. Operation Mode
- 18.4.7. Battery Type
- 18.4.8. Application
- 18.4.9. Industry Vertical
- 18.5. UAE Industrial AR and VR Systems Market
- 18.5.1. Country Segmental Analysis
- 18.5.2. Offering
- 18.5.3. Device Type
- 18.5.4. Technology
- 18.5.5. Deployment Mode
- 18.5.6. Enterprise Size
- 18.5.7. Connectivity
- 18.5.8. Application
- 18.5.9. Industry Vertical
- 18.6. Saudi Arabia Industrial AR and VR Systems Market
- 18.6.1. Country Segmental Analysis
- 18.6.2. Offering
- 18.6.3. Device Type
- 18.6.4. Technology
- 18.6.5. Deployment Mode
- 18.6.6. Enterprise Size
- 18.6.7. Connectivity
- 18.6.8. Application
- 18.6.9. Industry Vertical
- 18.7. Israel Industrial AR and VR Systems Market
- 18.7.1. Country Segmental Analysis
- 18.7.2. Offering
- 18.7.3. Device Type
- 18.7.4. Technology
- 18.7.5. Deployment Mode
- 18.7.6. Enterprise Size
- 18.7.7. Connectivity
- 18.7.8. Application
- 18.7.9. Industry Vertical
- 18.8. Rest of Middle East Industrial AR and VR Systems Market
- 18.8.1. Country Segmental Analysis
- 18.8.2. Offering
- 18.8.3. Device Type
- 18.8.4. Technology
- 18.8.5. Deployment Mode
- 18.8.6. Enterprise Size
- 18.8.7. Connectivity
- 18.8.8. Application
- 18.8.9. Industry Vertical
- 19. Africa Industrial AR and VR Systems Market Analysis
- 19.1. Key Segment Analysis
- 19.2. Regional Snapshot
- 19.3. Africa Industrial AR and VR Systems Market Size (Volume - Thousand Units & Value - US$ Bn), Analysis, and Forecasts, 2021-2035
- 19.3.1. Offering
- 19.3.2. Device Type
- 19.3.3. Technology
- 19.3.4. Deployment Mode
- 19.3.5. Enterprise Size
- 19.3.6. Connectivity
- 19.3.7. Application
- 19.3.8. Industry Vertical
- 19.3.9. Country
- 19.3.9.1. South Africa
- 19.3.9.2. Egypt
- 19.3.9.3. Nigeria
- 19.3.9.4. Algeria
- 19.3.9.5. Rest of Africa
- 19.4. South Africa Industrial AR and VR Systems Market
- 19.4.1. Country Segmental Analysis
- 19.4.2. Offering
- 19.4.3. Device Type
- 19.4.4. Technology
- 19.4.5. Deployment Mode
- 19.4.6. Enterprise Size
- 19.4.7. Connectivity
- 19.4.8. Application
- 19.4.9. Industry Vertical
- 19.5. Egypt Industrial AR and VR Systems Market
- 19.5.1. Country Segmental Analysis
- 19.5.2. Offering
- 19.5.3. Device Type
- 19.5.4. Technology
- 19.5.5. Deployment Mode
- 19.5.6. Enterprise Size
- 19.5.7. Connectivity
- 19.5.8. Application
- 19.5.9. Industry Vertical
- 19.6. Nigeria Industrial AR and VR Systems Market
- 19.6.1. Country Segmental Analysis
- 19.6.2. Offering
- 19.6.3. Device Type
- 19.6.4. Technology
- 19.6.5. Deployment Mode
- 19.6.6. Enterprise Size
- 19.6.7. Connectivity
- 19.6.8. Application
- 19.6.9. Industry Vertical
- 19.7. Algeria Industrial AR and VR Systems Market
- 19.7.1. Country Segmental Analysis
- 19.7.2. Offering
- 19.7.3. Device Type
- 19.7.4. Technology
- 19.7.5. Deployment Mode
- 19.7.6. Enterprise Size
- 19.7.7. Connectivity
- 19.7.8. Application
- 19.7.9. Industry Vertical
- 19.8. Rest of Africa Industrial AR and VR Systems Market
- 19.8.1. Country Segmental Analysis
- 19.8.2. Offering
- 19.8.3. Device Type
- 19.8.4. Technology
- 19.8.5. Deployment Mode
- 19.8.6. Enterprise Size
- 19.8.7. Connectivity
- 19.8.8. Application
- 19.8.9. Industry Vertical
- 20. South America Industrial AR and VR Systems Market Analysis
- 20.1. Key Segment Analysis
- 20.2. Regional Snapshot
- 20.3. South America Industrial AR and VR Systems Market Size (Volume - Thousand Units & Value - US$ Bn), Analysis, and Forecasts, 2021-2035
- 20.3.1. Offering
- 20.3.2. Device Type
- 20.3.3. Technology
- 20.3.4. Deployment Mode
- 20.3.5. Enterprise Size
- 20.3.6. Connectivity
- 20.3.7. Application
- 20.3.8. Industry Vertical
- 20.3.9. Country
- 20.3.9.1. Brazil
- 20.3.9.2. Argentina
- 20.3.9.3. Rest of South America
- 20.4. Brazil Industrial AR and VR Systems Market
- 20.4.1. Country Segmental Analysis
- 20.4.2. Offering
- 20.4.3. Device Type
- 20.4.4. Technology
- 20.4.5. Deployment Mode
- 20.4.6. Enterprise Size
- 20.4.7. Connectivity
- 20.4.8. Application
- 20.4.9. Industry Vertical
- 20.5. Argentina Industrial AR and VR Systems Market
- 20.5.1. Country Segmental Analysis
- 20.5.2. Offering
- 20.5.3. Device Type
- 20.5.4. Technology
- 20.5.5. Deployment Mode
- 20.5.6. Enterprise Size
- 20.5.7. Connectivity
- 20.5.8. Application
- 20.5.9. Industry Vertical
- 20.6. Rest of South America Industrial AR and VR Systems Market
- 20.6.1. Country Segmental Analysis
- 20.6.2. Offering
- 20.6.3. Device Type
- 20.6.4. Technology
- 20.6.5. Deployment Mode
- 20.6.6. Enterprise Size
- 20.6.7. Connectivity
- 20.6.8. Application
- 20.6.9. Industry Vertical
- 21. Key Players/ Company Profile
- 21.1. Artec 3D
- 21.1.1. Company Details/ Overview
- 21.1.2. Company Financials
- 21.1.3. Key Customers and Competitors
- 21.1.4. Business/ Industry Portfolio
- 21.1.5. Product Portfolio/ Specification Details
- 21.1.6. Pricing Data
- 21.1.7. Strategic Overview
- 21.1.8. Recent Developments
- 21.2. Cognex Corporation
- 21.3. Datalogic S.p.A.
- 21.4. Epson America
- 21.5. FARO Technologies
- 21.6. Hexagon AB
- 21.7. Honeywell International
- 21.8. ID Tech
- 21.9. Intermec (Honeywell)
- 21.10. Keyence Corporation
- 21.11. Motorola Solutions
- 21.12. Newland AutoID
- 21.13. Omron Corporation
- 21.14. Panasonic Corporation
- 21.15. SICK AG
- 21.16. Siemens AG
- 21.17. Symbol Technologies
- 21.18. Toshiba Tec Corporation
- 21.19. Trimble Inc.
- 21.20. Zebra Technologies
- 21.21. Other Key Players
- 21.1. Artec 3D
Note* - This is just tentative list of players. While providing the report, we will cover more number of players based on their revenue and share for each geography
Research Design
Our research design integrates both demand-side and supply-side analysis through a balanced combination of primary and secondary research methodologies. By utilizing both bottom-up and top-down approaches alongside rigorous data triangulation methods, we deliver robust market intelligence that supports strategic decision-making.
MarketGenics' comprehensive research design framework ensures the delivery of accurate, reliable, and actionable market intelligence. Through the integration of multiple research approaches, rigorous validation processes, and expert analysis, we provide our clients with the insights needed to make informed strategic decisions and capitalize on market opportunities.

MarketGenics leverages a dedicated industry panel of experts and a comprehensive suite of paid databases to effectively collect, consolidate, and analyze market intelligence.
Our approach has consistently proven to be reliable and effective in generating accurate market insights, identifying key industry trends, and uncovering emerging business opportunities.
Through both primary and secondary research, we capture and analyze critical company-level data such as manufacturing footprints, including technical centers, R&D facilities, sales offices, and headquarters.
Our expert panel further enhances our ability to estimate market size for specific brands based on validated field-level intelligence.
Our data mining techniques incorporate both parametric and non-parametric methods, allowing for structured data collection, sorting, processing, and cleaning.
Demand projections are derived from large-scale data sets analyzed through proprietary algorithms, culminating in robust and reliable market sizing.
Research Approach
The bottom-up approach builds market estimates by starting with the smallest addressable market units and systematically aggregating them to create comprehensive market size projections.
This method begins with specific, granular data points and builds upward to create the complete market landscape.
Customer Analysis → Segmental Analysis → Geographical Analysis
The top-down approach starts with the broadest possible market data and systematically narrows it down through a series of filters and assumptions to arrive at specific market segments or opportunities.
This method begins with the big picture and works downward to increasingly specific market slices.
TAM → SAM → SOM


Research Methods
Desk / Secondary Research
While analysing the market, we extensively study secondary sources, directories, and databases to identify and collect information useful for this technical, market-oriented, and commercial report. Secondary sources that we utilize are not only the public sources, but it is a combination of Open Source, Associations, Paid Databases, MG Repository & Knowledgebase, and others.
- Company websites, annual reports, financial reports, broker reports, and investor presentations
- National government documents, statistical databases and reports
- News articles, press releases and web-casts specific to the companies operating in the market, Magazines, reports, and others
- We gather information from commercial data sources for deriving company specific data such as segmental revenue, share for geography, product revenue, and others
- Internal and external proprietary databases (industry-specific), relevant patent, and regulatory databases
- Governing Bodies, Government Organizations
- Relevant Authorities, Country-specific Associations for Industries
We also employ the model mapping approach to estimate the product level market data through the players' product portfolio
Primary Research
Primary research/ interviews is vital in analyzing the market. Most of the cases involves paid primary interviews. Primary sources include primary interviews through e-mail interactions, telephonic interviews, surveys as well as face-to-face interviews with the different stakeholders across the value chain including several industry experts.
| Type of Respondents | Number of Primaries |
|---|---|
| Tier 2/3 Suppliers | ~20 |
| Tier 1 Suppliers | ~25 |
| End-users | ~25 |
| Industry Expert/ Panel/ Consultant | ~30 |
| Total | ~100 |
MG Knowledgebase
• Repository of industry blog, newsletter and case studies
• Online platform covering detailed market reports, and company profiles
Forecasting Factors and Models
Forecasting Factors
- Historical Trends – Past market patterns, cycles, and major events that shaped how markets behave over time. Understanding past trends helps predict future behavior.
- Industry Factors – Specific characteristics of the industry like structure, regulations, and innovation cycles that affect market dynamics.
- Macroeconomic Factors – Economic conditions like GDP growth, inflation, and employment rates that affect how much money people have to spend.
- Demographic Factors – Population characteristics like age, income, and location that determine who can buy your product.
- Technology Factors – How quickly people adopt new technology and how much technology infrastructure exists.
- Regulatory Factors – Government rules, laws, and policies that can help or restrict market growth.
- Competitive Factors – Analyzing competition structure such as degree of competition and bargaining power of buyers and suppliers.
Forecasting Models / Techniques
Multiple Regression Analysis
- Identify and quantify factors that drive market changes
- Statistical modeling to establish relationships between market drivers and outcomes
Time Series Analysis – Seasonal Patterns
- Understand regular cyclical patterns in market demand
- Advanced statistical techniques to separate trend, seasonal, and irregular components
Time Series Analysis – Trend Analysis
- Identify underlying market growth patterns and momentum
- Statistical analysis of historical data to project future trends
Expert Opinion – Expert Interviews
- Gather deep industry insights and contextual understanding
- In-depth interviews with key industry stakeholders
Multi-Scenario Development
- Prepare for uncertainty by modeling different possible futures
- Creating optimistic, pessimistic, and most likely scenarios
Time Series Analysis – Moving Averages
- Sophisticated forecasting for complex time series data
- Auto-regressive integrated moving average models with seasonal components
Econometric Models
- Apply economic theory to market forecasting
- Sophisticated economic models that account for market interactions
Expert Opinion – Delphi Method
- Harness collective wisdom of industry experts
- Structured, multi-round expert consultation process
Monte Carlo Simulation
- Quantify uncertainty and probability distributions
- Thousands of simulations with varying input parameters
Research Analysis
Our research framework is built upon the fundamental principle of validating market intelligence from both demand and supply perspectives. This dual-sided approach ensures comprehensive market understanding and reduces the risk of single-source bias.
Demand-Side Analysis: We understand end-user/application behavior, preferences, and market needs along with the penetration of the product for specific application.
Supply-Side Analysis: We estimate overall market revenue, analyze the segmental share along with industry capacity, competitive landscape, and market structure.
Validation & Evaluation
Data triangulation is a validation technique that uses multiple methods, sources, or perspectives to examine the same research question, thereby increasing the credibility and reliability of research findings. In market research, triangulation serves as a quality assurance mechanism that helps identify and minimize bias, validate assumptions, and ensure accuracy in market estimates.
- Data Source Triangulation – Using multiple data sources to examine the same phenomenon
- Methodological Triangulation – Using multiple research methods to study the same research question
- Investigator Triangulation – Using multiple researchers or analysts to examine the same data
- Theoretical Triangulation – Using multiple theoretical perspectives to interpret the same data

Custom Market Research Services
We will customise the research for you, in case the report listed above does not meet your requirements.
Get 10% Free Customisation