Industrial Computer Vision Market Size, Share & Trends Analysis Report by Component (Cameras, Lenses & Optics, Lighting Systems, Image Processing Software, Vision Processors & AI Accelerators, Mounts & Housings, Others), Technology, Type, Function, Deployment Model, System Integration Level, Communication Interface, Application, End-Use Industry and Geography (North America, Europe, Asia Pacific, Middle East, Africa, and South America) – Global Industry Data, Trends, and Forecasts, 2026–2035
|
Market Structure & Evolution |
|
|
Segmental Data Insights |
|
|
Demand Trends |
|
|
Competitive Landscape |
|
|
Strategic Development |
|
|
Future Outlook & Opportunities |
|
Industrial Computer Vision Market Size, Share, and Growth
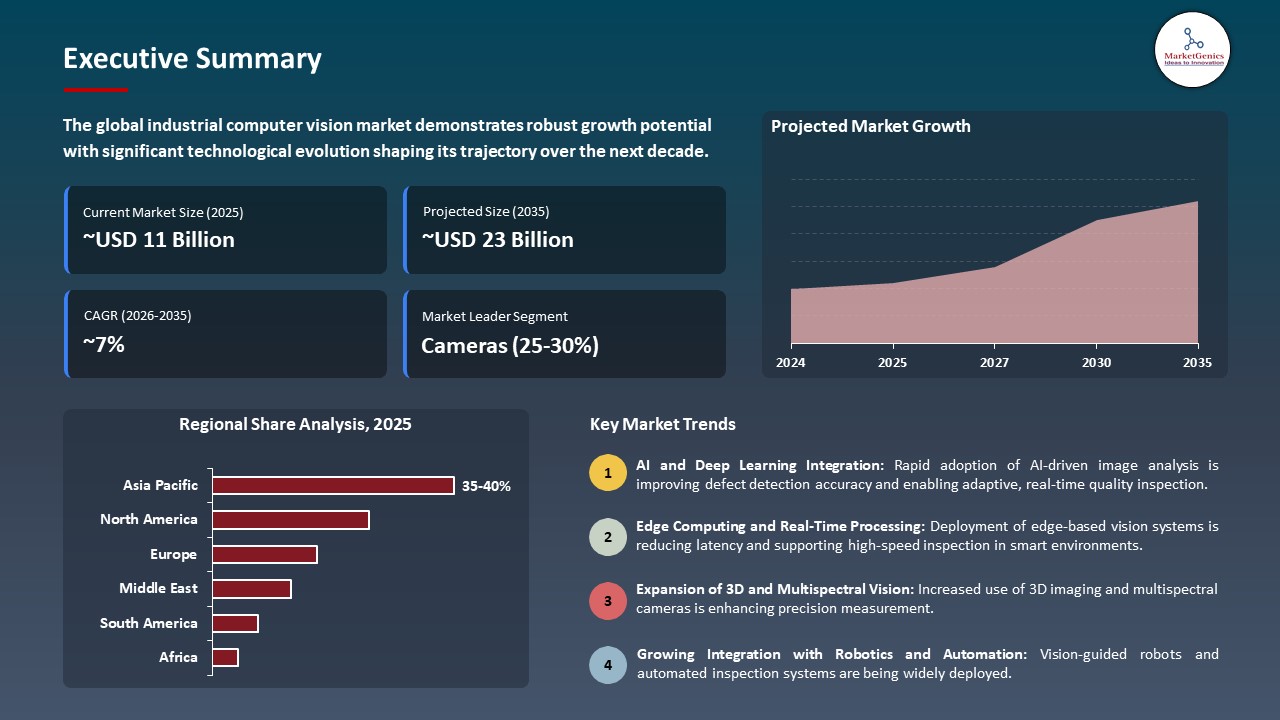
The global industrial computer vision market is experiencing robust growth, with its estimated value of USD 11.3 billion in the year 2025 and USD 22.7 billion by 2035, registering a CAGR of 7.2% during the forecast period. Globally, the industrial computer vision market is a growing sector of the world economy, with significant growth being driven by several factors that will support the development of advanced AI vision systems for manufacturing, logistics, automotive, electronics, and many other industries.
Allen Holmes Jr., AI Innovation Leader at Lenovo, stated, “AI-driven quality inspection is revolutionizing manufacturing through real-time defect identification, minimizing waste, and enhancing production efficiency. Our collaboration with Trifork guarantees that manufacturers can implement a validated, scalable, and secure edge AI vision solution that effortlessly integrates into their processes and raises quality control to enhanced levels.
The AI-powered vision systems have made it easier to inspect the quality of products in real time, to identify & detect product defects, and optimally manage process flow in a more efficient way than has ever been possible. In March 2025, Cognex released its In-Sight 9002 Vision System with learning capabilities, so that manufacturers can better inspect assembly lines and detect complex defects earlier in production and also increase productivity. Keyence released their latest AI-CV-X Vision System in June 2025 and it integrates edge computing and smart analytics to improve inspection time and accuracy in high-speed manufacturing environments by up to 90%.
There are other possibilities beside this in relation to the market, such as robotic vision or integration and 3D scan, real-time monitoring, automatic sorting, and warehouse logistics optimization. In addition to these three other applications of robotics and machinery, the use of these adjacent areas of opportunity enables manufacturers to improve productivity, reduce material waste, maximize revenue, and continue to innovate robotics in the field of industrial automation.
 Industrial Computer Vision Market Dynamics and Trends
Driver: Increasing Automation Demand Driving Adoption of Advanced Industrial Vision Systems
-
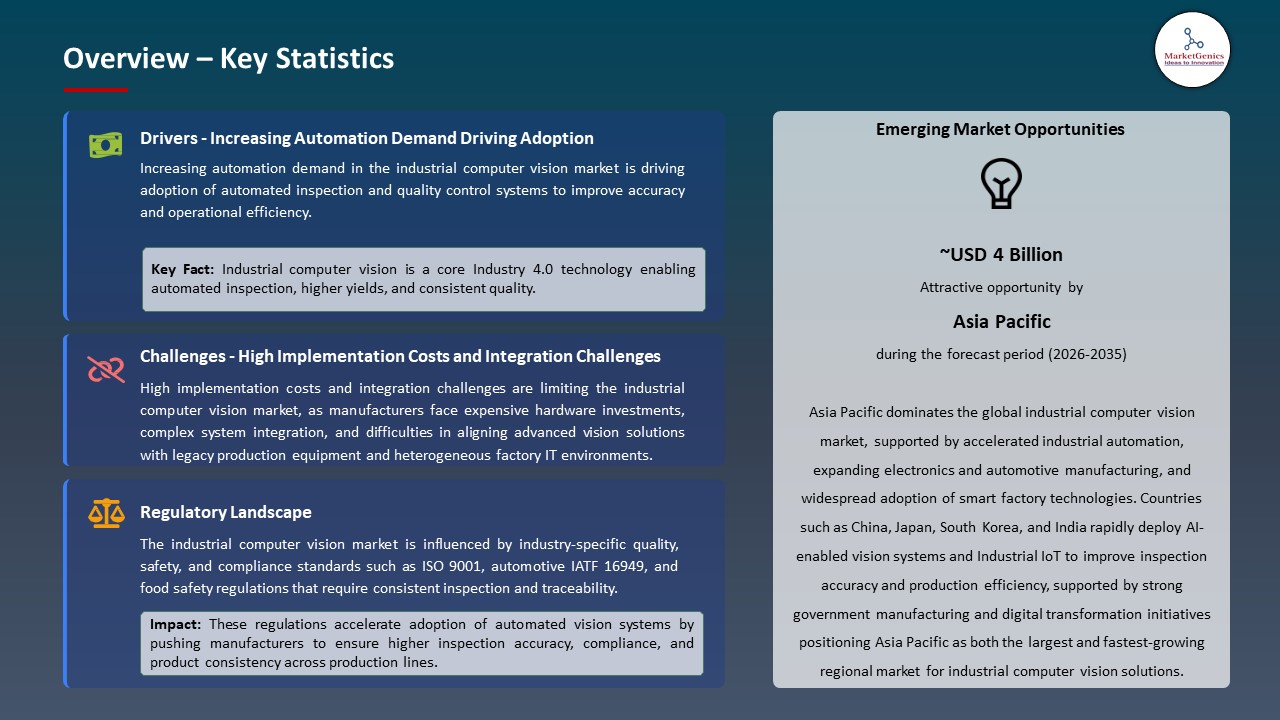
The rapid adoption of Industry 4.0 technologies and initiatives around smart factories continues to drive the deployment of industrial computer vision systems within the manufacturing, electronics, automotive and logistics sectors. The growing use of AI-enhanced vision systems by manufacturers in detecting defects in real-time, inspecting quality and optimizing processes are aiding in achieving greater yield and reducing human error.
- Product launches such as Mitsubishi Electric’s AI-enhanced 3D vision system for inline quality control show that the momentum behind automated visual inspection systems continues to grow. Integration with edge computing and IoT enables the visual systems to locally process high-speed visual data, increasing the ability for real-time decisions to be made on the production lines, thus addressing the growing need for precision automation.
- The additional investment being made into AI startups that focus on vision technology, such as RealSense transitioning from Intel with USD 50 Mn in funding to scale globally AI and vision-related solutions, shows a compounding level of confidence in the growth of the vision market. All these factors are likely to boost the growth of the industrial computer vision market.
Restraint: High Implementation Costs and Integration Challenges Hindering Widespread Deployment
-
The demand for industrial vision technology is high, small/medium enterprises (e.g., small/medium businesses) face challenges when adopting industrial vision technology because of the initial capital expenditures associated with the purchase of industrial vision cameras, AI. -enabled software, and system integration services. The costs associated with purchasing specialized lenses, 3D sensors, and deep learning processors create a significant hurdle for small manufacturers who want to use industrial vision systems in their manufacturing process.
- The need for increased data management and heightened cybersecurity measures also serves as a limiting factor for the growth and proliferation of industrial vision technology. The need for significant storage, edge compute capacity, and secure network infrastructure to support real-time high-res image streaming creates additional operational complexity.
- Additionally, providing the necessary training and adjusting work processes to allow operators to effectively interpret AI-based insights while creating the necessary environment to maintain the operation of the vision systems creates additional barriers for those industries that are not highly technical. Manufacturing variability (e.g., differing lighting levels or surface reflectiveness) among various manufacturing environments increases difficulty when deploying industrial vision technology.
- Therefore, implementing industrial vision systems will require customized calibration/testing/validation before full-scale commercialization. All these elements are expected to restrict the expansion of the industrial computer vision market.
Opportunity: Expansion into Emerging Regions and New Industry Verticals
-
Manufacturers in Asia-Pacific, Latin America, and the Middle East are increasingly turning to vision systems to increase their productivity through the implementation of smart inspection and automated monitoring. Because, there are major opportunities for vision system providers due to a rapid increase in industrialization and automation efforts across these regions.
- The use of vision-guided solutions in areas close to manufacturing, such as robotic vision for collaborative robots (cobots) or warehouse automation, is providing new sources of revenue for vendors. This has enabled these same companies to venture into new application areas, rather than solely focusing on quality inspections.
- Declines in both the costs of sensors and cameras, as well as improvements in vision software platforms that make them easier to use for end users, have also led to the creation of a broader base of customers among small and mid-sized enterprises (SMEs). And thus, is expected to create more opportunities in future for industrial computer vision market.
Key Trend: Convergence of AI, 3D Vision, and Real‑Time Analytics Enhancing Market Capabilities
-
The use of deep learning models and AI-based image analysis has enabled the development of vision-based systems on par with people (or close enough to), providing humans with the ability to locate and categorize defects in their images.3D vision technology can also provide real-world "depth perception." This is important for completing tasks that require a substantial amount of time and skill, such as picking things up from a bin (as found in industrial-type settings) or performing tasks autonomously (i.e., using autonomous robots).
- The integration of real-time vision analytics with robotics, such as the AI-assisted humanoid robots being developed in manufacturing environments, indicates a larger shift towards vision-focused automation that offers manufacturers increased flexibility and efficiency.
- The continued growth in the integration of visual technologies into the field of cloud computing and remote data analysis has allowed manufacturers to centralize their operational data across multiple sites. Therefore, they can perform predictive maintenance on your visuals and help optimally align your bucket between plants. All these elements are expected to influence significant trends in the industrial computer vision market.
 Industrial Computer Vision Market Analysis and Segmental Data
Cameras Dominate Global Industrial Computer Vision Market amid Demand for Automated Inspection
-
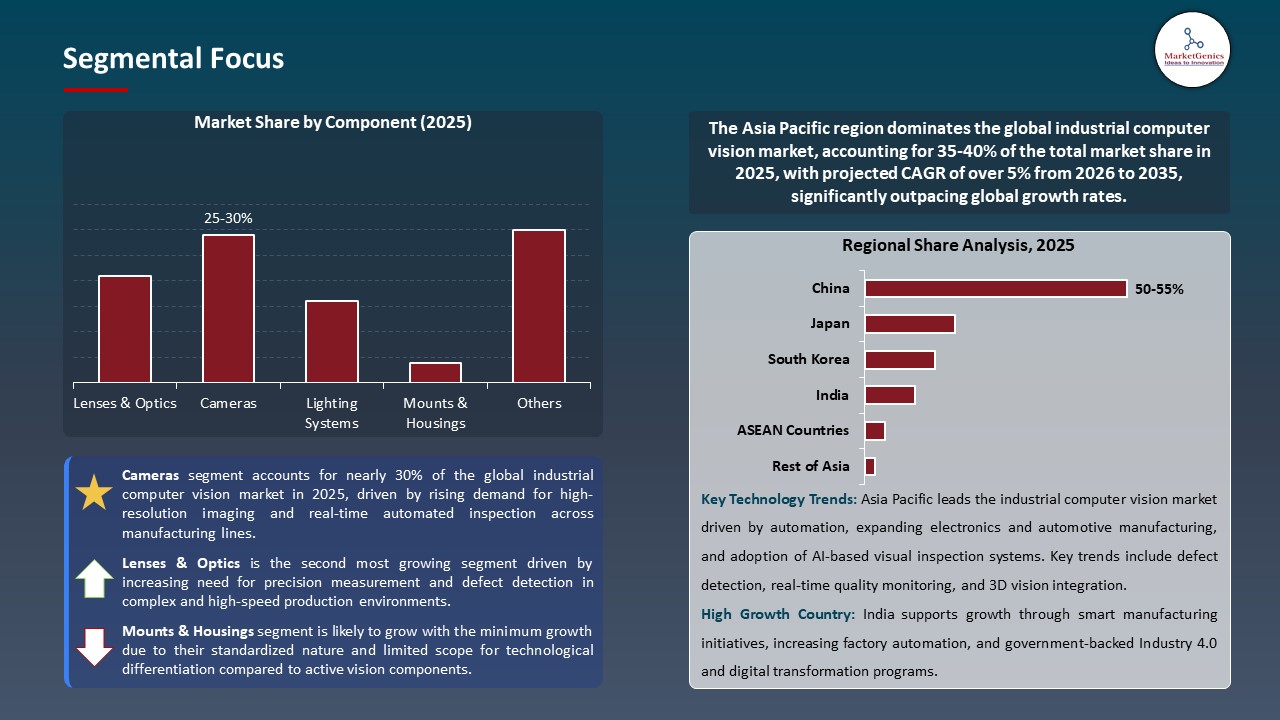
Industrial cameras have gradually become the dominant force in worldwide industrial computer vision systems as manufacturers have focused on automating their quality inspections and monitoring their processes in real time for higher accuracy and better product consistency. Due to the increasing trend of smart manufacturing and Industry 4.0, it is estimated that over 70% of all automated manufacturing systems include a vision camera for detecting defects, guiding robotic arms, and measuring dimensional tolerances.
- The benefits of having these camera systems in place include high-resolution images, greater frame rates, and the ability to apply artificial intelligence (AI) analytics to detect faults earlier in the manufacturing process, which also help reduce an organization's reliance on manual inspection processes to detect faults and ultimately reduce scrap and rework rates. Recently, Ford Motor Company using AI-enabled cameras in their U.S. assembly plants to detect millimeter-scale defects instantly, which reduced the number of vehicles recalls.
- Owing to technological advancements related to sensors, better connection options via edge computing, and expanding use cases for new inspection techniques (such as 3D imaging and hyperspectral imaging), cameras have become the "primary" component of all industrial computer vision solutions globally. Thus, are expected to remain the dominant type of sensor in the industrial computer vision market.
Asia Pacific Dominates Industrial Computer Vision Market amid Rapid Industrialization and Smart Factory Adoption
-
Rapid industrialization, a solid manufacturing base, and the adoption of smart factories across significant countries like China, Japan, South Korea, and India have united to help the Asia Pacific region be the leader in the worldwide industrial computer vision market. Governments in this area are also supporting the growth of industrial computer vision market through programs such as China’s Industry 4.0 initiative and large investments into digital transformation.
- Manufacturers here are increasingly installing vision systems for quality inspection, defect detection, and production monitoring as a means of increasing operational efficiency while also complying with high-quality standards. China has the largest share of the Asia Pacific machine vision market, which is being driven by the rapid increase of electronics, automotive, and semiconductor manufacturing.
- For instance, Gulfood Manufacturing 2025 exhibition, which demonstrated how manufactures are combining automation and data to create a unified system to produce quality products based on real-time data processing in food and beverage manufacturing facilities. All these factors supports region’s growth and solidifies Asia Pacific’s lead in the industrial computer vision market.
Industrial Computer Vision Market Ecosystem
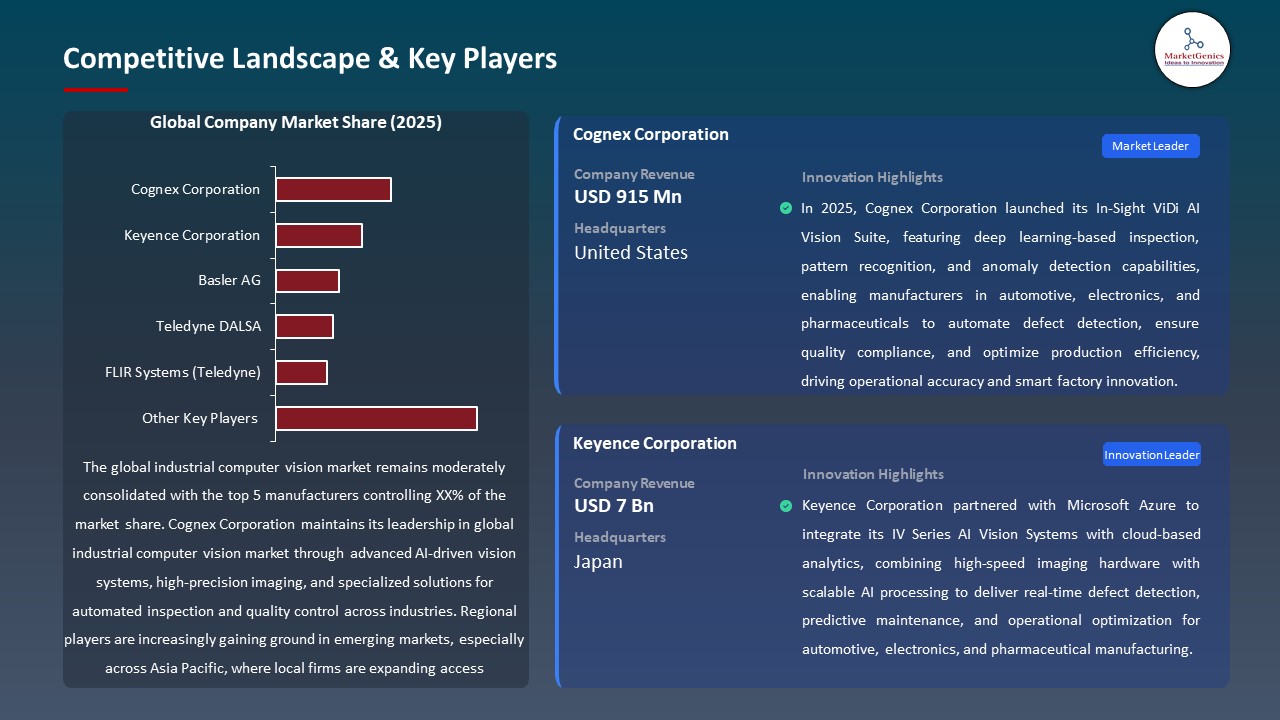
The industrial computer vision industry is moderately consolidated; with their cutting-edge machine vision hardware and AI software, Cognex Corporation, Keyence Corporation, Basler AG, Omron Corporation, Teledyne DALSA, and Sony Corporation captured a large segment of the industrial computer vision market. They have taken advantage of the technological advantages of modern-day solutions, including deep learning, edge computing, high-resolution sensors, and integrated analytics, to maintain their competitive edge in the marketplace.
Cognex offers Cloud-native AI Vision Platforms, and Keyence has launched Advanced 3D Imaging and High-Speed Imaging Systems that provide advanced defect detection and precision measurement capabilities. Together, they represent two different solutions that address the same problems in the manufacturing space. In addition, Basler's modular camera solutions and Sony's High-Performance Imaging Sensors stimulate further innovation in this space, meeting the specific needs of different industries.
Furthermore, government and research institutions continue to develop next-generation vision technologies, with Mitsubishi Electric's launch in June 2025, for an AI-enabled 3D Vision System for inline quality control in the automotive and electronics industries being one example of real-world technological collaboration.
 Recent Development and Strategic Overview:
-
In April 2025, Metropolis for factories platform from NVIDIA extended to allow the manufacture of AI-based systems to help monitor the safety of workers, track their assets using edge-based GPUs, and detect defects by using artificial Intelligence (AI). Through the use of video analysis in real-time along with deep learning, the factory can reduce inventory costs, increase quality, and automatically inspect visually.
- In February 2025, Teledyne DALSA recently released a series of high-speed CMOS line-scan cameras that are especially intended for semiconductor and electronics manufacturing. Their series provides better image resolution, faster data throughput, and enables manufacturers to identify microscopic defects during high-volume production. In addition, their series of cameras offers manufacturers a reliable method to provide real-time visual inspection and ensure compliance with high levels of quality assurance.
Report Scope
|
Attribute |
Detail |
|
Market Size in 2025 |
USD 11.3 Bn |
|
Market Forecast Value in 2035 |
USD 22.7 Bn |
|
Growth Rate (CAGR) |
7.2% |
|
Forecast Period |
2026 – 2035 |
|
Historical Data Available for |
2021 – 2024 |
|
Market Size Units |
USD Bn for Value Million Units for Volume |
|
Report Format |
Electronic (PDF) + Excel |
|
Regions and Countries Covered |
|||||
|
North America |
Europe |
Asia Pacific |
Middle East |
Africa |
South America |
|
|
|
|
|
|
|
Companies Covered |
|||||
|
|
|
|
|
|
Industrial Computer Vision Market Segmentation and Highlights
|
Segment |
Sub-segment |
|
Industrial Computer Vision Market, By Component |
|
|
Industrial Computer Vision Market, By Technology |
|
|
Industrial Computer Vision Market, By Type |
|
|
Industrial Computer Vision Market, By Function |
|
|
Industrial Computer Vision Market, By Deployment Model |
|
|
Industrial Computer Vision Market, By System Integration Level |
|
|
Industrial Computer Vision Market, By Communication Interface |
|
|
Industrial Computer Vision Market, By Application |
|
|
Industrial Computer Vision Market, By End-Use Industry |
|
Frequently Asked Questions
Table of Contents
- 1. Research Methodology and Assumptions
- 1.1. Definitions
- 1.2. Research Design and Approach
- 1.3. Data Collection Methods
- 1.4. Base Estimates and Calculations
- 1.5. Forecasting Models
- 1.5.1. Key Forecast Factors & Impact Analysis
- 1.6. Secondary Research
- 1.6.1. Open Sources
- 1.6.2. Paid Databases
- 1.6.3. Associations
- 1.7. Primary Research
- 1.7.1. Primary Sources
- 1.7.2. Primary Interviews with Stakeholders across Ecosystem
- 2. Executive Summary
- 2.1. Global Industrial Computer Vision Market Outlook
- 2.1.1. Industrial Computer Vision Market Size (Value - US$ Bn and Volume - Million Units), and Forecasts, 2021-2035
- 2.1.2. Compounded Annual Growth Rate Analysis
- 2.1.3. Growth Opportunity Analysis
- 2.1.4. Segmental Share Analysis
- 2.1.5. Geographical Share Analysis
- 2.2. Market Analysis and Facts
- 2.3. Supply-Demand Analysis
- 2.4. Competitive Benchmarking
- 2.5. Go-to- Market Strategy
- 2.5.1. Customer/ End-use Industry Assessment
- 2.5.2. Growth Opportunity Data, 2026-2035
- 2.5.2.1. Regional Data
- 2.5.2.2. Country Data
- 2.5.2.3. Segmental Data
- 2.5.3. Identification of Potential Market Spaces
- 2.5.4. GAP Analysis
- 2.5.5. Potential Attractive Price Points
- 2.5.6. Prevailing Market Risks & Challenges
- 2.5.7. Preferred Sales & Marketing Strategies
- 2.5.8. Key Recommendations and Analysis
- 2.5.9. A Way Forward
- 2.1. Global Industrial Computer Vision Market Outlook
- 3. Industry Data and Premium Insights
- 3.1. Global Automation & Process Control Industry Overview, 2025
- 3.1.1. Automation & Process Control Ecosystem Analysis
- 3.1.2. Key Trends for Automation & Process Control Industry
- 3.1.3. Regional Distribution for Automation & Process Control Industry
- 3.2. Supplier Customer Data
- 3.3. Technology Roadmap and Developments
- 3.4. Trade Analysis
- 3.4.1. Import & Export Analysis, 2025
- 3.4.2. Top Importing Countries
- 3.4.3. Top Exporting Countries
- 3.5. Trump Tariff Impact Analysis
- 3.5.1. Manufacturer
- 3.5.1.1. Based on the component & Raw material
- 3.5.2. Supply Chain
- 3.5.3. End Consumer
- 3.5.1. Manufacturer
- 3.6. Raw Material Analysis
- 3.1. Global Automation & Process Control Industry Overview, 2025
- 4. Market Overview
- 4.1. Market Dynamics
- 4.1.1. Drivers
- 4.1.1.1. Rising demand for automated inspection, quality control, and defect detection across manufacturing industries.
- 4.1.1.2. Growing adoption of AI- and deep learning-based vision systems for real-time image analysis and decision-making.
- 4.1.1.3. Increasing investments in smart factories, robotics, and Industrial IoT integration.
- 4.1.2. Restraints
- 4.1.2.1. High implementation and maintenance costs of advanced computer vision hardware and software.
- 4.1.2.2. Integration challenges with legacy production systems and lack of skilled professionals.
- 4.1.1. Drivers
- 4.2. Key Trend Analysis
- 4.3. Regulatory Framework
- 4.3.1. Key Regulations, Norms, and Subsidies, by Key Countries
- 4.3.2. Tariffs and Standards
- 4.3.3. Impact Analysis of Regulations on the Market
- 4.4. Value Chain Analysis
- 4.4.1. Component Suppliers
- 4.4.2. System Integrators/ Technology Providers
- 4.4.3. Industrial Computer Vision Solution Providers
- 4.4.4. End Users
- 4.5. Cost Structure Analysis
- 4.6. Porter’s Five Forces Analysis
- 4.7. PESTEL Analysis
- 4.8. Global Industrial Computer Vision Market Demand
- 4.8.1. Historical Market Size –Value (US$ Bn) and Volume (Million Units), 2020-2024
- 4.8.2. Current and Future Market Size –Value (US$ Bn) and Volume (Million Units), 2026–2035
- 4.8.2.1. Y-o-Y Growth Trends
- 4.8.2.2. Absolute $ Opportunity Assessment
- 4.1. Market Dynamics
- 5. Competition Landscape
- 5.1. Competition structure
- 5.1.1. Fragmented v/s consolidated
- 5.2. Company Share Analysis, 2025
- 5.2.1. Global Company Market Share
- 5.2.2. By Region
- 5.2.2.1. North America
- 5.2.2.2. Europe
- 5.2.2.3. Asia Pacific
- 5.2.2.4. Middle East
- 5.2.2.5. Africa
- 5.2.2.6. South America
- 5.3. Product Comparison Matrix
- 5.3.1. Specifications
- 5.3.2. Market Positioning
- 5.3.3. Pricing
- 5.1. Competition structure
- 6. Global Industrial Computer Vision Market Analysis, by Component
- 6.1. Key Segment Analysis
- 6.2. Industrial Computer Vision Market Size (Value - US$ Bn and Volume - Million Units), Analysis, and Forecasts, by Component, 2021-2035
- 6.2.1. Cameras
- 6.2.2. Lenses & Optics
- 6.2.3. Lighting Systems
- 6.2.4. Image Processing Software
- 6.2.5. Vision Processors & AI Accelerators
- 6.2.6. Mounts & Housings
- 6.2.7. Others
- 7. Global Industrial Computer Vision Market Analysis, by Technology
- 7.1. Key Segment Analysis
- 7.2. Industrial Computer Vision Market Size (Value - US$ Bn and Volume - Million Units), Analysis, and Forecasts, by Technology, 2021-2035
- 7.2.1. 2D Vision Systems
- 7.2.2. 3D Vision Systems
- 7.2.3. Infrared/Thermal Imaging
- 7.2.4. Hyperspectral Imaging
- 7.2.5. Time-of-Flight (ToF)
- 7.2.6. Structured Light Scanning
- 7.2.7. Others
- 8. Global Industrial Computer Vision Market Analysis, by Type
- 8.1. Key Segment Analysis
- 8.2. Industrial Computer Vision Market Size (Value - US$ Bn and Volume - Million Units), Analysis, and Forecasts, by Type, 2021-2035
- 8.2.1. Stationary Vision Systems
- 8.2.2. Integrated/Embedded Vision Systems
- 8.2.3. Portable Vision Systems
- 8.2.4. Robotic Vision Systems
- 8.2.5. Others
- 9. Global Industrial Computer Vision Market Analysis, by Function
- 9.1. Key Segment Analysis
- 9.2. Industrial Computer Vision Market Size (Value - US$ Bn and Volume - Million Units), Analysis, and Forecasts, by Function, 2021-2035
- 9.2.1. Inspection & Defect Detection
- 9.2.2. Measurement & Gauging
- 9.2.3. Identification & OCR/Barcode Reading
- 9.2.4. Object Recognition & Classification
- 9.2.5. Guidance & Alignment
- 9.2.6. Sorting & Tracking
- 9.2.7. Others
- 10. Global Industrial Computer Vision Market Analysis, by Deployment Model
- 10.1. Key Segment Analysis
- 10.2. Industrial Computer Vision Market Size (Value - US$ Bn and Volume - Million Units), Analysis, and Forecasts, by Deployment Model, 2021-2035
- 10.2.1. On-Premises
- 10.2.2. Cloud-Enabled/ Hybrid
- 11. Global Industrial Computer Vision Market Analysis, by System Integration Level
- 11.1. Key Segment Analysis
- 11.2. Industrial Computer Vision Market Size (Value - US$ Bn and Volume - Million Units), Analysis, and Forecasts, by System Integration Level, 2021-2035
- 11.2.1. Standalone Vision Solutions
- 11.2.2. Integrated with Robotics/Automation Lines
- 11.2.3. Integrated with MES/ERP Systems
- 12. Global Industrial Computer Vision Market Analysis, by Communication Interface
- 12.1. Key Segment Analysis
- 12.2. Industrial Computer Vision Market Size (Value - US$ Bn and Volume - Million Units), Analysis, and Forecasts, by Communication Interface, 2021-2035
- 12.2.1. GigE Vision
- 12.2.2. USB Vision
- 12.2.3. Camera Link
- 12.2.4. CoaXPress
- 12.2.5. Wireless Interfaces
- 12.2.6. Others
- 13. Global Industrial Computer Vision Market Analysis, by Application
- 13.1. Key Segment Analysis
- 13.2. Industrial Computer Vision Market Size (Value - US$ Bn and Volume - Million Units), Analysis, and Forecasts, by Application, 2021-2035
- 13.2.1. Quality Inspection
- 13.2.2. Surface & Defect Detection
- 13.2.3. Robot Guidance
- 13.2.4. Process Control
- 13.2.5. Sorting & Classification
- 13.2.6. Traceability & Identification
- 13.2.7. Others
- 14. Global Industrial Computer Vision Market Analysis, by End-Use Industry
- 14.1. Key Segment Analysis
- 14.2. Industrial Computer Vision Market Size (Value - US$ Bn and Volume - Million Units), Analysis, and Forecasts, by End-Use Industry, 2021-2035
- 14.2.1. Automotive
- 14.2.2. Electronics & Semiconductor
- 14.2.3. Food & Beverage
- 14.2.4. Pharmaceuticals
- 14.2.5. Packaging
- 14.2.6. Logistics & Warehousing
- 14.2.7. Aerospace & Defense
- 14.2.8. Metals & Machinery
- 14.2.9. Others
- 15. Global Industrial Computer Vision Market Analysis and Forecasts, by Region
- 15.1. Key Findings
- 15.2. Industrial Computer Vision Market Size (Value - US$ Bn and Volume - Million Units), Analysis, and Forecasts, by Region, 2021-2035
- 15.2.1. North America
- 15.2.2. Europe
- 15.2.3. Asia Pacific
- 15.2.4. Middle East
- 15.2.5. Africa
- 15.2.6. South America
- 16. North America Industrial Computer Vision Market Analysis
- 16.1. Key Segment Analysis
- 16.2. Regional Snapshot
- 16.3. North America Industrial Computer Vision Market Size Value - US$ Bn and Volume - Million Units), Analysis, and Forecasts, 2021-2035
- 16.3.1. Component
- 16.3.2. Technology
- 16.3.3. Type
- 16.3.4. Function
- 16.3.5. Deployment Model
- 16.3.6. System Integration Level
- 16.3.7. Communication Interface
- 16.3.8. Application
- 16.3.9. End-Use Industry
- 16.3.10. Country
- 16.3.10.1. USA
- 16.3.10.2. Canada
- 16.3.10.3. Mexico
- 16.4. USA Industrial Computer Vision Market
- 16.4.1. Country Segmental Analysis
- 16.4.2. Component
- 16.4.3. Technology
- 16.4.4. Type
- 16.4.5. Function
- 16.4.6. Deployment Model
- 16.4.7. System Integration Level
- 16.4.8. Communication Interface
- 16.4.9. Application
- 16.4.10. End-Use Industry
- 16.5. Canada Industrial Computer Vision Market
- 16.5.1. Country Segmental Analysis
- 16.5.2. Component
- 16.5.3. Technology
- 16.5.4. Type
- 16.5.5. Function
- 16.5.6. Deployment Model
- 16.5.7. System Integration Level
- 16.5.8. Communication Interface
- 16.5.9. Application
- 16.5.10. End-Use Industry
- 16.6. Mexico Industrial Computer Vision Market
- 16.6.1. Country Segmental Analysis
- 16.6.2. Component
- 16.6.3. Technology
- 16.6.4. Type
- 16.6.5. Function
- 16.6.6. Deployment Model
- 16.6.7. System Integration Level
- 16.6.8. Communication Interface
- 16.6.9. Application
- 16.6.10. End-Use Industry
- 17. Europe Industrial Computer Vision Market Analysis
- 17.1. Key Segment Analysis
- 17.2. Regional Snapshot
- 17.3. Europe Industrial Computer Vision Market Size (Value - US$ Bn and Volume - Million Units), Analysis, and Forecasts, 2021-2035
- 17.3.1. Component
- 17.3.2. Technology
- 17.3.3. Type
- 17.3.4. Function
- 17.3.5. Deployment Model
- 17.3.6. System Integration Level
- 17.3.7. Communication Interface
- 17.3.8. Application
- 17.3.9. End-Use Industry
- 17.3.10. Country
- 17.3.10.1. Germany
- 17.3.10.2. United Kingdom
- 17.3.10.3. France
- 17.3.10.4. Italy
- 17.3.10.5. Spain
- 17.3.10.6. Netherlands
- 17.3.10.7. Nordic Countries
- 17.3.10.8. Poland
- 17.3.10.9. Russia & CIS
- 17.3.10.10. Rest of Europe
- 17.4. Germany Industrial Computer Vision Market
- 17.4.1. Country Segmental Analysis
- 17.4.2. Component
- 17.4.3. Technology
- 17.4.4. Type
- 17.4.5. Function
- 17.4.6. Deployment Model
- 17.4.7. System Integration Level
- 17.4.8. Communication Interface
- 17.4.9. Application
- 17.4.10. End-Use Industry
- 17.5. United Kingdom Industrial Computer Vision Market
- 17.5.1. Country Segmental Analysis
- 17.5.2. Component
- 17.5.3. Technology
- 17.5.4. Type
- 17.5.5. Function
- 17.5.6. Deployment Model
- 17.5.7. System Integration Level
- 17.5.8. Communication Interface
- 17.5.9. Application
- 17.5.10. End-Use Industry
- 17.6. France Industrial Computer Vision Market
- 17.6.1. Country Segmental Analysis
- 17.6.2. Component
- 17.6.3. Technology
- 17.6.4. Type
- 17.6.5. Function
- 17.6.6. Deployment Model
- 17.6.7. System Integration Level
- 17.6.8. Communication Interface
- 17.6.9. Application
- 17.6.10. End-Use Industry
- 17.7. Italy Industrial Computer Vision Market
- 17.7.1. Country Segmental Analysis
- 17.7.2. Component
- 17.7.3. Technology
- 17.7.4. Type
- 17.7.5. Function
- 17.7.6. Deployment Model
- 17.7.7. System Integration Level
- 17.7.8. Communication Interface
- 17.7.9. Application
- 17.7.10. End-Use Industry
- 17.8. Spain Industrial Computer Vision Market
- 17.8.1. Country Segmental Analysis
- 17.8.2. Component
- 17.8.3. Technology
- 17.8.4. Type
- 17.8.5. Function
- 17.8.6. Deployment Model
- 17.8.7. System Integration Level
- 17.8.8. Communication Interface
- 17.8.9. Application
- 17.8.10. End-Use Industry
- 17.9. Netherlands Industrial Computer Vision Market
- 17.9.1. Country Segmental Analysis
- 17.9.2. Component
- 17.9.3. Technology
- 17.9.4. Type
- 17.9.5. Function
- 17.9.6. Deployment Model
- 17.9.7. System Integration Level
- 17.9.8. Communication Interface
- 17.9.9. Application
- 17.9.10. End-Use Industry
- 17.10. Nordic Countries Industrial Computer Vision Market
- 17.10.1. Country Segmental Analysis
- 17.10.2. Component
- 17.10.3. Technology
- 17.10.4. Type
- 17.10.5. Function
- 17.10.6. Deployment Model
- 17.10.7. System Integration Level
- 17.10.8. Communication Interface
- 17.10.9. Application
- 17.10.10. End-Use Industry
- 17.11. Poland Industrial Computer Vision Market
- 17.11.1. Country Segmental Analysis
- 17.11.2. Component
- 17.11.3. Technology
- 17.11.4. Type
- 17.11.5. Function
- 17.11.6. Deployment Model
- 17.11.7. System Integration Level
- 17.11.8. Communication Interface
- 17.11.9. Application
- 17.11.10. End-Use Industry
- 17.12. Russia & CIS Industrial Computer Vision Market
- 17.12.1. Country Segmental Analysis
- 17.12.2. Component
- 17.12.3. Technology
- 17.12.4. Type
- 17.12.5. Function
- 17.12.6. Deployment Model
- 17.12.7. System Integration Level
- 17.12.8. Communication Interface
- 17.12.9. Application
- 17.12.10. End-Use Industry
- 17.13. Rest of Europe Industrial Computer Vision Market
- 17.13.1. Country Segmental Analysis
- 17.13.2. Component
- 17.13.3. Technology
- 17.13.4. Type
- 17.13.5. Function
- 17.13.6. Deployment Model
- 17.13.7. System Integration Level
- 17.13.8. Communication Interface
- 17.13.9. Application
- 17.13.10. End-Use Industry
- 18. Asia Pacific Industrial Computer Vision Market Analysis
- 18.1. Key Segment Analysis
- 18.2. Regional Snapshot
- 18.3. Asia Pacific Industrial Computer Vision Market Size (Value - US$ Bn and Volume - Million Units), Analysis, and Forecasts, 2021-2035
- 18.3.1. Component
- 18.3.2. Technology
- 18.3.3. Type
- 18.3.4. Function
- 18.3.5. Deployment Model
- 18.3.6. System Integration Level
- 18.3.7. Communication Interface
- 18.3.8. Application
- 18.3.9. End-Use Industry
- 18.3.10. Country
- 18.3.10.1. China
- 18.3.10.2. India
- 18.3.10.3. Japan
- 18.3.10.4. South Korea
- 18.3.10.5. Australia and New Zealand
- 18.3.10.6. Indonesia
- 18.3.10.7. Malaysia
- 18.3.10.8. Thailand
- 18.3.10.9. Vietnam
- 18.3.10.10. Rest of Asia Pacific
- 18.4. China Industrial Computer Vision Market
- 18.4.1. Country Segmental Analysis
- 18.4.2. Component
- 18.4.3. Technology
- 18.4.4. Type
- 18.4.5. Function
- 18.4.6. Deployment Model
- 18.4.7. System Integration Level
- 18.4.8. Communication Interface
- 18.4.9. Application
- 18.4.10. End-Use Industry
- 18.5. India Industrial Computer Vision Market
- 18.5.1. Country Segmental Analysis
- 18.5.2. Component
- 18.5.3. Technology
- 18.5.4. Type
- 18.5.5. Function
- 18.5.6. Deployment Model
- 18.5.7. System Integration Level
- 18.5.8. Communication Interface
- 18.5.9. Application
- 18.5.10. End-Use Industry
- 18.6. Japan Industrial Computer Vision Market
- 18.6.1. Country Segmental Analysis
- 18.6.2. Component
- 18.6.3. Technology
- 18.6.4. Type
- 18.6.5. Function
- 18.6.6. Deployment Model
- 18.6.7. System Integration Level
- 18.6.8. Communication Interface
- 18.6.9. Application
- 18.6.10. End-Use Industry
- 18.7. South Korea Industrial Computer Vision Market
- 18.7.1. Country Segmental Analysis
- 18.7.2. Component
- 18.7.3. Technology
- 18.7.4. Type
- 18.7.5. Function
- 18.7.6. Deployment Model
- 18.7.7. System Integration Level
- 18.7.8. Communication Interface
- 18.7.9. Application
- 18.7.10. End-Use Industry
- 18.8. Australia and New Zealand Industrial Computer Vision Market
- 18.8.1. Country Segmental Analysis
- 18.8.2. Component
- 18.8.3. Technology
- 18.8.4. Type
- 18.8.5. Function
- 18.8.6. Deployment Model
- 18.8.7. System Integration Level
- 18.8.8. Communication Interface
- 18.8.9. Application
- 18.8.10. End-Use Industry
- 18.9. Indonesia Industrial Computer Vision Market
- 18.9.1. Country Segmental Analysis
- 18.9.2. Component
- 18.9.3. Technology
- 18.9.4. Type
- 18.9.5. Function
- 18.9.6. Deployment Model
- 18.9.7. System Integration Level
- 18.9.8. Communication Interface
- 18.9.9. Application
- 18.9.10. End-Use Industry
- 18.10. Malaysia Industrial Computer Vision Market
- 18.10.1. Country Segmental Analysis
- 18.10.2. Component
- 18.10.3. Technology
- 18.10.4. Type
- 18.10.5. Function
- 18.10.6. Deployment Model
- 18.10.7. System Integration Level
- 18.10.8. Communication Interface
- 18.10.9. Application
- 18.10.10. End-Use Industry
- 18.11. Thailand Industrial Computer Vision Market
- 18.11.1. Country Segmental Analysis
- 18.11.2. Component
- 18.11.3. Technology
- 18.11.4. Type
- 18.11.5. Function
- 18.11.6. Deployment Model
- 18.11.7. System Integration Level
- 18.11.8. Communication Interface
- 18.11.9. Application
- 18.11.10. End-Use Industry
- 18.12. Vietnam Industrial Computer Vision Market
- 18.12.1. Country Segmental Analysis
- 18.12.2. Component
- 18.12.3. Technology
- 18.12.4. Type
- 18.12.5. Function
- 18.12.6. Deployment Model
- 18.12.7. System Integration Level
- 18.12.8. Communication Interface
- 18.12.9. Application
- 18.12.10. End-Use Industry
- 18.13. Rest of Asia Pacific Industrial Computer Vision Market
- 18.13.1. Country Segmental Analysis
- 18.13.2. Component
- 18.13.3. Technology
- 18.13.4. Type
- 18.13.5. Function
- 18.13.6. Deployment Model
- 18.13.7. System Integration Level
- 18.13.8. Communication Interface
- 18.13.9. Application
- 18.13.10. End-Use Industry
- 19. Middle East Industrial Computer Vision Market Analysis
- 19.1. Key Segment Analysis
- 19.2. Regional Snapshot
- 19.3. Middle East Industrial Computer Vision Market Size (Value - US$ Bn and Volume - Million Units), Analysis, and Forecasts, 2021-2035
- 19.3.1. Component
- 19.3.2. Technology
- 19.3.3. Type
- 19.3.4. Function
- 19.3.5. Deployment Model
- 19.3.6. System Integration Level
- 19.3.7. Communication Interface
- 19.3.8. Application
- 19.3.9. End-Use Industry
- 19.3.10. Country
- 19.3.10.1. Turkey
- 19.3.10.2. UAE
- 19.3.10.3. Saudi Arabia
- 19.3.10.4. Israel
- 19.3.10.5. Rest of Middle East
- 19.4. Turkey Industrial Computer Vision Market
- 19.4.1. Country Segmental Analysis
- 19.4.2. Component
- 19.4.3. Technology
- 19.4.4. Type
- 19.4.5. Function
- 19.4.6. Deployment Model
- 19.4.7. System Integration Level
- 19.4.8. Communication Interface
- 19.4.9. Application
- 19.4.10. End-Use Industry
- 19.5. UAE Industrial Computer Vision Market
- 19.5.1. Country Segmental Analysis
- 19.5.2. Component
- 19.5.3. Technology
- 19.5.4. Type
- 19.5.5. Function
- 19.5.6. Deployment Model
- 19.5.7. System Integration Level
- 19.5.8. Communication Interface
- 19.5.9. Application
- 19.5.10. End-Use Industry
- 19.6. Saudi Arabia Industrial Computer Vision Market
- 19.6.1. Country Segmental Analysis
- 19.6.2. Component
- 19.6.3. Technology
- 19.6.4. Type
- 19.6.5. Function
- 19.6.6. Deployment Model
- 19.6.7. System Integration Level
- 19.6.8. Communication Interface
- 19.6.9. Application
- 19.6.10. End-Use Industry
- 19.7. Israel Industrial Computer Vision Market
- 19.7.1. Country Segmental Analysis
- 19.7.2. Component
- 19.7.3. Technology
- 19.7.4. Type
- 19.7.5. Function
- 19.7.6. Deployment Model
- 19.7.7. System Integration Level
- 19.7.8. Communication Interface
- 19.7.9. Application
- 19.7.10. End-Use Industry
- 19.8. Rest of Middle East Industrial Computer Vision Market
- 19.8.1. Country Segmental Analysis
- 19.8.2. Component
- 19.8.3. Technology
- 19.8.4. Type
- 19.8.5. Function
- 19.8.6. Deployment Model
- 19.8.7. System Integration Level
- 19.8.8. Communication Interface
- 19.8.9. Application
- 19.8.10. End-Use Industry
- 20. Africa Industrial Computer Vision Market Analysis
- 20.1. Key Segment Analysis
- 20.2. Regional Snapshot
- 20.3. Africa Industrial Computer Vision Market Size (Value - US$ Bn and Volume - Million Units), Analysis, and Forecasts, 2021-2035
- 20.3.1. Component
- 20.3.2. Technology
- 20.3.3. Type
- 20.3.4. Function
- 20.3.5. Deployment Model
- 20.3.6. System Integration Level
- 20.3.7. Communication Interface
- 20.3.8. Application
- 20.3.9. End-Use Industry
- 20.3.10. Country
- 20.3.10.1. South Africa
- 20.3.10.2. Egypt
- 20.3.10.3. Nigeria
- 20.3.10.4. Algeria
- 20.3.10.5. Rest of Africa
- 20.4. South Africa Industrial Computer Vision Market
- 20.4.1. Country Segmental Analysis
- 20.4.2. Component
- 20.4.3. Technology
- 20.4.4. Type
- 20.4.5. Function
- 20.4.6. Deployment Model
- 20.4.7. System Integration Level
- 20.4.8. Communication Interface
- 20.4.9. Application
- 20.4.10. End-Use Industry
- 20.5. Egypt Industrial Computer Vision Market
- 20.5.1. Country Segmental Analysis
- 20.5.2. Component
- 20.5.3. Technology
- 20.5.4. Type
- 20.5.5. Function
- 20.5.6. Deployment Model
- 20.5.7. System Integration Level
- 20.5.8. Communication Interface
- 20.5.9. Application
- 20.5.10. End-Use Industry
- 20.6. Nigeria Industrial Computer Vision Market
- 20.6.1. Country Segmental Analysis
- 20.6.2. Component
- 20.6.3. Technology
- 20.6.4. Type
- 20.6.5. Function
- 20.6.6. Deployment Model
- 20.6.7. System Integration Level
- 20.6.8. Communication Interface
- 20.6.9. Application
- 20.6.10. End-Use Industry
- 20.7. Algeria Industrial Computer Vision Market
- 20.7.1. Country Segmental Analysis
- 20.7.2. Component
- 20.7.3. Technology
- 20.7.4. Type
- 20.7.5. Function
- 20.7.6. Deployment Model
- 20.7.7. System Integration Level
- 20.7.8. Communication Interface
- 20.7.9. Application
- 20.7.10. End-Use Industry
- 20.8. Rest of Africa Industrial Computer Vision Market
- 20.8.1. Country Segmental Analysis
- 20.8.2. Component
- 20.8.3. Technology
- 20.8.4. Type
- 20.8.5. Function
- 20.8.6. Deployment Model
- 20.8.7. System Integration Level
- 20.8.8. Communication Interface
- 20.8.9. Application
- 20.8.10. End-Use Industry
- 21. South America Industrial Computer Vision Market Analysis
- 21.1. Key Segment Analysis
- 21.2. Regional Snapshot
- 21.3. South America Industrial Computer Vision Market Size (Value - US$ Bn and Volume - Million Units), Analysis, and Forecasts, 2021-2035
- 21.3.1. Component
- 21.3.2. Technology
- 21.3.3. Type
- 21.3.4. Function
- 21.3.5. Deployment Model
- 21.3.6. System Integration Level
- 21.3.7. Communication Interface
- 21.3.8. Application
- 21.3.9. End-Use Industry
- 21.3.10. Country
- 21.3.10.1. Brazil
- 21.3.10.2. Argentina
- 21.3.10.3. Rest of South America
- 21.4. Brazil Industrial Computer Vision Market
- 21.4.1. Country Segmental Analysis
- 21.4.2. Component
- 21.4.3. Technology
- 21.4.4. Type
- 21.4.5. Function
- 21.4.6. Deployment Model
- 21.4.7. System Integration Level
- 21.4.8. Communication Interface
- 21.4.9. Application
- 21.4.10. End-Use Industry
- 21.5. Argentina Industrial Computer Vision Market
- 21.5.1. Country Segmental Analysis
- 21.5.2. Component
- 21.5.3. Technology
- 21.5.4. Type
- 21.5.5. Function
- 21.5.6. Deployment Model
- 21.5.7. System Integration Level
- 21.5.8. Communication Interface
- 21.5.9. Application
- 21.5.10. End-Use Industry
- 21.6. Rest of South America Industrial Computer Vision Market
- 21.6.1. Country Segmental Analysis
- 21.6.2. Component
- 21.6.3. Technology
- 21.6.4. Type
- 21.6.5. Function
- 21.6.6. Deployment Model
- 21.6.7. System Integration Level
- 21.6.8. Communication Interface
- 21.6.9. Application
- 21.6.10. End-Use Industry
- 22. Key Players/ Company Profile
- 22.1. Allied Vision Technologies
- 22.1.1. Company Details/ Overview
- 22.1.2. Company Financials
- 22.1.3. Key Customers and Competitors
- 22.1.4. Business/ Industry Portfolio
- 22.1.5. Product Portfolio/ Specification Details
- 22.1.6. Pricing Data
- 22.1.7. Strategic Overview
- 22.1.8. Recent Developments
- 22.2. Basler AG
- 22.3. Baumer Group
- 22.4. Cisco Systems, Inc.
- 22.5. Cognex Corporation
- 22.6. FLIR Systems (Teledyne)
- 22.7. Hexagon AB
- 22.8. IDS Imaging Development Systems
- 22.9. Keyence Corporation
- 22.10. Microsoft Corporation
- 22.11. National Instruments (NI)
- 22.12. NVIDIA Corporation
- 22.13. Omron Corporation
- 22.14. Panasonic Corporation
- 22.15. Rockwell Automation, Inc.
- 22.16. Sick AG
- 22.17. Sony Corporation
- 22.18. Teledyne DALSA
- 22.19. Zebra Technologies
- 22.20. Other Key Players
- 22.1. Allied Vision Technologies
Note* - This is just tentative list of players. While providing the report, we will cover more number of players based on their revenue and share for each geography
Research Design
Our research design integrates both demand-side and supply-side analysis through a balanced combination of primary and secondary research methodologies. By utilizing both bottom-up and top-down approaches alongside rigorous data triangulation methods, we deliver robust market intelligence that supports strategic decision-making.
MarketGenics' comprehensive research design framework ensures the delivery of accurate, reliable, and actionable market intelligence. Through the integration of multiple research approaches, rigorous validation processes, and expert analysis, we provide our clients with the insights needed to make informed strategic decisions and capitalize on market opportunities.

MarketGenics leverages a dedicated industry panel of experts and a comprehensive suite of paid databases to effectively collect, consolidate, and analyze market intelligence.
Our approach has consistently proven to be reliable and effective in generating accurate market insights, identifying key industry trends, and uncovering emerging business opportunities.
Through both primary and secondary research, we capture and analyze critical company-level data such as manufacturing footprints, including technical centers, R&D facilities, sales offices, and headquarters.
Our expert panel further enhances our ability to estimate market size for specific brands based on validated field-level intelligence.
Our data mining techniques incorporate both parametric and non-parametric methods, allowing for structured data collection, sorting, processing, and cleaning.
Demand projections are derived from large-scale data sets analyzed through proprietary algorithms, culminating in robust and reliable market sizing.
Research Approach
The bottom-up approach builds market estimates by starting with the smallest addressable market units and systematically aggregating them to create comprehensive market size projections.
This method begins with specific, granular data points and builds upward to create the complete market landscape.
Customer Analysis → Segmental Analysis → Geographical Analysis
The top-down approach starts with the broadest possible market data and systematically narrows it down through a series of filters and assumptions to arrive at specific market segments or opportunities.
This method begins with the big picture and works downward to increasingly specific market slices.
TAM → SAM → SOM


Research Methods
Desk / Secondary Research
While analysing the market, we extensively study secondary sources, directories, and databases to identify and collect information useful for this technical, market-oriented, and commercial report. Secondary sources that we utilize are not only the public sources, but it is a combination of Open Source, Associations, Paid Databases, MG Repository & Knowledgebase, and others.
- Company websites, annual reports, financial reports, broker reports, and investor presentations
- National government documents, statistical databases and reports
- News articles, press releases and web-casts specific to the companies operating in the market, Magazines, reports, and others
- We gather information from commercial data sources for deriving company specific data such as segmental revenue, share for geography, product revenue, and others
- Internal and external proprietary databases (industry-specific), relevant patent, and regulatory databases
- Governing Bodies, Government Organizations
- Relevant Authorities, Country-specific Associations for Industries
We also employ the model mapping approach to estimate the product level market data through the players' product portfolio
Primary Research
Primary research/ interviews is vital in analyzing the market. Most of the cases involves paid primary interviews. Primary sources include primary interviews through e-mail interactions, telephonic interviews, surveys as well as face-to-face interviews with the different stakeholders across the value chain including several industry experts.
| Type of Respondents | Number of Primaries |
|---|---|
| Tier 2/3 Suppliers | ~20 |
| Tier 1 Suppliers | ~25 |
| End-users | ~25 |
| Industry Expert/ Panel/ Consultant | ~30 |
| Total | ~100 |
MG Knowledgebase
• Repository of industry blog, newsletter and case studies
• Online platform covering detailed market reports, and company profiles
Forecasting Factors and Models
Forecasting Factors
- Historical Trends – Past market patterns, cycles, and major events that shaped how markets behave over time. Understanding past trends helps predict future behavior.
- Industry Factors – Specific characteristics of the industry like structure, regulations, and innovation cycles that affect market dynamics.
- Macroeconomic Factors – Economic conditions like GDP growth, inflation, and employment rates that affect how much money people have to spend.
- Demographic Factors – Population characteristics like age, income, and location that determine who can buy your product.
- Technology Factors – How quickly people adopt new technology and how much technology infrastructure exists.
- Regulatory Factors – Government rules, laws, and policies that can help or restrict market growth.
- Competitive Factors – Analyzing competition structure such as degree of competition and bargaining power of buyers and suppliers.
Forecasting Models / Techniques
Multiple Regression Analysis
- Identify and quantify factors that drive market changes
- Statistical modeling to establish relationships between market drivers and outcomes
Time Series Analysis – Seasonal Patterns
- Understand regular cyclical patterns in market demand
- Advanced statistical techniques to separate trend, seasonal, and irregular components
Time Series Analysis – Trend Analysis
- Identify underlying market growth patterns and momentum
- Statistical analysis of historical data to project future trends
Expert Opinion – Expert Interviews
- Gather deep industry insights and contextual understanding
- In-depth interviews with key industry stakeholders
Multi-Scenario Development
- Prepare for uncertainty by modeling different possible futures
- Creating optimistic, pessimistic, and most likely scenarios
Time Series Analysis – Moving Averages
- Sophisticated forecasting for complex time series data
- Auto-regressive integrated moving average models with seasonal components
Econometric Models
- Apply economic theory to market forecasting
- Sophisticated economic models that account for market interactions
Expert Opinion – Delphi Method
- Harness collective wisdom of industry experts
- Structured, multi-round expert consultation process
Monte Carlo Simulation
- Quantify uncertainty and probability distributions
- Thousands of simulations with varying input parameters
Research Analysis
Our research framework is built upon the fundamental principle of validating market intelligence from both demand and supply perspectives. This dual-sided approach ensures comprehensive market understanding and reduces the risk of single-source bias.
Demand-Side Analysis: We understand end-user/application behavior, preferences, and market needs along with the penetration of the product for specific application.
Supply-Side Analysis: We estimate overall market revenue, analyze the segmental share along with industry capacity, competitive landscape, and market structure.
Validation & Evaluation
Data triangulation is a validation technique that uses multiple methods, sources, or perspectives to examine the same research question, thereby increasing the credibility and reliability of research findings. In market research, triangulation serves as a quality assurance mechanism that helps identify and minimize bias, validate assumptions, and ensure accuracy in market estimates.
- Data Source Triangulation – Using multiple data sources to examine the same phenomenon
- Methodological Triangulation – Using multiple research methods to study the same research question
- Investigator Triangulation – Using multiple researchers or analysts to examine the same data
- Theoretical Triangulation – Using multiple theoretical perspectives to interpret the same data

Custom Market Research Services
We will customise the research for you, in case the report listed above does not meet your requirements.
Get 10% Free Customisation