Industrial Valve Market Size, Share & Trends Analysis Report by Valve Type (Ball Valves, Gate Valves, Globe Valves, Butterfly Valves, Check Valves, Plug Valves, Diaphragm Valves, Safety/Relief Valves, Control Valves, Pressure Reducing Valves, Others), Material, Size, Function, Operation, Pressure Rating, Application, End-Use Industry, Distribution Channel and Geography (North America, Europe, Asia Pacific, Middle East, Africa, and South America) – Global Industry Data, Trends, and Forecasts, 2026–2035
|
Market Structure & Evolution |
|
|
Segmental Data Insights |
|
|
Demand Trends |
|
|
Competitive Landscape |
|
|
Strategic Development |
|
|
Future Outlook & Opportunities |
|
Industrial Valve Market Size, Share, and Growth
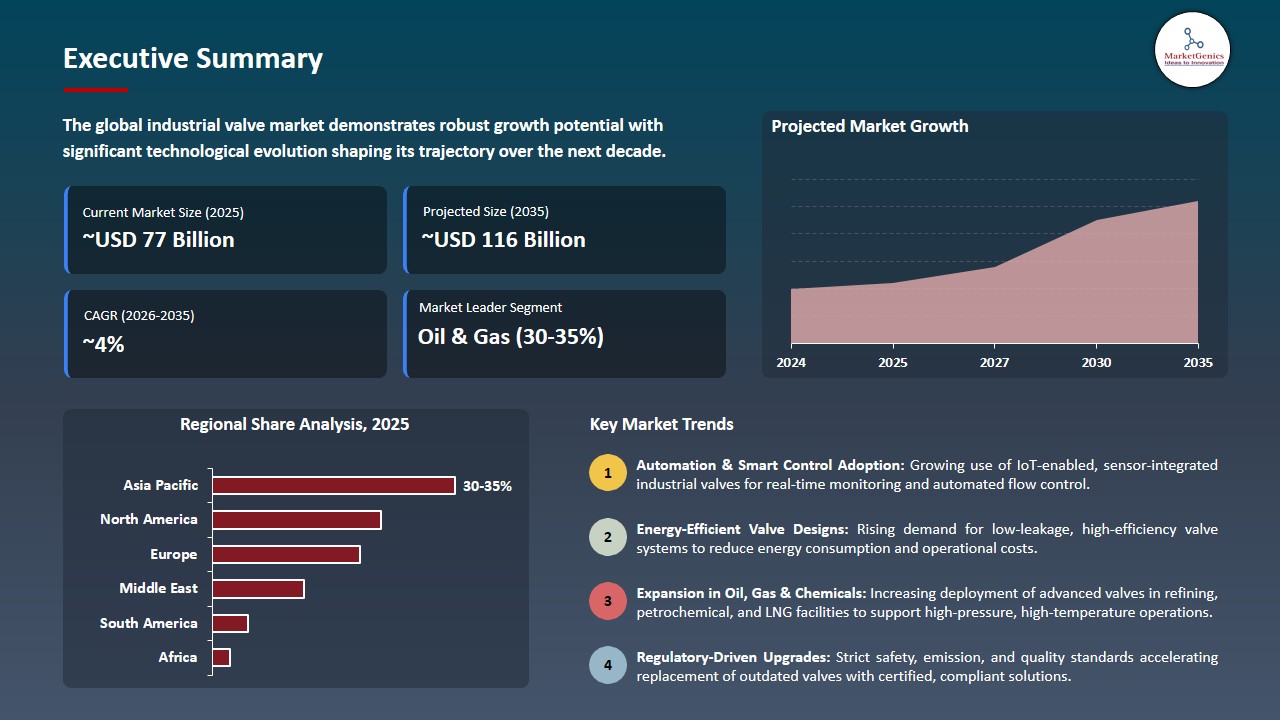
The global industrial valve market is experiencing robust growth, with its estimated value of USD 77.2 billion in the year 2025 and USD 115.6 billion by the period 2035, registering a CAGR of 4.1% during the forecast period.
Valve manufacturer Valmet has, in effect, rolled out the Neles XH ball valve by the innovative company Valmet during the past few years in order to solve the problems of installation and handling that are typically given by traditional valves. Valmet's Director of Renewable Energy & Gases, Ville Kähkönen, stated: "We have succeeded in reducing both the weight and size of the valve while still maintaining its reliability, robustness and performance."
The industrial valve market is rapidly spreading all over the globe. One of the major reasons is the development of advanced and energy, saving valve solutions that facilitate process control and increase the overall operational reliability. For instance, Emerson Electric Co. in August 2024 has introduced the AVENTICS Series XV pneumatic valves that are designed compactly with higher flow rates and performance flexibility enhanced, hence, the manufacturers in factory automation, automotive, and food processing sectors are able to achieve more efficient, easier, to, install fluid control systems than the old valve models.
Furthermore, smart and IoT, enabled valves are being accepted widely in the different sectors as the need for real, time performance monitoring and predictive maintenance has been prioritized. Several valve suppliers have reported in late 2024 and early 2025 the increased use of smart valves with embedded sensors and diagnostics that mirror the broader Industry 4.0 trends where digital feedback and remote control minimize downtime and increase system efficiency.
As a consequence, the demand for sophisticated valve systems that can handle complicated service conditions has escalated by the expansion of oil & gas infrastructures, water and wastewater treatment projects, and energy generation facilities. Growth in these sectors has been identified as a major factor market demand driver, particularly when environmental and safety regulations require high, performance, reliable flow control solutions to be compliant with the stricter standards.
Besides this, tough regulatory requirements combined with sustainability goals are making industries invest in cutting, edge valve technologies that help to reduce leaks, improve energy efficiency, and comply with the environment, thus, market growth is being extended.
Technological innovation, regulatory pressures, and global industrial expansion together are acting as a growth driver of the industrial valve market and this is leading not only to greater operational efficiency but also to enhanced safety in the vital industrial applications sector.
Industrial Valve Market Dynamics and Trends
Driver: Increasing Regulatory Standards and Safety Requirements Driving Adoption of Advanced Valve Technologies
-
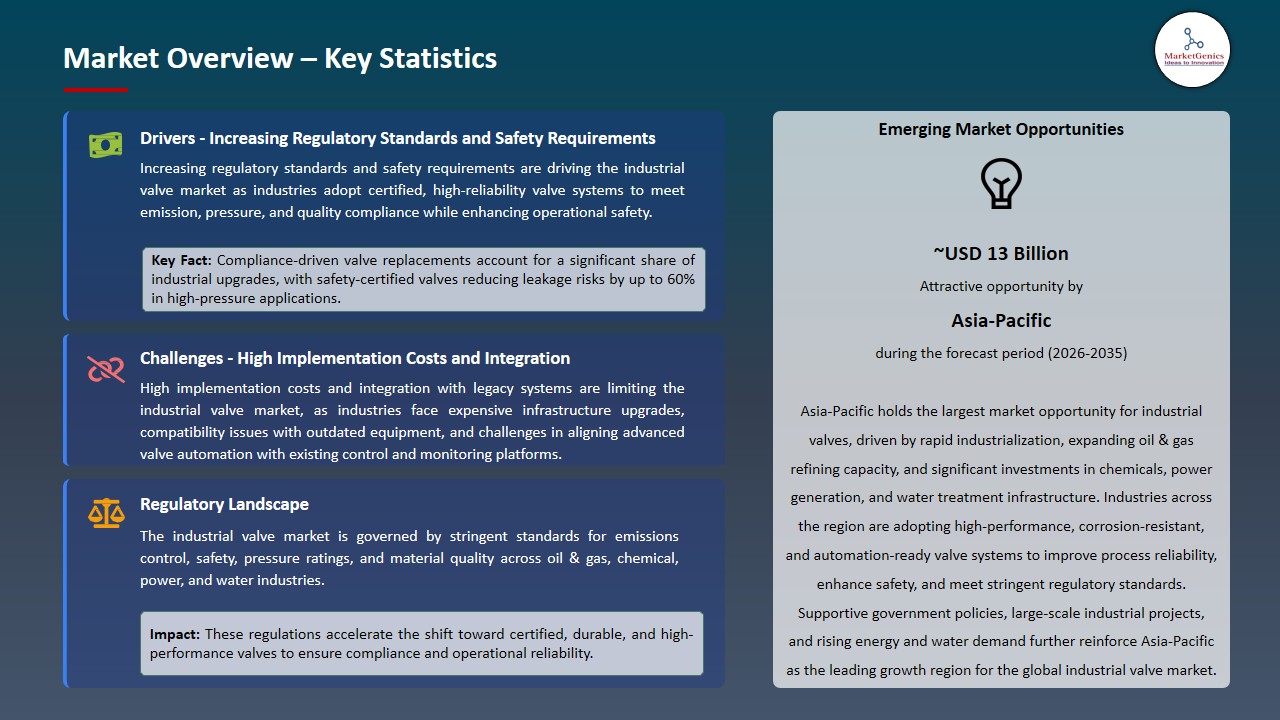
The fast expansion of the industrial valve market is largely a result of stricter safety, environmental, and operational regulations being enforced worldwide. As a matter of fact, standards like ISO 15848 for fugitive emissions and API 598/607 for pressure testing are causing manufacturers to use the latest valve designs having better leak, proofing, automation, and durability features.
- Oil & gas, chemical processing, water treatment, and power generation industries, among others, are imposing the requirements for valves to have real, time monitoring, remote actuation, and predictive maintenance features, not only for safety but also for compliance purposes. In 2025, Emerson Electric Co. was the first to unveil a new generation of smart valves equipped with real, time diagnostic sensors, which is an example of the worldwide trend of automation, first valve solutions.
- The need for high, performance and digitally integrated valves does not subside as more and more industrial processes are turning to remote monitoring and control as a way of complying with environmental and safety regulations.
Restraint: High Implementation Costs and Integration with Legacy Systems Limiting Adoption
-
Advanced valve systems on a large scale are limited by the expensive process of upgrading old process control systems despite the presence of regulatory incentives. There are still many establishments that use old mechanical valves without digital interfaces which makes the integration of smart or automated valves a difficult task.
- The shift towards IoT, enabled, sensor, equipped valve systems demand a hefty control system upgrade, establishment of network infrastructure, and taking of cybersecurity measures, especially in developing regions and small to medium, sized manufacturing plants.
- It is still difficult for industrial operators to find a balance between operational efficiency, safety compliance, and total cost of ownership which is the main reason why the change from traditional to next, generation valve technologies are slow.
Opportunity: Expansion in Emerging Markets and Industrial Infrastructure Projects
-
Industrialization of their economies by the countries in the Asia, Africa, and Latin America is an evident scenario in these regions. Consequently, there is a rising demand for modern and reliable valve systems in oil & gas, water treatment, chemical plants, and energy generation facilities. With this move, NDL Industries has rolled out a stainless-steel ball valve of one of the largest diameters for industrial and commercial transcritical CO₂ systems which in turn has broadened the accessibility of special‑purpose valves for large‑scale infrastructure projects in HVAC and energy markets.
- Worldwide valve manufacturing companies are joining hands with EPC contractors, government projects, and industrial OEMs to deliver high, performance and digitally integrated valve solutions that comply with regional regulatory and operational standards. Beijer Alma's subsidiary Beijer, Tech, in February 2024, entered into an agreement to acquire AVS Power Oy, thereby extending its industrial valve and pneumatics business to serve the market not only in Europe but also globally. Such a strategic move of acquisition acts as a reinforcement in the distribution networks and opening of new markets in industrial regions that are at the take, off stage.
- These scenarios enable valve producers to present modular, IoT, enabled, and predictive, maintenance, ready valves, thus creating fresh revenue streams in process automation, energy efficiency and environmental compliance segments.
Key Trend: Integration of Smart Sensors, Digital Twins, and Predictive Maintenance Enhancing Operational Efficiency
-
Modern valves are progressively embedding Internet of Things (IoT) sensors, AI, based predictive maintenance, and digital twin modeling to elevate performance, cut downtime, and enhance process efficiency. Operators, through on, the, spot condition monitoring and automated diagnostics, can thus avert breakdowns, request maintenance, and shorten the time during which the plant is not running. WIVO Valves introduced an AI‑powered smart valve system that incorporates IoT sensors and machine‑learning algorithms to not only optimize flow but also enable predictive maintenance, thereby giving operators the means to both save energy and lower failure rates.
- The use of remote actuation, cloud, based analytics, and predictive failure alerts together is fundamentally changing industrial process management, thus being the main factors that lead to safer and more efficient operations. Kromschröder Group has received European CE certification for its AI‑integrated smart valve technology, which facilitates real‑time monitoring, automatic flow changes, and predictive diagnostics, thereby serving as a significant indication of the extensive adoption of artificial intelligence by the valve industry.
- The communication between smart valves and controls, being one of the industrial digitalization and automation evolution features, points to the eventual realization of fully digitalized and automated industrial plants.
Industrial-Valve-Market Analysis and Segmental Data
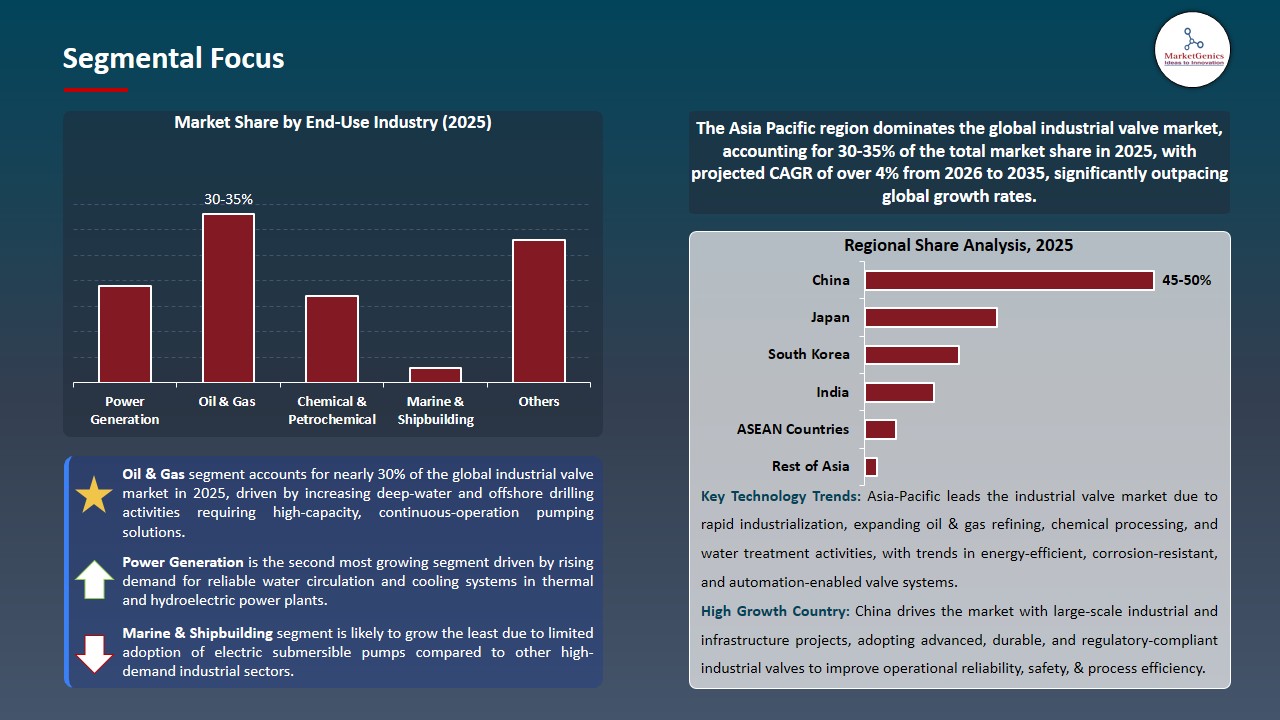
“Oil & Gas Industry Dominate Global Industrial Valve Market amid Rising Energy Infrastructure and Regulatory Compliance Demands"
-
The oil and gas industry is the primary factor behind the global industrial valve market expansion. The exploration, production, refining, transportation, and downstream operations of the oil & gas sector notably require valves where strict flow control, safety, and reliability are of utmost importance. Valves are at the heart of fluid handling under high pressures and extreme conditions, which is why oil & gas is the most significant end‑user segment, holding a large share of the global industrial valve market.
- Pipeline expansions and LNG projects are driving up the demand for high, quality valves such as gate, ball, globe, and control valves that can resist severe conditions and at the same time guarantee operational efficiency and safety in upstream and midstream segments. Besides this, compliance with regulations and safety standards leads to this prominence.
- In numerous places, strict emission‑control and pressure‑management regulations necessitate the implementation of advanced, low‑leakage and digitally monitored valve systems. The requirements set by regulations encourage oil & gas operators to replace legacy mechanical valves with automated, sensor‑equipped units that facilitate real‑time diagnostics; thus, fugitive emissions are reduced and downtime is minimized, thereby, operational safety is in line with environmental mandates.
- Furthermore, the modernization of the energy infrastructure, i.e., refinery upgrades, pipeline expansions, and LNG terminal construction, is generating a flood of opportunities for valve manufacturers to supply high‑integrity solutions that not only meet performance but also compliance requirements. The oil & gas industry's demand for dependable industrial valves, as a result, is still a major factor in the industrial valve market's growth, which is bound to continue as the global energy need keeps rising.
“Asia Pacific Dominates Industrial Valve Market amid Rapid Industrialization and Infrastructure Expansion”
-
Asia Pacific is the major global industrial valve market leader. The area has the most substantial industrial valve market share as the rapid industrialization, urbanization, and infrastructure development go on dispersing the demand over various sectors. Consequently, the Asia Pacific region, which includes the world's largest manufacturing base, energy production facilities, water and wastewater treatment projects, and petrochemical complexes, has become the biggest consumer of industrial valves worldwide.
- China, India, Japan, and Southeast Asian countries have seen a rise in large, scale infrastructure projects such as extensive pipeline networks, power generation facilities, water distribution systems, and industrial plants, which have been the main reasons for the valve demand in tens of thousands annually. These works necessitate a wide, ranging assortment of valve types and sizes for the control of fluid flow, pressure, and safety in the construction of new buildings and retrofitting of existing ones.
- Moreover, the region is rapidly transitioning to the use of smart and automated valve technologies, as manufacturers look for real, time monitoring, enhanced efficiency, and predictive maintenance features to operate complex industrial systems. The trend is very intense in advanced manufacturing hubs like South Korea and Japan, where there is an increase in digital integration in process control.
- Asia Pacific countries are committing substantial funds to essential sectors, such as energy infrastructure and water management, thus creating limitless opportunities for valve manufacturers. The extension of oil & gas pipelines, refinery upgrades, wastewater treatment plants, and power generation facilities is the mainstay of the robust demand for high, performance industrial valves capable of meeting the evolving performance and safety standards.
Industrial-Valve-Market Ecosystem
The leading companies such as Emerson Electric Co., Flowserve Corporation, Cameron (Schlumberger), KSB SE & Co. KGaA, Velan Inc., and Spirax Sarco mostly control the global industrial valve market that is moderately consolidated. The adoption of advanced technologies, automation, and smart valve systems has been the way these top companies retained their market shares. These major players use digital integration, predictive maintenance, and high, performance valve designs to keep their competitive edge and market share.
To innovate, these corporations concentrate on specialized industrial solutions that meet the needs of niche markets. Some examples of such specialized products are AI, enabled control valves, corrosion, resistant ball valves, IoT, integrated flow monitoring systems, and modular valve assemblies that improve operational reliability in oil & gas, chemical, power, and water treatment sectors.
Governments, research institutions, and R&D organizations are fully committed to technological advancements through investments. For example, in September 2024, the Indian Institute of Technology (IIT), and Flowserve Corporation joined hands in the development of IoT, enabled predictive maintenance valves that allow real, time performance monitoring and less operational downtime.
Moreover, the key players are product diversification, integrated solutions, and portfolio expansion to produce higher productivity, good energy use, and sustainability, related benefits. Emerson Electric, in May 2025, launched AI, driven smart valves with predictive diagnostics, which brought about a 15% maintenance efficiency improvement and system reliability enhancement, thus, technology advancement and operational optimization being the market’s focal point, was the major takeaway from this event.

Recent Development and Strategic Overview:
-
In September 2025, Flowserve Corporation unveiled its IntelliFlow Smart Valve Suite, which is a product line with IoT, enabled sensors and predictive analytics that give operators the ability to observe valve performance in real time. The arrangement offers on its own automated diagnostics and early, warning alerts for failure sources, thus, the reduction of unplanned downtime, as well as the improvement of operational efficiency, is made possible through the solution across oil & gas, chemical, and water treatment plants.
- In July 2025, Emerson Electric Co. made the announcement of its AI, integrated Fisher Control Valves that come with machine learning algorithms to optimize flow and pressure in complex industrial systems. The valves provide the possibilities of remote configuration, predictive maintenance, and energy, efficient operation, at the same time, they ensure the conformity to strict regulatory and safety standards, thus, reliability and the total plant productivity get enhanced further.
Report Scope
|
Attribute |
Detail |
|
Market Size in 2025 |
USD 77.2 Bn |
|
Market Forecast Value in 2035 |
USD 115.6 Bn |
|
Growth Rate (CAGR) |
4.1% |
|
Forecast Period |
2026 – 2035 |
|
Historical Data Available for |
2021 – 2024 |
|
Market Size Units |
USD Bn for Value Thousand Units for Volume |
|
Report Format |
Electronic (PDF) + Excel |
|
Regions and Countries Covered |
|||||
|
North America |
Europe |
Asia Pacific |
Middle East |
Africa |
South America |
|
|
|
|
|
|
|
Companies Covered |
|||||
|
|
|
|
|
|
Industrial-Valve-Market Segmentation and Highlights
|
Segment |
Sub-segment |
|
Industrial Valve Market, By Valve Type |
|
|
Industrial Valve Market, By Material |
|
|
Industrial Valve Market, By Size |
|
|
Industrial Valve Market, By Function |
|
|
Industrial Valve Market, By Operation |
|
|
Industrial Valve Market, By Pressure Rating |
|
|
Industrial Valve Market, By Application |
|
|
Industrial Valve Market, By End-Use Industry |
|
|
Industrial Valve Market, By Distribution Channel |
|
Frequently Asked Questions
Table of Contents
- 1. Research Methodology and Assumptions
- 1.1. Definitions
- 1.2. Research Design and Approach
- 1.3. Data Collection Methods
- 1.4. Base Estimates and Calculations
- 1.5. Forecasting Models
- 1.5.1. Key Forecast Factors & Impact Analysis
- 1.6. Secondary Research
- 1.6.1. Open Sources
- 1.6.2. Paid Databases
- 1.6.3. Associations
- 1.7. Primary Research
- 1.7.1. Primary Sources
- 1.7.2. Primary Interviews with Stakeholders across Ecosystem
- 2. Executive Summary
- 2.1. Global Industrial Valve Market Outlook
- 2.1.1. Industrial Valve Market Size (Value - US$ Bn and Volume - Thousand Units), and Forecasts, 2021-2035
- 2.1.2. Compounded Annual Growth Rate Analysis
- 2.1.3. Growth Opportunity Analysis
- 2.1.4. Segmental Share Analysis
- 2.1.5. Geographical Share Analysis
- 2.2. Market Analysis and Facts
- 2.3. Supply-Demand Analysis
- 2.4. Competitive Benchmarking
- 2.5. Go-to- Market Strategy
- 2.5.1. Customer/ End-use Industry Assessment
- 2.5.2. Growth Opportunity Data, 2026-2035
- 2.5.2.1. Regional Data
- 2.5.2.2. Country Data
- 2.5.2.3. Segmental Data
- 2.5.3. Identification of Potential Market Spaces
- 2.5.4. GAP Analysis
- 2.5.5. Potential Attractive Price Points
- 2.5.6. Prevailing Market Risks & Challenges
- 2.5.7. Preferred Sales & Marketing Strategies
- 2.5.8. Key Recommendations and Analysis
- 2.5.9. A Way Forward
- 2.1. Global Industrial Valve Market Outlook
- 3. Industry Data and Premium Insights
- 3.1. Global Industrial Machinery Ecosystem Overview, 2025
- 3.1.1. Industrial Machinery Industry Analysis
- 3.1.2. Key Trends for Industrial Machinery Industry
- 3.1.3. Regional Distribution for Industrial Machinery Industry
- 3.2. Supplier Customer Data
- 3.3. Technology Roadmap and Developments
- 3.4. Trade Analysis
- 3.4.1. Import & Export Analysis, 2025
- 3.4.2. Top Importing Countries
- 3.4.3. Top Exporting Countries
- 3.5. Trump Tariff Impact Analysis
- 3.5.1. Manufacturer
- 3.5.1.1. Based on the component & Raw material
- 3.5.2. Supply Chain
- 3.5.3. End Consumer
- 3.5.1. Manufacturer
- 3.6. Raw Material Analysis
- 3.1. Global Industrial Machinery Ecosystem Overview, 2025
- 4. Market Overview
- 4.1. Market Dynamics
- 4.1.1. Drivers
- 4.1.1.1. Rising demand for automated flow control, process optimization, and operational efficiency in industrial plants.
- 4.1.1.2. Growing adoption of smart and IoT-enabled valves for monitoring, predictive maintenance, and regulatory compliance.
- 4.1.1.3. Increasing investments in advanced valve technologies, including electric and pneumatic actuators, digital integration, and process automation solutions.
- 4.1.2. Restraints
- 4.1.2.1. High procurement, installation, and maintenance costs of industrial valves, especially in high-pressure and corrosive environments.
- 4.1.2.2. Challenges in retrofitting valves with existing legacy systems and integrating them with heterogeneous industrial control platforms.
- 4.1.1. Drivers
- 4.2. Key Trend Analysis
- 4.3. Regulatory Framework
- 4.3.1. Key Regulations, Norms, and Subsidies, by Key Countries
- 4.3.2. Tariffs and Standards
- 4.3.3. Impact Analysis of Regulations on the Market
- 4.4. Value Chain Analysis
- 4.4.1. Raw Material Suppliers
- 4.4.2. Industrial Valve Manufacturers
- 4.4.3. Dealers and Distributors
- 4.4.4. End Users
- 4.5. Cost Structure Analysis
- 4.5.1. Parameter’s Share for Cost Associated
- 4.5.2. COGP vs COGS
- 4.5.3. Profit Margin Analysis
- 4.6. Pricing Analysis
- 4.6.1. Regional Pricing Analysis
- 4.6.2. Segmental Pricing Trends
- 4.6.3. Factors Influencing Pricing
- 4.7. Porter’s Five Forces Analysis
- 4.8. PESTEL Analysis
- 4.9. Global Industrial Valve Market Demand
- 4.9.1. Historical Market Size –Value (US$ Bn) and Volume (Thousand Units), 2020-2024
- 4.9.2. Current and Future Market Size –Value (US$ Bn) and Volume (Thousand Units), 2026–2035
- 4.9.2.1. Y-o-Y Growth Trends
- 4.9.2.2. Absolute $ Opportunity Assessment
- 4.1. Market Dynamics
- 5. Competition Landscape
- 5.1. Competition structure
- 5.1.1. Fragmented v/s consolidated
- 5.2. Company Share Analysis, 2025
- 5.2.1. Global Company Market Share
- 5.2.2. By Region
- 5.2.2.1. North America
- 5.2.2.2. Europe
- 5.2.2.3. Asia Pacific
- 5.2.2.4. Middle East
- 5.2.2.5. Africa
- 5.2.2.6. South America
- 5.3. Product Comparison Matrix
- 5.3.1. Specifications
- 5.3.2. Market Positioning
- 5.3.3. Pricing
- 5.1. Competition structure
- 6. Global Industrial Valve Market Analysis, by Valve Type
- 6.1. Key Segment Analysis
- 6.2. Industrial Valve Market Size (Value - US$ Bn and Volume - Thousand Units), Analysis, and Forecasts, by Valve Type, 2021-2035
- 6.2.1. Ball Valves
- 6.2.2. Gate Valves
- 6.2.3. Globe Valves
- 6.2.4. Butterfly Valves
- 6.2.5. Check Valves
- 6.2.6. Plug Valves
- 6.2.7. Diaphragm Valves
- 6.2.8. Safety/Relief Valves
- 6.2.9. Control Valves
- 6.2.10. Pressure Reducing Valves
- 6.2.11. Others
- 7. Global Industrial Valve Market Analysis, by Material
- 7.1. Key Segment Analysis
- 7.2. Industrial Valve Market Size (Value - US$ Bn), Analysis, and Forecasts, by Material, 2021-2035
- 7.2.1. Stainless Steel
- 7.2.2. Carbon Steel
- 7.2.3. Alloy Steel
- 7.2.4. Cast Iron
- 7.2.5. Bronze
- 7.2.6. Plastic (PVC, CPVC, PP)
- 7.2.7. Duplex & Super Duplex Steel
- 7.2.8. Nickel-Based Alloys
- 7.2.9. Others
- 8. Global Industrial Valve Market Analysis, by Size
- 8.1. Key Segment Analysis
- 8.2. Industrial Valve Market Size (Value - US$ Bn and Volume - Thousand Units), Analysis, and Forecasts, by Size, 2021-2035
- 8.2.1. Up to 1”
- 8.2.2. 1”–6”
- 8.2.3. 6”–25”
- 8.2.4. 25”–50”
- 8.2.5. Above 50”
- 9. Global Industrial Valve Market Analysis, by Function
- 9.1. Key Segment Analysis
- 9.2. Industrial Valve Market Size (Value - US$ Bn and Volume - Thousand Units), Analysis, and Forecasts, by Function, 2021-2035
- 9.2.1. On/Off Valves
- 9.2.2. Control Valves
- 9.2.3. Isolation Valves
- 9.2.4. Pressure Relief Valves
- 9.2.5. Others
- 10. Global Industrial Valve Market Analysis, by Operation
- 10.1. Key Segment Analysis
- 10.2. Industrial Valve Market Size (Value - US$ Bn and Volume - Thousand Units), Analysis, and Forecasts, by Operation, 2021-2035
- 10.2.1. Manual
- 10.2.2. Pneumatic Actuated
- 10.2.3. Electric Actuated
- 10.2.4. Hydraulic Actuated
- 10.2.5. Motorized
- 10.2.6. Others
- 11. Global Industrial Valve Market Analysis, by Pressure Rating
- 11.1. Key Segment Analysis
- 11.2. Industrial Valve Market Size (Value - US$ Bn and Volume - Thousand Units), Analysis, and Forecasts, by Pressure Rating, 2021-2035
- 11.2.1. Below 150 PSI
- 11.2.2. 150–300 PSI
- 11.2.3. 300–600 PSI
- 11.2.4. 600–900 PSI
- 11.2.5. Above 900 PSI
- 12. Global Industrial Valve Market Analysis and Forecasts, by Application
- 12.1. Key Findings
- 12.2. Industrial Valve Market Size (Value - US$ Bn and Volume - Thousand Units), Analysis, and Forecasts, by Application, 2021-2035
- 12.2.1. Flow Control
- 12.2.2. Pressure Control
- 12.2.3. Safety & Emergency Shutdown
- 12.2.4. Corrosion-Resistant Applications
- 12.2.5. High-Temperature/High-Pressure Applications
- 12.2.6. Others
- 13. Global Industrial Valve Market Analysis and Forecasts, by End-Use Industry
- 13.1. Key Findings
- 13.2. Industrial Valve Market Size (Value - US$ Bn and Volume - Thousand Units), Analysis, and Forecasts, by End-Use Industry, 2021-2035
- 13.2.1. Oil & Gas
- 13.2.2. Power Generation
- 13.2.3. Chemical & Petrochemical
- 13.2.4. Water & Wastewater Treatment
- 13.2.5. Mining & Metals
- 13.2.6. Food & Beverage
- 13.2.7. Pharmaceutical
- 13.2.8. Pulp & Paper
- 13.2.9. HVAC
- 13.2.10. Marine & Shipbuilding
- 13.2.11. Others
- 14. Global Industrial Valve Market Analysis and Forecasts, by Distribution Channel
- 14.1. Key Findings
- 14.2. Industrial Valve Market Size (Value - US$ Bn and Volume - Thousand Units), Analysis, and Forecasts, by Distribution Channel, 2021-2035
- 14.2.1. Direct Sales
- 14.2.2. Distributors/Dealers
- 14.2.3. EPC Contractors
- 14.2.4. Online Channels
- 15. Global Industrial Valve Market Analysis and Forecasts, by Region
- 15.1. Key Findings
- 15.2. Industrial Valve Market Size (Value - US$ Bn and Volume - Thousand Units), Analysis, and Forecasts, by Region, 2021-2035
- 15.2.1. North America
- 15.2.2. Europe
- 15.2.3. Asia Pacific
- 15.2.4. Middle East
- 15.2.5. Africa
- 15.2.6. South America
- 16. North America Industrial Valve Market Analysis
- 16.1. Key Segment Analysis
- 16.2. Regional Snapshot
- 16.3. North America Industrial Valve Market Size Value - US$ Bn and Volume - Thousand Units), Analysis, and Forecasts, 2021-2035
- 16.3.1. Valve Type
- 16.3.2. Material
- 16.3.3. Size
- 16.3.4. Function
- 16.3.5. Operation
- 16.3.6. Pressure Rating
- 16.3.7. Application
- 16.3.8. End-Use Industry
- 16.3.9. Distribution Channel
- 16.3.10. Country
- 16.3.10.1. USA
- 16.3.10.2. Canada
- 16.3.10.3. Mexico
- 16.4. USA Industrial Valve Market
- 16.4.1. Country Segmental Analysis
- 16.4.2. Valve Type
- 16.4.3. Material
- 16.4.4. Size
- 16.4.5. Function
- 16.4.6. Operation
- 16.4.7. Pressure Rating
- 16.4.8. Application
- 16.4.9. End-Use Industry
- 16.4.10. Distribution Channel
- 16.5. Canada Industrial Valve Market
- 16.5.1. Country Segmental Analysis
- 16.5.2. Valve Type
- 16.5.3. Material
- 16.5.4. Size
- 16.5.5. Function
- 16.5.6. Operation
- 16.5.7. Pressure Rating
- 16.5.8. Application
- 16.5.9. End-Use Industry
- 16.5.10. Distribution Channel
- 16.6. Mexico Industrial Valve Market
- 16.6.1. Country Segmental Analysis
- 16.6.2. Valve Type
- 16.6.3. Material
- 16.6.4. Size
- 16.6.5. Function
- 16.6.6. Operation
- 16.6.7. Pressure Rating
- 16.6.8. Application
- 16.6.9. End-Use Industry
- 16.6.10. Distribution Channel
- 17. Europe Industrial Valve Market Analysis
- 17.1. Key Segment Analysis
- 17.2. Regional Snapshot
- 17.3. Europe Industrial Valve Market Size (Value - US$ Bn and Volume - Thousand Units), Analysis, and Forecasts, 2021-2035
- 17.3.1. Valve Type
- 17.3.2. Material
- 17.3.3. Size
- 17.3.4. Function
- 17.3.5. Operation
- 17.3.6. Pressure Rating
- 17.3.7. Application
- 17.3.8. End-Use Industry
- 17.3.9. Distribution Channel
- 17.3.10. Country
- 17.3.10.1. Germany
- 17.3.10.2. United Kingdom
- 17.3.10.3. France
- 17.3.10.4. Italy
- 17.3.10.5. Spain
- 17.3.10.6. Netherlands
- 17.3.10.7. Nordic Countries
- 17.3.10.8. Poland
- 17.3.10.9. Russia & CIS
- 17.3.10.10. Rest of Europe
- 17.4. Germany Industrial Valve Market
- 17.4.1. Country Segmental Analysis
- 17.4.2. Valve Type
- 17.4.3. Material
- 17.4.4. Size
- 17.4.5. Function
- 17.4.6. Operation
- 17.4.7. Pressure Rating
- 17.4.8. Application
- 17.4.9. End-Use Industry
- 17.4.10. Distribution Channel
- 17.5. United Kingdom Industrial Valve Market
- 17.5.1. Country Segmental Analysis
- 17.5.2. Valve Type
- 17.5.3. Material
- 17.5.4. Size
- 17.5.5. Function
- 17.5.6. Operation
- 17.5.7. Pressure Rating
- 17.5.8. Application
- 17.5.9. End-Use Industry
- 17.5.10. Distribution Channel
- 17.6. France Industrial Valve Market
- 17.6.1. Country Segmental Analysis
- 17.6.2. Valve Type
- 17.6.3. Material
- 17.6.4. Size
- 17.6.5. Function
- 17.6.6. Operation
- 17.6.7. Pressure Rating
- 17.6.8. Application
- 17.6.9. End-Use Industry
- 17.6.10. Distribution Channel
- 17.7. Italy Industrial Valve Market
- 17.7.1. Country Segmental Analysis
- 17.7.2. Valve Type
- 17.7.3. Material
- 17.7.4. Size
- 17.7.5. Function
- 17.7.6. Operation
- 17.7.7. Pressure Rating
- 17.7.8. Application
- 17.7.9. End-Use Industry
- 17.7.10. Distribution Channel
- 17.8. Spain Industrial Valve Market
- 17.8.1. Country Segmental Analysis
- 17.8.2. Valve Type
- 17.8.3. Material
- 17.8.4. Size
- 17.8.5. Function
- 17.8.6. Operation
- 17.8.7. Pressure Rating
- 17.8.8. Application
- 17.8.9. End-Use Industry
- 17.8.10. Distribution Channel
- 17.9. Netherlands Industrial Valve Market
- 17.9.1. Country Segmental Analysis
- 17.9.2. Valve Type
- 17.9.3. Material
- 17.9.4. Size
- 17.9.5. Function
- 17.9.6. Operation
- 17.9.7. Pressure Rating
- 17.9.8. Application
- 17.9.9. End-Use Industry
- 17.9.10. Distribution Channel
- 17.10. Nordic Countries Industrial Valve Market
- 17.10.1. Country Segmental Analysis
- 17.10.2. Valve Type
- 17.10.3. Material
- 17.10.4. Size
- 17.10.5. Function
- 17.10.6. Operation
- 17.10.7. Pressure Rating
- 17.10.8. Application
- 17.10.9. End-Use Industry
- 17.10.10. Distribution Channel
- 17.11. Poland Industrial Valve Market
- 17.11.1. Country Segmental Analysis
- 17.11.2. Valve Type
- 17.11.3. Material
- 17.11.4. Size
- 17.11.5. Function
- 17.11.6. Operation
- 17.11.7. Pressure Rating
- 17.11.8. Application
- 17.11.9. End-Use Industry
- 17.11.10. Distribution Channel
- 17.12. Russia & CIS Industrial Valve Market
- 17.12.1. Country Segmental Analysis
- 17.12.2. Valve Type
- 17.12.3. Material
- 17.12.4. Size
- 17.12.5. Function
- 17.12.6. Operation
- 17.12.7. Pressure Rating
- 17.12.8. Application
- 17.12.9. End-Use Industry
- 17.12.10. Distribution Channel
- 17.13. Rest of Europe Industrial Valve Market
- 17.13.1. Country Segmental Analysis
- 17.13.2. Valve Type
- 17.13.3. Material
- 17.13.4. Size
- 17.13.5. Function
- 17.13.6. Operation
- 17.13.7. Pressure Rating
- 17.13.8. Application
- 17.13.9. End-Use Industry
- 17.13.10. Distribution Channel
- 18. Asia Pacific Industrial Valve Market Analysis
- 18.1. Key Segment Analysis
- 18.2. Regional Snapshot
- 18.3. Asia Pacific Industrial Valve Market Size (Value - US$ Bn and Volume - Thousand Units), Analysis, and Forecasts, 2021-2035
- 18.3.1. Valve Type
- 18.3.2. Material
- 18.3.3. Size
- 18.3.4. Function
- 18.3.5. Operation
- 18.3.6. Pressure Rating
- 18.3.7. Application
- 18.3.8. End-Use Industry
- 18.3.9. Distribution Channel
- 18.3.10. Country
- 18.3.10.1. China
- 18.3.10.2. India
- 18.3.10.3. Japan
- 18.3.10.4. South Korea
- 18.3.10.5. Australia and New Zealand
- 18.3.10.6. Indonesia
- 18.3.10.7. Malaysia
- 18.3.10.8. Thailand
- 18.3.10.9. Vietnam
- 18.3.10.10. Rest of Asia Pacific
- 18.4. China Industrial Valve Market
- 18.4.1. Country Segmental Analysis
- 18.4.2. Valve Type
- 18.4.3. Material
- 18.4.4. Size
- 18.4.5. Function
- 18.4.6. Operation
- 18.4.7. Pressure Rating
- 18.4.8. Application
- 18.4.9. End-Use Industry
- 18.4.10. Distribution Channel
- 18.5. India Industrial Valve Market
- 18.5.1. Country Segmental Analysis
- 18.5.2. Valve Type
- 18.5.3. Material
- 18.5.4. Size
- 18.5.5. Function
- 18.5.6. Operation
- 18.5.7. Pressure Rating
- 18.5.8. Application
- 18.5.9. End-Use Industry
- 18.5.10. Distribution Channel
- 18.6. Japan Industrial Valve Market
- 18.6.1. Country Segmental Analysis
- 18.6.2. Well Type
- 18.6.3. Operation Type
- 18.6.4. Motor Type
- 18.6.5. Pump Capacity
- 18.6.6. Component
- 18.6.7. Power Rating
- 18.6.8. Application
- 18.6.9. End-Use Industry
- 18.7. South Korea Industrial Valve Market
- 18.7.1. Country Segmental Analysis
- 18.7.2. Valve Type
- 18.7.3. Material
- 18.7.4. Size
- 18.7.5. Function
- 18.7.6. Operation
- 18.7.7. Pressure Rating
- 18.7.8. Application
- 18.7.9. End-Use Industry
- 18.7.10. Distribution Channel
- 18.8. Australia and New Zealand Industrial Valve Market
- 18.8.1. Country Segmental Analysis
- 18.8.2. Valve Type
- 18.8.3. Material
- 18.8.4. Size
- 18.8.5. Function
- 18.8.6. Operation
- 18.8.7. Pressure Rating
- 18.8.8. Application
- 18.8.9. End-Use Industry
- 18.8.10. Distribution Channel
- 18.9. Indonesia Industrial Valve Market
- 18.9.1. Country Segmental Analysis
- 18.9.2. Valve Type
- 18.9.3. Material
- 18.9.4. Size
- 18.9.5. Function
- 18.9.6. Operation
- 18.9.7. Pressure Rating
- 18.9.8. Application
- 18.9.9. End-Use Industry
- 18.9.10. Distribution Channel
- 18.10. Malaysia Industrial Valve Market
- 18.10.1. Country Segmental Analysis
- 18.10.2. Valve Type
- 18.10.3. Material
- 18.10.4. Size
- 18.10.5. Function
- 18.10.6. Operation
- 18.10.7. Pressure Rating
- 18.10.8. Application
- 18.10.9. End-Use Industry
- 18.10.10. Distribution Channel
- 18.11. Thailand Industrial Valve Market
- 18.11.1. Country Segmental Analysis
- 18.11.2. Valve Type
- 18.11.3. Material
- 18.11.4. Size
- 18.11.5. Function
- 18.11.6. Operation
- 18.11.7. Pressure Rating
- 18.11.8. Application
- 18.11.9. End-Use Industry
- 18.11.10. Distribution Channel
- 18.12. Vietnam Industrial Valve Market
- 18.12.1. Country Segmental Analysis
- 18.12.2. Valve Type
- 18.12.3. Material
- 18.12.4. Size
- 18.12.5. Function
- 18.12.6. Operation
- 18.12.7. Pressure Rating
- 18.12.8. Application
- 18.12.9. End-Use Industry
- 18.12.10. Distribution Channel
- 18.13. Rest of Asia Pacific Industrial Valve Market
- 18.13.1. Country Segmental Analysis
- 18.13.2. Valve Type
- 18.13.3. Material
- 18.13.4. Size
- 18.13.5. Function
- 18.13.6. Operation
- 18.13.7. Pressure Rating
- 18.13.8. Application
- 18.13.9. End-Use Industry
- 18.13.10. Distribution Channel
- 19. Middle East Industrial Valve Market Analysis
- 19.1. Key Segment Analysis
- 19.2. Regional Snapshot
- 19.3. Middle East Industrial Valve Market Size (Value - US$ Bn and Volume - Thousand Units), Analysis, and Forecasts, 2021-2035
- 19.3.1. Valve Type
- 19.3.2. Material
- 19.3.3. Size
- 19.3.4. Function
- 19.3.5. Operation
- 19.3.6. Pressure Rating
- 19.3.7. Application
- 19.3.8. End-Use Industry
- 19.3.9. Distribution Channel
- 19.3.10. Country
- 19.3.10.1. Turkey
- 19.3.10.2. UAE
- 19.3.10.3. Saudi Arabia
- 19.3.10.4. Israel
- 19.3.10.5. Rest of Middle East
- 19.4. Turkey Industrial Valve Market
- 19.4.1. Country Segmental Analysis
- 19.4.2. Valve Type
- 19.4.3. Material
- 19.4.4. Size
- 19.4.5. Function
- 19.4.6. Operation
- 19.4.7. Pressure Rating
- 19.4.8. Application
- 19.4.9. End-Use Industry
- 19.4.10. Distribution Channel
- 19.5. UAE Industrial Valve Market
- 19.5.1. Country Segmental Analysis
- 19.5.2. Valve Type
- 19.5.3. Material
- 19.5.4. Size
- 19.5.5. Function
- 19.5.6. Operation
- 19.5.7. Pressure Rating
- 19.5.8. Application
- 19.5.9. End-Use Industry
- 19.5.10. Distribution Channel
- 19.6. Saudi Arabia Industrial Valve Market
- 19.6.1. Country Segmental Analysis
- 19.6.2. Valve Type
- 19.6.3. Material
- 19.6.4. Size
- 19.6.5. Function
- 19.6.6. Operation
- 19.6.7. Pressure Rating
- 19.6.8. Application
- 19.6.9. End-Use Industry
- 19.6.10. Distribution Channel
- 19.7. Israel Industrial Valve Market
- 19.7.1. Country Segmental Analysis
- 19.7.2. Valve Type
- 19.7.3. Material
- 19.7.4. Size
- 19.7.5. Function
- 19.7.6. Operation
- 19.7.7. Pressure Rating
- 19.7.8. Application
- 19.7.9. End-Use Industry
- 19.7.10. Distribution Channel
- 19.8. Rest of Middle East Industrial Valve Market
- 19.8.1. Country Segmental Analysis
- 19.8.2. Valve Type
- 19.8.3. Material
- 19.8.4. Size
- 19.8.5. Function
- 19.8.6. Operation
- 19.8.7. Pressure Rating
- 19.8.8. Application
- 19.8.9. End-Use Industry
- 19.8.10. Distribution Channel
- 20. Africa Industrial Valve Market Analysis
- 20.1. Key Segment Analysis
- 20.2. Regional Snapshot
- 20.3. Africa Industrial Valve Market Size (Value - US$ Bn and Volume - Thousand Units), Analysis, and Forecasts, 2021-2035
- 20.3.1. Valve Type
- 20.3.2. Material
- 20.3.3. Size
- 20.3.4. Function
- 20.3.5. Operation
- 20.3.6. Pressure Rating
- 20.3.7. Application
- 20.3.8. End-Use Industry
- 20.3.9. Distribution Channel
- 20.3.10. Country
- 20.3.10.1. South Africa
- 20.3.10.2. Egypt
- 20.3.10.3. Nigeria
- 20.3.10.4. Algeria
- 20.3.10.5. Rest of Africa
- 20.4. South Africa Industrial Valve Market
- 20.4.1. Country Segmental Analysis
- 20.4.2. Valve Type
- 20.4.3. Material
- 20.4.4. Size
- 20.4.5. Function
- 20.4.6. Operation
- 20.4.7. Pressure Rating
- 20.4.8. Application
- 20.4.9. End-Use Industry
- 20.4.10. Distribution Channel
- 20.5. Egypt Industrial Valve Market
- 20.5.1. Country Segmental Analysis
- 20.5.2. Valve Type
- 20.5.3. Material
- 20.5.4. Size
- 20.5.5. Function
- 20.5.6. Operation
- 20.5.7. Pressure Rating
- 20.5.8. Application
- 20.5.9. End-Use Industry
- 20.5.10. Distribution Channel
- 20.6. Nigeria Industrial Valve Market
- 20.6.1. Country Segmental Analysis
- 20.6.2. Valve Type
- 20.6.3. Material
- 20.6.4. Size
- 20.6.5. Function
- 20.6.6. Operation
- 20.6.7. Pressure Rating
- 20.6.8. Application
- 20.6.9. End-Use Industry
- 20.6.10. Distribution Channel
- 20.7. Algeria Industrial Valve Market
- 20.7.1. Country Segmental Analysis
- 20.7.2. Valve Type
- 20.7.3. Material
- 20.7.4. Size
- 20.7.5. Function
- 20.7.6. Operation
- 20.7.7. Pressure Rating
- 20.7.8. Application
- 20.7.9. End-Use Industry
- 20.7.10. Distribution Channel
- 20.8. Rest of Africa Industrial Valve Market
- 20.8.1. Country Segmental Analysis
- 20.8.2. Valve Type
- 20.8.3. Material
- 20.8.4. Size
- 20.8.5. Function
- 20.8.6. Operation
- 20.8.7. Pressure Rating
- 20.8.8. Application
- 20.8.9. End-Use Industry
- 20.8.10. Distribution Channel
- 21. South America Industrial Valve Market Analysis
- 21.1. Key Segment Analysis
- 21.2. Regional Snapshot
- 21.3. South America Industrial Valve Market Size (Value - US$ Bn and Volume - Thousand Units), Analysis, and Forecasts, 2021-2035
- 21.3.1. Valve Type
- 21.3.2. Material
- 21.3.3. Size
- 21.3.4. Function
- 21.3.5. Operation
- 21.3.6. Pressure Rating
- 21.3.7. Application
- 21.3.8. End-Use Industry
- 21.3.9. Distribution Channel
- 21.3.10. Country
- 21.3.10.1. Brazil
- 21.3.10.2. Argentina
- 21.3.10.3. Rest of South America
- 21.4. Brazil Industrial Valve Market
- 21.4.1. Country Segmental Analysis
- 21.4.2. Valve Type
- 21.4.3. Material
- 21.4.4. Size
- 21.4.5. Function
- 21.4.6. Operation
- 21.4.7. Pressure Rating
- 21.4.8. Application
- 21.4.9. End-Use Industry
- 21.4.10. Distribution Channel
- 21.5. Argentina Industrial Valve Market
- 21.5.1. Country Segmental Analysis
- 21.5.2. Valve Type
- 21.5.3. Material
- 21.5.4. Size
- 21.5.5. Function
- 21.5.6. Operation
- 21.5.7. Pressure Rating
- 21.5.8. Application
- 21.5.9. End-Use Industry
- 21.5.10. Distribution Channel
- 21.6. Rest of South America Industrial Valve Market
- 21.6.1. Country Segmental Analysis
- 21.6.2. Valve Type
- 21.6.3. Material
- 21.6.4. Size
- 21.6.5. Function
- 21.6.6. Operation
- 21.6.7. Pressure Rating
- 21.6.8. Application
- 21.6.9. End-Use Industry
- 21.6.10. Distribution Channel
- 22. Key Players/ Company Profile
- 22.1. Alfa Laval
- 22.1.1. Company Details/ Overview
- 22.1.2. Company Financials
- 22.1.3. Key Customers and Competitors
- 22.1.4. Business/ Industry Portfolio
- 22.1.5. Product Portfolio/ Specification Details
- 22.1.6. Pricing Data
- 22.1.7. Strategic Overview
- 22.1.8. Recent Developments
- 22.2. Apollo Valves
- 22.3. AVK Holding A/S
- 22.4. Bonney Forge Corporation
- 22.5. Bray International
- 22.6. Bürkert Fluid Control Systems
- 22.7. Cameron (Schlumberger)
- 22.8. Crane Co.
- 22.9. Emerson Electric Co.
- 22.10. Flowserve Corporation
- 22.11. IMI plc
- 22.12. KITZ Corporation
- 22.13. KSB SE & Co. KGaA
- 22.14. Metso Corporation
- 22.15. Neway Valve
- 22.16. Pentair plc
- 22.17. SAMSON AG
- 22.18. Spirax Sarco
- 22.19. Velan Inc.
- 22.20. Weir Group
- 22.21. Other Key Players
- 22.1. Alfa Laval
Note* - This is just tentative list of players. While providing the report, we will cover more number of players based on their revenue and share for each geography
Research Design
Our research design integrates both demand-side and supply-side analysis through a balanced combination of primary and secondary research methodologies. By utilizing both bottom-up and top-down approaches alongside rigorous data triangulation methods, we deliver robust market intelligence that supports strategic decision-making.
MarketGenics' comprehensive research design framework ensures the delivery of accurate, reliable, and actionable market intelligence. Through the integration of multiple research approaches, rigorous validation processes, and expert analysis, we provide our clients with the insights needed to make informed strategic decisions and capitalize on market opportunities.

MarketGenics leverages a dedicated industry panel of experts and a comprehensive suite of paid databases to effectively collect, consolidate, and analyze market intelligence.
Our approach has consistently proven to be reliable and effective in generating accurate market insights, identifying key industry trends, and uncovering emerging business opportunities.
Through both primary and secondary research, we capture and analyze critical company-level data such as manufacturing footprints, including technical centers, R&D facilities, sales offices, and headquarters.
Our expert panel further enhances our ability to estimate market size for specific brands based on validated field-level intelligence.
Our data mining techniques incorporate both parametric and non-parametric methods, allowing for structured data collection, sorting, processing, and cleaning.
Demand projections are derived from large-scale data sets analyzed through proprietary algorithms, culminating in robust and reliable market sizing.
Research Approach
The bottom-up approach builds market estimates by starting with the smallest addressable market units and systematically aggregating them to create comprehensive market size projections.
This method begins with specific, granular data points and builds upward to create the complete market landscape.
Customer Analysis → Segmental Analysis → Geographical Analysis
The top-down approach starts with the broadest possible market data and systematically narrows it down through a series of filters and assumptions to arrive at specific market segments or opportunities.
This method begins with the big picture and works downward to increasingly specific market slices.
TAM → SAM → SOM


Research Methods
Desk / Secondary Research
While analysing the market, we extensively study secondary sources, directories, and databases to identify and collect information useful for this technical, market-oriented, and commercial report. Secondary sources that we utilize are not only the public sources, but it is a combination of Open Source, Associations, Paid Databases, MG Repository & Knowledgebase, and others.
- Company websites, annual reports, financial reports, broker reports, and investor presentations
- National government documents, statistical databases and reports
- News articles, press releases and web-casts specific to the companies operating in the market, Magazines, reports, and others
- We gather information from commercial data sources for deriving company specific data such as segmental revenue, share for geography, product revenue, and others
- Internal and external proprietary databases (industry-specific), relevant patent, and regulatory databases
- Governing Bodies, Government Organizations
- Relevant Authorities, Country-specific Associations for Industries
We also employ the model mapping approach to estimate the product level market data through the players' product portfolio
Primary Research
Primary research/ interviews is vital in analyzing the market. Most of the cases involves paid primary interviews. Primary sources include primary interviews through e-mail interactions, telephonic interviews, surveys as well as face-to-face interviews with the different stakeholders across the value chain including several industry experts.
| Type of Respondents | Number of Primaries |
|---|---|
| Tier 2/3 Suppliers | ~20 |
| Tier 1 Suppliers | ~25 |
| End-users | ~25 |
| Industry Expert/ Panel/ Consultant | ~30 |
| Total | ~100 |
MG Knowledgebase
• Repository of industry blog, newsletter and case studies
• Online platform covering detailed market reports, and company profiles
Forecasting Factors and Models
Forecasting Factors
- Historical Trends – Past market patterns, cycles, and major events that shaped how markets behave over time. Understanding past trends helps predict future behavior.
- Industry Factors – Specific characteristics of the industry like structure, regulations, and innovation cycles that affect market dynamics.
- Macroeconomic Factors – Economic conditions like GDP growth, inflation, and employment rates that affect how much money people have to spend.
- Demographic Factors – Population characteristics like age, income, and location that determine who can buy your product.
- Technology Factors – How quickly people adopt new technology and how much technology infrastructure exists.
- Regulatory Factors – Government rules, laws, and policies that can help or restrict market growth.
- Competitive Factors – Analyzing competition structure such as degree of competition and bargaining power of buyers and suppliers.
Forecasting Models / Techniques
Multiple Regression Analysis
- Identify and quantify factors that drive market changes
- Statistical modeling to establish relationships between market drivers and outcomes
Time Series Analysis – Seasonal Patterns
- Understand regular cyclical patterns in market demand
- Advanced statistical techniques to separate trend, seasonal, and irregular components
Time Series Analysis – Trend Analysis
- Identify underlying market growth patterns and momentum
- Statistical analysis of historical data to project future trends
Expert Opinion – Expert Interviews
- Gather deep industry insights and contextual understanding
- In-depth interviews with key industry stakeholders
Multi-Scenario Development
- Prepare for uncertainty by modeling different possible futures
- Creating optimistic, pessimistic, and most likely scenarios
Time Series Analysis – Moving Averages
- Sophisticated forecasting for complex time series data
- Auto-regressive integrated moving average models with seasonal components
Econometric Models
- Apply economic theory to market forecasting
- Sophisticated economic models that account for market interactions
Expert Opinion – Delphi Method
- Harness collective wisdom of industry experts
- Structured, multi-round expert consultation process
Monte Carlo Simulation
- Quantify uncertainty and probability distributions
- Thousands of simulations with varying input parameters
Research Analysis
Our research framework is built upon the fundamental principle of validating market intelligence from both demand and supply perspectives. This dual-sided approach ensures comprehensive market understanding and reduces the risk of single-source bias.
Demand-Side Analysis: We understand end-user/application behavior, preferences, and market needs along with the penetration of the product for specific application.
Supply-Side Analysis: We estimate overall market revenue, analyze the segmental share along with industry capacity, competitive landscape, and market structure.
Validation & Evaluation
Data triangulation is a validation technique that uses multiple methods, sources, or perspectives to examine the same research question, thereby increasing the credibility and reliability of research findings. In market research, triangulation serves as a quality assurance mechanism that helps identify and minimize bias, validate assumptions, and ensure accuracy in market estimates.
- Data Source Triangulation – Using multiple data sources to examine the same phenomenon
- Methodological Triangulation – Using multiple research methods to study the same research question
- Investigator Triangulation – Using multiple researchers or analysts to examine the same data
- Theoretical Triangulation – Using multiple theoretical perspectives to interpret the same data

Custom Market Research Services
We will customise the research for you, in case the report listed above does not meet your requirements.
Get 10% Free Customisation