Intravenous Solutions Market Size, Share & Trends Analysis Report by Product Type (Large Volume Parenterals (LVP), Small Volume Parenterals (SVP), Total Parenteral Nutrition (TPN)), Solution Type, Container Type, Rated Capacity, Flow Rate/Infusion Rate, Therapeutic Application, Concentration/Osmolarity, Distribution Channel, Packaging Configuration, End-users and Geography (North America, Europe, Asia Pacific, Middle East, Africa, and South America) – Global Industry Data, Trends, and Forecasts, 2026–2035
|
|
|
Segmental Data Insights |
|
|
Demand Trends |
|
|
Competitive Landscape |
|
|
Strategic Development |
|
|
Future Outlook & Opportunities |
|
Intravenous Solutions Market Size, Share, and Growth
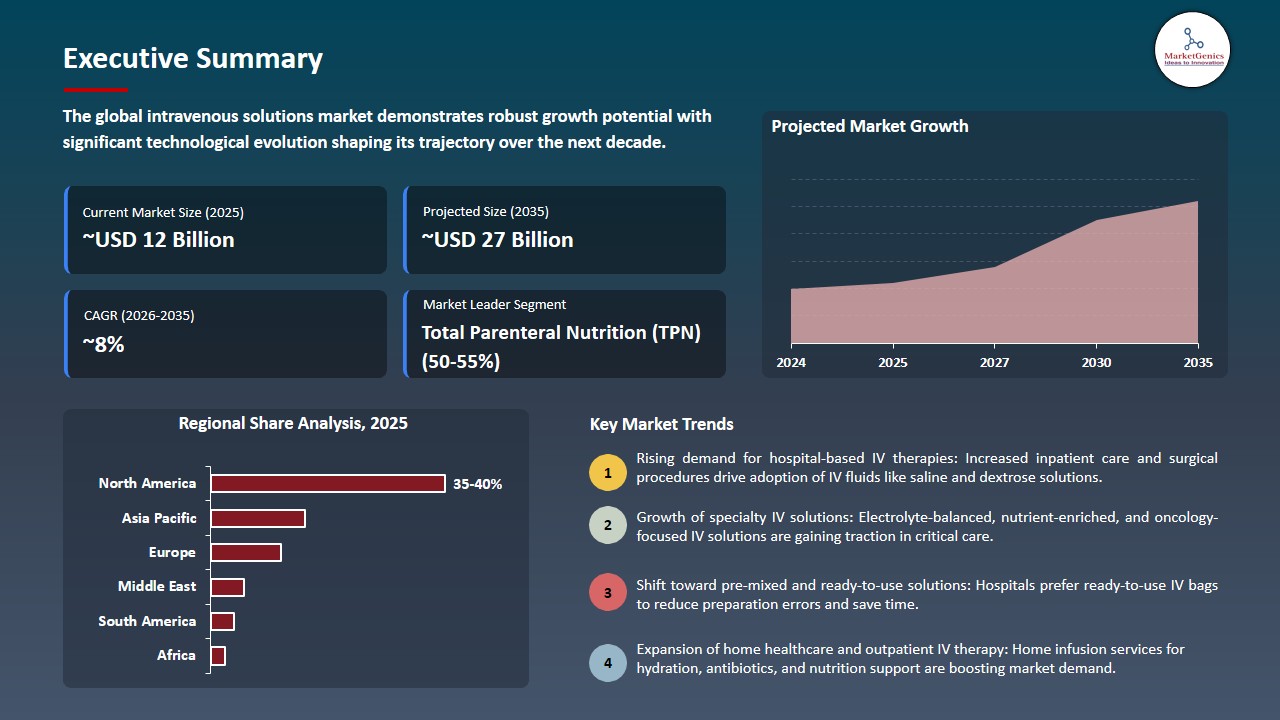
The global intravenous solutions market is witnessing strong growth, valued at USD 12.8 billion in 2025 and projected to reach USD 26.6 billion by 2035, expanding at a CAGR of 7.6% during the forecast period. Asia Pacific is the fastest-growing region in the intravenous solutions market due to expanding healthcare infrastructure, rising patient volumes, increasing prevalence of chronic and infectious diseases, and growing demand for parenteral nutrition and fluid therapy across hospitals and homecare settings.
Cecilia Soriano, president of Baxter’s global Infusion Therapies and Technologies division, said, “Expanding access to Clinolipid for this critical and vulnerable patient population offers clinicians versatility in choosing the product that best meets their patients’ needs when it matters most”.
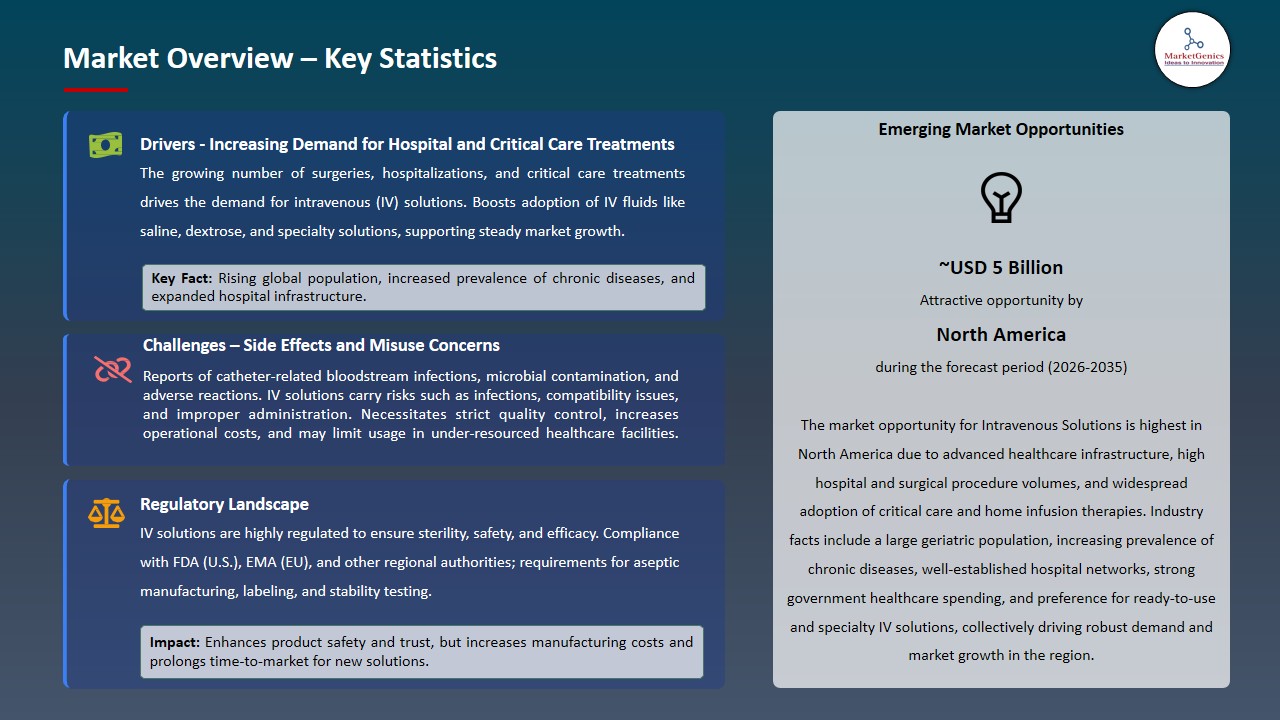
The rising prevalence of chronic diseases, dehydration, malnutrition, and infections is significantly driving the intravenous solutions market. Increased hospitalizations and the need for timely, precise fluid and nutrient administration amplify demand for IV therapies, ensuring patient recovery and clinical stability. Healthcare providers are increasingly relying on intravenous solutions to manage complex medical conditions efficiently, supporting both acute and long-term patient care.
The development of customized and condition-specific intravenous formulations presents a significant opportunity in the intravenous solutions market. Tailored IV solutions that meet individual patient needs such as specific nutrient profiles, electrolyte balances, or disease-targeted therapies enhance treatment efficacy, improve patient outcomes, and increase clinician preference. This trend supports the shift toward personalized medicine, driving innovation, adoption, and growth in hospital and ambulatory care settings.
Adjacent opportunities in the intravenous solutions market include the integration of smart IV delivery systems for real-time monitoring, expansion into emerging markets with limited hospital infrastructure, development of cost-effective generic IV solutions, partnerships with telemedicine and remote care providers, and innovations in eco-friendly, single-use packaging to reduce contamination risks and improve sustainability in healthcare settings.
Intravenous Solutions Market Dynamics and Trends
Driver: High Prevalence of Iron Deficiency Among Women
-
The increasing number of surgical procedures, emergency care cases, and ICU admissions worldwide is a key driver for the intravenous solutions Market. Surgical interventions, critical injuries, and acute medical conditions often require rapid fluid replacement, electrolyte balance, and nutritional support, which are primarily administered via intravenous therapy.
- Hospitals and healthcare facilities rely on IV solutions to stabilize patients during perioperative care, trauma management, and intensive care treatments. The growing prevalence of complex surgeries, an aging population with higher surgical needs, and rising incidences of emergencies such as accidents, cardiovascular events, and infectious outbreaks collectively drive consistent demand for IV fluids, parenteral nutrition, and specialized infusion therapies, reinforcing the market’s expansion globally.
- In December 2025, B. Braun Medical Inc. launched its Supply Assurance Program, a first-of-its-kind initiative ensuring 45 days of inventory at key U.S. distributor warehouses. The program enhances supply chain resiliency for IV solutions, nutrition containers, and infusion products, helping healthcare providers maintain uninterrupted patient care.
- This rising demand for surgical, emergency, and ICU care, supported by proactive supply chain initiatives, continues to drive sustained growth in the global intravenous solutions market.
Restraint: Risk of Infections and Complications Limits IV Solutions Market Growth
-
The risk of hospital-acquired infections (HAIs) and complications related to improper intravenous (IV) administration is a significant restraint in the intravenous solutions market. IV therapy, while essential for fluid replacement, nutrition, and drug delivery, involves direct access to the bloodstream, increasing the potential for infections if aseptic techniques are not strictly followed.
- Catheter-related bloodstream infections (CRBSIs), phlebitis, and other IV-associated complications can compromise patient safety, lead to prolonged hospital stays, and increase healthcare costs.
- Healthcare providers must adhere to rigorous protocols, including proper hand hygiene, sterilization of equipment, and regular monitoring of IV sites. However, variations in clinical practice, insufficient training, and human errors can still result in adverse events. These safety concerns may discourage clinicians from using certain IV solutions or prompt regulatory authorities to enforce stricter guidelines, thereby impacting market growth.
- Manufacturers must invest in safer IV delivery systems, antimicrobial technologies, and staff training programs, but these measures can increase costs and pose challenges to widespread adoption, limiting overall market expansion
Opportunity: Growing adoption of IV nutrition in oncology, neonatal, and critical care
-
The increasing adoption of intravenous (IV) nutrition in oncology, neonatal, and critical care presents a significant growth opportunity for the intravenous solutions market. Patients in these segments often have heightened nutritional requirements that cannot be met through oral intake due to illness, treatment side effects, or gastrointestinal limitations.
- IV nutrition, including total parenteral nutrition (TPN) and specialized electrolyte solutions, provides precise, controlled, and immediate nutrient delivery, supporting recovery, growth, and immune function. Advancements in formulation, such as customized nutrient profiles and multi-chamber bags, enhance safety, tolerability, and clinical outcomes. Hospitals and specialized care units are increasingly integrating IV nutrition into standard care protocols, creating a consistent and expanding demand for high-quality, sterile IV solutions tailored to critical patient populations.
- In 2024, Baxter International received U.S. FDA approval to expand the indication of its Clinolipid lipid injectable emulsion for use in pediatric and neonatal patients, providing essential calories and fatty acids via parenteral nutrition.
- This trend underscores a strong market potential for innovation and targeted product development.
Key Trend: Increased use of ready-to-use and premixed IV formulations
-
The increased use of ready-to-use (RTU) and premixed intravenous (IV) formulations is a key trend in the global intravenous solutions market. Hospitals and healthcare facilities are increasingly adopting these products to reduce the risk of medication errors, minimize compounding time, and enhance patient safety.
- RTU and premixed IV solutions come in standardized concentrations and sterile packaging, allowing clinicians to administer treatments directly without additional preparation. This convenience not only improves workflow efficiency but also ensures consistent dosing and reduces contamination risks.
- Endo, Inc. expanded its ADRENALIN ready‑to‑use premixed IV bag portfolio, introducing new premixed epinephrine IV bag concentrations (including 8 mg/250 mL and other strengths) that require no compounding or preparation before administration. These FDA‑approved, manufacturer‑prepared bags streamline hospital workflows, reduce preparation errors.
- The growing preference for RTU and premixed solutions is further driven by the rising complexity of hospital care, the demand for rapid therapeutic interventions, and the need to support critical care, emergency, and ambulatory infusion settings.
Intravenous-Solutions-Market Analysis and Segmental Data
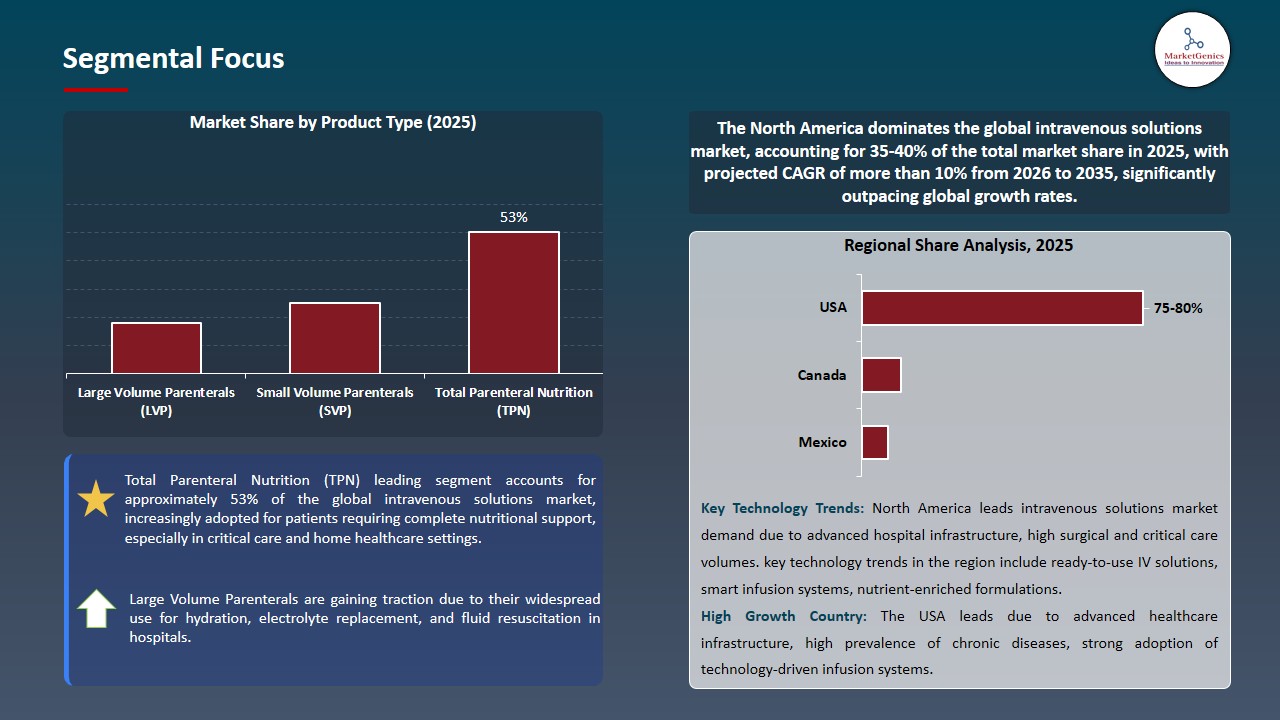
Total Parenteral Nutrition (TPN) Dominate Global Intravenous Solutions Market
-
Total parenteral nutrition dominates the global intravenous solutions market as the leading segment due to its essential role in providing complete nutritional support to patients who cannot absorb nutrients through the gastrointestinal tract. TPN is widely used in critical care, oncology, gastrointestinal disorders, premature infants, and post-surgical recovery, where precise and continuous nutrient delivery is vital.
- The segment benefits from rising prevalence of chronic diseases, increasing surgical procedures, and longer hospital stays, which heighten the need for comprehensive parenteral nutrition. Advances in formulation, such as multi-chamber bags and customized nutrient profiles, improve safety, convenience, and clinical outcomes, further strengthening TPN’s dominance in the global market.
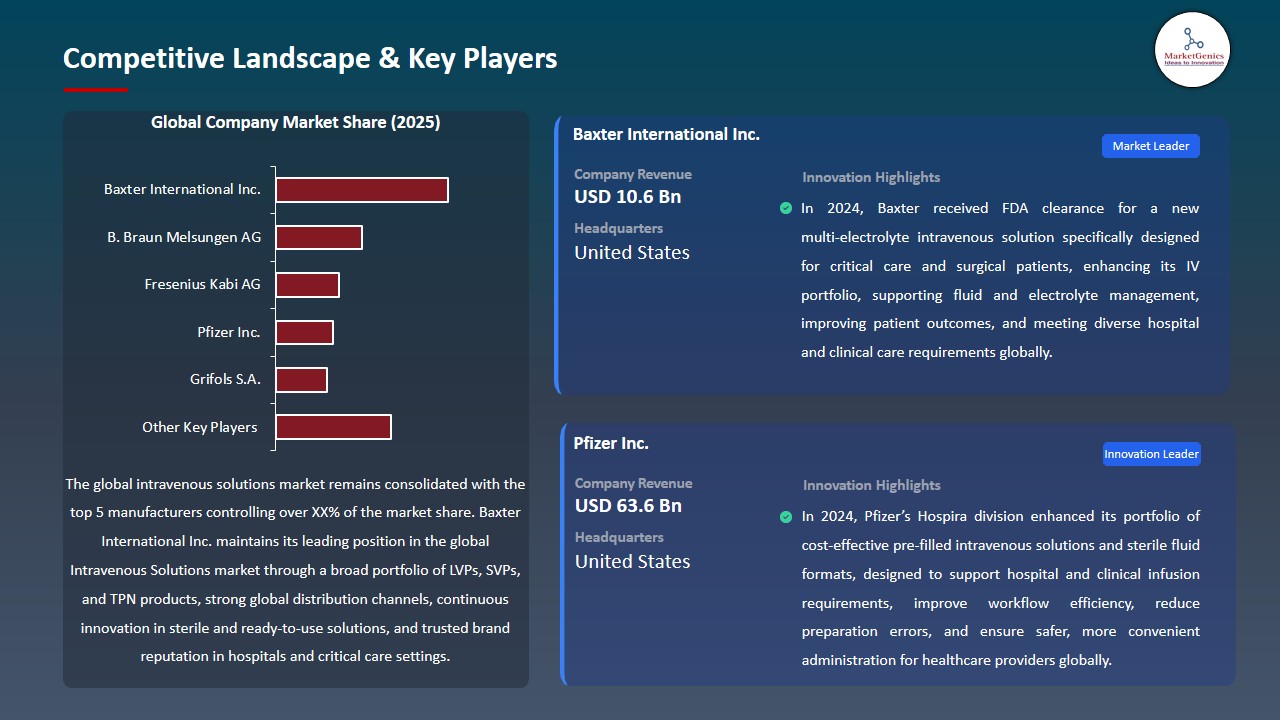
- Baxter International reported continued strong demand for its sterile IV solutions, infusion systems, and parenteral nutrition therapies, with growth in its Medical Products & Therapies segment driven by IV infusion and nutrition solutions sales, reflecting the ongoing reliance on intravenous therapies for critical and nutritional support in healthcare settings.
- The growing reliance on total parenteral nutrition for critical and specialized patient care continues to drive the global intravenous solutions market.
North America Leads Global Intravenous Solutions Market Demand
-
North America leads global intravenous solutions market demand due to its highly developed healthcare infrastructure and strong reliance on advanced hospital-based therapies. The region has a high volume of surgical procedures, trauma cases, and critical care admissions, all of which require continuous use of intravenous fluids, electrolytes, and parenteral nutrition solutions. A large aging population with chronic conditions further sustains long-term demand for IV therapies.
- Additionally, the region demonstrates strong adoption of total parenteral nutrition (TPN), home infusion therapy, and ambulatory care services, supported by favorable reimbursement frameworks and widespread insurance coverage. The presence of stringent quality standards and emphasis on patient safety also encourages the use of ready-to-use and specialized intravenous formulations.
- Growing preference for home healthcare, technological advancements in infusion delivery systems, and increased focus on nutrition support in disease management continue to reinforce North America’s leadership in the global intravenous solutions market.
Intravenous-Solutions-Market Ecosystem
The global intravenous solutions market is consolidated, with leading players including Baxter International Inc., B. Braun Melsungen AG, Fresenius Kabi AG, Pfizer Inc., and Grifols S.A. These companies hold strong competitive positions through extensive expertise in sterile manufacturing, broad portfolios of IV fluids and parenteral nutrition solutions, robust R&D capabilities, and well-established hospital and healthcare distribution networks. Their strengths are further reinforced by long-standing relationships with healthcare providers, regulatory proficiency, and continuous innovation in ready-to-use and specialty intravenous formulations.
The market value chain spans pharmaceutical-grade raw material sourcing, formulation of IV fluids and nutrition solutions, sterile compounding and aseptic filling, rigorous quality testing and stability validation, regulatory approvals, large-scale manufacturing under stringent GMP and sterile standards, specialized packaging, distribution through hospitals, clinics, and home infusion providers, and post-market surveillance ensuring safety, efficacy, and supply continuity.
High entry barriers persist due to capital-intensive sterile production facilities, strict regulatory and quality compliance, complex cold-chain and logistics requirements, and the critical need for uninterrupted supply. Ongoing innovations such as multi-chamber bags, customized parenteral nutrition, and home-infusion-compatible solutions continue to drive differentiation and market adoption globally.
Recent Development and Strategic Overview:
-
In September 2025, B. Braun Medical Inc. received the Nurse Approved Certification for its entire IV solutions portfolio not made with DEHP or PVC, including plastic irrigation containers and Pip-Taz in the DUPLEX system. This recognition highlights enhanced usability, workflow efficiency, and safety for nurses, while the ready-to-activate DUPLEX® system reduces bedside preparation time and minimizes medication errors.
- In March 2025, Grifols S.A. announced positive results from a Phase 2/3 trial evaluating Flebogamma 5% DIF intravenous immunoglobulin (IVIG) in patients with post-polio syndrome. Monthly IVIG infusions (1 g/kg) significantly improved physical performance in the two-minute walk distance (2MWD) and six-minute walk distance (6MWD) compared to placebo.
Report Scope
|
Detail |
|
|
Market Size in 2025 |
USD 12.8 Bn |
|
Market Forecast Value in 2035 |
USD 26.6 Bn |
|
Growth Rate (CAGR) |
7.6% |
|
Forecast Period |
2026 – 2035 |
|
Historical Data Available for |
2021 – 2024 |
|
Market Size Units |
US$ Billion for Value |
|
Report Format |
Electronic (PDF) + Excel |
|
North America |
Europe |
Asia Pacific |
Middle East |
Africa |
South America |
|
|
|
|
|
|
|
Companies Covered |
|||||
|
|
|
|
|
|
Intravenous-Solutions-Market Segmentation and Highlights
|
Segment |
Sub-segment |
|
Intravenous Solutions Market, By Product Type |
|
|
Intravenous Solutions Market, By Solution Type |
|
|
Intravenous Solutions Market, By Container Type |
|
|
Intravenous Solutions Market, By Rated Capacity |
|
|
Intravenous Solutions Market, By Flow Rate/Infusion Rate |
|
|
Intravenous Solutions Market, By Therapeutic Application |
|
|
Intravenous Solutions Market, By Concentration/Osmolarity |
|
|
Intravenous Solutions Market, By Distribution Channel |
|
|
Intravenous Solutions Market, By Packaging Configuration |
|
|
Intravenous Solutions Market, By End-users |
|
Frequently Asked Questions
Table of Contents
- 1. Research Methodology and Assumptions
- 1.1. Definitions
- 1.2. Research Design and Approach
- 1.3. Data Collection Methods
- 1.4. Base Estimates and Calculations
- 1.5. Forecasting Models
- 1.5.1. Key Forecast Factors & Impact Analysis
- 1.6. Secondary Research
- 1.6.1. Open Sources
- 1.6.2. Paid Databases
- 1.6.3. Associations
- 1.7. Primary Research
- 1.7.1. Primary Sources
- 1.7.2. Primary Interviews with Stakeholders across Ecosystem
- 2. Executive Summary
- 2.1. Global Intravenous Solutions Market Outlook
- 2.1.1. Intravenous Solutions Market Size Value (US$ Bn), and Forecasts, 2021-2035
- 2.1.2. Compounded Annual Growth Rate Analysis
- 2.1.3. Growth Opportunity Analysis
- 2.1.4. Segmental Share Analysis
- 2.1.5. Geographical Share Analysis
- 2.2. Market Analysis and Facts
- 2.3. Supply-Demand Analysis
- 2.4. Competitive Benchmarking
- 2.5. Go-to- Market Strategy
- 2.5.1. Customer/ End-use Industry Assessment
- 2.5.2. Growth Opportunity Data, 2026-2035
- 2.5.2.1. Regional Data
- 2.5.2.2. Country Data
- 2.5.2.3. Segmental Data
- 2.5.3. Identification of Potential Market Spaces
- 2.5.4. GAP Analysis
- 2.5.5. Potential Attractive Price Points
- 2.5.6. Prevailing Market Risks & Challenges
- 2.5.7. Preferred Sales & Marketing Strategies
- 2.5.8. Key Recommendations and Analysis
- 2.5.9. A Way Forward
- 2.1. Global Intravenous Solutions Market Outlook
- 3. Industry Data and Premium Insights
- 3.1. Global Healthcare & Pharmaceutical Industry Overview, 2025
- 3.1.1. Healthcare & Pharmaceutical Industry Ecosystem Analysis
- 3.1.2. Key Trends for Healthcare & Pharmaceutical Industry
- 3.1.3. Regional Distribution for Healthcare & Pharmaceutical Industry
- 3.2. Supplier Customer Data
- 3.3. Technology Roadmap and Developments
- 3.4. Trade Analysis
- 3.4.1. Import & Export Analysis, 2025
- 3.4.2. Top Importing Countries
- 3.4.3. Top Exporting Countries
- 3.5. Trump Tariff Impact Analysis
- 3.5.1. Manufacturer
- 3.5.1.1. Based on the component & Raw material
- 3.5.2. Supply Chain
- 3.5.3. End Consumer
- 3.5.1. Manufacturer
- 3.6. Raw Material Analysis
- 3.1. Global Healthcare & Pharmaceutical Industry Overview, 2025
- 4. Market Overview
- 4.1. Market Dynamics
- 4.1.1. Drivers
- 4.1.1.1. Rising hospitalizations, surgeries, and critical care admissions
- 4.1.1.2. Increasing prevalence of chronic diseases requiring IV therapy and nutrition
- 4.1.1.3. Growing adoption of ready-to-use and specialty intravenous solutions
- 4.1.2. Restraints
- 4.1.2.1. Stringent regulatory and sterility compliance requirements
- 4.1.2.2. Risk of contamination, infections, and supply chain disruptions
- 4.1.1. Drivers
- 4.2. Key Trend Analysis
- 4.3. Regulatory Framework
- 4.3.1. Key Regulations, Norms, and Subsidies, by Key Countries
- 4.3.2. Tariffs and Standards
- 4.3.3. Impact Analysis of Regulations on the Market
- 4.4. Value Chain Analysis
- 4.4.1. Raw Material Suppliers
- 4.4.2. Manufacturers
- 4.4.3. Distribution & Logistics
- 4.4.4. End-users
- 4.5. Porter’s Five Forces Analysis
- 4.6. PESTEL Analysis
- 4.7. Global Intravenous Solutions Market Demand
- 4.7.1. Historical Market Size – Value (US$ Bn), 2020-2024
- 4.7.2. Current and Future Market Size – Value (US$ Bn), 2026–2035
- 4.7.2.1. Y-o-Y Growth Trends
- 4.7.2.2. Absolute $ Opportunity Assessment
- 4.1. Market Dynamics
- 5. Competition Landscape
- 5.1. Competition structure
- 5.1.1. Fragmented v/s consolidated
- 5.2. Company Share Analysis, 2025
- 5.2.1. Global Company Market Share
- 5.2.2. By Region
- 5.2.2.1. North America
- 5.2.2.2. Europe
- 5.2.2.3. Asia Pacific
- 5.2.2.4. Middle East
- 5.2.2.5. Africa
- 5.2.2.6. South America
- 5.3. Product Comparison Matrix
- 5.3.1. Specifications
- 5.3.2. Market Positioning
- 5.3.3. Pricing
- 5.1. Competition structure
- 6. Global Intravenous Solutions Market Analysis, by Animal Type
- 6.1. Key Segment Analysis
- 6.2. Intravenous Solutions Market Size Value (US$ Bn), Analysis, and Forecasts, by Product Type, 2021-2035
- 6.2.1. Large Volume Parenterals (LVP)
- 6.2.1.1. Crystalloids
- 6.2.1.2. Colloids
- 6.2.2. Small Volume Parenterals (SVP)
- 6.2.2.1. Vials
- 6.2.2.2. Ampoules
- 6.2.2.3. Prefilled Syringes
- 6.2.3. Total Parenteral Nutrition (TPN)
- 6.2.3.1. Two-in-One
- 6.2.3.2. Three-in-One
- 6.2.3.3. Customized TPN
- 6.2.1. Large Volume Parenterals (LVP)
- 7. Global Intravenous Solutions Market Analysis, by Solution Type
- 7.1. Key Segment Analysis
- 7.2. Intravenous Solutions Market Size Value (US$ Bn), Analysis, and Forecasts, by Solution Type, 2021-2035
- 7.2.1. Isotonic Solutions
- 7.2.1.1. Normal Saline (0.9% NaCl)
- 7.2.1.2. Lactated Ringer's Solution
- 7.2.1.3. Ringer's Acetate
- 7.2.2. Hypotonic Solutions
- 7.2.2.1. 45% Saline
- 7.2.2.2. 33% Saline
- 7.2.3. Hypertonic Solutions
- 7.2.3.1. 3% Saline
- 7.2.3.2. 5% Saline
- 7.2.3.3. Dextrose Solutions (10%, 20%, 50%)
- 7.2.4. Balanced Crystalloids
- 7.2.4.1. Plasma-Lyte
- 7.2.4.2. Hartmann's Solution
- 7.2.1. Isotonic Solutions
- 8. Global Intravenous Solutions Market Analysis, by Container Type
- 8.1. Key Segment Analysis
- 8.2. Intravenous Solutions Market Size Value (US$ Bn), Analysis, and Forecasts, by Container Type, 2021-2035
- 8.2.1. Glass Bottles
- 8.2.1.1. Type I Glass
- 8.2.1.2. Type II Glass
- 8.2.1.3. Type III Glass
- 8.2.2. Plastic Bottles
- 8.2.2.1. Polyethylene (PE)
- 8.2.2.2. Polypropylene (PP)
- 8.2.2.3. Polyvinyl Chloride (PVC)
- 8.2.2.4. Non-PVC Materials
- 8.2.3. Flexible Bags
- 8.2.4. Semi-Rigid Containers
- 8.2.1. Glass Bottles
- 9. Global Intravenous Solutions Market Analysis, by Rated Capacity
- 9.1. Key Segment Analysis
- 9.2. Intravenous Solutions Market Size Value (US$ Bn), Analysis, and Forecasts, by Rated Capacity, 2021-2035
- 9.2.1. Small Volume (Below 100 ml)
- 9.2.2. Medium Volume (100-500 ml)
- 9.2.3. Large Volume (Above 500 ml)
- 10. Global Intravenous Solutions Market Analysis, by Flow Rate/Infusion Rate
- 10.1. Key Segment Analysis
- 10.2. Intravenous Solutions Market Size Value (US$ Bn), Analysis, and Forecasts, by Flow Rate/Infusion Rate, 2021-2035
- 10.2.1. Gravity-Fed Systems
- 10.2.1.1. Low Flow Rate (Below 50 ml/hr)
- 10.2.1.2. Medium Flow Rate (50-150 ml/hr)
- 10.2.1.3. High Flow Rate (Above 150 ml/hr)
- 10.2.2. Pump-Controlled Systems
- 10.2.2.1. Programmable Rate
- 10.2.2.2. Fixed Rate
- 10.2.1. Gravity-Fed Systems
- 11. Global Intravenous Solutions Market Analysis, by Therapeutic Application
- 11.1. Key Segment Analysis
- 11.2. Intravenous Solutions Market Size Value (US$ Bn), Analysis, and Forecasts, by Therapeutic Application, 2021-2035
- 11.2.1. Fluid & Electrolyte Replacement
- 11.2.1.1. Dehydration Management
- 11.2.1.2. Electrolyte Imbalance Correction
- 11.2.2. Nutritional Support
- 11.2.2.1. Parenteral Nutrition
- 11.2.2.2. Vitamin & Mineral Supplementation
- 11.2.3. Drug Delivery & Medication Administration
- 11.2.3.1. Antibiotic Delivery
- 11.2.3.2. Chemotherapy
- 11.2.3.3. Pain Management
- 11.2.3.4. Anesthesia
- 11.2.4. Blood Volume Expansion
- 11.2.4.1. Hemorrhage Management
- 11.2.4.2. Shock Treatment
- 11.2.1. Fluid & Electrolyte Replacement
- 12. Global Intravenous Solutions Market Analysis, by Concentration/Osmolarity
- 12.1. Key Segment Analysis
- 12.2. Intravenous Solutions Market Size Value (US$ Bn), Analysis, and Forecasts, by Concentration/Osmolarity, 2021-2035
- 12.2.1. Low Osmolarity (Below 250 mOsm/L)
- 12.2.2. Iso-osmolar (250-310 mOsm/L)
- 12.2.3. High Osmolarity (Above 310 mOsm/L)
- 12.2.4. Variable Concentration Solutions
- 13. Global Intravenous Solutions Market Analysis and Forecasts, by Distribution Channel
- 13.1. Key Findings
- 13.2. Intravenous Solutions Market Size Value (US$ Bn), Analysis, and Forecasts, by Distribution Channel, 2021-2035
- 13.2.1. Hospital Pharmacies
- 13.2.2. Retail Pharmacies
- 13.2.3. Online Pharmacies
- 13.2.4. Direct Distribution
- 14. Global Intravenous Solutions Market Analysis and Forecasts, by Packaging Configuration
- 14.1. Key Findings
- 14.2. Intravenous Solutions Market Size Value (US$ Bn), Analysis, and Forecasts, by Packaging Configuration, 2021-2035
- 14.2.1. Single-Unit Packaging
- 14.2.2. Multi-Unit Packaging
- 14.2.3. Sterile Overwrap
- 14.2.4. Non-Overwrap
- 15. Global Intravenous Solutions Market Analysis and Forecasts, by End-users
- 15.1. Key Findings
- 15.2. Intravenous Solutions Market Size Value (US$ Bn), Analysis, and Forecasts, by End-users, 2021-2035
- 15.2.1. Hospitals & Clinics
- 15.2.1.1. Emergency & Trauma Care
- 15.2.1.2. Intensive Care Units (ICU)
- 15.2.1.3. Operating Rooms
- 15.2.1.4. General Ward Administration
- 15.2.1.5. Outpatient Services
- 15.2.1.6. Dialysis Centers
- 15.2.1.7. Others
- 15.2.2. Ambulatory Surgical Centers
- 15.2.2.1. Day Surgery Procedures
- 15.2.2.2. Minor Surgical Interventions
- 15.2.2.3. Post-Operative Care
- 15.2.2.4. Pre-Operative Preparation
- 15.2.2.5. Others
- 15.2.3. Home Healthcare
- 15.2.3.1. Chronic Disease Management
- 15.2.3.2. Elderly Care
- 15.2.3.3. Palliative Care
- 15.2.3.4. Pediatric Home Care
- 15.2.3.5. Self-Administration Support
- 15.2.4. Others
- 15.2.5. Long-Term Care Facilities
- 15.2.6. Specialty Clinics
- 15.2.7. Other End-use
- 15.2.1. Hospitals & Clinics
- 16. Global Intravenous Solutions Market Analysis and Forecasts, by Region
- 16.1. Key Findings
- 16.2. Intravenous Solutions Market Size Value (US$ Bn), Analysis, and Forecasts, by Region, 2021-2035
- 16.2.1. North America
- 16.2.2. Europe
- 16.2.3. Asia Pacific
- 16.2.4. Middle East
- 16.2.5. Africa
- 16.2.6. South America
- 17. North America Intravenous Solutions Market Analysis
- 17.1. Key Segment Analysis
- 17.2. Regional Snapshot
- 17.3. North America Intravenous Solutions Market Size Value (US$ Bn), Analysis, and Forecasts, 2021-2035
- 17.3.1. Product Type
- 17.3.2. Solution Type
- 17.3.3. Container Type
- 17.3.4. Rated Capacity
- 17.3.5. Flow Rate/Infusion Rate
- 17.3.6. Therapeutic Application
- 17.3.7. Concentration/Osmolarity
- 17.3.8. Distribution Channel
- 17.3.9. Packaging Configuration
- 17.3.10. End-users
- 17.3.11. Country
- 17.3.11.1. USA
- 17.3.11.2. Canada
- 17.3.11.3. Mexico
- 17.4. USA Intravenous Solutions Market
- 17.4.1. Country Segmental Analysis
- 17.4.2. Product Type
- 17.4.3. Solution Type
- 17.4.4. Container Type
- 17.4.5. Rated Capacity
- 17.4.6. Flow Rate/Infusion Rate
- 17.4.7. Therapeutic Application
- 17.4.8. Concentration/Osmolarity
- 17.4.9. Distribution Channel
- 17.4.10. Packaging Configuration
- 17.4.11. End-users
- 17.5. Canada Intravenous Solutions Market
- 17.5.1. Country Segmental Analysis
- 17.5.2. Product Type
- 17.5.3. Solution Type
- 17.5.4. Container Type
- 17.5.5. Rated Capacity
- 17.5.6. Flow Rate/Infusion Rate
- 17.5.7. Therapeutic Application
- 17.5.8. Concentration/Osmolarity
- 17.5.9. Distribution Channel
- 17.5.10. Packaging Configuration
- 17.5.11. End-users
- 17.6. Mexico Intravenous Solutions Market
- 17.6.1. Country Segmental Analysis
- 17.6.2. Product Type
- 17.6.3. Solution Type
- 17.6.4. Container Type
- 17.6.5. Rated Capacity
- 17.6.6. Flow Rate/Infusion Rate
- 17.6.7. Therapeutic Application
- 17.6.8. Concentration/Osmolarity
- 17.6.9. Distribution Channel
- 17.6.10. Packaging Configuration
- 17.6.11. End-users
- 18. Europe Intravenous Solutions Market Analysis
- 18.1. Key Segment Analysis
- 18.2. Regional Snapshot
- 18.3. Europe Intravenous Solutions Market Size Value (US$ Bn), Analysis, and Forecasts, 2021-2035
- 18.3.1. Product Type
- 18.3.2. Solution Type
- 18.3.3. Container Type
- 18.3.4. Rated Capacity
- 18.3.5. Flow Rate/Infusion Rate
- 18.3.6. Therapeutic Application
- 18.3.7. Concentration/Osmolarity
- 18.3.8. Distribution Channel
- 18.3.9. Packaging Configuration
- 18.3.10. End-users
- 18.3.11. Country
- 18.3.11.1. Germany
- 18.3.11.2. United Kingdom
- 18.3.11.3. France
- 18.3.11.4. Italy
- 18.3.11.5. Spain
- 18.3.11.6. Netherlands
- 18.3.11.7. Nordic Countries
- 18.3.11.8. Poland
- 18.3.11.9. Russia & CIS
- 18.3.11.10. Rest of Europe
- 18.4. Germany Intravenous Solutions Market
- 18.4.1. Country Segmental Analysis
- 18.4.2. Product Type
- 18.4.3. Solution Type
- 18.4.4. Container Type
- 18.4.5. Rated Capacity
- 18.4.6. Flow Rate/Infusion Rate
- 18.4.7. Therapeutic Application
- 18.4.8. Concentration/Osmolarity
- 18.4.9. Distribution Channel
- 18.4.10. Packaging Configuration
- 18.4.11. End-users
- 18.5. United Kingdom Intravenous Solutions Market
- 18.5.1. Country Segmental Analysis
- 18.5.2. Product Type
- 18.5.3. Solution Type
- 18.5.4. Container Type
- 18.5.5. Rated Capacity
- 18.5.6. Flow Rate/Infusion Rate
- 18.5.7. Therapeutic Application
- 18.5.8. Concentration/Osmolarity
- 18.5.9. Distribution Channel
- 18.5.10. Packaging Configuration
- 18.5.11. End-users
- 18.6. France Intravenous Solutions Market
- 18.6.1. Country Segmental Analysis
- 18.6.2. Product Type
- 18.6.3. Solution Type
- 18.6.4. Container Type
- 18.6.5. Rated Capacity
- 18.6.6. Flow Rate/Infusion Rate
- 18.6.7. Therapeutic Application
- 18.6.8. Concentration/Osmolarity
- 18.6.9. Distribution Channel
- 18.6.10. Packaging Configuration
- 18.6.11. End-users
- 18.7. Italy Intravenous Solutions Market
- 18.7.1. Country Segmental Analysis
- 18.7.2. Product Type
- 18.7.3. Solution Type
- 18.7.4. Container Type
- 18.7.5. Rated Capacity
- 18.7.6. Flow Rate/Infusion Rate
- 18.7.7. Therapeutic Application
- 18.7.8. Concentration/Osmolarity
- 18.7.9. Distribution Channel
- 18.7.10. Packaging Configuration
- 18.7.11. End-users
- 18.8. Spain Intravenous Solutions Market
- 18.8.1. Country Segmental Analysis
- 18.8.2. Product Type
- 18.8.3. Solution Type
- 18.8.4. Container Type
- 18.8.5. Rated Capacity
- 18.8.6. Flow Rate/Infusion Rate
- 18.8.7. Therapeutic Application
- 18.8.8. Concentration/Osmolarity
- 18.8.9. Distribution Channel
- 18.8.10. Packaging Configuration
- 18.8.11. End-users
- 18.9. Netherlands Intravenous Solutions Market
- 18.9.1. Country Segmental Analysis
- 18.9.2. Product Type
- 18.9.3. Solution Type
- 18.9.4. Container Type
- 18.9.5. Rated Capacity
- 18.9.6. Flow Rate/Infusion Rate
- 18.9.7. Therapeutic Application
- 18.9.8. Concentration/Osmolarity
- 18.9.9. Distribution Channel
- 18.9.10. Packaging Configuration
- 18.9.11. End-users
- 18.10. Nordic Countries Intravenous Solutions Market
- 18.10.1. Country Segmental Analysis
- 18.10.2. Product Type
- 18.10.3. Solution Type
- 18.10.4. Container Type
- 18.10.5. Rated Capacity
- 18.10.6. Flow Rate/Infusion Rate
- 18.10.7. Therapeutic Application
- 18.10.8. Concentration/Osmolarity
- 18.10.9. Distribution Channel
- 18.10.10. Packaging Configuration
- 18.10.11. End-users
- 18.11. Poland Intravenous Solutions Market
- 18.11.1. Country Segmental Analysis
- 18.11.2. Product Type
- 18.11.3. Solution Type
- 18.11.4. Container Type
- 18.11.5. Rated Capacity
- 18.11.6. Flow Rate/Infusion Rate
- 18.11.7. Therapeutic Application
- 18.11.8. Concentration/Osmolarity
- 18.11.9. Distribution Channel
- 18.11.10. Packaging Configuration
- 18.11.11. End-users
- 18.12. Russia & CIS Intravenous Solutions Market
- 18.12.1. Country Segmental Analysis
- 18.12.2. Product Type
- 18.12.3. Solution Type
- 18.12.4. Container Type
- 18.12.5. Rated Capacity
- 18.12.6. Flow Rate/Infusion Rate
- 18.12.7. Therapeutic Application
- 18.12.8. Concentration/Osmolarity
- 18.12.9. Distribution Channel
- 18.12.10. Packaging Configuration
- 18.12.11. End-users
- 18.13. Rest of Europe Intravenous Solutions Market
- 18.13.1. Country Segmental Analysis
- 18.13.2. Product Type
- 18.13.3. Solution Type
- 18.13.4. Container Type
- 18.13.5. Rated Capacity
- 18.13.6. Flow Rate/Infusion Rate
- 18.13.7. Therapeutic Application
- 18.13.8. Concentration/Osmolarity
- 18.13.9. Distribution Channel
- 18.13.10. Packaging Configuration
- 18.13.11. End-users
- 19. Asia Pacific Intravenous Solutions Market Analysis
- 19.1. Key Segment Analysis
- 19.2. Regional Snapshot
- 19.3. Asia Pacific Intravenous Solutions Market Size Value (US$ Bn), Analysis, and Forecasts, 2021-2035
- 19.3.1. Product Type
- 19.3.2. Solution Type
- 19.3.3. Container Type
- 19.3.4. Rated Capacity
- 19.3.5. Flow Rate/Infusion Rate
- 19.3.6. Therapeutic Application
- 19.3.7. Concentration/Osmolarity
- 19.3.8. Distribution Channel
- 19.3.9. Packaging Configuration
- 19.3.10. End-users
- 19.3.11. Country
- 19.3.11.1. China
- 19.3.11.2. India
- 19.3.11.3. Japan
- 19.3.11.4. South Korea
- 19.3.11.5. Australia and New Zealand
- 19.3.11.6. Indonesia
- 19.3.11.7. Malaysia
- 19.3.11.8. Thailand
- 19.3.11.9. Vietnam
- 19.3.11.10. Rest of Asia Pacific
- 19.4. China Intravenous Solutions Market
- 19.4.1. Country Segmental Analysis
- 19.4.2. Product Type
- 19.4.3. Solution Type
- 19.4.4. Container Type
- 19.4.5. Rated Capacity
- 19.4.6. Flow Rate/Infusion Rate
- 19.4.7. Therapeutic Application
- 19.4.8. Concentration/Osmolarity
- 19.4.9. Distribution Channel
- 19.4.10. Packaging Configuration
- 19.4.11. End-users
- 19.5. India Intravenous Solutions Market
- 19.5.1. Country Segmental Analysis
- 19.5.2. Product Type
- 19.5.3. Solution Type
- 19.5.4. Container Type
- 19.5.5. Rated Capacity
- 19.5.6. Flow Rate/Infusion Rate
- 19.5.7. Therapeutic Application
- 19.5.8. Concentration/Osmolarity
- 19.5.9. Distribution Channel
- 19.5.10. Packaging Configuration
- 19.5.11. End-users
- 19.6. Japan Intravenous Solutions Market
- 19.6.1. Country Segmental Analysis
- 19.6.2. Product Type
- 19.6.3. Solution Type
- 19.6.4. Container Type
- 19.6.5. Rated Capacity
- 19.6.6. Flow Rate/Infusion Rate
- 19.6.7. Therapeutic Application
- 19.6.8. Concentration/Osmolarity
- 19.6.9. Distribution Channel
- 19.6.10. Packaging Configuration
- 19.6.11. End-users
- 19.7. South Korea Intravenous Solutions Market
- 19.7.1. Country Segmental Analysis
- 19.7.2. Product Type
- 19.7.3. Solution Type
- 19.7.4. Container Type
- 19.7.5. Rated Capacity
- 19.7.6. Flow Rate/Infusion Rate
- 19.7.7. Therapeutic Application
- 19.7.8. Concentration/Osmolarity
- 19.7.9. Distribution Channel
- 19.7.10. Packaging Configuration
- 19.7.11. End-users
- 19.8. Australia and New Zealand Intravenous Solutions Market
- 19.8.1. Country Segmental Analysis
- 19.8.2. Product Type
- 19.8.3. Solution Type
- 19.8.4. Container Type
- 19.8.5. Rated Capacity
- 19.8.6. Flow Rate/Infusion Rate
- 19.8.7. Therapeutic Application
- 19.8.8. Concentration/Osmolarity
- 19.8.9. Distribution Channel
- 19.8.10. Packaging Configuration
- 19.8.11. End-users
- 19.9. Indonesia Intravenous Solutions Market
- 19.9.1. Country Segmental Analysis
- 19.9.2. Product Type
- 19.9.3. Solution Type
- 19.9.4. Container Type
- 19.9.5. Rated Capacity
- 19.9.6. Flow Rate/Infusion Rate
- 19.9.7. Therapeutic Application
- 19.9.8. Concentration/Osmolarity
- 19.9.9. Distribution Channel
- 19.9.10. Packaging Configuration
- 19.9.11. End-users
- 19.10. Malaysia Intravenous Solutions Market
- 19.10.1. Country Segmental Analysis
- 19.10.2. Product Type
- 19.10.3. Solution Type
- 19.10.4. Container Type
- 19.10.5. Rated Capacity
- 19.10.6. Flow Rate/Infusion Rate
- 19.10.7. Therapeutic Application
- 19.10.8. Concentration/Osmolarity
- 19.10.9. Distribution Channel
- 19.10.10. Packaging Configuration
- 19.10.11. End-users
- 19.11. Thailand Intravenous Solutions Market
- 19.11.1. Country Segmental Analysis
- 19.11.2. Product Type
- 19.11.3. Solution Type
- 19.11.4. Container Type
- 19.11.5. Rated Capacity
- 19.11.6. Flow Rate/Infusion Rate
- 19.11.7. Therapeutic Application
- 19.11.8. Concentration/Osmolarity
- 19.11.9. Distribution Channel
- 19.11.10. Packaging Configuration
- 19.11.11. End-users
- 19.12. Vietnam Intravenous Solutions Market
- 19.12.1. Country Segmental Analysis
- 19.12.2. Product Type
- 19.12.3. Solution Type
- 19.12.4. Container Type
- 19.12.5. Rated Capacity
- 19.12.6. Flow Rate/Infusion Rate
- 19.12.7. Therapeutic Application
- 19.12.8. Concentration/Osmolarity
- 19.12.9. Distribution Channel
- 19.12.10. Packaging Configuration
- 19.12.11. End-users
- 19.13. Rest of Asia Pacific Intravenous Solutions Market
- 19.13.1. Country Segmental Analysis
- 19.13.2. Product Type
- 19.13.3. Solution Type
- 19.13.4. Container Type
- 19.13.5. Rated Capacity
- 19.13.6. Flow Rate/Infusion Rate
- 19.13.7. Therapeutic Application
- 19.13.8. Concentration/Osmolarity
- 19.13.9. Distribution Channel
- 19.13.10. Packaging Configuration
- 19.13.11. End-users
- 20. Middle East Intravenous Solutions Market Analysis
- 20.1. Key Segment Analysis
- 20.2. Regional Snapshot
- 20.3. Middle East Intravenous Solutions Market Size Value (US$ Bn), Analysis, and Forecasts, 2021-2035
- 20.3.1. Product Type
- 20.3.2. Solution Type
- 20.3.3. Container Type
- 20.3.4. Rated Capacity
- 20.3.5. Flow Rate/Infusion Rate
- 20.3.6. Therapeutic Application
- 20.3.7. Concentration/Osmolarity
- 20.3.8. Distribution Channel
- 20.3.9. Packaging Configuration
- 20.3.10. End-users
- 20.3.11. Country
- 20.3.11.1. Turkey
- 20.3.11.2. UAE
- 20.3.11.3. Saudi Arabia
- 20.3.11.4. Israel
- 20.3.11.5. Rest of Middle East
- 20.4. Turkey Intravenous Solutions Market
- 20.4.1. Country Segmental Analysis
- 20.4.2. Product Type
- 20.4.3. Solution Type
- 20.4.4. Container Type
- 20.4.5. Rated Capacity
- 20.4.6. Flow Rate/Infusion Rate
- 20.4.7. Therapeutic Application
- 20.4.8. Concentration/Osmolarity
- 20.4.9. Distribution Channel
- 20.4.10. Packaging Configuration
- 20.4.11. End-users
- 20.5. UAE Intravenous Solutions Market
- 20.5.1. Country Segmental Analysis
- 20.5.2. Product Type
- 20.5.3. Solution Type
- 20.5.4. Container Type
- 20.5.5. Rated Capacity
- 20.5.6. Flow Rate/Infusion Rate
- 20.5.7. Therapeutic Application
- 20.5.8. Concentration/Osmolarity
- 20.5.9. Distribution Channel
- 20.5.10. Packaging Configuration
- 20.5.11. End-users
- 20.6. Saudi Arabia Intravenous Solutions Market
- 20.6.1. Country Segmental Analysis
- 20.6.2. Product Type
- 20.6.3. Solution Type
- 20.6.4. Container Type
- 20.6.5. Rated Capacity
- 20.6.6. Flow Rate/Infusion Rate
- 20.6.7. Therapeutic Application
- 20.6.8. Concentration/Osmolarity
- 20.6.9. Distribution Channel
- 20.6.10. Packaging Configuration
- 20.6.11. End-users
- 20.7. Israel Intravenous Solutions Market
- 20.7.1. Country Segmental Analysis
- 20.7.2. Product Type
- 20.7.3. Solution Type
- 20.7.4. Container Type
- 20.7.5. Rated Capacity
- 20.7.6. Flow Rate/Infusion Rate
- 20.7.7. Therapeutic Application
- 20.7.8. Concentration/Osmolarity
- 20.7.9. Distribution Channel
- 20.7.10. Packaging Configuration
- 20.7.11. End-users
- 20.8. Rest of Middle East Intravenous Solutions Market
- 20.8.1. Country Segmental Analysis
- 20.8.2. Product Type
- 20.8.3. Solution Type
- 20.8.4. Container Type
- 20.8.5. Rated Capacity
- 20.8.6. Flow Rate/Infusion Rate
- 20.8.7. Therapeutic Application
- 20.8.8. Concentration/Osmolarity
- 20.8.9. Distribution Channel
- 20.8.10. Packaging Configuration
- 20.8.11. End-users
- 21. Africa Intravenous Solutions Market Analysis
- 21.1. Key Segment Analysis
- 21.2. Regional Snapshot
- 21.3. Africa Intravenous Solutions Market Size Value (US$ Bn), Analysis, and Forecasts, 2021-2035
- 21.3.1. Product Type
- 21.3.2. Solution Type
- 21.3.3. Container Type
- 21.3.4. Rated Capacity
- 21.3.5. Flow Rate/Infusion Rate
- 21.3.6. Therapeutic Application
- 21.3.7. Concentration/Osmolarity
- 21.3.8. Distribution Channel
- 21.3.9. Packaging Configuration
- 21.3.10. End-users
- 21.3.11. Country
- 21.3.11.1. South Africa
- 21.3.11.2. Egypt
- 21.3.11.3. Nigeria
- 21.3.11.4. Algeria
- 21.3.11.5. Rest of Africa
- 21.4. South Africa Intravenous Solutions Market
- 21.4.1. Country Segmental Analysis
- 21.4.2. Product Type
- 21.4.3. Solution Type
- 21.4.4. Container Type
- 21.4.5. Rated Capacity
- 21.4.6. Flow Rate/Infusion Rate
- 21.4.7. Therapeutic Application
- 21.4.8. Concentration/Osmolarity
- 21.4.9. Distribution Channel
- 21.4.10. Packaging Configuration
- 21.4.11. End-users
- 21.5. Egypt Intravenous Solutions Market
- 21.5.1. Country Segmental Analysis
- 21.5.2. Product Type
- 21.5.3. Solution Type
- 21.5.4. Container Type
- 21.5.5. Rated Capacity
- 21.5.6. Flow Rate/Infusion Rate
- 21.5.7. Therapeutic Application
- 21.5.8. Concentration/Osmolarity
- 21.5.9. Distribution Channel
- 21.5.10. Packaging Configuration
- 21.5.11. End-users
- 21.6. Nigeria Intravenous Solutions Market
- 21.6.1. Country Segmental Analysis
- 21.6.2. Product Type
- 21.6.3. Solution Type
- 21.6.4. Container Type
- 21.6.5. Rated Capacity
- 21.6.6. Flow Rate/Infusion Rate
- 21.6.7. Therapeutic Application
- 21.6.8. Concentration/Osmolarity
- 21.6.9. Distribution Channel
- 21.6.10. Packaging Configuration
- 21.6.11. End-users
- 21.7. Algeria Intravenous Solutions Market
- 21.7.1. Country Segmental Analysis
- 21.7.2. Product Type
- 21.7.3. Solution Type
- 21.7.4. Container Type
- 21.7.5. Rated Capacity
- 21.7.6. Flow Rate/Infusion Rate
- 21.7.7. Therapeutic Application
- 21.7.8. Concentration/Osmolarity
- 21.7.9. Distribution Channel
- 21.7.10. Packaging Configuration
- 21.7.11. End-users
- 21.8. Rest of Africa Intravenous Solutions Market
- 21.8.1. Country Segmental Analysis
- 21.8.2. Product Type
- 21.8.3. Solution Type
- 21.8.4. Container Type
- 21.8.5. Rated Capacity
- 21.8.6. Flow Rate/Infusion Rate
- 21.8.7. Therapeutic Application
- 21.8.8. Concentration/Osmolarity
- 21.8.9. Distribution Channel
- 21.8.10. Packaging Configuration
- 21.8.11. End-users
- 22. South America Intravenous Solutions Market Analysis
- 22.1. Key Segment Analysis
- 22.2. Regional Snapshot
- 22.3. South America Intravenous Solutions Market Size Value (US$ Bn), Analysis, and Forecasts, 2021-2035
- 22.3.1. Product Type
- 22.3.2. Solution Type
- 22.3.3. Container Type
- 22.3.4. Rated Capacity
- 22.3.5. Flow Rate/Infusion Rate
- 22.3.6. Therapeutic Application
- 22.3.7. Concentration/Osmolarity
- 22.3.8. Distribution Channel
- 22.3.9. Packaging Configuration
- 22.3.10. End-users
- 22.3.11. Country
- 22.3.11.1. Brazil
- 22.3.11.2. Argentina
- 22.3.11.3. Rest of South America
- 22.4. Brazil Intravenous Solutions Market
- 22.4.1. Country Segmental Analysis
- 22.4.2. Product Type
- 22.4.3. Solution Type
- 22.4.4. Container Type
- 22.4.5. Rated Capacity
- 22.4.6. Flow Rate/Infusion Rate
- 22.4.7. Therapeutic Application
- 22.4.8. Concentration/Osmolarity
- 22.4.9. Distribution Channel
- 22.4.10. Packaging Configuration
- 22.4.11. End-users
- 22.5. Argentina Intravenous Solutions Market
- 22.5.1. Country Segmental Analysis
- 22.5.2. Product Type
- 22.5.3. Solution Type
- 22.5.4. Container Type
- 22.5.5. Rated Capacity
- 22.5.6. Flow Rate/Infusion Rate
- 22.5.7. Therapeutic Application
- 22.5.8. Concentration/Osmolarity
- 22.5.9. Distribution Channel
- 22.5.10. Packaging Configuration
- 22.5.11. End-users
- 22.6. Rest of South America Intravenous Solutions Market
- 22.6.1. Country Segmental Analysis
- 22.6.2. Product Type
- 22.6.3. Solution Type
- 22.6.4. Container Type
- 22.6.5. Rated Capacity
- 22.6.6. Flow Rate/Infusion Rate
- 22.6.7. Therapeutic Application
- 22.6.8. Concentration/Osmolarity
- 22.6.9. Distribution Channel
- 22.6.10. Packaging Configuration
- 22.6.11. End-users
- 23. Key Players/ Company Profile
- 23.1. Albert David Limited
- 23.1.1. Company Details/ Overview
- 23.1.2. Company Financials
- 23.1.3. Key Customers and Competitors
- 23.1.4. Business/ Industry Portfolio
- 23.1.5. Product Portfolio/ Specification Details
- 23.1.6. Pricing Data
- 23.1.7. Strategic Overview
- 23.1.8. Recent Developments
- 23.2. B. Braun Melsungen AG
- 23.3. Baxter International Inc.
- 23.4. Claris Lifesciences Limited
- 23.5. Deccan Healthcare Ltd.
- 23.6. Fresenius Kabi AG
- 23.7. Grifols S.A.
- 23.8. Hikma Pharmaceuticals PLC
- 23.9. Huaren Pharmaceuticals
- 23.10. ICU Medical Inc.
- 23.11. JW Life Science
- 23.12. Kelun Pharma
- 23.13. Nang Kuang Pharmaceutical Co., Ltd.
- 23.14. Otsuka Pharmaceutical Co., Ltd.
- 23.15. Pfizer Inc.
- 23.16. Shijiazhuang No. 4 Pharmaceutical Co., Ltd.
- 23.17. Sichuan Kelun Pharmaceutical Co., Ltd.
- 23.18. Terumo Corporation
- 23.19. Teva Pharmaceutical Industries Ltd.
- 23.20. Vetter Pharma International GmbH
- 23.21. Zydus Lifesciences Limited
- 23.22. Other Key Players
- 23.1. Albert David Limited
Note* - This is just tentative list of players. While providing the report, we will cover more number of players based on their revenue and share for each geography
Research Design
Our research design integrates both demand-side and supply-side analysis through a balanced combination of primary and secondary research methodologies. By utilizing both bottom-up and top-down approaches alongside rigorous data triangulation methods, we deliver robust market intelligence that supports strategic decision-making.
MarketGenics' comprehensive research design framework ensures the delivery of accurate, reliable, and actionable market intelligence. Through the integration of multiple research approaches, rigorous validation processes, and expert analysis, we provide our clients with the insights needed to make informed strategic decisions and capitalize on market opportunities.

MarketGenics leverages a dedicated industry panel of experts and a comprehensive suite of paid databases to effectively collect, consolidate, and analyze market intelligence.
Our approach has consistently proven to be reliable and effective in generating accurate market insights, identifying key industry trends, and uncovering emerging business opportunities.
Through both primary and secondary research, we capture and analyze critical company-level data such as manufacturing footprints, including technical centers, R&D facilities, sales offices, and headquarters.
Our expert panel further enhances our ability to estimate market size for specific brands based on validated field-level intelligence.
Our data mining techniques incorporate both parametric and non-parametric methods, allowing for structured data collection, sorting, processing, and cleaning.
Demand projections are derived from large-scale data sets analyzed through proprietary algorithms, culminating in robust and reliable market sizing.
Research Approach
The bottom-up approach builds market estimates by starting with the smallest addressable market units and systematically aggregating them to create comprehensive market size projections.
This method begins with specific, granular data points and builds upward to create the complete market landscape.
Customer Analysis → Segmental Analysis → Geographical Analysis
The top-down approach starts with the broadest possible market data and systematically narrows it down through a series of filters and assumptions to arrive at specific market segments or opportunities.
This method begins with the big picture and works downward to increasingly specific market slices.
TAM → SAM → SOM


Research Methods
Desk / Secondary Research
While analysing the market, we extensively study secondary sources, directories, and databases to identify and collect information useful for this technical, market-oriented, and commercial report. Secondary sources that we utilize are not only the public sources, but it is a combination of Open Source, Associations, Paid Databases, MG Repository & Knowledgebase, and others.
- Company websites, annual reports, financial reports, broker reports, and investor presentations
- National government documents, statistical databases and reports
- News articles, press releases and web-casts specific to the companies operating in the market, Magazines, reports, and others
- We gather information from commercial data sources for deriving company specific data such as segmental revenue, share for geography, product revenue, and others
- Internal and external proprietary databases (industry-specific), relevant patent, and regulatory databases
- Governing Bodies, Government Organizations
- Relevant Authorities, Country-specific Associations for Industries
We also employ the model mapping approach to estimate the product level market data through the players' product portfolio
Primary Research
Primary research/ interviews is vital in analyzing the market. Most of the cases involves paid primary interviews. Primary sources include primary interviews through e-mail interactions, telephonic interviews, surveys as well as face-to-face interviews with the different stakeholders across the value chain including several industry experts.
| Type of Respondents | Number of Primaries |
|---|---|
| Tier 2/3 Suppliers | ~20 |
| Tier 1 Suppliers | ~25 |
| End-users | ~25 |
| Industry Expert/ Panel/ Consultant | ~30 |
| Total | ~100 |
MG Knowledgebase
• Repository of industry blog, newsletter and case studies
• Online platform covering detailed market reports, and company profiles
Forecasting Factors and Models
Forecasting Factors
- Historical Trends – Past market patterns, cycles, and major events that shaped how markets behave over time. Understanding past trends helps predict future behavior.
- Industry Factors – Specific characteristics of the industry like structure, regulations, and innovation cycles that affect market dynamics.
- Macroeconomic Factors – Economic conditions like GDP growth, inflation, and employment rates that affect how much money people have to spend.
- Demographic Factors – Population characteristics like age, income, and location that determine who can buy your product.
- Technology Factors – How quickly people adopt new technology and how much technology infrastructure exists.
- Regulatory Factors – Government rules, laws, and policies that can help or restrict market growth.
- Competitive Factors – Analyzing competition structure such as degree of competition and bargaining power of buyers and suppliers.
Forecasting Models / Techniques
Multiple Regression Analysis
- Identify and quantify factors that drive market changes
- Statistical modeling to establish relationships between market drivers and outcomes
Time Series Analysis – Seasonal Patterns
- Understand regular cyclical patterns in market demand
- Advanced statistical techniques to separate trend, seasonal, and irregular components
Time Series Analysis – Trend Analysis
- Identify underlying market growth patterns and momentum
- Statistical analysis of historical data to project future trends
Expert Opinion – Expert Interviews
- Gather deep industry insights and contextual understanding
- In-depth interviews with key industry stakeholders
Multi-Scenario Development
- Prepare for uncertainty by modeling different possible futures
- Creating optimistic, pessimistic, and most likely scenarios
Time Series Analysis – Moving Averages
- Sophisticated forecasting for complex time series data
- Auto-regressive integrated moving average models with seasonal components
Econometric Models
- Apply economic theory to market forecasting
- Sophisticated economic models that account for market interactions
Expert Opinion – Delphi Method
- Harness collective wisdom of industry experts
- Structured, multi-round expert consultation process
Monte Carlo Simulation
- Quantify uncertainty and probability distributions
- Thousands of simulations with varying input parameters
Research Analysis
Our research framework is built upon the fundamental principle of validating market intelligence from both demand and supply perspectives. This dual-sided approach ensures comprehensive market understanding and reduces the risk of single-source bias.
Demand-Side Analysis: We understand end-user/application behavior, preferences, and market needs along with the penetration of the product for specific application.
Supply-Side Analysis: We estimate overall market revenue, analyze the segmental share along with industry capacity, competitive landscape, and market structure.
Validation & Evaluation
Data triangulation is a validation technique that uses multiple methods, sources, or perspectives to examine the same research question, thereby increasing the credibility and reliability of research findings. In market research, triangulation serves as a quality assurance mechanism that helps identify and minimize bias, validate assumptions, and ensure accuracy in market estimates.
- Data Source Triangulation – Using multiple data sources to examine the same phenomenon
- Methodological Triangulation – Using multiple research methods to study the same research question
- Investigator Triangulation – Using multiple researchers or analysts to examine the same data
- Theoretical Triangulation – Using multiple theoretical perspectives to interpret the same data

Custom Market Research Services
We will customise the research for you, in case the report listed above does not meet your requirements.
Get 10% Free Customisation