Machine Vision Market Size, Share & Trends Analysis Report by Offerings (Hardware, Software, Services), Product Type, Deployment Mode, Technology, Application, End Use Industry and Geography (North America, Europe, Asia Pacific, Middle East, Africa, and South America) – Global Industry Data, Trends, and Forecasts, 2026–2035
|
Market Structure & Evolution |
|
|
Segmental Data Insights |
|
|
Demand Trends |
|
|
Competitive Landscape |
|
|
Strategic Development |
|
|
Future Outlook & Opportunities |
|
Machine Vision Market Size, Share, and Growth
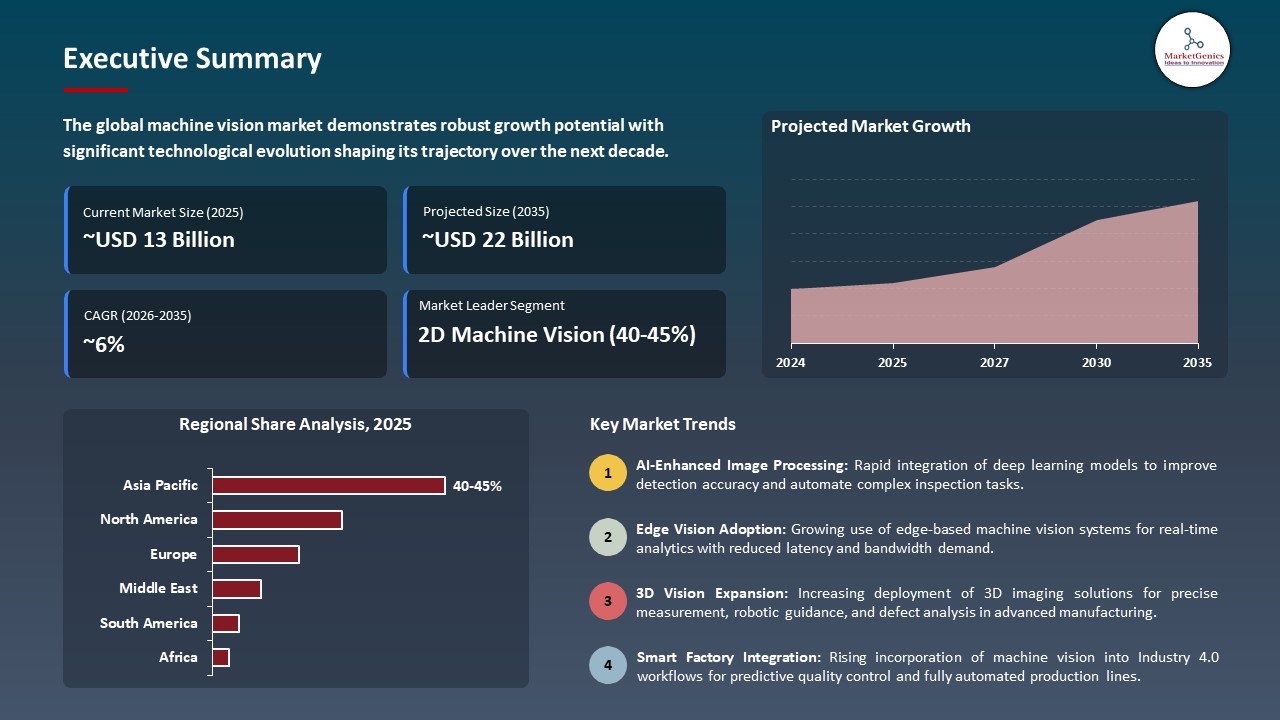
The global machine vision market is experiencing robust growth, with its estimated value of USD 12.6 billion in the year 2025 and USD 21.6 billion by the period 2035, registering a CAGR of 5.6% during the forecast period. The global machine vision market is expanding rapidly all over the world. It's supported by several crucial factors that propel its growth.
AI-driven quality inspection is revolution the manufacturing industry by making defect detection possible in real-time, thus waste is minimized and production efficiency is maximized. Through the collaboration with Trifork, we are guaranteeing that manufacturers will be able to use a checked, scalable, and secure Edge AI solution which is able to interact with their operations in a completely smooth manner without any interruption." - Lenovo (via its AI Innovation Leader).
In the last couple of years, state-of-the-art machine vision systems - using ultra-high-resolution imaging, AI-powered image analysis, and real-time analytics - have become dependable and are broadly employed for automated inspection, defect detection, and quality control of production lines. This feature allows manufacturers to keep consistency, lower waste, and raise throughput.
The increasing industrial automation and the move towards smart factories and "Industry 4.0" practices have doubled the demand for machine vision solutions, in general, in industries like electronics, automotive, food & beverage, and pharmaceuticals. In the case of enterprises that extend automation and robotics-assisted assembly and inspection, they also link vision-based systems at a higher rate for such tasks as alignment, sorting, object recognition, and process monitoring.
Moreover, close-by growth potentials are becoming visible: machine-vision, apart from the usual inspection, can be a source of support for vision-guided robotics, automated sorting/packaging, traceability systems, predictive quality analytics, and real-time production monitoring - thus giving the manufacturers of these technologies a chance to widen their range and the producers to improve their productivity, compliance, and product quality.
 Machine Vision Market Dynamics and Trends
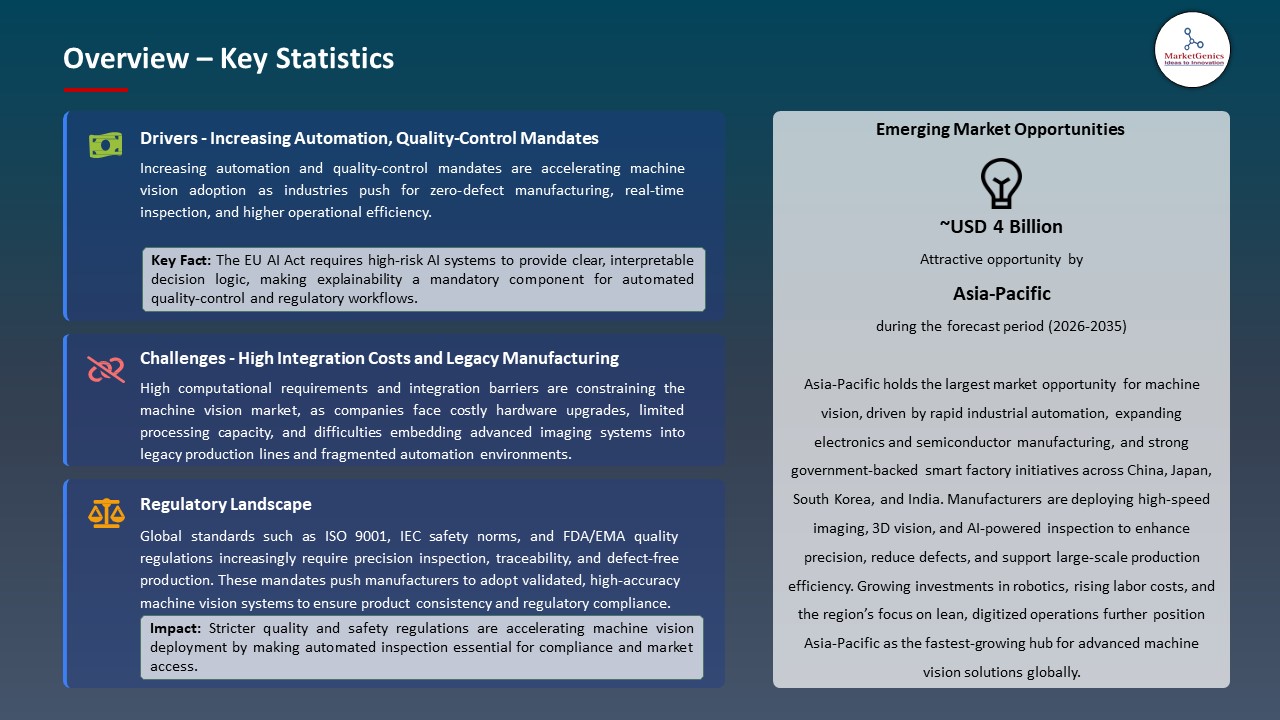
Driver: Increasing Automation, Quality-Control Mandates, and Smart-Factory Adoption Driving Machine-Vision Market Growth
-
The machine-vision market in the next few years, is expected to expand rapidly. A major reason for this is the worldwide tendency of industries to become automated and adopt Industry 4.0. The most notable industries that are affecting this change are electronics, automotive, pharmaceuticals, and food & beverage. To comply with quality, safety, and traceability standards, manufacturers have to use AI-enabled inspection, defect detection, and measurement systems, which is their most preferred method.
- One of the main factors that have led to the quick installation of machine-vision-based compliance and inspection systems is the imposition of strict regulations on product consistency, labeling accuracy, packaging integrity, and production auditability in such sectors as pharmaceuticals (GMP), food processing (HACCP), and electronics manufacturing.
- The growing use of robots and production lines that work without human intervention is creating the need for machine vision to be connected. This is because robot systems that use vision for guidance, automated pick-and-place, and in-line metrology are at the core of achieving higher throughput, lower defects, and real-time production monitoring in smart factories.
Restraint: High Integration Costs and Legacy Manufacturing Infrastructure Limiting Widespread Deployment
-
While there is increased automation, it is still common to find many manufacturers operating with outdated machines and without having digitized their workflows. Hence, the process of installing machine vision systems in these old settings is not just a matter of retrofitting; it also involves calibration and the usage of special software that needs to be in harmony with the hardware, thereby, it slows down the pace of adoption at a broad level.
- The implementation of machine vision, in particular, AI-based inspection, requires a significant investment in cameras, lighting, computing hardware, training datasets, and integration engineering. These initial expenses are the main reason why the adoption of this technology is limited to small and medium-sized enterprises (SMEs) that are operating in cost-sensitive markets.
- The running and upkeep of complex inspection systems call for the availability of trained technicians and data specialists. The lack of a global pool of machine vision engineers, imaging experts, and AI technicians is a problem that the scaling of deployments is confronted with, albeit to a lesser extent in developed regions, but mostly in the remote areas.
Opportunity: Expansion Across Non-Traditional Sectors and Evolution Toward Vision-as-a-Service
-
Machine-vision adoption is changing face and is no more just limited to traditional manufacturing. It is enhancing efficiency in many new verticals such as agriculture (crop and produce grading), logistics (automated parcel inspection and sorting), retail (packaging verification), and healthcare (diagnostic imaging workflows). These fresh use-cases are opening up a huge horizon of growth for the future.
- Moreover, there are no more entry barriers for SMEs due to the arrival of cloud-enabled, edge-based, and modular “vision-as-a-service” platforms. Vendors are progressively delivering scalable AI-vision solutions which do not require a large initial capital investment, thus opening up opportunities in price-sensitive regions in Asia, Africa, and Latin America.
- Since, governments in different regions implement digital manufacturing roadmaps, Industry 4.0 incentives, and smart-factory grants, machine-vision solution providers, imaging hardware manufacturers, and AI-software developers will be the ones to reap the benefits of increased procurement and modernization initiatives.
Key Trend: Integration of AI, Edge Vision, and Robotics Transforming Machine-Vision Capabilities
-
Next-gen machine vision systems are increasingly driven by deep-learning models, real-time image processing, and edge computing. Such systems allow quicker defect detection, enhanced anomaly recognition, and the handing over of decisions to a machine, i.e., automation with a very low time lag - which is very important for production lines running at a high-speed.
- The merging of machine vision with robotics, digital twins, and industrial IoT ecosystems is having a great impact on how factories function. Vision systems, thus, become the main instruments for autonomous process corrections, predictive quality analytics, and incessant production optimization.
- The rise of uniform machine-vision frameworks and interoperability protocols is tending to make the integration of different hardware and software less of a problem for companies. This trend basically enables the scalable deployment of a multi-vendor environment for production and, thus, speeds up the adoption of manufacturing hubs worldwide.
Machine Vision Market Analysis and Segmental Data
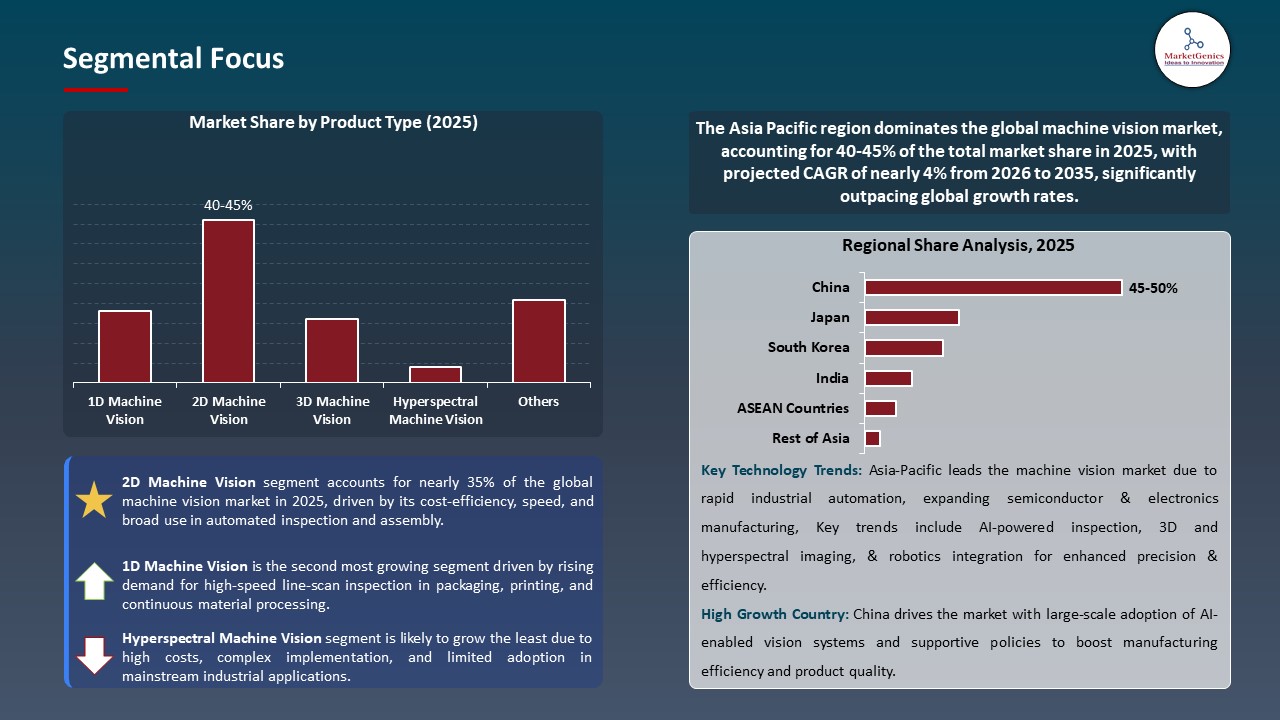
“2D Machine Vision Dominates Global Machine Vision Market amid Rising Demand for High-Speed Inspection and Cost-Efficient Quality Control"
-
The 2D machine-vision segment is at the forefront of the global machine-vision market, which is the facility for visual inspection of manufacturing has experienced a rising demand for speedy inspection and cheap quality control in various industries such as electronics, automotive, food & beverage, and packaging.
- 2D vision systems complemented by mature imaging technology, easy installation, and relatively low price can be the reasons why these systems are chosen for nonstop, contactless inspection that delivers surface defect detection, measurements, and assembly verification in a very fast way without provoking the problem of the more expensive 3D systems. Hence these machines are the ones that provide the solution for the requirement of mass production with a high output rate and minimal number of defective goods.
- This kind of capability (2D vision) is especially important in high-volume manufacturing environments where the parameters of speed, repeatability and cost per unit inspection are more significant than a complex depth or shape analysis. So, thanks to 2D vision, checking, sorting and quality-assurance processes can be done at a large scale.
- In view of these benefits, 2D machine vision is still the fundamental global inspection and quality-control automation system, which relies on a very large number of 2D machine-vision modules and support software to be accessible to a broad range of manufacturers, i.e., from large-scale automotive plants to small/medium-sized electronics and consumer-goods lines, while the more advanced vision technologies are still being developed.
“Asia Pacific Dominates Machine Vision Market amid Rapid Industrial Automation and Manufacturing Expansion”
-
Asia Pacific is the top region in machine vision market worldwide, which is mainly due to the fast industrial automation and the spread of manufacturing in such countries as China, Japan, South Korea, and India. The region is a major production center for electronics, automotive, semiconductor, and food & beverage industries, where large-scale production demands efficient, reliable, and cost-effective inspection systems.Industry 4.0, robotics, and smart factories are widely adopted and thus the machine-vision deployment is getting more and more accelerated.
- The foremost examples of technological advancement in the region are the use of 2D machine vision systems for surface defect detection in automotive assembly lines in China, semiconductor wafer inspection in Taiwan, and quality control in electronics manufacturing in Japan, which is a proof of the region being a leader in technology-driven high-speed, automated inspection.
- Moreover, the manufacturers are progressively turning to the integration of machine vision with AI-based analytics, robotics, and IoT sensors for the improvement of defect detection in real-time, production throughput optimization, and quality standards like ISO and GMP compliance monitoring. These implementations demonstrate the region’s potential for large-scale, automated, and regulation-compliant machine-vision deployment.
Machine-Vision-Market Ecosystem
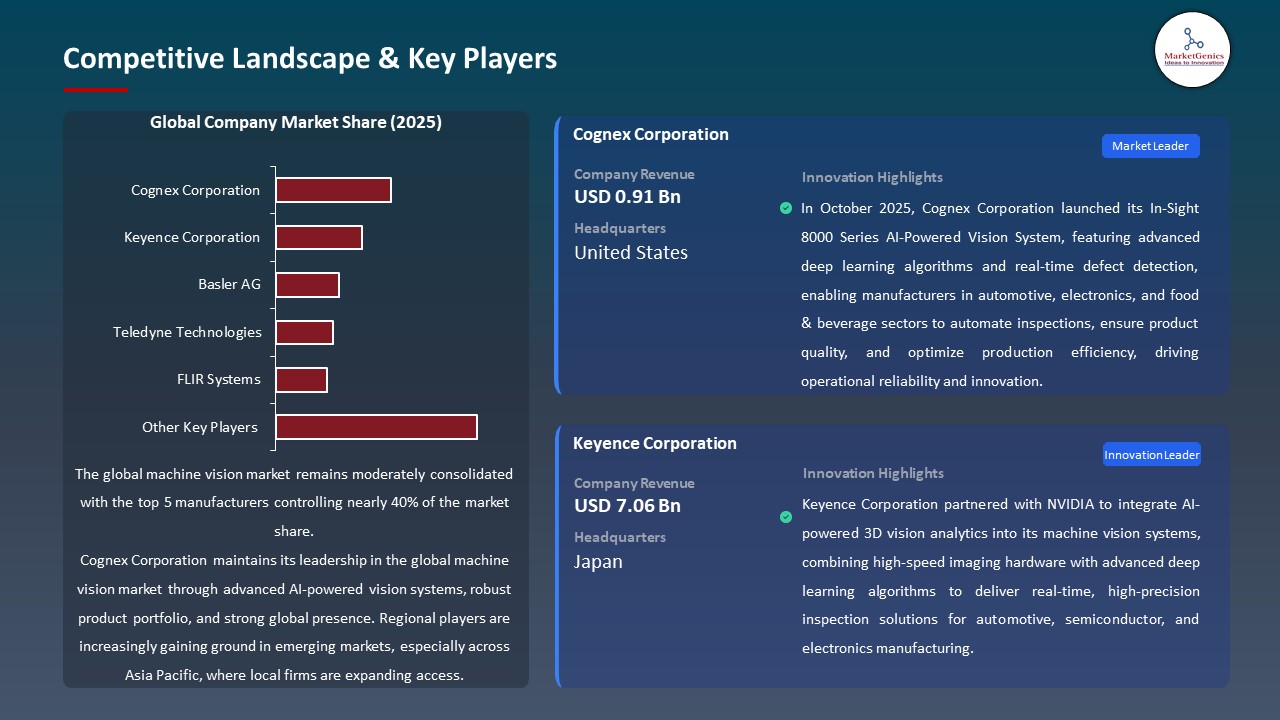
The worldwide machine vision market is moderately consolidated and dominated by a few large players such as Cognex Corporation, Keyence Corporation, Basler AG, Teledyne Technologies, Omron Corporation, and Sony Corporation that maintain their leadership positions by deploying advanced imaging, AI, and sensor technologies. These companies use state-of-the-art machine vision systems to deliver extremely precise inspection, automation, and quality-control solutions to various industries.
Mainly, the leading players put more and more emphasis on specialized technologies and niche solutions to be able to drive innovation further. As an example, Basler AG provides high-speed industrial cameras perfectly suited for semiconductor inspection, whereas Cognex manufactures AI-powered vision software for defect detection and assembly verification that, in turn, leads to operational accuracy.
Besides that, government entities, research centers, and R&D departments are also major contributors to technology progression. For instance, in March 2025, the Japanese National Institute of Advanced Industrial Science and Technology (AIST) created a deep-learning-based vision inspection framework which resulted in a detection accuracy increase of automotive components by more than 15%.
The effort of companies to stress on product diversification, portfolio expansion, and integrated solutions is to elevate productivity and sustainability. For example, in July 2025, Keyence launched an IoT-enabled vision system with AI analytics that led to an increase of line inspection efficiency in electronics manufacturing by 20%.
Recent Development and Strategic Overview:
-
In May 2025, Cognex Corporation unveiled its new AI-powered In-Sight D900 vision system for semiconductor and electronics inspection. With the integration of deep-learning algorithms and high-speed imaging, the system detects defects in real-time. Manufacturers can use this technology to increase yield rates and lower the number of manual inspections, thus enabling them to maintain quality control that is automated, scalable, and free from interruptions in complex production lines.
- In September 2025, Keyence Corporation launched its XG-X series IoT-enabled vision sensors for automotive assembly lines. The product features edge AI analytics combined with 3D imaging capabilities. With this implementation, it becomes possible to continuously monitor the alignment of parts and detect surface defects without a production stop, thus increasing operational efficiency and providing actionable insights that can be used to reduce waste and improve assembly accuracy.
Report Scope
|
Attribute |
Detail |
|
Market Size in 2025 |
USD 12.6 Bn |
|
Market Forecast Value in 2035 |
USD 21.6 Bn |
|
Growth Rate (CAGR) |
5.6% |
|
Forecast Period |
2026 – 2035 |
|
Historical Data Available for |
2021 – 2024 |
|
Market Size Units |
USD Bn for Value Thousand Units for Volume |
|
Report Format |
Electronic (PDF) + Excel |
|
Regions and Countries Covered |
|||||
|
North America |
Europe |
Asia Pacific |
Middle East |
Africa |
South America |
|
|
|
|
|
|
|
Companies Covered |
|||||
|
|
|
|
|
|
Machine-Vision-Market Segmentation and Highlights
|
Segment |
Sub-segment |
|
Machine Vision Market, By Offerings |
|
|
Machine Vision Market, By Product Type |
|
|
Machine Vision Market, By Deployment Mode |
|
|
Machine Vision Market, By Technology |
|
|
Machine Vision Market, By Application |
|
|
Machine Vision Market, By End Use Industry |
|
Frequently Asked Questions
Table of Contents
- 1. Research Methodology and Assumptions
- 1.1. Definitions
- 1.2. Research Design and Approach
- 1.3. Data Collection Methods
- 1.4. Base Estimates and Calculations
- 1.5. Forecasting Models
- 1.5.1. Key Forecast Factors & Impact Analysis
- 1.6. Secondary Research
- 1.6.1. Open Sources
- 1.6.2. Paid Databases
- 1.6.3. Associations
- 1.7. Primary Research
- 1.7.1. Primary Sources
- 1.7.2. Primary Interviews with Stakeholders across Ecosystem
- 2. Executive Summary
- 2.1. Global Machine Vision Market Outlook
- 2.1.1. Machine Vision Market Size (Value - US$ Bn and Volume - Thousand Units), and Forecasts, 2021-2035
- 2.1.2. Compounded Annual Growth Rate Analysis
- 2.1.3. Growth Opportunity Analysis
- 2.1.4. Segmental Share Analysis
- 2.1.5. Geographical Share Analysis
- 2.2. Market Analysis and Facts
- 2.3. Supply-Demand Analysis
- 2.4. Competitive Benchmarking
- 2.5. Go-to- Market Strategy
- 2.5.1. Customer/ End-use Industry Assessment
- 2.5.2. Growth Opportunity Data, 2026-2035
- 2.5.2.1. Regional Data
- 2.5.2.2. Country Data
- 2.5.2.3. Segmental Data
- 2.5.3. Identification of Potential Market Spaces
- 2.5.4. GAP Analysis
- 2.5.5. Potential Attractive Price Points
- 2.5.6. Prevailing Market Risks & Challenges
- 2.5.7. Preferred Sales & Marketing Strategies
- 2.5.8. Key Recommendations and Analysis
- 2.5.9. A Way Forward
- 2.1. Global Machine Vision Market Outlook
- 3. Industry Data and Premium Insights
- 3.1. Global Automation & Process Control Ecosystem Overview, 2025
- 3.1.1. Automation & Process Control Ecosystem Analysis
- 3.1.2. Key Trends for Automation & Process Control Industry
- 3.1.3. Regional Distribution for Automation & Process Control Industry
- 3.2. Supplier Customer Data
- 3.3. Technology Roadmap and Developments
- 3.4. Trade Analysis
- 3.4.1. Import & Export Analysis, 2025
- 3.4.2. Top Importing Countries
- 3.4.3. Top Exporting Countries
- 3.5. Trump Tariff Impact Analysis
- 3.5.1. Manufacturer
- 3.5.1.1. Based on the component & Raw material
- 3.5.2. Supply Chain
- 3.5.3. End Consumer
- 3.5.1. Manufacturer
- 3.6. Raw Material Analysis
- 3.1. Global Automation & Process Control Ecosystem Overview, 2025
- 4. Market Overview
- 4.1. Market Dynamics
- 4.1.1. Drivers
- 4.1.1.1. Rising demand for automated quality inspection and defect detection in manufacturing.
- 4.1.1.2. Growing adoption of AI-, deep learning-, and camera-based vision systems across automotive, electronics, and food & beverage industries.
- 4.1.1.3. Increasing investment in 3D imaging, hyperspectral vision, and cloud-enabled analytics platforms.
- 4.1.2. Restraints
- 4.1.2.1. High costs for advanced vision systems and software integration.
- 4.1.2.2. Challenges in adapting machine vision to diverse production lines and complex product geometries.
- 4.1.1. Drivers
- 4.2. Key Trend Analysis
- 4.3. Regulatory Framework
- 4.3.1. Key Regulations, Norms, and Subsidies, by Key Countries
- 4.3.2. Tariffs and Standards
- 4.3.3. Impact Analysis of Regulations on the Market
- 4.4. Value Chain Analysis
- 4.4.1. Hardware/ Component Suppliers
- 4.4.2. System Integrators/ Technology Providers
- 4.4.3. Machine Vision System Manufacturers
- 4.4.4. Distributors
- 4.4.5. End Users
- 4.5. Cost Structure Analysis
- 4.5.1. Parameter’s Share for Cost Associated
- 4.5.2. COGP vs COGS
- 4.5.3. Profit Margin Analysis
- 4.6. Pricing Analysis
- 4.6.1. Regional Pricing Analysis
- 4.6.2. Segmental Pricing Trends
- 4.6.3. Factors Influencing Pricing
- 4.7. Porter’s Five Forces Analysis
- 4.8. PESTEL Analysis
- 4.9. Global Machine Vision Market Demand
- 4.9.1. Historical Market Size –Value (US$ Bn) and Volume – (Thousand Units), 2020-2024
- 4.9.2. Current and Future Market Size –Value (US$ Bn) and Volume – (Thousand Units), 2026–2035
- 4.9.2.1. Y-o-Y Growth Trends
- 4.9.2.2. Absolute $ Opportunity Assessment
- 4.1. Market Dynamics
- 5. Competition Landscape
- 5.1. Competition structure
- 5.1.1. Fragmented v/s consolidated
- 5.2. Company Share Analysis, 2025
- 5.2.1. Global Company Market Share
- 5.2.2. By Region
- 5.2.2.1. North America
- 5.2.2.2. Europe
- 5.2.2.3. Asia Pacific
- 5.2.2.4. Middle East
- 5.2.2.5. Africa
- 5.2.2.6. South America
- 5.3. Product Comparison Matrix
- 5.3.1. Specifications
- 5.3.2. Market Positioning
- 5.3.3. Pricing
- 5.1. Competition structure
- 6. Global Machine Vision Market Analysis, by Offerings
- 6.1. Key Segment Analysis
- 6.2. Machine Vision Market Size (Value - US$ Bn and Volume - Thousand Units), Analysis, and Forecasts, by Offerings, 2021-2035
- 6.2.1. Hardware
- 6.2.1.1. Cameras
- 6.2.1.1.1. Area Scan Cameras
- 6.2.1.1.2. Line Scan Cameras
- 6.2.1.1.3. 3D Cameras
- 6.2.1.1.4. Thermal Cameras
- 6.2.1.1.5. CMOS Cameras
- 6.2.1.1.6. CCD Cameras
- 6.2.1.1.7. Others
- 6.2.1.2. Optics & Lenses
- 6.2.1.2.1. Fixed Focal Lenses
- 6.2.1.2.2. Zoom Lenses
- 6.2.1.2.3. Telecentric Lenses
- 6.2.1.2.4. Wide-Angle Lenses
- 6.2.1.2.5. Others
- 6.2.1.3. Frame Grabbers
- 6.2.1.3.1. Analog Frame Grabbers
- 6.2.1.3.2. Digital Frame Grabbers
- 6.2.1.3.3. CoaXPress, Camera Link, GigE Frame Grabbers
- 6.2.1.3.4. Others
- 6.2.1.4. Illumination
- 6.2.1.4.1. LED Lighting
- 6.2.1.4.2. Ring Lights
- 6.2.1.4.3. Bar Lights
- 6.2.1.4.4. Backlights
- 6.2.1.4.5. Structured Lighting
- 6.2.1.4.6. Others
- 6.2.1.5. Processors
- 6.2.1.5.1. Digital Signal Processors (DSPs)
- 6.2.1.5.2. FPGA-Based Processors
- 6.2.1.5.3. Embedded Processors
- 6.2.1.5.4. GPUs
- 6.2.1.5.5. Others
- 6.2.1.6. Vision Sensors
- 6.2.1.6.1. Presence Detection Sensors
- 6.2.1.6.2. Inspection Sensors
- 6.2.1.6.3. Others
- 6.2.1.7. Vision Systems
- 6.2.1.7.1. Smart Camera Systems
- 6.2.1.7.2. PC-Based Vision Systems
- 6.2.1.7.3. Multi-Camera Vision Platforms
- 6.2.1.7.4. Others
- 6.2.1.8. Others
- 6.2.1.1. Cameras
- 6.2.2. Software
- 6.2.2.1. Machine Vision Software
- 6.2.2.1.1. Image Processing Software
- 6.2.2.1.2. Deep Learning Vision Software
- 6.2.2.1.3. AI-Based Pattern Recognition Software
- 6.2.2.1.4. OCR/OCV Software
- 6.2.2.1.5. Defect Detection Software
- 6.2.2.1.6. Others
- 6.2.2.2. System Integration Software
- 6.2.2.2.1. Calibration Tools
- 6.2.2.2.2. Communication Interfaces
- 6.2.2.2.3. Data Management Software
- 6.2.2.2.4. Others
- 6.2.2.3. Vision Development Tools
- 6.2.2.3.1. SDKs
- 6.2.2.3.2. Graphical Programming Tools
- 6.2.2.3.3. Algorithm Libraries
- 6.2.2.3.4. Others
- 6.2.2.4. Others
- 6.2.2.1. Machine Vision Software
- 6.2.3. Services
- 6.2.3.1. Installation & Integration Services
- 6.2.3.2. Maintenance & Support Services
- 6.2.3.3. Vision System Consulting
- 6.2.3.4. Upgradation Services
- 6.2.3.5. Training & Technical Support
- 6.2.3.6. Custom Vision Algorithm Development
- 6.2.3.7. Others
- 6.2.1. Hardware
- 7. Global Machine Vision Market Analysis, by Product Type
- 7.1. Key Segment Analysis
- 7.2. Machine Vision Market Size (Value - US$ Bn and Volume - Thousand Units), Analysis, and Forecasts, by Product Type, 2021-2035
- 7.2.1. 1D Machine Vision
- 7.2.2. 2D Machine Vision
- 7.2.3. 3D Machine Vision
- 7.2.4. Hyperspectral Machine Vision
- 7.2.5. Others
- 8. Global Machine Vision Market Analysis, by Deployment Mode
- 8.1. Key Segment Analysis
- 8.2. Machine Vision Market Size (Value - US$ Bn and Volume - Thousand Units), Analysis, and Forecasts, by Deployment Mode, 2021-2035
- 8.2.1. On-premise
- 8.2.2. Cloud-based
- 8.2.3. Hybrids
- 9. Global Machine Vision Market Analysis, by Technology
- 9.1. Key Segment Analysis
- 9.2. Machine Vision Market Size (Value - US$ Bn and Volume - Thousand Units), Analysis, and Forecasts, by Technology, 2021-2035
- 9.2.1. Imaging Technology
- 9.2.2. Deep Learning Vision
- 9.2.3. AI-Based Vision
- 9.2.4. Traditional Machine Vision
- 9.2.5. Laser-Based Vision
- 9.2.6. Thermal Vision
- 9.2.7. Others
- 10. Global Machine Vision Market Analysis, by Application
- 10.1. Key Segment Analysis
- 10.2. Machine Vision Market Size (Value - US$ Bn and Volume - Thousand Units), Analysis, and Forecasts, by Application, 2021-2035
- 10.2.1. Inspection
- 10.2.2. Measurement
- 10.2.3. Positioning
- 10.2.4. Identification
- 10.2.5. Sorting
- 10.2.6. Assembly Verification
- 10.2.7. Pattern Recognition
- 10.2.8. Object Detection
- 10.2.9. Defect Detection
- 10.2.10. Optical Character Recognition
- 10.2.11. Others
- 11. Global Machine Vision Market Analysis, by End Use Industry
- 11.1. Key Segment Analysis
- 11.2. Machine Vision Market Size (Value - US$ Bn and Volume - Thousand Units), Analysis, and Forecasts, by End Use Industry, 2021-2035
- 11.2.1. Automotive
- 11.2.2. Electronics & Semiconductor
- 11.2.3. Food & Beverage
- 11.2.4. Pharmaceuticals
- 11.2.5. Packaging
- 11.2.6. Metals & Machinery
- 11.2.7. Logistics & Warehousing
- 11.2.8. Aerospace & Defense
- 11.2.9. Plastics & Rubber
- 11.2.10. Printing & Labeling
- 11.2.11. Others
- 12. Global Machine Vision Market Analysis and Forecasts, by Region
- 12.1. Key Findings
- 12.2. Machine Vision Market Size (Value - US$ Bn and Volume - Thousand Units), Analysis, and Forecasts, by Region, 2021-2035
- 12.2.1. North America
- 12.2.2. Europe
- 12.2.3. Asia Pacific
- 12.2.4. Middle East
- 12.2.5. Africa
- 12.2.6. South America
- 13. North America Machine Vision Market Analysis
- 13.1. Key Segment Analysis
- 13.2. Regional Snapshot
- 13.3. North America Machine Vision Market Size Value - US$ Bn and Volume - Thousand Units), Analysis, and Forecasts, 2021-2035
- 13.3.1. Offerings
- 13.3.2. Product Type
- 13.3.3. Deployment Mode
- 13.3.4. Technology
- 13.3.5. Application
- 13.3.6. End Use Industry
- 13.3.7. Country
- 13.3.7.1. USA
- 13.3.7.2. Canada
- 13.3.7.3. Mexico
- 13.4. USA Machine Vision Market
- 13.4.1. Country Segmental Analysis
- 13.4.2. Offerings
- 13.4.3. Product Type
- 13.4.4. Deployment Mode
- 13.4.5. Technology
- 13.4.6. Application
- 13.4.7. End Use Industry
- 13.5. Canada Machine Vision Market
- 13.5.1. Country Segmental Analysis
- 13.5.2. Offerings
- 13.5.3. Product Type
- 13.5.4. Deployment Mode
- 13.5.5. Technology
- 13.5.6. Application
- 13.5.7. End Use Industry
- 13.6. Mexico Machine Vision Market
- 13.6.1. Country Segmental Analysis
- 13.6.2. Offerings
- 13.6.3. Product Type
- 13.6.4. Deployment Mode
- 13.6.5. Technology
- 13.6.6. Application
- 13.6.7. End Use Industry
- 14. Europe Machine Vision Market Analysis
- 14.1. Key Segment Analysis
- 14.2. Regional Snapshot
- 14.3. Europe Machine Vision Market Size (Value - US$ Bn and Volume - Thousand Units), Analysis, and Forecasts, 2021-2035
- 14.3.1. Offerings
- 14.3.2. Product Type
- 14.3.3. Deployment Mode
- 14.3.4. Technology
- 14.3.5. Application
- 14.3.6. End Use Industry
- 14.3.7. Country
- 14.3.7.1. Germany
- 14.3.7.2. United Kingdom
- 14.3.7.3. France
- 14.3.7.4. Italy
- 14.3.7.5. Spain
- 14.3.7.6. Netherlands
- 14.3.7.7. Nordic Countries
- 14.3.7.8. Poland
- 14.3.7.9. Russia & CIS
- 14.3.7.10. Rest of Europe
- 14.4. Germany Machine Vision Market
- 14.4.1. Country Segmental Analysis
- 14.4.2. Offerings
- 14.4.3. Product Type
- 14.4.4. Deployment Mode
- 14.4.5. Technology
- 14.4.6. Application
- 14.4.7. End Use Industry
- 14.5. United Kingdom Machine Vision Market
- 14.5.1. Country Segmental Analysis
- 14.5.2. Offerings
- 14.5.3. Product Type
- 14.5.4. Deployment Mode
- 14.5.5. Technology
- 14.5.6. Application
- 14.5.7. End Use Industry
- 14.6. France Machine Vision Market
- 14.6.1. Country Segmental Analysis
- 14.6.2. Offerings
- 14.6.3. Product Type
- 14.6.4. Deployment Mode
- 14.6.5. Technology
- 14.6.6. Application
- 14.6.7. End Use Industry
- 14.7. Italy Machine Vision Market
- 14.7.1. Country Segmental Analysis
- 14.7.2. Offerings
- 14.7.3. Product Type
- 14.7.4. Deployment Mode
- 14.7.5. Technology
- 14.7.6. Application
- 14.7.7. End Use Industry
- 14.8. Spain Machine Vision Market
- 14.8.1. Country Segmental Analysis
- 14.8.2. Offerings
- 14.8.3. Product Type
- 14.8.4. Deployment Mode
- 14.8.5. Technology
- 14.8.6. Application
- 14.8.7. End Use Industry
- 14.9. Netherlands Machine Vision Market
- 14.9.1. Country Segmental Analysis
- 14.9.2. Offerings
- 14.9.3. Product Type
- 14.9.4. Deployment Mode
- 14.9.5. Technology
- 14.9.6. Application
- 14.9.7. End Use Industry
- 14.10. Nordic Countries Machine Vision Market
- 14.10.1. Country Segmental Analysis
- 14.10.2. Offerings
- 14.10.3. Product Type
- 14.10.4. Deployment Mode
- 14.10.5. Technology
- 14.10.6. Application
- 14.10.7. End Use Industry
- 14.11. Poland Machine Vision Market
- 14.11.1. Country Segmental Analysis
- 14.11.2. Offerings
- 14.11.3. Product Type
- 14.11.4. Deployment Mode
- 14.11.5. Technology
- 14.11.6. Application
- 14.11.7. End Use Industry
- 14.12. Russia & CIS Machine Vision Market
- 14.12.1. Country Segmental Analysis
- 14.12.2. Offerings
- 14.12.3. Product Type
- 14.12.4. Deployment Mode
- 14.12.5. Technology
- 14.12.6. Application
- 14.12.7. End Use Industry
- 14.13. Rest of Europe Machine Vision Market
- 14.13.1. Country Segmental Analysis
- 14.13.2. Offerings
- 14.13.3. Product Type
- 14.13.4. Deployment Mode
- 14.13.5. Technology
- 14.13.6. Application
- 14.13.7. End Use Industry
- 15. Asia Pacific Machine Vision Market Analysis
- 15.1. Key Segment Analysis
- 15.2. Regional Snapshot
- 15.3. Asia Pacific Machine Vision Market Size (Value - US$ Bn and Volume - Thousand Units), Analysis, and Forecasts, 2021-2035
- 15.3.1. Offerings
- 15.3.2. Product Type
- 15.3.3. Deployment Mode
- 15.3.4. Technology
- 15.3.5. Application
- 15.3.6. End Use Industry
- 15.3.7. Country
- 15.3.7.1. China
- 15.3.7.2. India
- 15.3.7.3. Japan
- 15.3.7.4. South Korea
- 15.3.7.5. Australia and New Zealand
- 15.3.7.6. Indonesia
- 15.3.7.7. Malaysia
- 15.3.7.8. Thailand
- 15.3.7.9. Vietnam
- 15.3.7.10. Rest of Asia Pacific
- 15.4. China Machine Vision Market
- 15.4.1. Country Segmental Analysis
- 15.4.2. Offerings
- 15.4.3. Product Type
- 15.4.4. Deployment Mode
- 15.4.5. Technology
- 15.4.6. Application
- 15.4.7. End Use Industry
- 15.5. India Machine Vision Market
- 15.5.1. Country Segmental Analysis
- 15.5.2. Offerings
- 15.5.3. Product Type
- 15.5.4. Deployment Mode
- 15.5.5. Technology
- 15.5.6. Application
- 15.5.7. End Use Industry
- 15.6. Japan Machine Vision Market
- 15.6.1. Country Segmental Analysis
- 15.6.2. Offerings
- 15.6.3. Product Type
- 15.6.4. Deployment Mode
- 15.6.5. Technology
- 15.6.6. Application
- 15.6.7. End Use Industry
- 15.7. South Korea Machine Vision Market
- 15.7.1. Country Segmental Analysis
- 15.7.2. Offerings
- 15.7.3. Product Type
- 15.7.4. Deployment Mode
- 15.7.5. Technology
- 15.7.6. Application
- 15.7.7. End Use Industry
- 15.8. Australia and New Zealand Machine Vision Market
- 15.8.1. Country Segmental Analysis
- 15.8.2. Offerings
- 15.8.3. Product Type
- 15.8.4. Deployment Mode
- 15.8.5. Technology
- 15.8.6. Application
- 15.8.7. End Use Industry
- 15.9. Indonesia Machine Vision Market
- 15.9.1. Country Segmental Analysis
- 15.9.2. Offerings
- 15.9.3. Product Type
- 15.9.4. Deployment Mode
- 15.9.5. Technology
- 15.9.6. Application
- 15.9.7. End Use Industry
- 15.10. Malaysia Machine Vision Market
- 15.10.1. Country Segmental Analysis
- 15.10.2. Offerings
- 15.10.3. Product Type
- 15.10.4. Deployment Mode
- 15.10.5. Technology
- 15.10.6. Application
- 15.10.7. End Use Industry
- 15.11. Thailand Machine Vision Market
- 15.11.1. Country Segmental Analysis
- 15.11.2. Offerings
- 15.11.3. Product Type
- 15.11.4. Deployment Mode
- 15.11.5. Technology
- 15.11.6. Application
- 15.11.7. End Use Industry
- 15.12. Vietnam Machine Vision Market
- 15.12.1. Country Segmental Analysis
- 15.12.2. Offerings
- 15.12.3. Product Type
- 15.12.4. Deployment Mode
- 15.12.5. Technology
- 15.12.6. Application
- 15.12.7. End Use Industry
- 15.13. Rest of Asia Pacific Machine Vision Market
- 15.13.1. Country Segmental Analysis
- 15.13.2. Offerings
- 15.13.3. Product Type
- 15.13.4. Deployment Mode
- 15.13.5. Technology
- 15.13.6. Application
- 15.13.7. End Use Industry
- 16. Middle East Machine Vision Market Analysis
- 16.1. Key Segment Analysis
- 16.2. Regional Snapshot
- 16.3. Middle East Machine Vision Market Size (Value - US$ Bn and Volume - Thousand Units), Analysis, and Forecasts, 2021-2035
- 16.3.1. Offerings
- 16.3.2. Product Type
- 16.3.3. Deployment Mode
- 16.3.4. Technology
- 16.3.5. Application
- 16.3.6. End Use Industry
- 16.3.7. Country
- 16.3.7.1. Turkey
- 16.3.7.2. UAE
- 16.3.7.3. Saudi Arabia
- 16.3.7.4. Israel
- 16.3.7.5. Rest of Middle East
- 16.4. Turkey Machine Vision Market
- 16.4.1. Country Segmental Analysis
- 16.4.2. Offerings
- 16.4.3. Product Type
- 16.4.4. Deployment Mode
- 16.4.5. Technology
- 16.4.6. Application
- 16.4.7. End Use Industry
- 16.5. UAE Machine Vision Market
- 16.5.1. Country Segmental Analysis
- 16.5.2. Offerings
- 16.5.3. Product Type
- 16.5.4. Deployment Mode
- 16.5.5. Technology
- 16.5.6. Application
- 16.5.7. End Use Industry
- 16.6. Saudi Arabia Machine Vision Market
- 16.6.1. Country Segmental Analysis
- 16.6.2. Offerings
- 16.6.3. Product Type
- 16.6.4. Deployment Mode
- 16.6.5. Technology
- 16.6.6. Application
- 16.6.7. End Use Industry
- 16.7. Israel Machine Vision Market
- 16.7.1. Country Segmental Analysis
- 16.7.2. Offerings
- 16.7.3. Product Type
- 16.7.4. Deployment Mode
- 16.7.5. Technology
- 16.7.6. Application
- 16.7.7. End Use Industry
- 16.8. Rest of Middle East Machine Vision Market
- 16.8.1. Country Segmental Analysis
- 16.8.2. Offerings
- 16.8.3. Product Type
- 16.8.4. Deployment Mode
- 16.8.5. Technology
- 16.8.6. Application
- 16.8.7. End Use Industry
- 17. Africa Machine Vision Market Analysis
- 17.1. Key Segment Analysis
- 17.2. Regional Snapshot
- 17.3. Africa Machine Vision Market Size (Value - US$ Bn and Volume - Thousand Units), Analysis, and Forecasts, 2021-2035
- 17.3.1. Offerings
- 17.3.2. Product Type
- 17.3.3. Deployment Mode
- 17.3.4. Technology
- 17.3.5. Application
- 17.3.6. End Use Industry
- 17.3.7. Country
- 17.3.7.1. South Africa
- 17.3.7.2. Egypt
- 17.3.7.3. Nigeria
- 17.3.7.4. Algeria
- 17.3.7.5. Rest of Africa
- 17.4. South Africa Machine Vision Market
- 17.4.1. Country Segmental Analysis
- 17.4.2. Offerings
- 17.4.3. Product Type
- 17.4.4. Deployment Mode
- 17.4.5. Technology
- 17.4.6. Application
- 17.4.7. End Use Industry
- 17.5. Egypt Machine Vision Market
- 17.5.1. Country Segmental Analysis
- 17.5.2. Offerings
- 17.5.3. Product Type
- 17.5.4. Deployment Mode
- 17.5.5. Technology
- 17.5.6. Application
- 17.5.7. End Use Industry
- 17.6. Nigeria Machine Vision Market
- 17.6.1. Country Segmental Analysis
- 17.6.2. Offerings
- 17.6.3. Product Type
- 17.6.4. Deployment Mode
- 17.6.5. Technology
- 17.6.6. Application
- 17.6.7. End Use Industry
- 17.7. Algeria Machine Vision Market
- 17.7.1. Country Segmental Analysis
- 17.7.2. Offerings
- 17.7.3. Product Type
- 17.7.4. Deployment Mode
- 17.7.5. Technology
- 17.7.6. Application
- 17.7.7. End Use Industry
- 17.8. Rest of Africa Machine Vision Market
- 17.8.1. Country Segmental Analysis
- 17.8.2. Offerings
- 17.8.3. Product Type
- 17.8.4. Deployment Mode
- 17.8.5. Technology
- 17.8.6. Application
- 17.8.7. End Use Industry
- 18. South America Machine Vision Market Analysis
- 18.1. Key Segment Analysis
- 18.2. Regional Snapshot
- 18.3. South America Machine Vision Market Size (Value - US$ Bn and Volume - Thousand Units), Analysis, and Forecasts, 2021-2035
- 18.3.1. Offerings
- 18.3.2. Product Type
- 18.3.3. Deployment Mode
- 18.3.4. Technology
- 18.3.5. Application
- 18.3.6. End Use Industry
- 18.3.7. Country
- 18.3.7.1. Brazil
- 18.3.7.2. Argentina
- 18.3.7.3. Rest of South America
- 18.4. Brazil Machine Vision Market
- 18.4.1. Country Segmental Analysis
- 18.4.2. Offerings
- 18.4.3. Product Type
- 18.4.4. Deployment Mode
- 18.4.5. Technology
- 18.4.6. Application
- 18.4.7. End Use Industry
- 18.5. Argentina Machine Vision Market
- 18.5.1. Country Segmental Analysis
- 18.5.2. Offerings
- 18.5.3. Product Type
- 18.5.4. Deployment Mode
- 18.5.5. Technology
- 18.5.6. Application
- 18.5.7. End Use Industry
- 18.6. Rest of South America Machine Vision Market
- 18.6.1. Country Segmental Analysis
- 18.6.2. Offerings
- 18.6.3. Product Type
- 18.6.4. Deployment Mode
- 18.6.5. Technology
- 18.6.6. Application
- 18.6.7. End Use Industry
- 19. Key Players/ Company Profile
- 19.1. ABB Ltd.
- 19.1.1. Company Details/ Overview
- 19.1.2. Company Financials
- 19.1.3. Key Customers and Competitors
- 19.1.4. Business/ Industry Portfolio
- 19.1.5. Product Portfolio/ Specification Details
- 19.1.6. Pricing Data
- 19.1.7. Strategic Overview
- 19.1.8. Recent Developments
- 19.2. ADSYS Vision Systems
- 19.3. Allied Vision Technologies
- 19.4. Basler AG
- 19.5. Baumer Group
- 19.6. Canon Inc.
- 19.7. Cognex Corporation
- 19.8. Datalogic S.p.A.
- 19.9. FLIR Systems
- 19.10. IDS Imaging Development Systems
- 19.11. Intel RealSense
- 19.12. Keyence Corporation
- 19.13. National Instruments
- 19.14. Omron Corporation
- 19.15. Panasonic Industrial Devices
- 19.16. Sick AG
- 19.17. Sony Corporation
- 19.18. Teledyne Technologies
- 19.19. TKH Group
- 19.20. Zebra Technologies
- 19.21. Other Key Players
- 19.1. ABB Ltd.
Note* - This is just tentative list of players. While providing the report, we will cover more number of players based on their revenue and share for each geography
Research Design
Our research design integrates both demand-side and supply-side analysis through a balanced combination of primary and secondary research methodologies. By utilizing both bottom-up and top-down approaches alongside rigorous data triangulation methods, we deliver robust market intelligence that supports strategic decision-making.
MarketGenics' comprehensive research design framework ensures the delivery of accurate, reliable, and actionable market intelligence. Through the integration of multiple research approaches, rigorous validation processes, and expert analysis, we provide our clients with the insights needed to make informed strategic decisions and capitalize on market opportunities.

MarketGenics leverages a dedicated industry panel of experts and a comprehensive suite of paid databases to effectively collect, consolidate, and analyze market intelligence.
Our approach has consistently proven to be reliable and effective in generating accurate market insights, identifying key industry trends, and uncovering emerging business opportunities.
Through both primary and secondary research, we capture and analyze critical company-level data such as manufacturing footprints, including technical centers, R&D facilities, sales offices, and headquarters.
Our expert panel further enhances our ability to estimate market size for specific brands based on validated field-level intelligence.
Our data mining techniques incorporate both parametric and non-parametric methods, allowing for structured data collection, sorting, processing, and cleaning.
Demand projections are derived from large-scale data sets analyzed through proprietary algorithms, culminating in robust and reliable market sizing.
Research Approach
The bottom-up approach builds market estimates by starting with the smallest addressable market units and systematically aggregating them to create comprehensive market size projections.
This method begins with specific, granular data points and builds upward to create the complete market landscape.
Customer Analysis → Segmental Analysis → Geographical Analysis
The top-down approach starts with the broadest possible market data and systematically narrows it down through a series of filters and assumptions to arrive at specific market segments or opportunities.
This method begins with the big picture and works downward to increasingly specific market slices.
TAM → SAM → SOM


Research Methods
Desk / Secondary Research
While analysing the market, we extensively study secondary sources, directories, and databases to identify and collect information useful for this technical, market-oriented, and commercial report. Secondary sources that we utilize are not only the public sources, but it is a combination of Open Source, Associations, Paid Databases, MG Repository & Knowledgebase, and others.
- Company websites, annual reports, financial reports, broker reports, and investor presentations
- National government documents, statistical databases and reports
- News articles, press releases and web-casts specific to the companies operating in the market, Magazines, reports, and others
- We gather information from commercial data sources for deriving company specific data such as segmental revenue, share for geography, product revenue, and others
- Internal and external proprietary databases (industry-specific), relevant patent, and regulatory databases
- Governing Bodies, Government Organizations
- Relevant Authorities, Country-specific Associations for Industries
We also employ the model mapping approach to estimate the product level market data through the players' product portfolio
Primary Research
Primary research/ interviews is vital in analyzing the market. Most of the cases involves paid primary interviews. Primary sources include primary interviews through e-mail interactions, telephonic interviews, surveys as well as face-to-face interviews with the different stakeholders across the value chain including several industry experts.
| Type of Respondents | Number of Primaries |
|---|---|
| Tier 2/3 Suppliers | ~20 |
| Tier 1 Suppliers | ~25 |
| End-users | ~25 |
| Industry Expert/ Panel/ Consultant | ~30 |
| Total | ~100 |
MG Knowledgebase
• Repository of industry blog, newsletter and case studies
• Online platform covering detailed market reports, and company profiles
Forecasting Factors and Models
Forecasting Factors
- Historical Trends – Past market patterns, cycles, and major events that shaped how markets behave over time. Understanding past trends helps predict future behavior.
- Industry Factors – Specific characteristics of the industry like structure, regulations, and innovation cycles that affect market dynamics.
- Macroeconomic Factors – Economic conditions like GDP growth, inflation, and employment rates that affect how much money people have to spend.
- Demographic Factors – Population characteristics like age, income, and location that determine who can buy your product.
- Technology Factors – How quickly people adopt new technology and how much technology infrastructure exists.
- Regulatory Factors – Government rules, laws, and policies that can help or restrict market growth.
- Competitive Factors – Analyzing competition structure such as degree of competition and bargaining power of buyers and suppliers.
Forecasting Models / Techniques
Multiple Regression Analysis
- Identify and quantify factors that drive market changes
- Statistical modeling to establish relationships between market drivers and outcomes
Time Series Analysis – Seasonal Patterns
- Understand regular cyclical patterns in market demand
- Advanced statistical techniques to separate trend, seasonal, and irregular components
Time Series Analysis – Trend Analysis
- Identify underlying market growth patterns and momentum
- Statistical analysis of historical data to project future trends
Expert Opinion – Expert Interviews
- Gather deep industry insights and contextual understanding
- In-depth interviews with key industry stakeholders
Multi-Scenario Development
- Prepare for uncertainty by modeling different possible futures
- Creating optimistic, pessimistic, and most likely scenarios
Time Series Analysis – Moving Averages
- Sophisticated forecasting for complex time series data
- Auto-regressive integrated moving average models with seasonal components
Econometric Models
- Apply economic theory to market forecasting
- Sophisticated economic models that account for market interactions
Expert Opinion – Delphi Method
- Harness collective wisdom of industry experts
- Structured, multi-round expert consultation process
Monte Carlo Simulation
- Quantify uncertainty and probability distributions
- Thousands of simulations with varying input parameters
Research Analysis
Our research framework is built upon the fundamental principle of validating market intelligence from both demand and supply perspectives. This dual-sided approach ensures comprehensive market understanding and reduces the risk of single-source bias.
Demand-Side Analysis: We understand end-user/application behavior, preferences, and market needs along with the penetration of the product for specific application.
Supply-Side Analysis: We estimate overall market revenue, analyze the segmental share along with industry capacity, competitive landscape, and market structure.
Validation & Evaluation
Data triangulation is a validation technique that uses multiple methods, sources, or perspectives to examine the same research question, thereby increasing the credibility and reliability of research findings. In market research, triangulation serves as a quality assurance mechanism that helps identify and minimize bias, validate assumptions, and ensure accuracy in market estimates.
- Data Source Triangulation – Using multiple data sources to examine the same phenomenon
- Methodological Triangulation – Using multiple research methods to study the same research question
- Investigator Triangulation – Using multiple researchers or analysts to examine the same data
- Theoretical Triangulation – Using multiple theoretical perspectives to interpret the same data

Custom Market Research Services
We will customise the research for you, in case the report listed above does not meet your requirements.
Get 10% Free Customisation