Medical Billing Market Size, Share & Trends Analysis Report by Component (Software, Services), Billing Type, Deployment Mode, Mode of Service Delivery, Mode of Service Delivery, Payer, Billing Format, Pricing Model, Service Provider, End User and Geography (North America, Europe, Asia Pacific, Middle East, Africa, and South America) – Global Industry Data, Trends, and Forecasts, 2026–2035
|
Market Structure & Evolution |
|
|
Segmental Data Insights |
|
|
Demand Trends |
|
|
Competitive Landscape |
|
|
Strategic Development |
|
|
Future Outlook & Opportunities |
|
Medical-Billing-Market Size, Share, and Growth
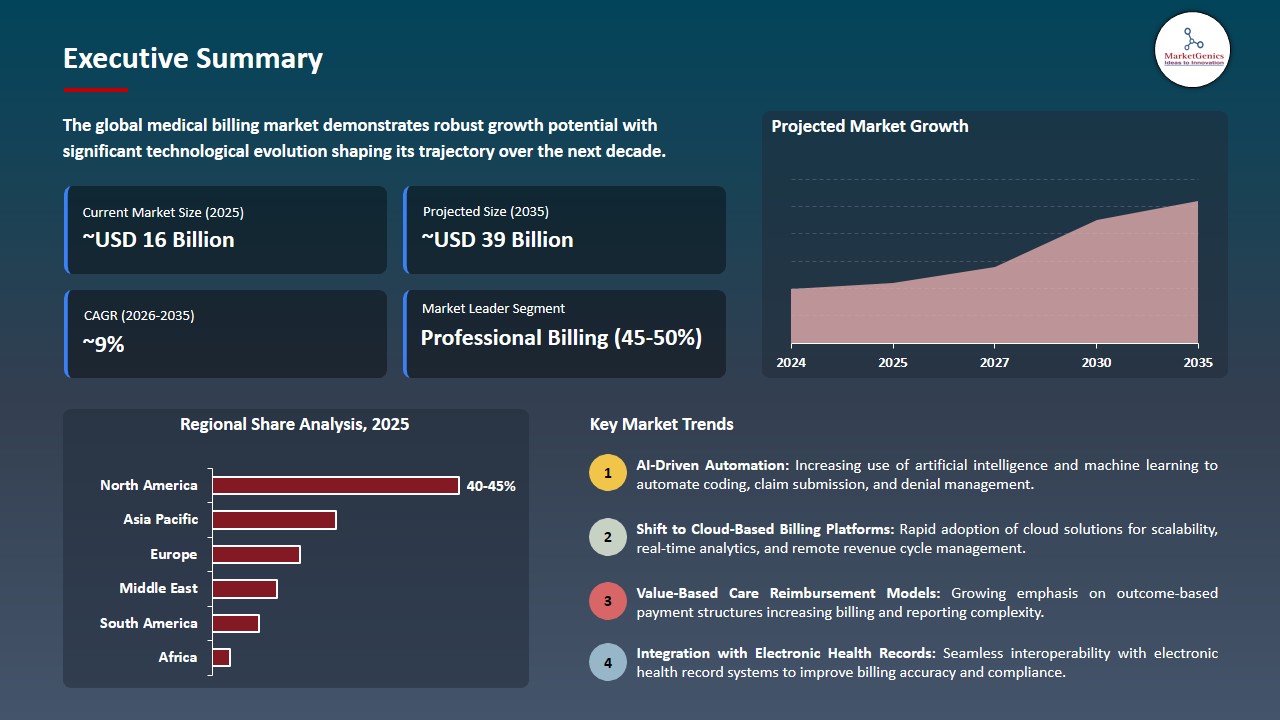
The global medical billing market is experiencing robust growth, with its estimated value of USD 16.1 billion in the year 2025 and USD 38.8 billion by 2035, registering a CAGR of 9.2% during the forecast period. Numerous factors such as continued improvements in technology for automated billing and revenue cycle management (RCM) are driving global medical billing market expansion through enhancing accuracy and efficiency.
In June 2025, a firm naming Cedar, which is focused on AI powered billing automation, along with Twilio, launched an intelligent voice agent called Kora Voice AI. Kora is a voice AI assistant trained on healthcare billing data. It's designed to handle patient payment inquiries, thus helping the patients to get the information they need right from their first contact. Also, Kora Voice AI lowers the workload of the call center staff, which leads to increased revenue cycle productivity and better patient engagement.
While healthcare costs continue to rise, patient volumes increase, and insurance claims become increasingly more complex, there is an increasing demand for advanced billing solutions. One recent example is the launch of Commure’s AI-enabled support for automated claims processing, prior authorization, and denial management for third-party claims using EHR integration, enabling healthcare providers to decrease errors and accelerate their reimbursement timelines.
Furthermore, from the primary segments comprising medical billings, providers of medical billing services also have opportunities within adjacent market segments including patient payment platforms, coding and auditing services, insurance verification services, and RCM analytics. By capitalizing on these adjacent markets, vendors may create synergies with their primary business and achieve operational efficiencies, improved performance in RCM, and broadened market reach to healthcare organizations.
Medical Billing Market Dynamics and Trends
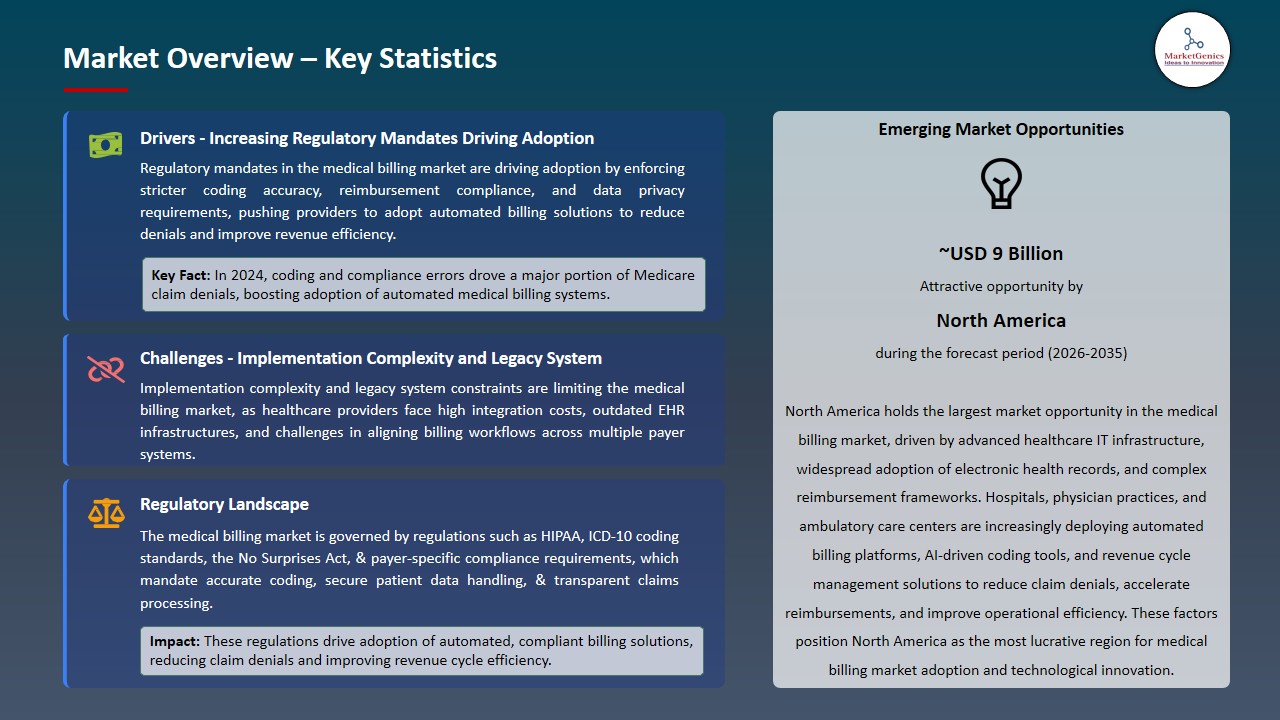
Driver: Increasing Regulatory Mandates Driving Adoption of Advanced Medical Billing Solutions
-
The medical billing market growth worldwide is largely because of the shift in the healthcare system due to the evolving regulations that affect the global economy. The No Surprises Act (2022) and Europe's General Data Protection Regulation requires proper billing, handling of private patient information, and reporting on claims accurately to insurers; and consequently, providers are forced to implement state-of-the-art automated solutions for billing.
- The implementation of secure, standardized and fully automated revenue cycle management platforms will be required by Hospitals and Clinics under the HIPAA and ONC Interoperability Regulations in North America. In July 2025, Cedar, introduced the use of AI-Powered claims and payment verification tools, indicating a trend towards fully automated compliant and patient-focused billing processes.
- With continued growth in telehealth, digital health platforms and patient self-service capabilities, the need for error-free billing solutions will continue to escalate the growth of the medical billing market.
Restraint: Implementation Complexity and Legacy System Constraints Limiting Widespread Adoption
-
Healthcare providers continue to experience significant challenges in their efforts to connect advanced medical billing applications with legacy EHRs and older IT infrastructures despite regulatory encouragement. Because, healthcare providers are experiencing both interoperability issues as well as friction points between these systems.
- The deployment of AI-driven medical billing platforms requires investments in application programming interfaces (APIs), secure cloud infrastructure, and staff training with an increased urgency for small to mid-size hospitals and clinics in developing countries.
- A July 2025 healthcare worker survey indicated that about 20% of healthcare workers in the United States still spend more than 20 hours each month correcting billing errors due to the difficulties faced by AI-driven medical billing platforms in establishing seamless integrations with current legacy EHR and billing applications. This results in continued manual intervention and inefficiencies in workflows.
- The balancing act of delivering the highest possible levels of accuracy, compliance, and operational cost constraints while providing an experience that meets or exceeds patient expectations has become a significant barrier to global adoption. All these elements are expected to restrict the expansion of the medical billing market.
Opportunity: Expansion in Emerging Regions and Government-Supported Healthcare Digitization Programs
-
Emerging economies across Asia, Africa, and Latin America increasingly digitizing their healthcare operations, resulting in growing demand for automated billing platforms and revenue cycle management platforms. For instance, India’s Ayushman Bharat Digital Mission (2025) is enabling hospitals in India to implement interoperable cloud billing systems.
- Global technology vendors such as Cedar, Commure and Olive AI are collaborating with hospitals and health systems to implement artificial intelligence-based billing automation, resulting in improved efficiency of the revenue cycle.
- Programs that support hospital implementation of automated billing and revenue cycle management create opportunities for vendors selling cloud-based revenue cycle management, denial management and patient financial engagement tools to expand their reach into new markets and scale their operations. And thus, is expected to create more opportunities in future for medical billing market.
Key Trend: Integration of AI, Predictive Analytics, and Patient-Centric Billing Platforms
-
The newest technologies for processing medical bills utilize artificial intelligence (AI), machine learning (ML), and predictive analytics to automate the claims process, identify mistakes, and increase the amount of reimbursement received by providers.
- Using these technologies, modern medical billing solutions can also provide real-time eligibility checks for patients and help patients submit their bills, while also identifying possible problems that may cause the provider's claim to be denied. For instance, in August 2025, Commure introduced its AI-enabled virtual assistants for billers. These interactions between the virtual assistants and billers resulted in a 30% reduction in the time needed to process claims and a significant increase in the accuracy of the first claim submitted by a provider.
- As such, it can be observed that the medical billing industry has begun to shift away from traditional revenue cycle management methods to more intelligent, automated, and patient-focused solutions. All these elements are expected to influence significant trends in the medical billing market.
Medical Billing Market Analysis and Segmental Data
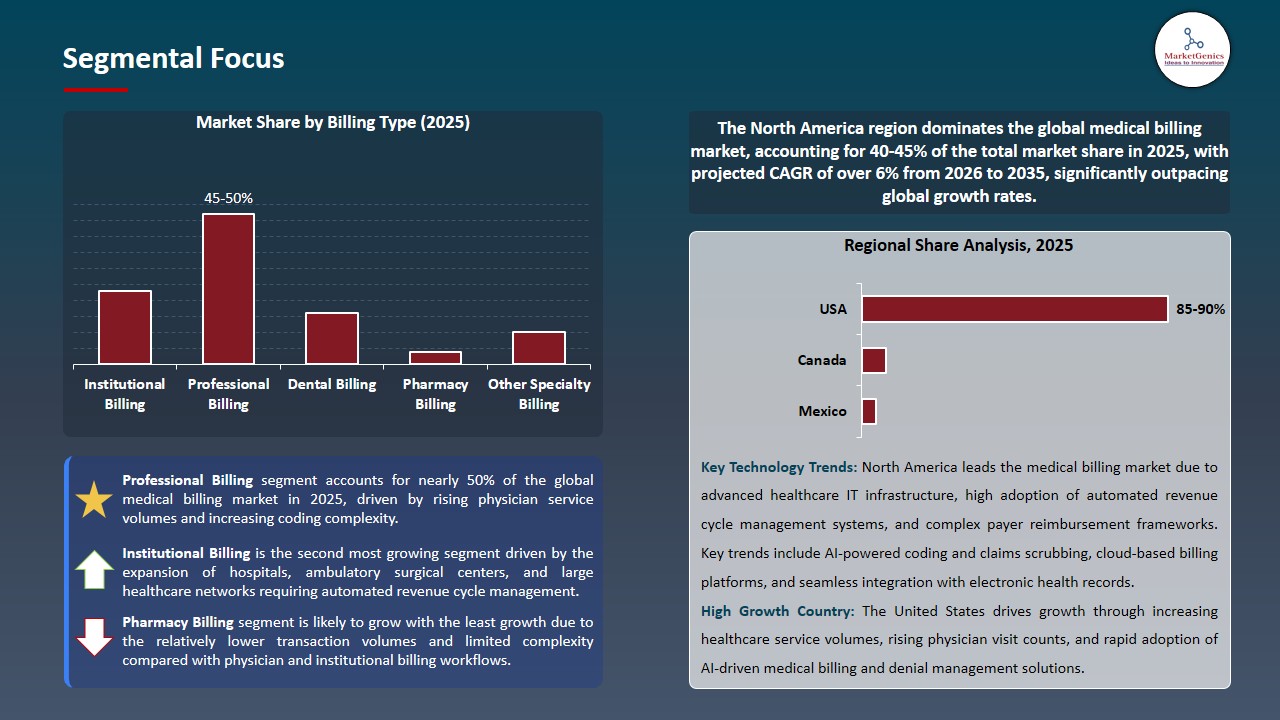
“Professional Billing Segment Dominates Global Medical Billing Market amid Rising Physician Service Volumes and Coding Complexity”
-
The professional billing sector comprises the largest share of the global medical billing market, driven by increases in the number of physicians' services, growing complexities of medical coding, and strict reimbursement requirements across all healthcare systems. Professional billing processes include billing for physicians' consultations, procedures and outpatient services; accurate coding (CPT & HCPCS) and adherence to payer regulations is essential to obtain maximum reimbursement and minimize denials.
- The increasing prevalence of chronic diseases and the increasing interest in preventive care have led to more outpatient visits, which increases the need for specialized knowledge in billing for physician services. Additionally, with the implementation of AI-enabled coding tools and automation of claims scrubbing solutions, there have been increases in both billing accuracy and speed of turnaround.
- A recent example for advanced professional billing solutions is ZirMed. In 2025, they will be rolling out Advanced AI-Assisted Coding and Compliance tools that will enhance the accuracy of provider group coding by more than 25%, which demonstrates how the increasingly complex environment of repeatedly increasing on demand billing services is propelling professional billing to the forefront in the medical billing market.
“North America Dominates the Medical Billing Market amid Advanced Healthcare IT Adoption and Complex Reimbursement Frameworks”
-
The medical billing market is dominated by North America due to many factors, such as its advanced healthcare IT Infrastructure, widespread adoption of automated revenue cycle management systems, and along with the overall complexity of reimbursement model which requires accurate and compliant billing processes in order for healthcare provider to be reimbursed properly.
- The United States has a very high volume of private and government payer interactions, very stringent requirements for coding bills, and frequent regulatory changes which force healthcare providers to seek advanced solutions to reduce denials and speed-up reimbursement on submitted claims. An increase in Electronic Medical Records (EMRs) and growth of cloud-based billing solutions enable healthcare provider’s ability to seamlessly integrate clinical workflows and administrative workflows.
- A great example of this is R1 RCM’s upcoming AI based claims management suite that has allowed for better first-pass claim acceptance rates for several U.S. healthcare providers because of streamlining payer rules and automated edits. Thus, illustrating how a well-developed infrastructure and pioneering digitization are continuing to elevate North America’s leadership in the medical billing market.
Medical Billing Market Ecosystem
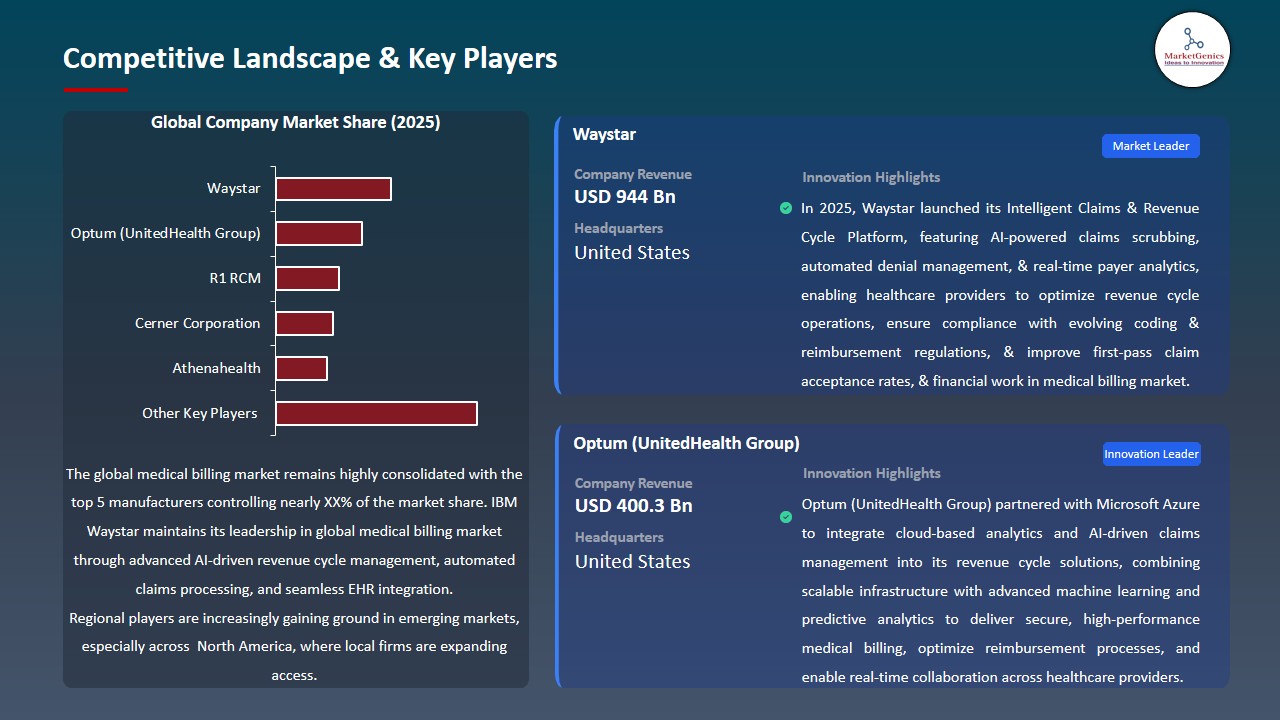
The medical billing market is very consolidated, with a few large corporations like Optum (UnitedHealth Group), R1 RCM, Change Healthcare, Athenahealth, McKesson Corporation, and Epic Systems Corporation providing the majority of services through automated revenue cycle management software platforms that utilize data analytics-based billing solutions to create a stronger relationship with patients.
To support continued growth, government agencies and organizations are actively investing in, and modernizing, regulations through the utilization of digital health technology. By October 2024, the U.S. department of health and human services will have put in place new regulatory frameworks for CY-2025, which will emphasize electronic medical billing processing; also improving interoperability between electronic medical billing systems and providing for the use of automated prior authorization; therefore, creating greater opportunities for providers to embrace intelligent billing technology.
For instance, Waystar launched a new suite of "Intelligent Claims Management Solutions" powered by Artificial Intelligence (AI) to assist Providers with improving the speed of claims acceptance on the first pass (57%) and the turnaround time for payment (40%), demonstrating the industry's emphasis on leveraging data driven efficiency and scalability.
Recent Development and Strategic Overview:
-
In July 2025, Optum (UnitedHealth Group) added new features to its AI-enhanced Revenue Cycle Management (RCM) and medical billing systems. These features include Predictive Analytics and Automated Claims Validation. These features will allow them to reduce the number of Coding errors they experience, improve the rate at which First Pass Claims are accepted, (by payers), and also, enhance the ways in which they comply with changing Payer Reimbursement Guidelines.
- In September 2025, R1 RCM added new features to their cloud-based medical billing and revenue cycle management systems. R1 RCM introduced new Denial Prevention Tools that utilize Advanced Machine Learning algorithms to empower their providers to identify reimbursement risks (denied claims due to incorrect coding) earlier in their bill collection workflows. This new approach allows for increased claim accuracy and reduced administrative burden.
Report Scope
|
Attribute |
Detail |
|
Market Size in 2025 |
USD 16.1 Bn |
|
Market Forecast Value in 2035 |
USD 38.8 Bn |
|
Growth Rate (CAGR) |
9.2% |
|
Forecast Period |
2026 – 2035 |
|
Historical Data Available for |
2021 – 2024 |
|
Market Size Units |
USD Bn for Value |
|
Report Format |
Electronic (PDF) + Excel |
|
Regions and Countries Covered |
|||||
|
North America |
Europe |
Asia Pacific |
Middle East |
Africa |
South America |
|
|
|
|
|
|
|
Companies Covered |
|||||
|
|
|
|
|
|
Medical Billing Market Segmentation and Highlights
|
Segment |
Sub-segment |
|
Medical Billing Market, By Component |
|
|
Medical Billing Market, By Billing Type |
|
|
Medical Billing Market, By Deployment Mode |
|
|
Medical Billing Market, By Mode of Service Delivery |
|
|
Medical Billing Market, By Payer |
|
|
Medical Billing Market, By Billing Format |
|
|
Medical Billing Market, By Pricing Model |
|
|
Medical Billing Market, By Service Provider |
|
|
Medical Billing Market, By End User |
|
Frequently Asked Questions
Table of Contents
- 1. Research Methodology and Assumptions
- 1.1. Definitions
- 1.2. Research Design and Approach
- 1.3. Data Collection Methods
- 1.4. Base Estimates and Calculations
- 1.5. Forecasting Models
- 1.5.1. Key Forecast Factors & Impact Analysis
- 1.6. Secondary Research
- 1.6.1. Open Sources
- 1.6.2. Paid Databases
- 1.6.3. Associations
- 1.7. Primary Research
- 1.7.1. Primary Sources
- 1.7.2. Primary Interviews with Stakeholders across Ecosystem
- 2. Executive Summary
- 2.1. Global Medical Billing Market Outlook
- 2.1.1. Medical Billing Market Size (Value - US$ Bn), and Forecasts, 2021-2035
- 2.1.2. Compounded Annual Growth Rate Analysis
- 2.1.3. Growth Opportunity Analysis
- 2.1.4. Segmental Share Analysis
- 2.1.5. Geographical Share Analysis
- 2.2. Market Analysis and Facts
- 2.3. Supply-Demand Analysis
- 2.4. Competitive Benchmarking
- 2.5. Go-to- Market Strategy
- 2.5.1. Customer/ End-use Industry Assessment
- 2.5.2. Growth Opportunity Data, 2026-2035
- 2.5.2.1. Regional Data
- 2.5.2.2. Country Data
- 2.5.2.3. Segmental Data
- 2.5.3. Identification of Potential Market Spaces
- 2.5.4. GAP Analysis
- 2.5.5. Potential Attractive Price Points
- 2.5.6. Prevailing Market Risks & Challenges
- 2.5.7. Preferred Sales & Marketing Strategies
- 2.5.8. Key Recommendations and Analysis
- 2.5.9. A Way Forward
- 2.1. Global Medical Billing Market Outlook
- 3. Industry Data and Premium Insights
- 3.1. Global Healthcare & Pharmaceutical Industry Overview, 2025
- 3.1.1. Healthcare & Pharmaceutical Industry Analysis
- 3.1.2. Key Trends for Healthcare & Pharmaceutical Industry
- 3.1.3. Regional Distribution for Healthcare & Pharmaceutical Industry
- 3.2. Supplier Customer Data
- 3.3. Technology Roadmap and Developments
- 3.1. Global Healthcare & Pharmaceutical Industry Overview, 2025
- 4. Market Overview
- 4.1. Market Dynamics
- 4.1.1. Drivers
- 4.1.1.1. Adoption of EHRs and AI-enabled billing solutions is improving claim accuracy and revenue cycle efficiency.
- 4.1.1.2. Rising patient volumes and complex reimbursement requirements are increasing demand for automated billing systems.
- 4.1.1.3. Regulatory mandates like ICD-10 and HIPAA are driving investment in advanced medical billing platforms.
- 4.1.2. Restraints
- 4.1.2.1. Data privacy, security concerns, and stringent regulatory requirements
- 4.1.2.2. Resistance from staff and the need for continuous training on advanced billing software can reduce efficiency and slow deployment
- 4.1.1. Drivers
- 4.2. Key Trend Analysis
- 4.3. Regulatory Framework
- 4.3.1. Key Regulations, Norms, and Subsidies, by Key Countries
- 4.3.2. Tariffs and Standards
- 4.3.3. Impact Analysis of Regulations on the Market
- 4.4. Value Chain Analysis
- 4.5. Cost Structure Analysis
- 4.6. Porter’s Five Forces Analysis
- 4.7. PESTEL Analysis
- 4.8. Global Medical Billing Market Demand
- 4.8.1. Historical Market Size –Value (US$ Bn), 2020-2024
- 4.8.2. Current and Future Market Size –Value (US$ Bn), 2026–2035
- 4.8.2.1. Y-o-Y Growth Trends
- 4.8.2.2. Absolute $ Opportunity Assessment
- 4.1. Market Dynamics
- 5. Competition Landscape
- 5.1. Competition structure
- 5.1.1. Fragmented v/s consolidated
- 5.2. Company Share Analysis, 2025
- 5.2.1. Global Company Market Share
- 5.2.2. By Region
- 5.2.2.1. North America
- 5.2.2.2. Europe
- 5.2.2.3. Asia Pacific
- 5.2.2.4. Middle East
- 5.2.2.5. Africa
- 5.2.2.6. South America
- 5.3. Product Comparison Matrix
- 5.3.1. Specifications
- 5.3.2. Market Positioning
- 5.3.3. Pricing
- 5.1. Competition structure
- 6. Global Medical Billing Market Analysis, by Component
- 6.1. Key Segment Analysis
- 6.2. Medical Billing Market Size (Value - US$ Bn), Analysis, and Forecasts, by Component, 2021-2035
- 6.2.1. Software
- 6.2.1.1. Core Medical Billing Software
- 6.2.1.1.1. Claim Creation & Submission Module
- 6.2.1.1.2. Coding & Charge Entry Module
- 6.2.1.1.3. Eligibility Verification Module
- 6.2.1.1.4. Claim Scrubbing & Error Detection Module
- 6.2.1.1.5. Denial Management Module
- 6.2.1.1.6. Payment Posting Module
- 6.2.1.1.7. Patient Billing & Accounts Receivable Module
- 6.2.1.1.8. Others
- 6.2.1.2. Revenue Cycle Management (RCM) Suite
- 6.2.1.2.1. End-to-End RCM Dashboard
- 6.2.1.2.2. Analytics & Reporting Tools
- 6.2.1.2.3. Financial Performance Metrics
- 6.2.1.2.4. Forecasting & Predictive Analytics
- 6.2.1.2.5. Others
- 6.2.1.3. Integration & Connectivity
- 6.2.1.3.1. EHR/EMR Integration Module
- 6.2.1.3.2. Practice Management System Integration
- 6.2.1.3.3. Payer/Insurance Connectivity Module
- 6.2.1.3.4. Patient Portal Integration
- 6.2.1.3.5. Others
- 6.2.1.4. User Interface Components
- 6.2.1.4.1. Provider/Physician Dashboard
- 6.2.1.4.2. Billing Specialist Interface
- 6.2.1.4.3. Administrative User Interface
- 6.2.1.4.4. Patient Billing Portal Interface
- 6.2.1.4.5. Others
- 6.2.1.5. Security & Compliance Features
- 6.2.1.5.1. HIPAA/Healthcare Compliance Module
- 6.2.1.5.2. Data Encryption & Access Control
- 6.2.1.5.3. Audit Trails & Monitoring
- 6.2.1.5.4. User Role Management
- 6.2.1.5.5. Others
- 6.2.1.1. Core Medical Billing Software
- 6.2.2. Services
- 6.2.2.1. Implementation & Deployment Services
- 6.2.2.1.1. System Setup & Configuration
- 6.2.2.1.2. Data Migration & Conversion
- 6.2.2.1.3. Customization Services
- 6.2.2.1.4. Others
- 6.2.2.2. Training & Education Services
- 6.2.2.2.1. User Training & Onboarding
- 6.2.2.2.2. Ongoing Education Workshops
- 6.2.2.2.3. Certification Programs
- 6.2.2.2.4. Others
- 6.2.2.3. Support & Maintenance Services
- 6.2.2.3.1. Technical Support
- 6.2.2.3.2. Software Updates & Upgrades
- 6.2.2.3.3. Helpdesk Services
- 6.2.2.3.4. Others
- 6.2.2.4. Consulting & Advisory Services
- 6.2.2.4.1. Workflow Optimization Consulting
- 6.2.2.4.2. Regulatory & Compliance Advisory
- 6.2.2.4.3. Best Practices & Process Standardization
- 6.2.2.4.4. Others
- 6.2.2.5. Managed Billing Services
- 6.2.2.5.1. Fully Outsourced Billing Operations
- 6.2.2.5.2. Hybrid Managed Support
- 6.2.2.5.3. Dedicated Account Management
- 6.2.2.5.4. Others
- 6.2.2.6. Analytics & Reporting Services
- 6.2.2.6.1. Financial Reporting
- 6.2.2.6.2. Performance Benchmarking
- 6.2.2.6.3. Revenue Leakage Identification
- 6.2.2.6.4. Others
- 6.2.2.1. Implementation & Deployment Services
- 6.2.1. Software
- 7. Global Medical Billing Market Analysis, by Billing Type
- 7.1. Key Segment Analysis
- 7.2. Medical Billing Market Size (Value - US$ Bn), Analysis, and Forecasts, by Billing Type, 2021-2035
- 7.2.1. Professional Billing
- 7.2.2. Institutional Billing
- 7.2.3. Dental Billing
- 7.2.4. Pharmacy Billing
- 7.2.5. Other Specialty Billing
- 8. Global Medical Billing Market Analysis, by Deployment Mode
- 8.1. Key Segment Analysis
- 8.2. Medical Billing Market Size (Value - US$ Bn), Analysis, and Forecasts, by Deployment Mode, 2021-2035
- 8.2.1. Cloud-Based
- 8.2.2. On-Premise
- 9. Global Medical Billing Market Analysis, by Mode of Service Delivery
- 9.1. Key Segment Analysis
- 9.2. Medical Billing Market Size (Value - US$ Bn), Analysis, and Forecasts, by Mode of Service Delivery, 2021-2035
- 9.2.1. In-House Billing
- 9.2.2. Outsourced Billing
- 10. Global Medical Billing Market Analysis, by Payer
- 10.1. Key Segment Analysis
- 10.2. Medical Billing Market Size (Value - US$ Bn), Analysis, and Forecasts, by Payer, 2021-2035
- 10.2.1. Private Insurance
- 10.2.2. Government Insurance
- 10.2.3. Out-of-Pocket
- 10.2.4. Others
- 11. Global Medical Billing Market Analysis, by Billing Format
- 11.1. Key Segment Analysis
- 11.2. Medical Billing Market Size (Value - US$ Bn), Analysis, and Forecasts, by Billing Format, 2021-2035
- 11.2.1. Electronic Billing
- 11.2.2. Paper Billing
- 12. Global Medical Billing Market Analysis, by Pricing Model
- 12.1. Key Segment Analysis
- 12.2. Medical Billing Market Size (Value - US$ Bn), Analysis, and Forecasts, by Pricing Model, 2021-2035
- 12.2.1. Subscription/ License
- 12.2.2. Transactional/ Per Claim
- 12.2.3. Hybrid/ Other
- 13. Global Medical Billing Market Analysis, by Service Provider
- 13.1. Key Segment Analysis
- 13.2. Medical Billing Market Size (Value - US$ Bn), Analysis, and Forecasts, by Service Provider, 2021-2035
- 13.2.1. Third-Party Billing Companies
- 13.2.2. Software Vendors with In-Built Billing
- 13.2.3. Integrated Healthcare IT Providers
- 13.2.4. Others
- 14. Global Medical Billing Market Analysis, by End User
- 14.1. Key Segment Analysis
- 14.2. Medical Billing Market Size (Value - US$ Bn), Analysis, and Forecasts, by End User, 2021-2035
- 14.2.1. Hospitals & Health Systems
- 14.2.2. Ambulatory Care Centers
- 14.2.3. Diagnostic Centers
- 14.2.4. Long-Term Care Facilities
- 14.2.5. Specialty Clinics
- 14.2.6. Home Healthcare Providers
- 14.2.7. Others
- 15. Global Medical Billing Market Analysis and Forecasts, by Region
- 15.1. Key Findings
- 15.2. Medical Billing Market Size (Value - US$ Bn), Analysis, and Forecasts, by Region, 2021-2035
- 15.2.1. North America
- 15.2.2. Europe
- 15.2.3. Asia Pacific
- 15.2.4. Middle East
- 15.2.5. Africa
- 15.2.6. South America
- 16. North America Medical Billing Market Analysis
- 16.1. Key Segment Analysis
- 16.2. Regional Snapshot
- 16.3. North America Medical Billing Market Size (Value - US$ Bn), Analysis, and Forecasts, 2021-2035
- 16.3.1. Component
- 16.3.2. Billing Type
- 16.3.3. Deployment Mode
- 16.3.4. Mode of Service Delivery
- 16.3.5. Payer
- 16.3.6. Billing Format
- 16.3.7. Pricing Model
- 16.3.8. Service Provider
- 16.3.9. End User
- 16.3.10. Country
- 16.3.10.1. USA
- 16.3.10.2. Canada
- 16.3.10.3. Mexico
- 16.4. USA Medical Billing Market
- 16.4.1. Country Segmental Analysis
- 16.4.2. Component
- 16.4.3. Billing Type
- 16.4.4. Deployment Mode
- 16.4.5. Mode of Service Delivery
- 16.4.6. Payer
- 16.4.7. Billing Format
- 16.4.8. Pricing Model
- 16.4.9. Service Provider
- 16.4.10. End User
- 16.5. Canada Medical Billing Market
- 16.5.1. Country Segmental Analysis
- 16.5.2. Component
- 16.5.3. Billing Type
- 16.5.4. Deployment Mode
- 16.5.5. Mode of Service Delivery
- 16.5.6. Payer
- 16.5.7. Billing Format
- 16.5.8. Pricing Model
- 16.5.9. Service Provider
- 16.5.10. End User
- 16.6. Mexico Medical Billing Market
- 16.6.1. Country Segmental Analysis
- 16.6.2. Component
- 16.6.3. Billing Type
- 16.6.4. Deployment Mode
- 16.6.5. Mode of Service Delivery
- 16.6.6. Payer
- 16.6.7. Billing Format
- 16.6.8. Pricing Model
- 16.6.9. Service Provider
- 16.6.10. End User
- 17. Europe Medical Billing Market Analysis
- 17.1. Key Segment Analysis
- 17.2. Regional Snapshot
- 17.3. Europe Medical Billing Market Size (Value - US$ Bn), Analysis, and Forecasts, 2021-2035
- 17.3.1. Component
- 17.3.2. Billing Type
- 17.3.3. Deployment Mode
- 17.3.4. Mode of Service Delivery
- 17.3.5. Payer
- 17.3.6. Billing Format
- 17.3.7. Pricing Model
- 17.3.8. Service Provider
- 17.3.9. End User
- 17.3.10. Country
- 17.3.10.1. Germany
- 17.3.10.2. United Kingdom
- 17.3.10.3. France
- 17.3.10.4. Italy
- 17.3.10.5. Spain
- 17.3.10.6. Netherlands
- 17.3.10.7. Nordic Countries
- 17.3.10.8. Poland
- 17.3.10.9. Russia & CIS
- 17.3.10.10. Rest of Europe
- 17.4. Germany Medical Billing Market
- 17.4.1. Country Segmental Analysis
- 17.4.2. Component
- 17.4.3. Billing Type
- 17.4.4. Deployment Mode
- 17.4.5. Mode of Service Delivery
- 17.4.6. Payer
- 17.4.7. Billing Format
- 17.4.8. Pricing Model
- 17.4.9. Service Provider
- 17.4.10. End User
- 17.5. United Kingdom Medical Billing Market
- 17.5.1. Country Segmental Analysis
- 17.5.2. Component
- 17.5.3. Billing Type
- 17.5.4. Deployment Mode
- 17.5.5. Mode of Service Delivery
- 17.5.6. Payer
- 17.5.7. Billing Format
- 17.5.8. Pricing Model
- 17.5.9. Service Provider
- 17.5.10. End User
- 17.6. France Medical Billing Market
- 17.6.1. Country Segmental Analysis
- 17.6.2. Component
- 17.6.3. Billing Type
- 17.6.4. Deployment Mode
- 17.6.5. Mode of Service Delivery
- 17.6.6. Payer
- 17.6.7. Billing Format
- 17.6.8. Pricing Model
- 17.6.9. Service Provider
- 17.6.10. End User
- 17.7. Italy Medical Billing Market
- 17.7.1. Country Segmental Analysis
- 17.7.2. Component
- 17.7.3. Billing Type
- 17.7.4. Deployment Mode
- 17.7.5. Mode of Service Delivery
- 17.7.6. Payer
- 17.7.7. Billing Format
- 17.7.8. Pricing Model
- 17.7.9. Service Provider
- 17.7.10. End User
- 17.8. Spain Medical Billing Market
- 17.8.1. Country Segmental Analysis
- 17.8.2. Component
- 17.8.3. Billing Type
- 17.8.4. Deployment Mode
- 17.8.5. Mode of Service Delivery
- 17.8.6. Payer
- 17.8.7. Billing Format
- 17.8.8. Pricing Model
- 17.8.9. Service Provider
- 17.8.10. End User
- 17.9. Netherlands Medical Billing Market
- 17.9.1. Country Segmental Analysis
- 17.9.2. Component
- 17.9.3. Billing Type
- 17.9.4. Deployment Mode
- 17.9.5. Mode of Service Delivery
- 17.9.6. Payer
- 17.9.7. Billing Format
- 17.9.8. Pricing Model
- 17.9.9. Service Provider
- 17.9.10. End User
- 17.10. Nordic Countries Medical Billing Market
- 17.10.1. Country Segmental Analysis
- 17.10.2. Component
- 17.10.3. Billing Type
- 17.10.4. Deployment Mode
- 17.10.5. Mode of Service Delivery
- 17.10.6. Payer
- 17.10.7. Billing Format
- 17.10.8. Pricing Model
- 17.10.9. Service Provider
- 17.10.10. End User
- 17.11. Poland Medical Billing Market
- 17.11.1. Country Segmental Analysis
- 17.11.2. Component
- 17.11.3. Billing Type
- 17.11.4. Deployment Mode
- 17.11.5. Mode of Service Delivery
- 17.11.6. Payer
- 17.11.7. Billing Format
- 17.11.8. Pricing Model
- 17.11.9. Service Provider
- 17.11.10. End User
- 17.12. Russia & CIS Medical Billing Market
- 17.12.1. Country Segmental Analysis
- 17.12.2. Component
- 17.12.3. Billing Type
- 17.12.4. Deployment Mode
- 17.12.5. Mode of Service Delivery
- 17.12.6. Payer
- 17.12.7. Billing Format
- 17.12.8. Pricing Model
- 17.12.9. Service Provider
- 17.12.10. End User
- 17.13. Rest of Europe Medical Billing Market
- 17.13.1. Country Segmental Analysis
- 17.13.2. Component
- 17.13.3. Billing Type
- 17.13.4. Deployment Mode
- 17.13.5. Mode of Service Delivery
- 17.13.6. Payer
- 17.13.7. Billing Format
- 17.13.8. Pricing Model
- 17.13.9. Service Provider
- 17.13.10. End User
- 18. Asia Pacific Medical Billing Market Analysis
- 18.1. Key Segment Analysis
- 18.2. Regional Snapshot
- 18.3. Asia Pacific Medical Billing Market Size (Value - US$ Bn), Analysis, and Forecasts, 2021-2035
- 18.3.1. Component
- 18.3.2. Billing Type
- 18.3.3. Deployment Mode
- 18.3.4. Mode of Service Delivery
- 18.3.5. Payer
- 18.3.6. Billing Format
- 18.3.7. Pricing Model
- 18.3.8. Service Provider
- 18.3.9. End User
- 18.3.10. Country
- 18.3.10.1. China
- 18.3.10.2. India
- 18.3.10.3. Japan
- 18.3.10.4. South Korea
- 18.3.10.5. Australia and New Zealand
- 18.3.10.6. Indonesia
- 18.3.10.7. Malaysia
- 18.3.10.8. Thailand
- 18.3.10.9. Vietnam
- 18.3.10.10. Rest of Asia Pacific
- 18.4. China Medical Billing Market
- 18.4.1. Country Segmental Analysis
- 18.4.2. Component
- 18.4.3. Billing Type
- 18.4.4. Deployment Mode
- 18.4.5. Mode of Service Delivery
- 18.4.6. Payer
- 18.4.7. Billing Format
- 18.4.8. Pricing Model
- 18.4.9. Service Provider
- 18.4.10. End User
- 18.5. India Medical Billing Market
- 18.5.1. Country Segmental Analysis
- 18.5.2. Component
- 18.5.3. Billing Type
- 18.5.4. Deployment Mode
- 18.5.5. Mode of Service Delivery
- 18.5.6. Payer
- 18.5.7. Billing Format
- 18.5.8. Pricing Model
- 18.5.9. Service Provider
- 18.5.10. End User
- 18.6. Japan Medical Billing Market
- 18.6.1. Country Segmental Analysis
- 18.6.2. Component
- 18.6.3. Billing Type
- 18.6.4. Deployment Mode
- 18.6.5. Mode of Service Delivery
- 18.6.6. Payer
- 18.6.7. Billing Format
- 18.6.8. Pricing Model
- 18.6.9. Service Provider
- 18.6.10. End User
- 18.7. South Korea Medical Billing Market
- 18.7.1. Country Segmental Analysis
- 18.7.2. Component
- 18.7.3. Billing Type
- 18.7.4. Deployment Mode
- 18.7.5. Mode of Service Delivery
- 18.7.6. Payer
- 18.7.7. Billing Format
- 18.7.8. Pricing Model
- 18.7.9. Service Provider
- 18.7.10. End User
- 18.8. Australia and New Zealand Medical Billing Market
- 18.8.1. Country Segmental Analysis
- 18.8.2. Component
- 18.8.3. Billing Type
- 18.8.4. Deployment Mode
- 18.8.5. Mode of Service Delivery
- 18.8.6. Payer
- 18.8.7. Billing Format
- 18.8.8. Pricing Model
- 18.8.9. Service Provider
- 18.8.10. End User
- 18.9. Indonesia Medical Billing Market
- 18.9.1. Country Segmental Analysis
- 18.9.2. Component
- 18.9.3. Billing Type
- 18.9.4. Deployment Mode
- 18.9.5. Mode of Service Delivery
- 18.9.6. Payer
- 18.9.7. Billing Format
- 18.9.8. Pricing Model
- 18.9.9. Service Provider
- 18.9.10. End User
- 18.10. Malaysia Medical Billing Market
- 18.10.1. Country Segmental Analysis
- 18.10.2. Component
- 18.10.3. Billing Type
- 18.10.4. Deployment Mode
- 18.10.5. Mode of Service Delivery
- 18.10.6. Payer
- 18.10.7. Billing Format
- 18.10.8. Pricing Model
- 18.10.9. Service Provider
- 18.10.10. End User
- 18.11. Thailand Medical Billing Market
- 18.11.1. Country Segmental Analysis
- 18.11.2. Component
- 18.11.3. Billing Type
- 18.11.4. Deployment Mode
- 18.11.5. Mode of Service Delivery
- 18.11.6. Payer
- 18.11.7. Billing Format
- 18.11.8. Pricing Model
- 18.11.9. Service Provider
- 18.11.10. End User
- 18.12. Vietnam Medical Billing Market
- 18.12.1. Country Segmental Analysis
- 18.12.2. Component
- 18.12.3. Billing Type
- 18.12.4. Deployment Mode
- 18.12.5. Mode of Service Delivery
- 18.12.6. Payer
- 18.12.7. Billing Format
- 18.12.8. Pricing Model
- 18.12.9. Service Provider
- 18.12.10. End User
- 18.13. Rest of Asia Pacific Medical Billing Market
- 18.13.1. Country Segmental Analysis
- 18.13.2. Component
- 18.13.3. Billing Type
- 18.13.4. Deployment Mode
- 18.13.5. Mode of Service Delivery
- 18.13.6. Payer
- 18.13.7. Billing Format
- 18.13.8. Pricing Model
- 18.13.9. Service Provider
- 18.13.10. End User
- 19. Middle East Medical Billing Market Analysis
- 19.1. Key Segment Analysis
- 19.2. Regional Snapshot
- 19.3. Middle East Medical Billing Market Size (Value - US$ Bn), Analysis, and Forecasts, 2021-2035
- 19.3.1. Component
- 19.3.2. Billing Type
- 19.3.3. Deployment Mode
- 19.3.4. Mode of Service Delivery
- 19.3.5. Payer
- 19.3.6. Billing Format
- 19.3.7. Pricing Model
- 19.3.8. Service Provider
- 19.3.9. End User
- 19.3.10. Country
- 19.3.10.1. Turkey
- 19.3.10.2. UAE
- 19.3.10.3. Saudi Arabia
- 19.3.10.4. Israel
- 19.3.10.5. Rest of Middle East
- 19.4. Turkey Medical Billing Market
- 19.4.1. Country Segmental Analysis
- 19.4.2. Component
- 19.4.3. Billing Type
- 19.4.4. Deployment Mode
- 19.4.5. Mode of Service Delivery
- 19.4.6. Payer
- 19.4.7. Billing Format
- 19.4.8. Pricing Model
- 19.4.9. Service Provider
- 19.4.10. End User
- 19.5. UAE Medical Billing Market
- 19.5.1. Country Segmental Analysis
- 19.5.2. Component
- 19.5.3. Billing Type
- 19.5.4. Deployment Mode
- 19.5.5. Mode of Service Delivery
- 19.5.6. Payer
- 19.5.7. Billing Format
- 19.5.8. Pricing Model
- 19.5.9. Service Provider
- 19.5.10. End User
- 19.6. Saudi Arabia Medical Billing Market
- 19.6.1. Country Segmental Analysis
- 19.6.2. Component
- 19.6.3. Billing Type
- 19.6.4. Deployment Mode
- 19.6.5. Mode of Service Delivery
- 19.6.6. Payer
- 19.6.7. Billing Format
- 19.6.8. Pricing Model
- 19.6.9. Service Provider
- 19.6.10. End User
- 19.7. Israel Medical Billing Market
- 19.7.1. Country Segmental Analysis
- 19.7.2. Component
- 19.7.3. Billing Type
- 19.7.4. Deployment Mode
- 19.7.5. Mode of Service Delivery
- 19.7.6. Payer
- 19.7.7. Billing Format
- 19.7.8. Pricing Model
- 19.7.9. Service Provider
- 19.7.10. End User
- 19.8. Rest of Middle East Medical Billing Market
- 19.8.1. Country Segmental Analysis
- 19.8.2. Component
- 19.8.3. Billing Type
- 19.8.4. Deployment Mode
- 19.8.5. Mode of Service Delivery
- 19.8.6. Payer
- 19.8.7. Billing Format
- 19.8.8. Pricing Model
- 19.8.9. Service Provider
- 19.8.10. End User
- 20. Africa Medical Billing Market Analysis
- 20.1. Key Segment Analysis
- 20.2. Regional Snapshot
- 20.3. Africa Medical Billing Market Size (Value - US$ Bn), Analysis, and Forecasts, 2021-2035
- 20.3.1. Component
- 20.3.2. Billing Type
- 20.3.3. Deployment Mode
- 20.3.4. Mode of Service Delivery
- 20.3.5. Payer
- 20.3.6. Billing Format
- 20.3.7. Pricing Model
- 20.3.8. Service Provider
- 20.3.9. End User
- 20.3.10. Country
- 20.3.10.1. South Africa
- 20.3.10.2. Egypt
- 20.3.10.3. Nigeria
- 20.3.10.4. Algeria
- 20.3.10.5. Rest of Africa
- 20.4. South Africa Medical Billing Market
- 20.4.1. Country Segmental Analysis
- 20.4.2. Component
- 20.4.3. Billing Type
- 20.4.4. Deployment Mode
- 20.4.5. Mode of Service Delivery
- 20.4.6. Payer
- 20.4.7. Billing Format
- 20.4.8. Pricing Model
- 20.4.9. Service Provider
- 20.4.10. End User
- 20.5. Egypt Medical Billing Market
- 20.5.1. Country Segmental Analysis
- 20.5.2. Component
- 20.5.3. Billing Type
- 20.5.4. Deployment Mode
- 20.5.5. Mode of Service Delivery
- 20.5.6. Payer
- 20.5.7. Billing Format
- 20.5.8. Pricing Model
- 20.5.9. Service Provider
- 20.5.10. End User
- 20.6. Nigeria Medical Billing Market
- 20.6.1. Country Segmental Analysis
- 20.6.2. Component
- 20.6.3. Billing Type
- 20.6.4. Deployment Mode
- 20.6.5. Mode of Service Delivery
- 20.6.6. Payer
- 20.6.7. Billing Format
- 20.6.8. Pricing Model
- 20.6.9. Service Provider
- 20.6.10. End User
- 20.7. Algeria Medical Billing Market
- 20.7.1. Country Segmental Analysis
- 20.7.2. Component
- 20.7.3. Billing Type
- 20.7.4. Deployment Mode
- 20.7.5. Mode of Service Delivery
- 20.7.6. Payer
- 20.7.7. Billing Format
- 20.7.8. Pricing Model
- 20.7.9. Service Provider
- 20.7.10. End User
- 20.8. Rest of Africa Medical Billing Market
- 20.8.1. Country Segmental Analysis
- 20.8.2. Component
- 20.8.3. Billing Type
- 20.8.4. Deployment Mode
- 20.8.5. Mode of Service Delivery
- 20.8.6. Payer
- 20.8.7. Billing Format
- 20.8.8. Pricing Model
- 20.8.9. Service Provider
- 20.8.10. End User
- 21. South America Medical Billing Market Analysis
- 21.1. Key Segment Analysis
- 21.2. Regional Snapshot
- 21.3. South America Medical Billing Market Size (Value - US$ Bn), Analysis, and Forecasts, 2021-2035
- 21.3.1. Component
- 21.3.2. Billing Type
- 21.3.3. Deployment Mode
- 21.3.4. Mode of Service Delivery
- 21.3.5. Payer
- 21.3.6. Billing Format
- 21.3.7. Pricing Model
- 21.3.8. Service Provider
- 21.3.9. End User
- 21.3.10. Country
- 21.3.10.1. Brazil
- 21.3.10.2. Argentina
- 21.3.10.3. Rest of South America
- 21.4. Brazil Medical Billing Market
- 21.4.1. Country Segmental Analysis
- 21.4.2. Component
- 21.4.3. Billing Type
- 21.4.4. Deployment Mode
- 21.4.5. Mode of Service Delivery
- 21.4.6. Payer
- 21.4.7. Billing Format
- 21.4.8. Pricing Model
- 21.4.9. Service Provider
- 21.4.10. End User
- 21.5. Argentina Medical Billing Market
- 21.5.1. Country Segmental Analysis
- 21.5.2. Component
- 21.5.3. Billing Type
- 21.5.4. Deployment Mode
- 21.5.5. Mode of Service Delivery
- 21.5.6. Payer
- 21.5.7. Billing Format
- 21.5.8. Pricing Model
- 21.5.9. Service Provider
- 21.5.10. End User
- 21.6. Rest of South America Medical Billing Market
- 21.6.1. Country Segmental Analysis
- 21.6.2. Component
- 21.6.3. Billing Type
- 21.6.4. Deployment Mode
- 21.6.5. Mode of Service Delivery
- 21.6.6. Payer
- 21.6.7. Billing Format
- 21.6.8. Pricing Model
- 21.6.9. Service Provider
- 21.6.10. End User
- 22. Key Players/ Company Profile
- 22.1. 3M Health Information Systems
- 22.1.1. Company Details/ Overview
- 22.1.2. Company Financials
- 22.1.3. Key Customers and Competitors
- 22.1.4. Business/ Industry Portfolio
- 22.1.5. Product Portfolio/ Specification Details
- 22.1.6. Pricing Data
- 22.1.7. Strategic Overview
- 22.1.8. Recent Developments
- 22.2. AdvancedMD
- 22.3. Allscripts Healthcare Solutions
- 22.4. Athenahealth
- 22.5. Cerner Corporation
- 22.6. Change Healthcare
- 22.7. Conifer Health Solutions
- 22.8. eClinicalWorks
- 22.9. Epic Systems Corporation
- 22.10. GE Healthcare
- 22.11. Kareo
- 22.12. McKesson Corporation
- 22.13. Meditech
- 22.14. NextGen Healthcare
- 22.15. Optum (UnitedHealth Group)
- 22.16. Practice Fusion
- 22.17. R1 RCM
- 22.18. Software AG (IDS)
- 22.19. Waystar
- 22.20. ZirMed
- 22.21. Other Key Players
- 22.1. 3M Health Information Systems
Note* - This is just tentative list of players. While providing the report, we will cover more number of players based on their revenue and share for each geography
Research Design
Our research design integrates both demand-side and supply-side analysis through a balanced combination of primary and secondary research methodologies. By utilizing both bottom-up and top-down approaches alongside rigorous data triangulation methods, we deliver robust market intelligence that supports strategic decision-making.
MarketGenics' comprehensive research design framework ensures the delivery of accurate, reliable, and actionable market intelligence. Through the integration of multiple research approaches, rigorous validation processes, and expert analysis, we provide our clients with the insights needed to make informed strategic decisions and capitalize on market opportunities.

MarketGenics leverages a dedicated industry panel of experts and a comprehensive suite of paid databases to effectively collect, consolidate, and analyze market intelligence.
Our approach has consistently proven to be reliable and effective in generating accurate market insights, identifying key industry trends, and uncovering emerging business opportunities.
Through both primary and secondary research, we capture and analyze critical company-level data such as manufacturing footprints, including technical centers, R&D facilities, sales offices, and headquarters.
Our expert panel further enhances our ability to estimate market size for specific brands based on validated field-level intelligence.
Our data mining techniques incorporate both parametric and non-parametric methods, allowing for structured data collection, sorting, processing, and cleaning.
Demand projections are derived from large-scale data sets analyzed through proprietary algorithms, culminating in robust and reliable market sizing.
Research Approach
The bottom-up approach builds market estimates by starting with the smallest addressable market units and systematically aggregating them to create comprehensive market size projections.
This method begins with specific, granular data points and builds upward to create the complete market landscape.
Customer Analysis → Segmental Analysis → Geographical Analysis
The top-down approach starts with the broadest possible market data and systematically narrows it down through a series of filters and assumptions to arrive at specific market segments or opportunities.
This method begins with the big picture and works downward to increasingly specific market slices.
TAM → SAM → SOM


Research Methods
Desk / Secondary Research
While analysing the market, we extensively study secondary sources, directories, and databases to identify and collect information useful for this technical, market-oriented, and commercial report. Secondary sources that we utilize are not only the public sources, but it is a combination of Open Source, Associations, Paid Databases, MG Repository & Knowledgebase, and others.
- Company websites, annual reports, financial reports, broker reports, and investor presentations
- National government documents, statistical databases and reports
- News articles, press releases and web-casts specific to the companies operating in the market, Magazines, reports, and others
- We gather information from commercial data sources for deriving company specific data such as segmental revenue, share for geography, product revenue, and others
- Internal and external proprietary databases (industry-specific), relevant patent, and regulatory databases
- Governing Bodies, Government Organizations
- Relevant Authorities, Country-specific Associations for Industries
We also employ the model mapping approach to estimate the product level market data through the players' product portfolio
Primary Research
Primary research/ interviews is vital in analyzing the market. Most of the cases involves paid primary interviews. Primary sources include primary interviews through e-mail interactions, telephonic interviews, surveys as well as face-to-face interviews with the different stakeholders across the value chain including several industry experts.
| Type of Respondents | Number of Primaries |
|---|---|
| Tier 2/3 Suppliers | ~20 |
| Tier 1 Suppliers | ~25 |
| End-users | ~25 |
| Industry Expert/ Panel/ Consultant | ~30 |
| Total | ~100 |
MG Knowledgebase
• Repository of industry blog, newsletter and case studies
• Online platform covering detailed market reports, and company profiles
Forecasting Factors and Models
Forecasting Factors
- Historical Trends – Past market patterns, cycles, and major events that shaped how markets behave over time. Understanding past trends helps predict future behavior.
- Industry Factors – Specific characteristics of the industry like structure, regulations, and innovation cycles that affect market dynamics.
- Macroeconomic Factors – Economic conditions like GDP growth, inflation, and employment rates that affect how much money people have to spend.
- Demographic Factors – Population characteristics like age, income, and location that determine who can buy your product.
- Technology Factors – How quickly people adopt new technology and how much technology infrastructure exists.
- Regulatory Factors – Government rules, laws, and policies that can help or restrict market growth.
- Competitive Factors – Analyzing competition structure such as degree of competition and bargaining power of buyers and suppliers.
Forecasting Models / Techniques
Multiple Regression Analysis
- Identify and quantify factors that drive market changes
- Statistical modeling to establish relationships between market drivers and outcomes
Time Series Analysis – Seasonal Patterns
- Understand regular cyclical patterns in market demand
- Advanced statistical techniques to separate trend, seasonal, and irregular components
Time Series Analysis – Trend Analysis
- Identify underlying market growth patterns and momentum
- Statistical analysis of historical data to project future trends
Expert Opinion – Expert Interviews
- Gather deep industry insights and contextual understanding
- In-depth interviews with key industry stakeholders
Multi-Scenario Development
- Prepare for uncertainty by modeling different possible futures
- Creating optimistic, pessimistic, and most likely scenarios
Time Series Analysis – Moving Averages
- Sophisticated forecasting for complex time series data
- Auto-regressive integrated moving average models with seasonal components
Econometric Models
- Apply economic theory to market forecasting
- Sophisticated economic models that account for market interactions
Expert Opinion – Delphi Method
- Harness collective wisdom of industry experts
- Structured, multi-round expert consultation process
Monte Carlo Simulation
- Quantify uncertainty and probability distributions
- Thousands of simulations with varying input parameters
Research Analysis
Our research framework is built upon the fundamental principle of validating market intelligence from both demand and supply perspectives. This dual-sided approach ensures comprehensive market understanding and reduces the risk of single-source bias.
Demand-Side Analysis: We understand end-user/application behavior, preferences, and market needs along with the penetration of the product for specific application.
Supply-Side Analysis: We estimate overall market revenue, analyze the segmental share along with industry capacity, competitive landscape, and market structure.
Validation & Evaluation
Data triangulation is a validation technique that uses multiple methods, sources, or perspectives to examine the same research question, thereby increasing the credibility and reliability of research findings. In market research, triangulation serves as a quality assurance mechanism that helps identify and minimize bias, validate assumptions, and ensure accuracy in market estimates.
- Data Source Triangulation – Using multiple data sources to examine the same phenomenon
- Methodological Triangulation – Using multiple research methods to study the same research question
- Investigator Triangulation – Using multiple researchers or analysts to examine the same data
- Theoretical Triangulation – Using multiple theoretical perspectives to interpret the same data

Custom Market Research Services
We will customise the research for you, in case the report listed above does not meet your requirements.
Get 10% Free Customisation