Medical Imaging Market Size, Share & Trends Analysis Report by Product Type (X-ray Imaging Systems, Computed Tomography (CT) Scanners, Magnetic Resonance Imaging (MRI) Systems, Ultrasound Imaging Systems, Nuclear Imaging Systems, Mammography Systems, Fluoroscopy Systems, Hybrid Imaging Systems (PET-CT, SPECT-CT, PET-MRI), Others), Technology, Modality Mobility, Patient Type, Imaging Workflow, Application, End User and Geography (North America, Europe, Asia Pacific, Middle East, Africa, and South America) – Global Industry Data, Trends, and Forecasts, 2025–2035
|
Market Structure & Evolution |
|
|
Segmental Data Insights |
|
|
Demand Trends |
|
|
Competitive Landscape |
|
|
Strategic Development |
|
|
Future Outlook & Opportunities |
|
Medical Imaging Market Size, Share, and Growth
The global medical imaging market is experiencing robust growth, with its estimated value of USD 46.2 billion in the year 2025 and USD 78.6 billion by 2035, registering a CAGR of 5.5% during the forecast period.
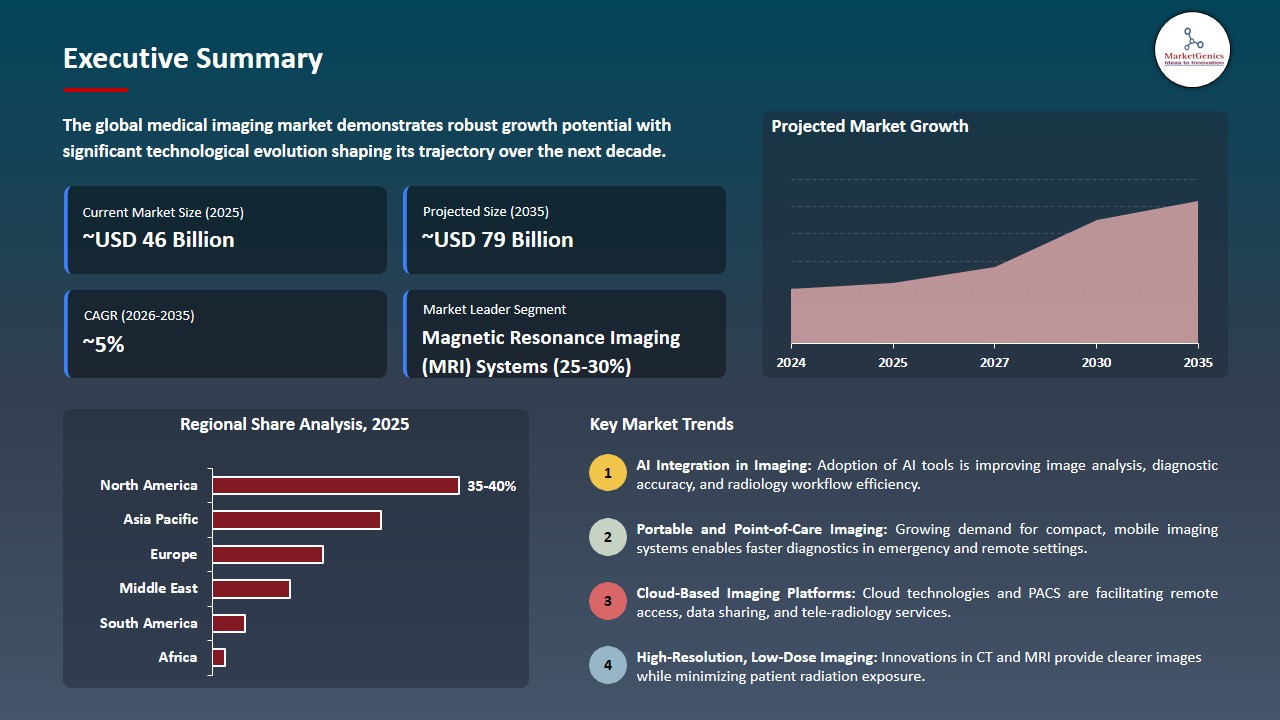
According to Curtis P. Langlotz, "intelligent machines connected (e.g., between machines, between humans and machines, etc.) is likely to create an exciting future." These intelligent connections is likely to bring about new technological innovations to enhance workflows and benefit patients through improved patient care in medical imaging.
The global medical imaging market is growing because of increasing chronic disease rates and ongoing improvements in diagnostic methods. The NAEOTOM Alpha photon-counting computed tomography system which Siemens Healthineers introduced in 2023 provides improved diagnostic accuracy through its ability to create detailed images and decrease radiation hazards.
The need for quick and correct medical evaluations leads to more healthcare facilities using artificial intelligence-powered imaging technologies. The Revolution RT system which GE HealthCare launched in 2024 introduces new cardiac imaging capabilities through its quick scanning features and improved image quality for medical professionals.
The combination of new regulatory requirements and increased healthcare facility funding drives hospitals and diagnostic centers to implement modern imaging technologies. The U.S. Food and Drug Administration and other organizations continue to grant approval for new imaging technologies which meet safety and operational standards.
The medical imaging market offers additional business prospects through its connection with radiology information systems and picture archiving and communication systems and artificial intelligence image analysis and contrast agents and imaging software platforms which help providers enhance their diagnostic processes and develop their healthcare technology capabilities.

Medical Imaging Market Dynamics and Trends
Driver: Rising Chronic Disease Burden and Expanding Diagnostic Demand Driving Medical Imaging Adoption
-
The rising numbers of people with chronic diseases including cardiovascular disease and cancer create a strong need for better diagnostic imaging technologies which healthcare systems use throughout the world. Healthcare systems have started to use imaging technologies which include magnetic resonance imaging and computed tomography and ultrasound for their purposes of detecting diseases at early stages and monitoring their progress through time.
- Healthcare providers and governments are developing new diagnostic facilities to help their programs for preventive health protection. For instance, Philips launched the BlueSeal MR Mobile in 2024 to enhance magnetic resonance imaging accessibility for hospitals and mobile diagnostic locations through its ability to operate in areas with restricted imaging capabilities.
- The healthcare industry sees a growing need for early disease detection and precise medical treatments and value-based patient care which drives hospitals and diagnostic centers to invest in advanced imaging systems and complete diagnostic solution systems that operate worldwide. All these factors are likely to continue to escalate the growth of the medical imaging market.
Restraint: High Equipment Costs and Infrastructure Requirements Limiting Adoption
-
Advanced imaging systems require expensive capital investment which prevents numerous healthcare providers from obtaining these systems despite ongoing technological advancements. The installation of imaging systems like magnetic resonance imaging and computed tomography scanners demands extensive financial resources together with dedicated installation areas and special protective equipment.
- The total cost of ownership increases for smaller hospitals and diagnostic centers because they must spend money on maintenance expenses software updates and hiring qualified radiologists and technicians.
- The adoption of new imaging technologies in various healthcare systems faces delays because of regulatory approval processes together with reimbursement issues which restrict market development in emerging healthcare markets. All these elements are expected to restrict the expansion of the medical imaging market.
Opportunity: Expansion of Imaging Services in Emerging Healthcare Markets
-
Emerging economies across Asia, the Middle East, and Latin America are investing heavily in healthcare infrastructure, creating significant opportunities for the deployment of modern imaging technologies. The demand for diagnostic services is rising because of three factors which include the rapid growth of urban areas and the increasing spending on healthcare and government initiatives to build more hospitals.
- International technology companies collaborate with healthcare providers to create scalable imaging solutions specifically designed for these regions. Canon Medical Systems launched the Vantage Fortian in 2023 to provide hospitals with advanced imaging capabilities which enable better workflow management and diagnostic accuracy.
- The developments create new business possibilities for imaging equipment manufacturers together with artificial intelligence imaging software developers and healthcare service providers who want to grow their operations in rapidly expanding healthcare markets. And thus, is expected to create more opportunities in future for medical imaging market.
Key Trend: Integration of Artificial Intelligence and Cloud-Based Imaging Platforms Transforming Diagnostics
-
A notable trend within the medical imaging field has been the emergence of cloud-enabled imaging technology with advanced data analytics capabilities such as artificial intelligence for enhancing diagnostic workflow efficiencies, improving accuracy of diagnostic work and helping radiologists with detection of abnormality in images by automating many of the tasks involved in their reviews and providing them with a more objective means of establishing priorities for reviewing high risk cases.
- Furthermore, the availability of cloud-enabled imaging technologies enables hospitals and healthcare providers to share, store and analyze large quantities of imaging data across entire networks of hospitals and facilitate remote diagnostic capabilities and tele-radiology services.
- For instance, early in 2023, NVIDIA introduced a new cloud-based imaging platform known as MONAI Deploy that is expected to aid healthcare institutions in developing and deploying artificial intelligence applications to support their existing medical imaging workflows, further demonstrating the accelerating convergence of AI aided diagnostic imaging and digital health technology applications. Therefore, is expected to influence significant trends in the medical imaging market.
Medical Imaging Market Analysis and Segmental Data
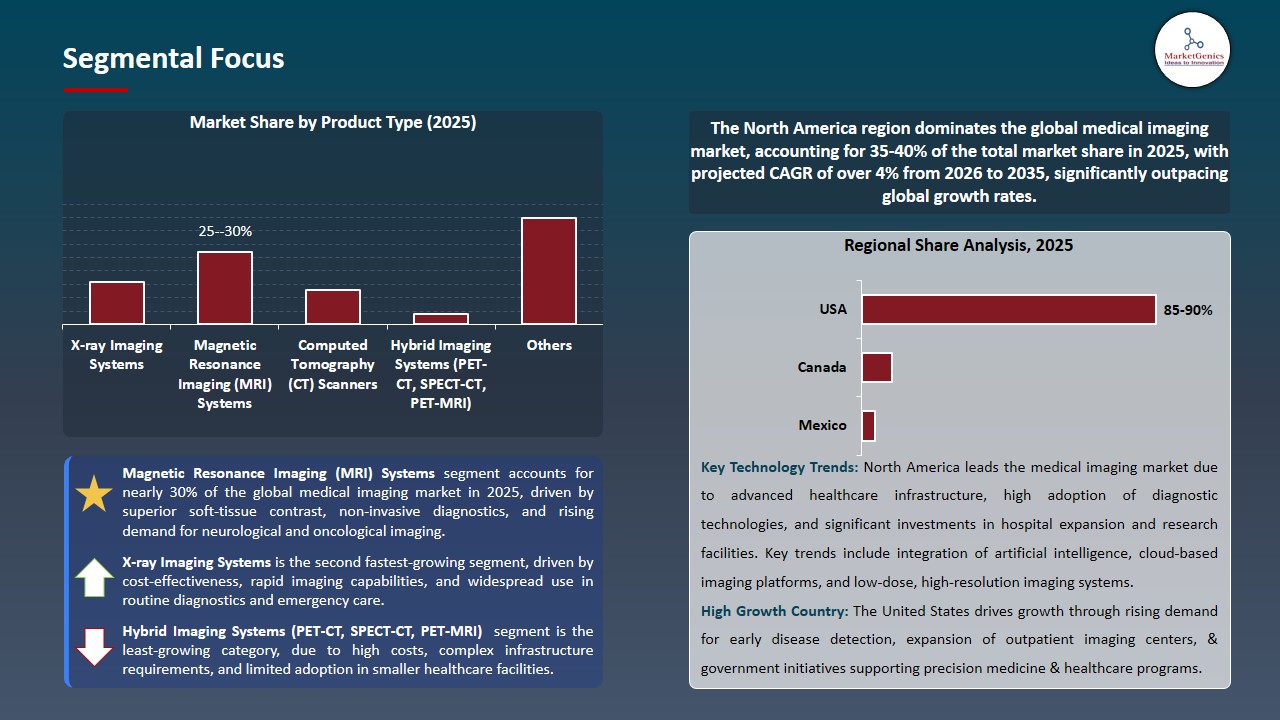
Magnetic Resonance Imaging (MRI) Systems Dominate Global Medical Imaging Market amid Rising Chronic Disease Prevalence and Technological Advancements
-
The medical imaging market worldwide uses Magnetic Resonance Imaging (MRI) systems as their leading technology because these systems provide better soft-tissue imaging and perform non-destructive medical tests while detecting various medical conditions which include brain and heart and cancer diseases.
- For instance, the firm Hyperfine introduced its Swoop portable low-field MRI system in 2025 which enables neuroimaging at hospital beds while making MRI tests available to emergency rooms and community hospitals. The rising number of people who develop chronic diseases such as neurodegenerative disorders and cancers has created a need for medical facilities which require precise imaging systems.
- Additionally, the introduction of quicker scanning procedures together with artificial intelligence image reconstruction methods and compact low-field MRI devices has improved clinical operations while making medical services more reachable to patients. Thus, making monoclonal antibodies segment the leading segment within medical imaging market.
North America Dominates Medical Imaging Market amid Advanced Healthcare Infrastructure and High Diagnostic Adoption
-
North America holds control over the medical imaging market because its healthcare system reaches advanced levels and its healthcare costs remain high while medical facilities use modern diagnostic equipment. The market expansion results from the increasing number of chronic conditions and the rising need for early medical evaluations.
- For instance, Canon Medical Systems introduced the Vantage Galan 3T MRI system to its American product line in 2025 which enables faster scanning and improved image quality to support medical facilities that want to use modern imaging technologies.
- The region sustains high imaging procedure volumes because it has major imaging equipment manufacturers and extensive hospital systems and strong reimbursement programs, enabling North America to establish itself as the leader in global medical imaging market.
Medical Imaging Market Ecosystem
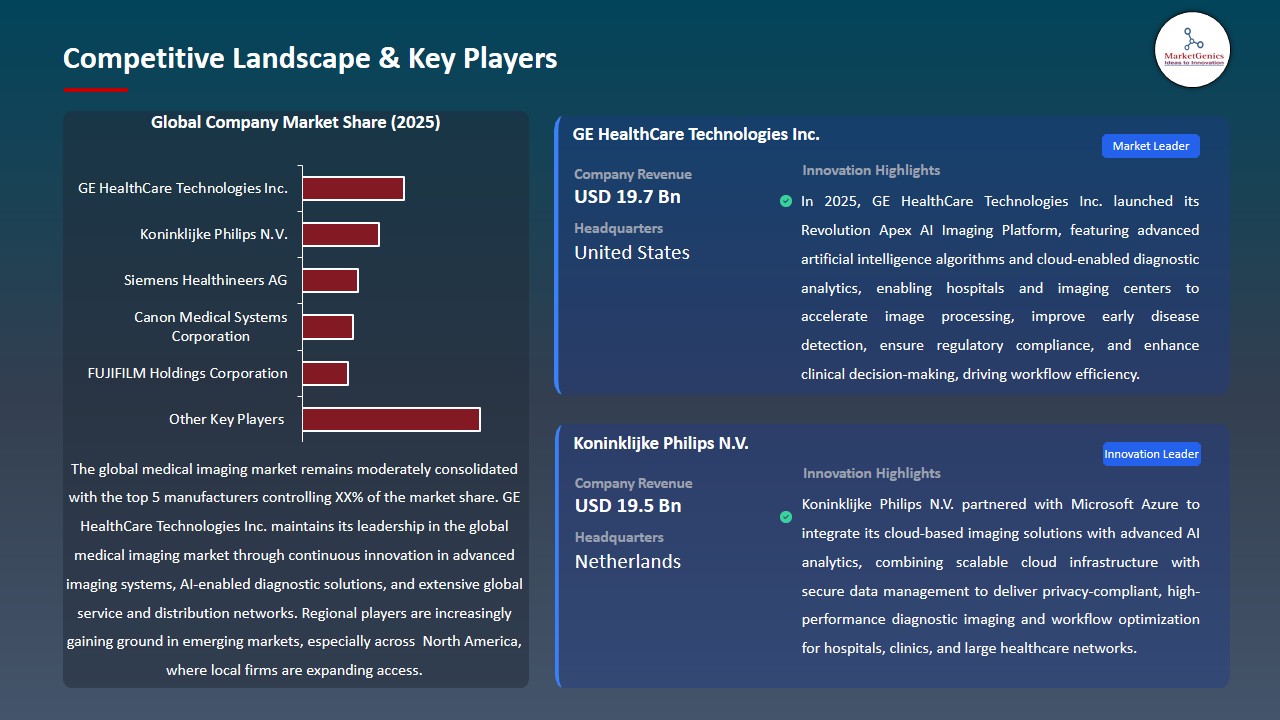
The medical imaging market shows moderate consolidation because Tier-1 global manufacturers operate alongside Tier-2 specialized firms and Tier-3 emerging companies. Tier-1 companies such as GE HealthCare, Siemens Healthineers, and Philips dominate the market because they maintain extensive product portfolios together with worldwide distribution systems while Tier-2 and Tier-3 companies concentrate on developing specialized imaging software and hardware components.
The value chain contains two main components which include component manufacturing and clinical deployment and service integration. For example, GE HealthCare introduced the SIGNA Champion system in 2024 to enhance hospital workflow processes and diagnostic capabilities.
Recent Development and Strategic Overview:
-
In November 2024, Siemens Healthineers developed the MAGNETOM Flow, which functions as an advanced magnetic resonance imaging system through its automated operational capabilities and power-saving design features. The system enables hospitals to enhance their diagnostic capacity through its dual advantages of increasing imaging efficiency and decreasing helium usage and operational difficulties.
- In February 2024, Philips launched the CT 5300 integrated with artificial intelligence–enabled workflow automation. The system allows for quicker image reconstruction through its clinical decision support system, which helps radiologists achieve better diagnostic results while healthcare organizations handle higher imaging workloads.
Report Scope
|
Attribute |
Detail |
|
Market Size in 2025 |
USD 46.2 Bn |
|
Market Forecast Value in 2035 |
USD 78.6 Bn |
|
Growth Rate (CAGR) |
5.5% |
|
Forecast Period |
2025 – 2035 |
|
Historical Data Available for |
2020 – 2024 |
|
Market Size Units |
USD Billion for Value |
|
Report Format |
Electronic (PDF) + Excel |
|
Regions and Countries Covered |
|||||
|
North America |
Europe |
Asia Pacific |
Middle East |
Africa |
South America |
|
|
|
|
|
|
|
Companies Covered |
|||||
|
|
|
|
|
|
Medical Imaging Market Segmentation and Highlights
|
Segment |
Sub-segment |
|
Medical Imaging Market, By Product Type |
|
|
Medical Imaging Market, By Technology |
|
|
Medical Imaging Market, By Modality Mobility |
|
|
Medical Imaging Market, By Patient Type |
|
|
Medical Imaging Market, By Imaging Workflow |
|
|
Medical Imaging Market, By Application |
|
|
Medical Imaging Market, By End User |
|
Frequently Asked Questions
Table of Contents
- 1. Research Methodology and Assumptions
- 1.1. Definitions
- 1.2. Research Design and Approach
- 1.3. Data Collection Methods
- 1.4. Base Estimates and Calculations
- 1.5. Forecasting Models
- 1.5.1. Key Forecast Factors & Impact Analysis
- 1.6. Secondary Research
- 1.6.1. Open Natures
- 1.6.2. Paid Databases
- 1.6.3. Associations
- 1.7. Primary Research
- 1.7.1. Primary Natures
- 1.7.2. Primary Interviews with Stakeholders across Ecosystem
- 2. Executive Summary
- 2.1. Global Medical Imaging Market Outlook
- 2.1.1. Medical Imaging Market Size (Value - US$ Bn), and Forecasts, 2021-2035
- 2.1.2. Compounded Annual Growth Rate Analysis
- 2.1.3. Growth Opportunity Analysis
- 2.1.4. Segmental Share Analysis
- 2.1.5. Geographical Share Analysis
- 2.2. Market Analysis and Facts
- 2.3. Supply-Demand Analysis
- 2.4. Competitive Benchmarking
- 2.5. Go-to- Market Strategy
- 2.5.1. Customer/ End-use Industry Assessment
- 2.5.2. Growth Opportunity Data, 2026-2035
- 2.5.2.1. Regional Data
- 2.5.2.2. Country Data
- 2.5.2.3. Segmental Data
- 2.5.3. Identification of Potential Market Spaces
- 2.5.4. GAP Analysis
- 2.5.5. Potential Attractive Price Points
- 2.5.6. Prevailing Market Risks & Challenges
- 2.5.7. Preferred Sales & Marketing Strategies
- 2.5.8. Key Recommendations and Analysis
- 2.5.9. A Way Forward
- 2.1. Global Medical Imaging Market Outlook
- 3. Industry Data and Premium Insights
- 3.1. Global Healthcare & Pharmaceutical Industry Overview, 2025
- 3.1.1. Healthcare & Pharmaceutical Industry Analysis
- 3.1.2. Key Trends for Healthcare & Pharmaceutical Industry
- 3.1.3. Regional Distribution for Healthcare & Pharmaceutical Industry
- 3.2. Supplier Customer Data
- 3.3. Technology Roadmap and Developments
- 3.1. Global Healthcare & Pharmaceutical Industry Overview, 2025
- 4. Market Overview
- 4.1. Market Dynamics
- 4.1.1. Drivers
- 4.1.1.1. Increasing regulatory policies and healthcare initiatives are driving adoption and deployment of advanced imaging systems globally.
- 4.1.1.2. Rising costs of high-precision imaging components and AI-enabled software are influencing equipment pricing and procurement strategies.
- 4.1.1.3. Governments in Asia Pacific, including India and China, are promoting local production and infrastructure expansion to strengthen regional medical imaging supply chains.
- 4.1.2. Restraints
- 4.1.2.1. Shortage of trained radiologists and imaging technicians can delay diagnosis and reduce operational efficiency.
- 4.1.2.2. Strict safety and radiation compliance requirements may restrict frequent use of certain imaging modalities.
- 4.1.1. Drivers
- 4.2. Key Trend Analysis
- 4.3. Regulatory Framework
- 4.3.1. Key Regulations, Norms, and Subsidies, by Key Countries
- 4.3.2. Tariffs and Standards
- 4.3.3. Impact Analysis of Regulations on the Market
- 4.4. Value Chain Analysis
- 4.5. Cost Structure Analysis
- 4.6. Porter’s Five Forces Analysis
- 4.7. PESTEL Analysis
- 4.8. Global Medical Imaging Market Demand
- 4.8.1. Historical Market Size – Value (US$ Bn), 2020-2024
- 4.8.2. Current and Future Market Size – Value (US$ Bn), 2026–2035
- 4.8.2.1. Y-o-Y Growth Trends
- 4.8.2.2. Absolute $ Opportunity Assessment
- 4.1. Market Dynamics
- 5. Competition Landscape
- 5.1. Competition structure
- 5.1.1. Fragmented v/s consolidated
- 5.2. Company Share Analysis, 2025
- 5.2.1. Global Company Market Share
- 5.2.2. By Region
- 5.2.2.1. North America
- 5.2.2.2. Europe
- 5.2.2.3. Asia Pacific
- 5.2.2.4. Middle East
- 5.2.2.5. Africa
- 5.2.2.6. South America
- 5.3. Product Comparison Matrix
- 5.3.1. Specifications
- 5.3.2. Market Positioning
- 5.3.3. Pricing
- 5.1. Competition structure
- 6. Global Medical Imaging Market Analysis, by Product Type
- 6.1. Key Segment Analysis
- 6.2. Medical Imaging Market Size (Value - US$ Bn), Analysis, and Forecasts, by Product Type, 2021-2035
- 6.2.1. X-ray Imaging Systems
- 6.2.2. Computed Tomography (CT) Scanners
- 6.2.3. Magnetic Resonance Imaging (MRI) Systems
- 6.2.4. Ultrasound Imaging Systems
- 6.2.5. Nuclear Imaging Systems
- 6.2.6. Mammography Systems
- 6.2.7. Fluoroscopy Systems
- 6.2.8. Hybrid Imaging Systems (PET-CT, SPECT-CT, PET-MRI)
- 6.2.9. Others
- 7. Global Medical Imaging Market Analysis, by Technology
- 7.1. Key Segment Analysis
- 7.2. Medical Imaging Market Size (Value - US$ Bn), Analysis, and Forecasts, by Technology, 2021-2035
- 7.2.1. Digital Imaging
- 7.2.2. Analog Imaging
- 7.2.3. 3D Imaging
- 7.2.4. 4D Imaging
- 7.2.5. Molecular Imaging
- 7.2.6. Functional Imaging
- 7.2.7. Hybrid Imaging
- 8. Global Medical Imaging Market Analysis, by Modality Mobility
- 8.1. Key Segment Analysis
- 8.2. Medical Imaging Market Size (Value - US$ Bn), Analysis, and Forecasts, by Modality Mobility, 2021-2035
- 8.2.1. Fixed Imaging Systems
- 8.2.2. Mobile Imaging Systems
- 8.2.3. Portable Imaging Systems
- 9. Global Medical Imaging Market Analysis, by Patient Type
- 9.1. Key Segment Analysis
- 9.2. Medical Imaging Market Size (Value - US$ Bn), Analysis, and Forecasts, by Patient Type, 2021-2035
- 9.2.1. Adult Imaging
- 9.2.2. Pediatric Imaging
- 9.2.3. Geriatric Imaging
- 10. Global Medical Imaging Market Analysis, by Imaging Workflow
- 10.1. Key Segment Analysis
- 10.2. Medical Imaging Market Size (Value - US$ Bn), Analysis, and Forecasts, by Imaging Workflow, 2021-2035
- 10.2.1. Standalone Imaging Systems
- 10.2.2. Integrated Imaging Systems
- 10.2.3. Cloud-Connected Imaging Platforms
- 10.2.4. AI-Integrated Imaging Systems
- 11. Global Medical Imaging Market Analysis, by Application
- 11.1. Key Segment Analysis
- 11.2. Medical Imaging Market Size (Value - US$ Bn), Analysis, and Forecasts, by Application, 2021-2035
- 11.2.1. Cardiology Imaging
- 11.2.2. Oncology Imaging
- 11.2.3. Neurology Imaging
- 11.2.4. Orthopedic Imaging
- 11.2.5. Gastroenterology Imaging
- 11.2.6. Gynecology and Obstetrics Imaging
- 11.2.7. Urology Imaging
- 11.2.8. Pulmonary Imaging
- 11.2.9. Others
- 12. Global Medical Imaging Market Analysis, by End User
- 12.1. Key Segment Analysis
- 12.2. Medical Imaging Market Size (Value - US$ Bn), Analysis, and Forecasts, by End User, 2021-2035
- 12.2.1. Hospitals
- 12.2.2. Diagnostic Imaging Centers
- 12.2.3. Ambulatory Surgical Centers
- 12.2.4. Specialty Clinics
- 12.2.5. Research and Academic Institutes
- 12.2.6. Others
- 13. Global Medical Imaging Market Analysis and Forecasts, by Region
- 13.1. Key Findings
- 13.2. Medical Imaging Market Size (Value - US$ Bn), Analysis, and Forecasts, by Region, 2021-2035
- 13.2.1. North America
- 13.2.2. Europe
- 13.2.3. Asia Pacific
- 13.2.4. Middle East
- 13.2.5. Africa
- 13.2.6. South America
- 14. North America Medical Imaging Market Analysis
- 14.1. Key Segment Analysis
- 14.2. Regional Snapshot
- 14.3. North America Medical Imaging Market Size (Value - US$ Bn), Analysis, and Forecasts, 2021-2035
- 14.3.1. Product Type
- 14.3.2. Technology
- 14.3.3. Modality Mobility
- 14.3.4. Patient Type
- 14.3.5. Imaging Workflow
- 14.3.6. Application
- 14.3.7. End User
- 14.3.8. Country
- 14.3.8.1. USA
- 14.3.8.2. Canada
- 14.3.8.3. Mexico
- 14.4. USA Medical Imaging Market
- 14.4.1. Country Segmental Analysis
- 14.4.2. Product Type
- 14.4.3. Technology
- 14.4.4. Modality Mobility
- 14.4.5. Patient Type
- 14.4.6. Imaging Workflow
- 14.4.7. Application
- 14.4.8. End User
- 14.5. Canada Medical Imaging Market
- 14.5.1. Country Segmental Analysis
- 14.5.2. Product Type
- 14.5.3. Technology
- 14.5.4. Modality Mobility
- 14.5.5. Patient Type
- 14.5.6. Imaging Workflow
- 14.5.7. Application
- 14.5.8. End User
- 14.6. Mexico Medical Imaging Market
- 14.6.1. Country Segmental Analysis
- 14.6.2. Product Type
- 14.6.3. Technology
- 14.6.4. Modality Mobility
- 14.6.5. Patient Type
- 14.6.6. Imaging Workflow
- 14.6.7. Application
- 14.6.8. End User
- 15. Europe Medical Imaging Market Analysis
- 15.1. Key Segment Analysis
- 15.2. Regional Snapshot
- 15.3. Europe Medical Imaging Market Size (Value - US$ Bn), Analysis, and Forecasts, 2021-2035
- 15.3.1. Product Type
- 15.3.2. Technology
- 15.3.3. Modality Mobility
- 15.3.4. Patient Type
- 15.3.5. Imaging Workflow
- 15.3.6. Application
- 15.3.7. End User
- 15.3.8. Country
- 15.3.8.1. Germany
- 15.3.8.2. United Kingdom
- 15.3.8.3. France
- 15.3.8.4. Italy
- 15.3.8.5. Spain
- 15.3.8.6. Netherlands
- 15.3.8.7. Nordic Countries
- 15.3.8.8. Poland
- 15.3.8.9. Russia & CIS
- 15.3.8.10. Rest of Europe
- 15.4. Germany Medical Imaging Market
- 15.4.1. Country Segmental Analysis
- 15.4.2. Product Type
- 15.4.3. Technology
- 15.4.4. Modality Mobility
- 15.4.5. Patient Type
- 15.4.6. Imaging Workflow
- 15.4.7. Application
- 15.4.8. End User
- 15.5. United Kingdom Medical Imaging Market
- 15.5.1. Country Segmental Analysis
- 15.5.2. Product Type
- 15.5.3. Technology
- 15.5.4. Modality Mobility
- 15.5.5. Patient Type
- 15.5.6. Imaging Workflow
- 15.5.7. Application
- 15.5.8. End User
- 15.6. France Medical Imaging Market
- 15.6.1. Country Segmental Analysis
- 15.6.2. Product Type
- 15.6.3. Technology
- 15.6.4. Modality Mobility
- 15.6.5. Patient Type
- 15.6.6. Imaging Workflow
- 15.6.7. Application
- 15.6.8. End User
- 15.7. Italy Medical Imaging Market
- 15.7.1. Country Segmental Analysis
- 15.7.2. Product Type
- 15.7.3. Technology
- 15.7.4. Modality Mobility
- 15.7.5. Patient Type
- 15.7.6. Imaging Workflow
- 15.7.7. Application
- 15.7.8. End User
- 15.8. Spain Medical Imaging Market
- 15.8.1. Country Segmental Analysis
- 15.8.2. Product Type
- 15.8.3. Technology
- 15.8.4. Modality Mobility
- 15.8.5. Patient Type
- 15.8.6. Imaging Workflow
- 15.8.7. Application
- 15.8.8. End User
- 15.9. Netherlands Medical Imaging Market
- 15.9.1. Country Segmental Analysis
- 15.9.2. Product Type
- 15.9.3. Technology
- 15.9.4. Modality Mobility
- 15.9.5. Patient Type
- 15.9.6. Imaging Workflow
- 15.9.7. Application
- 15.9.8. End User
- 15.10. Nordic Countries Medical Imaging Market
- 15.10.1. Country Segmental Analysis
- 15.10.2. Product Type
- 15.10.3. Technology
- 15.10.4. Modality Mobility
- 15.10.5. Patient Type
- 15.10.6. Imaging Workflow
- 15.10.7. Application
- 15.10.8. End User
- 15.11. Poland Medical Imaging Market
- 15.11.1. Country Segmental Analysis
- 15.11.2. Product Type
- 15.11.3. Technology
- 15.11.4. Modality Mobility
- 15.11.5. Patient Type
- 15.11.6. Imaging Workflow
- 15.11.7. Application
- 15.11.8. End User
- 15.12. Russia & CIS Medical Imaging Market
- 15.12.1. Country Segmental Analysis
- 15.12.2. Product Type
- 15.12.3. Technology
- 15.12.4. Modality Mobility
- 15.12.5. Patient Type
- 15.12.6. Imaging Workflow
- 15.12.7. Application
- 15.12.8. End User
- 15.13. Rest of Europe Medical Imaging Market
- 15.13.1. Country Segmental Analysis
- 15.13.2. Product Type
- 15.13.3. Technology
- 15.13.4. Modality Mobility
- 15.13.5. Patient Type
- 15.13.6. Imaging Workflow
- 15.13.7. Application
- 15.13.8. End User
- 16. Asia Pacific Medical Imaging Market Analysis
- 16.1. Key Segment Analysis
- 16.2. Regional Snapshot
- 16.3. Asia Pacific Medical Imaging Market Size (Value - US$ Bn), Analysis, and Forecasts, 2021-2035
- 16.3.1. Product Type
- 16.3.2. Technology
- 16.3.3. Modality Mobility
- 16.3.4. Patient Type
- 16.3.5. Imaging Workflow
- 16.3.6. Application
- 16.3.7. End User
- 16.3.8. Country
- 16.3.8.1. China
- 16.3.8.2. India
- 16.3.8.3. Japan
- 16.3.8.4. South Korea
- 16.3.8.5. Australia and New Zealand
- 16.3.8.6. Indonesia
- 16.3.8.7. Malaysia
- 16.3.8.8. Thailand
- 16.3.8.9. Vietnam
- 16.3.8.10. Rest of Asia Pacific
- 16.4. China Medical Imaging Market
- 16.4.1. Country Segmental Analysis
- 16.4.2. Product Type
- 16.4.3. Technology
- 16.4.4. Modality Mobility
- 16.4.5. Patient Type
- 16.4.6. Imaging Workflow
- 16.4.7. Application
- 16.4.8. End User
- 16.5. India Medical Imaging Market
- 16.5.1. Country Segmental Analysis
- 16.5.2. Product Type
- 16.5.3. Technology
- 16.5.4. Modality Mobility
- 16.5.5. Patient Type
- 16.5.6. Imaging Workflow
- 16.5.7. Application
- 16.5.8. End User
- 16.6. Japan Medical Imaging Market
- 16.6.1. Country Segmental Analysis
- 16.6.2. Product Type
- 16.6.3. Technology
- 16.6.4. Modality Mobility
- 16.6.5. Patient Type
- 16.6.6. Imaging Workflow
- 16.6.7. Application
- 16.6.8. End User
- 16.7. South Korea Medical Imaging Market
- 16.7.1. Country Segmental Analysis
- 16.7.2. Product Type
- 16.7.3. Technology
- 16.7.4. Modality Mobility
- 16.7.5. Patient Type
- 16.7.6. Imaging Workflow
- 16.7.7. Application
- 16.7.8. End User
- 16.8. Australia and New Zealand Medical Imaging Market
- 16.8.1. Country Segmental Analysis
- 16.8.2. Product Type
- 16.8.3. Technology
- 16.8.4. Modality Mobility
- 16.8.5. Patient Type
- 16.8.6. Imaging Workflow
- 16.8.7. Application
- 16.8.8. End User
- 16.9. Indonesia Medical Imaging Market
- 16.9.1. Country Segmental Analysis
- 16.9.2. Product Type
- 16.9.3. Technology
- 16.9.4. Modality Mobility
- 16.9.5. Patient Type
- 16.9.6. Imaging Workflow
- 16.9.7. Application
- 16.9.8. End User
- 16.10. Malaysia Medical Imaging Market
- 16.10.1. Country Segmental Analysis
- 16.10.2. Product Type
- 16.10.3. Technology
- 16.10.4. Modality Mobility
- 16.10.5. Patient Type
- 16.10.6. Imaging Workflow
- 16.10.7. Application
- 16.10.8. End User
- 16.11. Thailand Medical Imaging Market
- 16.11.1. Country Segmental Analysis
- 16.11.2. Product Type
- 16.11.3. Technology
- 16.11.4. Modality Mobility
- 16.11.5. Patient Type
- 16.11.6. Imaging Workflow
- 16.11.7. Application
- 16.11.8. End User
- 16.12. Vietnam Medical Imaging Market
- 16.12.1. Country Segmental Analysis
- 16.12.2. Product Type
- 16.12.3. Technology
- 16.12.4. Modality Mobility
- 16.12.5. Patient Type
- 16.12.6. Imaging Workflow
- 16.12.7. Application
- 16.12.8. End User
- 16.13. Rest of Asia Pacific Medical Imaging Market
- 16.13.1. Country Segmental Analysis
- 16.13.2. Product Type
- 16.13.3. Technology
- 16.13.4. Modality Mobility
- 16.13.5. Patient Type
- 16.13.6. Imaging Workflow
- 16.13.7. Application
- 16.13.8. End User
- 17. Middle East Medical Imaging Market Analysis
- 17.1. Key Segment Analysis
- 17.2. Regional Snapshot
- 17.3. Middle East Medical Imaging Market Size (Value - US$ Bn), Analysis, and Forecasts, 2021-2035
- 17.3.1. Product Type
- 17.3.2. Technology
- 17.3.3. Modality Mobility
- 17.3.4. Patient Type
- 17.3.5. Imaging Workflow
- 17.3.6. Application
- 17.3.7. End User
- 17.3.8. Country
- 17.3.8.1. Turkey
- 17.3.8.2. UAE
- 17.3.8.3. Saudi Arabia
- 17.3.8.4. Israel
- 17.3.8.5. Rest of Middle East
- 17.4. Turkey Medical Imaging Market
- 17.4.1. Country Segmental Analysis
- 17.4.2. Product Type
- 17.4.3. Technology
- 17.4.4. Modality Mobility
- 17.4.5. Patient Type
- 17.4.6. Imaging Workflow
- 17.4.7. Application
- 17.4.8. End User
- 17.5. UAE Medical Imaging Market
- 17.5.1. Country Segmental Analysis
- 17.5.2. Product Type
- 17.5.3. Technology
- 17.5.4. Modality Mobility
- 17.5.5. Patient Type
- 17.5.6. Imaging Workflow
- 17.5.7. Application
- 17.5.8. End User
- 17.6. Saudi Arabia Medical Imaging Market
- 17.6.1. Country Segmental Analysis
- 17.6.2. Product Type
- 17.6.3. Technology
- 17.6.4. Modality Mobility
- 17.6.5. Patient Type
- 17.6.6. Imaging Workflow
- 17.6.7. Application
- 17.6.8. End User
- 17.7. Israel Medical Imaging Market
- 17.7.1. Country Segmental Analysis
- 17.7.2. Product Type
- 17.7.3. Technology
- 17.7.4. Modality Mobility
- 17.7.5. Patient Type
- 17.7.6. Imaging Workflow
- 17.7.7. Application
- 17.7.8. End User
- 17.8. Rest of Middle East Medical Imaging Market
- 17.8.1. Country Segmental Analysis
- 17.8.2. Product Type
- 17.8.3. Technology
- 17.8.4. Modality Mobility
- 17.8.5. Patient Type
- 17.8.6. Imaging Workflow
- 17.8.7. Application
- 17.8.8. End User
- 18. Africa Medical Imaging Market Analysis
- 18.1. Key Segment Analysis
- 18.2. Regional Snapshot
- 18.3. Africa Medical Imaging Market Size (Value - US$ Bn), Analysis, and Forecasts, 2021-2035
- 18.3.1. Product Type
- 18.3.2. Technology
- 18.3.3. Modality Mobility
- 18.3.4. Patient Type
- 18.3.5. Imaging Workflow
- 18.3.6. Application
- 18.3.7. End User
- 18.3.8. Country
- 18.3.8.1. South Africa
- 18.3.8.2. Egypt
- 18.3.8.3. Nigeria
- 18.3.8.4. Algeria
- 18.3.8.5. Rest of Africa
- 18.4. South Africa Medical Imaging Market
- 18.4.1. Country Segmental Analysis
- 18.4.2. Product Type
- 18.4.3. Technology
- 18.4.4. Modality Mobility
- 18.4.5. Patient Type
- 18.4.6. Imaging Workflow
- 18.4.7. Application
- 18.4.8. End User
- 18.5. Egypt Medical Imaging Market
- 18.5.1. Country Segmental Analysis
- 18.5.2. Product Type
- 18.5.3. Technology
- 18.5.4. Modality Mobility
- 18.5.5. Patient Type
- 18.5.6. Imaging Workflow
- 18.5.7. Application
- 18.5.8. End User
- 18.6. Nigeria Medical Imaging Market
- 18.6.1. Country Segmental Analysis
- 18.6.2. Product Type
- 18.6.3. Technology
- 18.6.4. Modality Mobility
- 18.6.5. Patient Type
- 18.6.6. Imaging Workflow
- 18.6.7. Application
- 18.6.8. End User
- 18.7. Algeria Medical Imaging Market
- 18.7.1. Country Segmental Analysis
- 18.7.2. Product Type
- 18.7.3. Technology
- 18.7.4. Modality Mobility
- 18.7.5. Patient Type
- 18.7.6. Imaging Workflow
- 18.7.7. Application
- 18.7.8. End User
- 18.8. Rest of Africa Medical Imaging Market
- 18.8.1. Country Segmental Analysis
- 18.8.2. Product Type
- 18.8.3. Technology
- 18.8.4. Modality Mobility
- 18.8.5. Patient Type
- 18.8.6. Imaging Workflow
- 18.8.7. Application
- 18.8.8. End User
- 19. South America Medical Imaging Market Analysis
- 19.1. Key Segment Analysis
- 19.2. Regional Snapshot
- 19.3. South America Medical Imaging Market Size (Value - US$ Bn), Analysis, and Forecasts, 2021-2035
- 19.3.1. Product Type
- 19.3.2. Technology
- 19.3.3. Modality Mobility
- 19.3.4. Patient Type
- 19.3.5. Imaging Workflow
- 19.3.6. Application
- 19.3.7. End User
- 19.3.8. Country
- 19.3.8.1. Brazil
- 19.3.8.2. Argentina
- 19.3.8.3. Rest of South America
- 19.4. Brazil Medical Imaging Market
- 19.4.1. Country Segmental Analysis
- 19.4.2. Product Type
- 19.4.3. Technology
- 19.4.4. Modality Mobility
- 19.4.5. Patient Type
- 19.4.6. Imaging Workflow
- 19.4.7. Application
- 19.4.8. End User
- 19.5. Argentina Medical Imaging Market
- 19.5.1. Country Segmental Analysis
- 19.5.2. Product Type
- 19.5.3. Technology
- 19.5.4. Modality Mobility
- 19.5.5. Patient Type
- 19.5.6. Imaging Workflow
- 19.5.7. Application
- 19.5.8. End User
- 19.6. Rest of South America Medical Imaging Market
- 19.6.1. Country Segmental Analysis
- 19.6.2. Product Type
- 19.6.3. Technology
- 19.6.4. Modality Mobility
- 19.6.5. Patient Type
- 19.6.6. Imaging Workflow
- 19.6.7. Application
- 19.6.8. End User
- 20. Key Players/ Company Profile
- 20.1. Agfa‑Gevaert Group
- 20.1.1. Company Details/ Overview
- 20.1.2. Company Financials
- 20.1.3. Key Customers and Competitors
- 20.1.4. Business/ Industry Portfolio
- 20.1.5. Product Portfolio/ Specification Details
- 20.1.6. Pricing Data
- 20.1.7. Strategic Overview
- 20.1.8. Recent Developments
- 20.2. Analogic Corporation
- 20.3. Canon Medical Systems Corporation
- 20.4. Carestream Health, Inc.
- 20.5. DRGEM Corporation
- 20.6. Esaote S.p.A.
- 20.7. FUJIFILM Holdings Corporation
- 20.8. GE HealthCare Technologies Inc.
- 20.9. Hitachi, Ltd.
- 20.10. Hologic, Inc.
- 20.11. Konica Minolta, Inc.
- 20.12. Koninklijke Philips N.V.
- 20.13. Mindray Medical International Limited
- 20.14. Planmed Oy
- 20.15. Samsung Medison Co., Ltd.
- 20.16. Shanghai United Imaging Healthcare Co., Ltd.
- 20.17. Shimadzu Corporation
- 20.18. Siemens Healthineers AG
- 20.19. Varex Imaging Corporation
- 20.20. Vieworks Co., Ltd.
- 20.21. Other Key Players
- 20.1. Agfa‑Gevaert Group
Note* - This is just tentative list of players. While providing the report, we will cover more number of players based on their revenue and share for each geography
Research Design
Our research design integrates both demand-side and supply-side analysis through a balanced combination of primary and secondary research methodologies. By utilizing both bottom-up and top-down approaches alongside rigorous data triangulation methods, we deliver robust market intelligence that supports strategic decision-making.
MarketGenics' comprehensive research design framework ensures the delivery of accurate, reliable, and actionable market intelligence. Through the integration of multiple research approaches, rigorous validation processes, and expert analysis, we provide our clients with the insights needed to make informed strategic decisions and capitalize on market opportunities.

MarketGenics leverages a dedicated industry panel of experts and a comprehensive suite of paid databases to effectively collect, consolidate, and analyze market intelligence.
Our approach has consistently proven to be reliable and effective in generating accurate market insights, identifying key industry trends, and uncovering emerging business opportunities.
Through both primary and secondary research, we capture and analyze critical company-level data such as manufacturing footprints, including technical centers, R&D facilities, sales offices, and headquarters.
Our expert panel further enhances our ability to estimate market size for specific brands based on validated field-level intelligence.
Our data mining techniques incorporate both parametric and non-parametric methods, allowing for structured data collection, sorting, processing, and cleaning.
Demand projections are derived from large-scale data sets analyzed through proprietary algorithms, culminating in robust and reliable market sizing.
Research Approach
The bottom-up approach builds market estimates by starting with the smallest addressable market units and systematically aggregating them to create comprehensive market size projections.
This method begins with specific, granular data points and builds upward to create the complete market landscape.
Customer Analysis → Segmental Analysis → Geographical Analysis
The top-down approach starts with the broadest possible market data and systematically narrows it down through a series of filters and assumptions to arrive at specific market segments or opportunities.
This method begins with the big picture and works downward to increasingly specific market slices.
TAM → SAM → SOM


Research Methods
Desk / Secondary Research
While analysing the market, we extensively study secondary sources, directories, and databases to identify and collect information useful for this technical, market-oriented, and commercial report. Secondary sources that we utilize are not only the public sources, but it is a combination of Open Source, Associations, Paid Databases, MG Repository & Knowledgebase, and others.
- Company websites, annual reports, financial reports, broker reports, and investor presentations
- National government documents, statistical databases and reports
- News articles, press releases and web-casts specific to the companies operating in the market, Magazines, reports, and others
- We gather information from commercial data sources for deriving company specific data such as segmental revenue, share for geography, product revenue, and others
- Internal and external proprietary databases (industry-specific), relevant patent, and regulatory databases
- Governing Bodies, Government Organizations
- Relevant Authorities, Country-specific Associations for Industries
We also employ the model mapping approach to estimate the product level market data through the players' product portfolio
Primary Research
Primary research/ interviews is vital in analyzing the market. Most of the cases involves paid primary interviews. Primary sources include primary interviews through e-mail interactions, telephonic interviews, surveys as well as face-to-face interviews with the different stakeholders across the value chain including several industry experts.
| Type of Respondents | Number of Primaries |
|---|---|
| Tier 2/3 Suppliers | ~20 |
| Tier 1 Suppliers | ~25 |
| End-users | ~25 |
| Industry Expert/ Panel/ Consultant | ~30 |
| Total | ~100 |
MG Knowledgebase
• Repository of industry blog, newsletter and case studies
• Online platform covering detailed market reports, and company profiles
Forecasting Factors and Models
Forecasting Factors
- Historical Trends – Past market patterns, cycles, and major events that shaped how markets behave over time. Understanding past trends helps predict future behavior.
- Industry Factors – Specific characteristics of the industry like structure, regulations, and innovation cycles that affect market dynamics.
- Macroeconomic Factors – Economic conditions like GDP growth, inflation, and employment rates that affect how much money people have to spend.
- Demographic Factors – Population characteristics like age, income, and location that determine who can buy your product.
- Technology Factors – How quickly people adopt new technology and how much technology infrastructure exists.
- Regulatory Factors – Government rules, laws, and policies that can help or restrict market growth.
- Competitive Factors – Analyzing competition structure such as degree of competition and bargaining power of buyers and suppliers.
Forecasting Models / Techniques
Multiple Regression Analysis
- Identify and quantify factors that drive market changes
- Statistical modeling to establish relationships between market drivers and outcomes
Time Series Analysis – Seasonal Patterns
- Understand regular cyclical patterns in market demand
- Advanced statistical techniques to separate trend, seasonal, and irregular components
Time Series Analysis – Trend Analysis
- Identify underlying market growth patterns and momentum
- Statistical analysis of historical data to project future trends
Expert Opinion – Expert Interviews
- Gather deep industry insights and contextual understanding
- In-depth interviews with key industry stakeholders
Multi-Scenario Development
- Prepare for uncertainty by modeling different possible futures
- Creating optimistic, pessimistic, and most likely scenarios
Time Series Analysis – Moving Averages
- Sophisticated forecasting for complex time series data
- Auto-regressive integrated moving average models with seasonal components
Econometric Models
- Apply economic theory to market forecasting
- Sophisticated economic models that account for market interactions
Expert Opinion – Delphi Method
- Harness collective wisdom of industry experts
- Structured, multi-round expert consultation process
Monte Carlo Simulation
- Quantify uncertainty and probability distributions
- Thousands of simulations with varying input parameters
Research Analysis
Our research framework is built upon the fundamental principle of validating market intelligence from both demand and supply perspectives. This dual-sided approach ensures comprehensive market understanding and reduces the risk of single-source bias.
Demand-Side Analysis: We understand end-user/application behavior, preferences, and market needs along with the penetration of the product for specific application.
Supply-Side Analysis: We estimate overall market revenue, analyze the segmental share along with industry capacity, competitive landscape, and market structure.
Validation & Evaluation
Data triangulation is a validation technique that uses multiple methods, sources, or perspectives to examine the same research question, thereby increasing the credibility and reliability of research findings. In market research, triangulation serves as a quality assurance mechanism that helps identify and minimize bias, validate assumptions, and ensure accuracy in market estimates.
- Data Source Triangulation – Using multiple data sources to examine the same phenomenon
- Methodological Triangulation – Using multiple research methods to study the same research question
- Investigator Triangulation – Using multiple researchers or analysts to examine the same data
- Theoretical Triangulation – Using multiple theoretical perspectives to interpret the same data

Custom Market Research Services
We will customise the research for you, in case the report listed above does not meet your requirements.
Get 10% Free Customisation