Municipal Pump Market Size, Share & Trends Analysis Report by Pump Type (Centrifugal Pumps, Positive Displacement Pumps, Submersible Pumps, Diaphragm Pumps, Progressive Cavity Pumps, Peristaltic Pumps, Axial Flow Pumps, Mixed Flow Pumps, Reciprocating Pumps, Others), Material, Operation Mode, Installation Type, Capacity Range, Flow Rate Range, Application, End-Use Function, Distribution Channel and Geography (North America, Europe, Asia Pacific, Middle East, Africa, and South America) – Global Industry Data, Trends, and Forecasts, 2026–2035
|
Market Structure & Evolution |
|
|
Segmental Data Insights |
|
|
Demand Trends |
|
|
Competitive Landscape |
|
|
Strategic Development |
|
|
Future Outlook & Opportunities |
|
Municipal Pump Market Size, Share, and Growth
The global municipal pump market is experiencing robust growth, with its estimated value of USD 3.8 billion in the year 2025 and USD 5.5 billion by the period 2035, registering a CAGR of 3.8% during the forecast period.

Through company communications and product announcements, Xylem Inc. has indicated that its intelligent municipal pumping and water infrastructure solutions aim to assist utilities in the following ways: increasing operational efficiency, cutting down on non-revenue water, and improving service reliability. The company points out that the use of connected pumps, real-time analytics, and digital platforms together makes it possible for cities to upgrade old systems, get the most out of asset performance, and speed up the digital transformation process in water and wastewater networks.
The main contributors to the growth in the municipal pump market worldwide is the refurbishment of the old water and wastewater infrastructure coupled with the introduction of energy-efficient and reliable pumping technologies. There are a number of significant upgrades in smart municipal pumping systems, such as the use of variable-speed drives, condition-monitoring sensors, and remote-control capabilities, which utilities have been implementing. These innovations have been proven to achieve the improved operational efficiency, energy savings and lower lifecycle costs that were expected in the pilots reported.
Furthermore, urbanization, population growth, and the extension of municipal water and wastewater networks are the main factors that increase the demand for high-capacity and resilient pumping solutions. Utilities are thus purchasing the latest pumping stations that will not only water large volumes, but also decrease non-revenue water and guarantee the continuous provision of services.
Besides that, tough regulations on water quality, wastewater discharge, and energy efficiency, among others, are forcing municipalities to change their legacy pumps to the modern, digitally enabled ones that are compliant. The triple play of technological innovation, infrastructure investment, and regulatory pressure, which spurs demand in the municipal pumping market, is doing much to improve system reliability, sustainability, and public health.
The municipal pump market worldwide is full of contiguous opportunities such as smart water management platforms, pump condition monitoring and predictive maintenance software, digital twin solutions for water networks, energy-efficient motor and drive systems, and integrated control and automation solutions for pumping stations. Manufacturers and solution providers can tap into these adjacent markets to bolster their municipal water infrastructure offerings, get operational performance improvement for the utilities, and gradually become major players in the broader smart water and wastewater ecosystem while increasing their revenue streams.

Municipal Pump Market Dynamics and Trends
Driver: Increasing Climate Resilience and Infrastructure Funding Driving Adoption of Advanced Municipal Pumping Systems
-
The municipal pump market for the next five years is mainly influenced by climate change adaptation requirements and funding for public infrastructure as cities are attempting to alleviate flooding, drought stress, and aging water networks by using reliable pumping solutions. For instance, in Gorakhpur, Uttar Pradesh, a pioneering integrated urban flood control system with automated pumping stations and real, time monitoring has achieved a reduction in pump downtime by more than 60% and shortened the response time for waterlogging incidents.
- Large, scale projects for water supply extension in India, for instance, the Rajasthan government's green light for drinking water projects such as intake pumping stations and distribution networks, are evidence of how government investment is the main driver of demand for modern municipal pumps that will ensure universal water access.
- On the other hand, utilities in mature markets like the UK are not leaving behind the pace as they are rapidly upgrading the infrastructure. For example, Thames Water engaged with Xylem to refurbish 130 minor sewage pump stations with advanced, resilient pump systems, thus, they improved operational reliability across the old assets they had inherited.
- The frequency of climate extremes has brought high, capacity stormwater and drainage pumps with predictive control to be considered as indispensable public assets rather than mere optional upgrades which has led to an increase in municipal procurement activity.
Restraint: Capital Intensity and Integration Challenges Slowing Widespread Modernization
-
Despite the market drivers being very strong, the modernization speed is still kept low due to the high capital costs that are needed to either replace or retrofit the legacy pumping infrastructure. There is also a lengthening of municipal procurement cycles and approval processes. Many cities that are small municipalities in particular, have pump houses and pipelines that have been in operation for decades.
- These pose integration challenges when one wants to introduce digitally enabled or automated pumping systems, thus it is necessary to significantly redesign the civil and electrical infrastructure even before it is possible to deploy the new pumps. Kochi is a case where contractual and funding issues are causing limitations to rapid rollout: delays in advancing funds for a major water supply project have resulted in the slow takeover and modernization of pump houses and pipeline maintenance by a private operator under a program funded by the Asian Development Bank.
- The costs of regulatory compliance and the need for skilled technicians to operate advanced pump controls are among the factors that slow down the adoption rate, especially small utilities that have a limited budget.
Opportunity: Expansion of Decentralized and Adaptive Water Systems in Emerging Urban Areas
-
Urbanization and peri, urban development are opening up various new ways of decentralized water supply, sewer pumping, and localized wastewater handling systems that use compact, modular municipal pumps specifically designed for smaller service zones or rapidly developing neighborhoods.
- Pipeline and water network extension works, such as the installation of thousands of kilometers of sewerage and reuse pipelines in Indian cities, which is going on, are the main reasons for the parallel investment in pumping stations that are required to convey water and wastewater across long networks.
- The developing countries are progressively integrating smart pumping and SCADA, linked stations in their new infrastructure projects under national mission programs, thereby creating a larger market for telemetry, enabled pump solutions.
- Africa and Asia, where access to water has been a problem, are now benefiting from the modernization of municipal pumps, which is becoming more widespread due to the provision of funds and technical assistance by development banks and international agencies for water system upgrades.
Key Trend: Integration of Digital, Predictive, and Energy-Efficient Technologies
-
A key trend that is significantly influencing the municipal pump market over the next few years is the implementation digital technologies and predictive technologies, which are supported by the Internet of Things (IoT) enabled sensors, SCADA connectivity, variable frequency drives, and cloud, linked performance dashboards. These technologies give utilities, the opportunity to monitor the health of the pump in real, time, detection of the issue at its early stage, and also optimizing energy use.
- Moreover, the use of cloud, linked pump monitoring systems by utilities in Germany and Singapore to reduce unplanned downtime and operational costs by up to 25% is a good example of how digital transformation is leading to operational and financial benefits that are measurable. New municipal pump installations are gradually being outfitted with energy, efficient motor technologies and variable frequency drives that contribute to the reduction of electricity consumption and operational expenses while also satisfying the requirements of sustainability goals.
- The advent of digital twins and AI, augmented predictive maintenance has led to advanced fault detection and lifecycle optimization for water pumping infrastructure, thus contributing to the accelerated transition towards data, driven municipal water operations.
Municipal-Pump-Market Analysis and Segmental Data
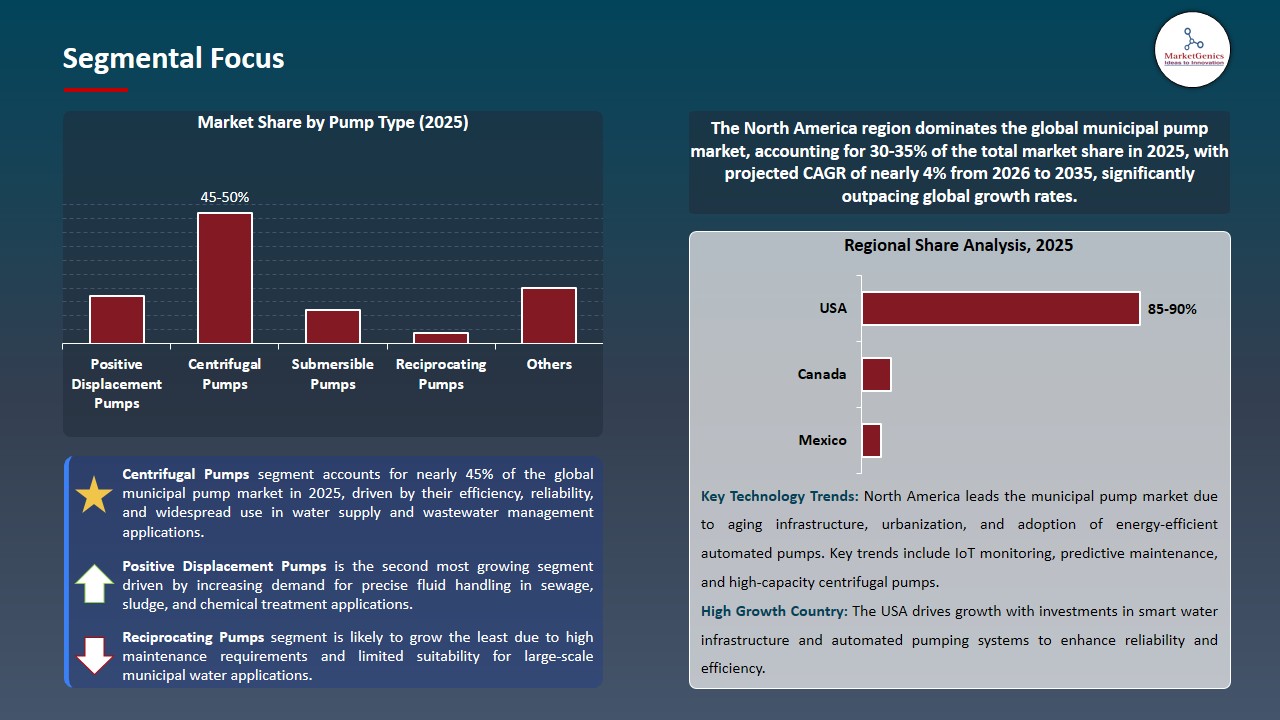
“Centrifugal Pumps Dominate Global Municipal Pump Market amid Rising Urban Water Infrastructure Investments"
-
The segment of centrifugal pumps is at the forefront of the global municipal pump market, which is a result of the continuous investments that have been made in urban water supply, wastewater treatment, and stormwater management infrastructure. Due to the ability of centrifugal pumps to handle large flow rates efficiently, having a simple mechanical design, and being suitable for continuous, duty operations in drinking water distribution, sewage transfer, and flood control applications, they are the most widely preferred by municipalities. Although cities expand and upgrade their aging infrastructures, these pumps continue to be the core of municipal systems where reliability, scalability, and cost, effective operation are of primary importance.
- The recent developments thus confirm the supremacy. To cope with the increasing water demand and stricter service reliability standards, municipal utilities in different parts of the world are progressively installing high, capacity horizontal and vertical centrifugal pumps in new pumping stations and infrastructure rehabilitation projects. Besides, the use of variable, speed drives and modern control systems has further facilitated the acceptance of centrifugal pumps, allowing utilities to energy consumption to the maximum, meet fluctuating demand, and adhere to efficiency and sustainability regulations.
- Moreover, their flawless execution over a wide range of operating conditions has made them the most suitable option for municipalities that deal with high, volume, low, to, medium head applications, thus, they have strengthened their leading position in the global municipal pump market.
“North America Dominates Municipal Pump Market amid Aging Water Infrastructure Upgrades and Stringent Regulatory Standards”
-
North America is the biggest municipal pumps market which is required by the extensively aging water and wastewater infrastructures, a high demand for replacement, and a sustained public investment in system rehabilitation in the United States and Canada. Many of the region’s municipal pumping facilities are old for several decades, thus utilities are changing pumps in order to increase reliability, energy efficiency, and to meet modern performance standards.
- Strict regulatory frameworks like the U.S. Environmental Protection Agency’s Clean Water Act and Safe Drinking Water Act, as well as Canada’s Wastewater Systems Effluent Regulations, are forcing municipalities to invest in water distribution, sewage conveyance, and stormwater management, compliant pumping solutions. These regulations pay a lot of attention to operational reliability, overflow prevention, and energy efficiency, thus increasing the demand for advanced municipal pumping systems.
- The major implementations in the region are large, scale pump replacement and modernization programs by municipal utilities and water authorities, which include high, capacity centrifugal pumps, submersible wastewater pumps, and flood control pumping stations. Utilities are also installing variable, speed drives and advanced control systems to cut energy use and operating costs, which is a reflection of North America’s trend in the adoption of efficient and regulation, compliant municipal pumping infrastructure.
Municipal-Pump-Market Ecosystem
The municipal pump market is moderately consolidated, where the top players such as Xylem Inc., Grundfos, Sulzer Ltd., Flowserve Corporation, KSB SE & Co. KGaA, and Wilo SE dominate global demand by their scale, strong service networks, and advanced pumping technologies. These companies use digital monitoring, energy, efficient hydraulic designs, and automation to maintain their competitive leadership in water supply, wastewater, and stormwater applications.
Key players are increasingly turning their attention to specially designed municipal solutions such as submersible wastewater pumps, non, clog centrifugal designs, smart control panels, and condition, monitoring platforms for municipal utilities. The innovations like Grundfos iSOLUTIONS, Xylem Flygt smart pumping systems, and Sulzer wastewater analytics tools illustrate how system reliability and lifecycle performance are getting enhanced through niche innovation.
Government bodies and research institutions are a major factor in the development of municipal pumping technologies. In August 2024, water utilities in the U.S. sped up pump upgrades under infrastructure programs funded by the federal government, thus encouraging the use of energy, efficient motors and digitally controlled pumping stations to lessen water losses and emissions.
Market leaders are also putting a strong emphasis on portfolio expansion and integrated solutions as a way of sustainability and operational efficiency. For instance, in September 2024, Xylem broadened the use of AI, enabled pump monitoring in municipal networks to facilitate predictive maintenance and to bring about measurable reductions in the time when the equipment cannot be used, thus consolidating the market’s move towards intelligent, data, driven pumping infrastructure.

Recent Development and Strategic Overview:
-
In June 2025, Grundfos took its digital municipal pumping portfolio to the next level by adding remote monitoring and control features for water and wastewater utilities. These upgrades allow utilities to track performance in real, time, receive automated alerts, and optimize energy use across the pumping stations. The offering is a comprehensive sensor, variable speed drive, and cloud analytics package that enables predictive maintenance, less unplanned downtime, and enhanced system reliability from the municipal operator’s perspective.
- In October 2025, Sulzer unveiled a set of advanced features for condition monitoring and analytics of municipal wastewater pumps that leverage vibration analysis, hydraulic performance monitoring, and data, driven diagnostics. With this improvement, utility companies can spot clogging, wear, and efficiency loss symptoms at the very beginning, thus providing the groundwork for the transition to proactive maintenance, extending the service life of pumps, and reducing the total cost of ownership across municipal pumping networks.
Report Scope
|
Attribute |
Detail |
|
Market Size in 2025 |
USD 3.8 Bn |
|
Market Forecast Value in 2035 |
USD 5.5 Bn |
|
Growth Rate (CAGR) |
3.8% |
|
Forecast Period |
2026 – 2035 |
|
Historical Data Available for |
2021 – 2024 |
|
Market Size Units |
USD Bn for Value Thousand Units for Volume |
|
Report Format |
Electronic (PDF) + Excel |
|
Regions and Countries Covered |
|||||
|
North America |
Europe |
Asia Pacific |
Middle East |
Africa |
South America |
|
|
|
|
|
|
|
Companies Covered |
|||||
|
|
|
|
|
|
Municipal-Pump-Market Segmentation and Highlights
|
Segment |
Sub-segment |
|
Municipal Pump Market, By Pump Type |
|
|
Municipal Pump Market, By Material |
|
|
Municipal Pump Market, By Operation Mode |
|
|
Municipal Pump Market, By Installation Type |
|
|
Municipal Pump Market, By Capacity Range |
|
|
Municipal Pump Market, By Flow Rate Range |
|
|
Municipal Pump Market, By Application |
|
|
Municipal Pump Market, By End-Use Function |
|
|
Municipal Pump Market, By Distribution Channel |
|
Frequently Asked Questions
Table of Contents
- 1. Research Methodology and Assumptions
- 1.1. Definitions
- 1.2. Research Design and Approach
- 1.3. Data Collection Methods
- 1.4. Base Estimates and Calculations
- 1.5. Forecasting Models
- 1.5.1. Key Forecast Factors & Impact Analysis
- 1.6. Secondary Research
- 1.6.1. Open Sources
- 1.6.2. Paid Databases
- 1.6.3. Associations
- 1.7. Primary Research
- 1.7.1. Primary Sources
- 1.7.2. Primary Interviews with Stakeholders across Ecosystem
- 2. Executive Summary
- 2.1. Global Municipal Pump Market Outlook
- 2.1.1. Municipal Pump Market Size (Value - US$ Bn and Volume - Thousand Units), and Forecasts, 2021-2035
- 2.1.2. Compounded Annual Growth Rate Analysis
- 2.1.3. Growth Opportunity Analysis
- 2.1.4. Segmental Share Analysis
- 2.1.5. Geographical Share Analysis
- 2.2. Market Analysis and Facts
- 2.3. Supply-Demand Analysis
- 2.4. Competitive Benchmarking
- 2.5. Go-to- Market Strategy
- 2.5.1. Customer/ End-use Industry Assessment
- 2.5.2. Growth Opportunity Data, 2026-2035
- 2.5.2.1. Regional Data
- 2.5.2.2. Country Data
- 2.5.2.3. Segmental Data
- 2.5.3. Identification of Potential Market Spaces
- 2.5.4. GAP Analysis
- 2.5.5. Potential Attractive Price Points
- 2.5.6. Prevailing Market Risks & Challenges
- 2.5.7. Preferred Sales & Marketing Strategies
- 2.5.8. Key Recommendations and Analysis
- 2.5.9. A Way Forward
- 2.1. Global Municipal Pump Market Outlook
- 3. Industry Data and Premium Insights
- 3.1. Global Industrial Machinery Ecosystem Overview, 2025
- 3.1.1. Industrial Machinery Industry Analysis
- 3.1.2. Key Trends for Industrial Machinery Industry
- 3.1.3. Regional Distribution for Industrial Machinery Industry
- 3.2. Supplier Customer Data
- 3.3. Technology Roadmap and Developments
- 3.4. Trade Analysis
- 3.4.1. Import & Export Analysis, 2025
- 3.4.2. Top Importing Countries
- 3.4.3. Top Exporting Countries
- 3.5. Trump Tariff Impact Analysis
- 3.5.1. Manufacturer
- 3.5.1.1. Based on the component & Raw material
- 3.5.2. Supply Chain
- 3.5.3. End Consumer
- 3.5.1. Manufacturer
- 3.6. Raw Material Analysis
- 3.1. Global Industrial Machinery Ecosystem Overview, 2025
- 4. Market Overview
- 4.1. Market Dynamics
- 4.1.1. Drivers
- 4.1.1.1. Rising demand for energy-efficient and automated municipal pumping systems to reduce operating costs and improve reliability.
- 4.1.1.2. Growing adoption of smart pumps with IoT-enabled monitoring, predictive maintenance, and real-time performance analytics.
- 4.1.1.3. Increasing public investments in water supply, wastewater treatment, and climate-resilient municipal infrastructure.
- 4.1.2. Restraints
- 4.1.2.1. High capital and lifecycle costs associated with advanced municipal pump systems and digital upgrades.
- 4.1.2.2. Integration challenges with aging water infrastructure and legacy control systems.
- 4.1.1. Drivers
- 4.2. Key Trend Analysis
- 4.3. Regulatory Framework
- 4.3.1. Key Regulations, Norms, and Subsidies, by Key Countries
- 4.3.2. Tariffs and Standards
- 4.3.3. Impact Analysis of Regulations on the Market
- 4.4. Value Chain Analysis
- 4.4.1. Raw Material Suppliers
- 4.4.2. Municipal Pump Manufactures
- 4.4.3. Dealers and Distributors
- 4.4.4. End Users
- 4.5. Cost Structure Analysis
- 4.5.1. Parameter’s Share for Cost Associated
- 4.5.2. COGP vs COGS
- 4.5.3. Profit Margin Analysis
- 4.6. Pricing Analysis
- 4.6.1. Regional Pricing Analysis
- 4.6.2. Segmental Pricing Trends
- 4.6.3. Factors Influencing Pricing
- 4.7. Porter’s Five Forces Analysis
- 4.8. PESTEL Analysis
- 4.9. Global Municipal Pump Market Demand
- 4.9.1. Historical Market Size –Value (US$ Bn) and Volume (Thousand Units), 2020-2024
- 4.9.2. Current and Future Market Size –Value (US$ Bn) and Volume (Thousand Units), 2026–2035
- 4.9.2.1. Y-o-Y Growth Trends
- 4.9.2.2. Absolute $ Opportunity Assessment
- 4.1. Market Dynamics
- 5. Competition Landscape
- 5.1. Competition structure
- 5.1.1. Fragmented v/s consolidated
- 5.2. Company Share Analysis, 2025
- 5.2.1. Global Company Market Share
- 5.2.2. By Region
- 5.2.2.1. North America
- 5.2.2.2. Europe
- 5.2.2.3. Asia Pacific
- 5.2.2.4. Middle East
- 5.2.2.5. Africa
- 5.2.2.6. South America
- 5.3. Product Comparison Matrix
- 5.3.1. Specifications
- 5.3.2. Market Positioning
- 5.3.3. Pricing
- 5.1. Competition structure
- 6. Global Municipal Pump Market Analysis, by Pump Type
- 6.1. Key Segment Analysis
- 6.2. Municipal Pump Market Size (Value - US$ Bn and Volume - Thousand Units), Analysis, and Forecasts, by Pump Type, 2021-2035
- 6.2.1. Centrifugal Pumps
- 6.2.2. Positive Displacement Pumps
- 6.2.3. Submersible Pumps
- 6.2.4. Diaphragm Pumps
- 6.2.5. Progressive Cavity Pumps
- 6.2.6. Peristaltic Pumps
- 6.2.7. Axial Flow Pumps
- 6.2.8. Mixed Flow Pumps
- 6.2.9. Reciprocating Pumps
- 6.2.10. Others
- 7. Global Municipal Pump Market Analysis, by Material
- 7.1. Key Segment Analysis
- 7.2. Municipal Pump Market Size (Value - US$ Bn), Analysis, and Forecasts, by Material, 2021-2035
- 7.2.1. Cast Iron
- 7.2.2. Stainless Steel
- 7.2.3. High-Chrome Alloy
- 7.2.4. Bronze
- 7.2.5. Polymer/Composite Pumps
- 7.2.6. Others
- 8. Global Municipal Pump Market Analysis, by Operation Mode
- 8.1. Key Segment Analysis
- 8.2. Municipal Pump Market Size (Value - US$ Bn and Volume - Thousand Units), Analysis, and Forecasts, by Operation Mode, 2021-2035
- 8.2.1. Electric-Driven Pumps
- 8.2.2. Diesel-Driven Pumps
- 8.2.3. Solar-Powered Pumps
- 8.2.4. Hydraulic-Driven Pumps
- 9. Global Municipal Pump Market Analysis, by Installation Type
- 9.1. Key Segment Analysis
- 9.2. Municipal Pump Market Size (Value - US$ Bn and Volume - Thousand Units), Analysis, and Forecasts, by Installation Type, 2021-2035
- 9.2.1. Submersible Installation
- 9.2.2. Surface (End-Suction) Installation
- 9.2.3. Vertical Turbine Installation
- 9.2.4. Inline Installation
- 9.2.5. Others
- 10. Global Municipal Pump Market Analysis, by Capacity Range
- 10.1. Key Segment Analysis
- 10.2. Municipal Pump Market Size (Value - US$ Bn and Volume - Thousand Units), Analysis, and Forecasts, by Capacity Range, 2021-2035
- 10.2.1. Low-Capacity Pumps
- 10.2.2. Medium-Capacity Pumps
- 10.2.3. High-Capacity Pumps
- 10.2.4. Extra-High-Capacity Pumps
- 11. Global Municipal Pump Market Analysis, by Flow Rate Range
- 11.1. Key Segment Analysis
- 11.2. Municipal Pump Market Size (Value - US$ Bn and Volume - Thousand Units), Analysis, and Forecasts, by Flow Rate Range, 2021-2035
- 11.2.1. Up to 500 m³/h
- 11.2.2. 500–2,000 m³/h
- 11.2.3. 2,000–10,000 m³/h
- 11.2.4. Above 10,000 m³/h
- 12. Global Municipal Pump Market Analysis, by Application
- 12.1. Key Segment Analysis
- 12.2. Municipal Pump Market Size (Value - US$ Bn and Volume - Thousand Units), Analysis, and Forecasts, by Application, 2021-2035
- 12.2.1. Water Supply & Distribution
- 12.2.2. Wastewater Treatment
- 12.2.3. Stormwater Management
- 12.2.4. Sewage Transfer & Handling
- 12.2.5. Drinking Water Treatment
- 12.2.6. Irrigation in Municipal Landscapes
- 12.2.7. Desalination Support Systems
- 12.2.8. Sludge Handling
- 12.2.9. Others
- 13. Global Municipal Pump Market Analysis, by End-Use Function
- 13.1. Key Segment Analysis
- 13.2. Municipal Pump Market Size (Value - US$ Bn and Volume - Thousand Units), Analysis, and Forecasts, by End-Use Function, 2021-2035
- 13.2.1. Freshwater Management
- 13.2.2. Wastewater Infrastructure
- 13.2.3. Flood Control Systems
- 13.2.4. Public Utility Infrastructure
- 13.2.5. Municipal Sanitation Systems
- 13.2.6. Others
- 14. Global Municipal Pump Market Analysis and Forecasts, by Distribution Channel
- 14.1. Key Findings
- 14.2. Municipal Pump Market Size (Value - US$ Bn and Volume - Thousand Units), Analysis, and Forecasts, by Distribution Channel, 2021-2035
- 14.2.1. Direct Sales
- 14.2.2. Municipal Tenders & Contracts
- 14.2.3. Distributors / Dealers
- 14.2.4. EPC Contractors
- 14.2.5. System Integrators
- 15. Global Municipal Pump Market Analysis and Forecasts, by Region
- 15.1. Key Findings
- 15.2. Municipal Pump Market Size (Value - US$ Bn and Volume - Thousand Units), Analysis, and Forecasts, by Region, 2021-2035
- 15.2.1. North America
- 15.2.2. Europe
- 15.2.3. Asia Pacific
- 15.2.4. Middle East
- 15.2.5. Africa
- 15.2.6. South America
- 16. North America Municipal Pump Market Analysis
- 16.1. Key Segment Analysis
- 16.2. Regional Snapshot
- 16.3. North America Municipal Pump Market Size Value - US$ Bn and Volume - Thousand Units), Analysis, and Forecasts, 2021-2035
- 16.3.1. Pump Type
- 16.3.2. Material
- 16.3.3. Operation Mode
- 16.3.4. Installation Type
- 16.3.5. Capacity Range
- 16.3.6. Flow Rate Range
- 16.3.7. Application
- 16.3.8. End-Use Function
- 16.3.9. Distribution Channel
- 16.3.10. Country
- 16.3.10.1. USA
- 16.3.10.2. Canada
- 16.3.10.3. Mexico
- 16.4. USA Municipal Pump Market
- 16.4.1. Country Segmental Analysis
- 16.4.2. Pump Type
- 16.4.3. Material
- 16.4.4. Operation Mode
- 16.4.5. Installation Type
- 16.4.6. Capacity Range
- 16.4.7. Flow Rate Range
- 16.4.8. Application
- 16.4.9. End-Use Function
- 16.4.10. Distribution Channel
- 16.5. Canada Municipal Pump Market
- 16.5.1. Country Segmental Analysis
- 16.5.2. Pump Type
- 16.5.3. Material
- 16.5.4. Operation Mode
- 16.5.5. Installation Type
- 16.5.6. Capacity Range
- 16.5.7. Flow Rate Range
- 16.5.8. Application
- 16.5.9. End-Use Function
- 16.5.10. Distribution Channel
- 16.6. Mexico Municipal Pump Market
- 16.6.1. Country Segmental Analysis
- 16.6.2. Pump Type
- 16.6.3. Material
- 16.6.4. Operation Mode
- 16.6.5. Installation Type
- 16.6.6. Capacity Range
- 16.6.7. Flow Rate Range
- 16.6.8. Application
- 16.6.9. End-Use Function
- 16.6.10. Distribution Channel
- 17. Europe Municipal Pump Market Analysis
- 17.1. Key Segment Analysis
- 17.2. Regional Snapshot
- 17.3. Europe Municipal Pump Market Size (Value - US$ Bn and Volume - Thousand Units), Analysis, and Forecasts, 2021-2035
- 17.3.1. Pump Type
- 17.3.2. Material
- 17.3.3. Operation Mode
- 17.3.4. Installation Type
- 17.3.5. Capacity Range
- 17.3.6. Flow Rate Range
- 17.3.7. Application
- 17.3.8. End-Use Function
- 17.3.9. Distribution Channel
- 17.3.10. Country
- 17.3.10.1. Germany
- 17.3.10.2. United Kingdom
- 17.3.10.3. France
- 17.3.10.4. Italy
- 17.3.10.5. Spain
- 17.3.10.6. Netherlands
- 17.3.10.7. Nordic Countries
- 17.3.10.8. Poland
- 17.3.10.9. Russia & CIS
- 17.3.10.10. Rest of Europe
- 17.4. Germany Municipal Pump Market
- 17.4.1. Country Segmental Analysis
- 17.4.2. Pump Type
- 17.4.3. Material
- 17.4.4. Operation Mode
- 17.4.5. Installation Type
- 17.4.6. Capacity Range
- 17.4.7. Flow Rate Range
- 17.4.8. Application
- 17.4.9. End-Use Function
- 17.4.10. Distribution Channel
- 17.5. United Kingdom Municipal Pump Market
- 17.5.1. Country Segmental Analysis
- 17.5.2. Pump Type
- 17.5.3. Material
- 17.5.4. Operation Mode
- 17.5.5. Installation Type
- 17.5.6. Capacity Range
- 17.5.7. Flow Rate Range
- 17.5.8. Application
- 17.5.9. End-Use Function
- 17.5.10. Distribution Channel
- 17.6. France Municipal Pump Market
- 17.6.1. Country Segmental Analysis
- 17.6.2. Pump Type
- 17.6.3. Material
- 17.6.4. Operation Mode
- 17.6.5. Installation Type
- 17.6.6. Capacity Range
- 17.6.7. Flow Rate Range
- 17.6.8. Application
- 17.6.9. End-Use Function
- 17.6.10. Distribution Channel
- 17.7. Italy Municipal Pump Market
- 17.7.1. Country Segmental Analysis
- 17.7.2. Pump Type
- 17.7.3. Material
- 17.7.4. Operation Mode
- 17.7.5. Installation Type
- 17.7.6. Capacity Range
- 17.7.7. Flow Rate Range
- 17.7.8. Application
- 17.7.9. End-Use Function
- 17.7.10. Distribution Channel
- 17.8. Spain Municipal Pump Market
- 17.8.1. Country Segmental Analysis
- 17.8.2. Pump Type
- 17.8.3. Material
- 17.8.4. Operation Mode
- 17.8.5. Installation Type
- 17.8.6. Capacity Range
- 17.8.7. Flow Rate Range
- 17.8.8. Application
- 17.8.9. End-Use Function
- 17.8.10. Distribution Channel
- 17.9. Netherlands Municipal Pump Market
- 17.9.1. Country Segmental Analysis
- 17.9.2. Pump Type
- 17.9.3. Material
- 17.9.4. Operation Mode
- 17.9.5. Installation Type
- 17.9.6. Capacity Range
- 17.9.7. Flow Rate Range
- 17.9.8. Application
- 17.9.9. End-Use Function
- 17.9.10. Distribution Channel
- 17.10. Nordic Countries Municipal Pump Market
- 17.10.1. Country Segmental Analysis
- 17.10.2. Pump Type
- 17.10.3. Material
- 17.10.4. Operation Mode
- 17.10.5. Installation Type
- 17.10.6. Capacity Range
- 17.10.7. Flow Rate Range
- 17.10.8. Application
- 17.10.9. End-Use Function
- 17.10.10. Distribution Channel
- 17.11. Poland Municipal Pump Market
- 17.11.1. Country Segmental Analysis
- 17.11.2. Pump Type
- 17.11.3. Material
- 17.11.4. Operation Mode
- 17.11.5. Installation Type
- 17.11.6. Capacity Range
- 17.11.7. Flow Rate Range
- 17.11.8. Application
- 17.11.9. End-Use Function
- 17.11.10. Distribution Channel
- 17.12. Russia & CIS Municipal Pump Market
- 17.12.1. Country Segmental Analysis
- 17.12.2. Pump Type
- 17.12.3. Material
- 17.12.4. Operation Mode
- 17.12.5. Installation Type
- 17.12.6. Capacity Range
- 17.12.7. Flow Rate Range
- 17.12.8. Application
- 17.12.9. End-Use Function
- 17.12.10. Distribution Channel
- 17.13. Rest of Europe Municipal Pump Market
- 17.13.1. Country Segmental Analysis
- 17.13.2. Pump Type
- 17.13.3. Material
- 17.13.4. Operation Mode
- 17.13.5. Installation Type
- 17.13.6. Capacity Range
- 17.13.7. Flow Rate Range
- 17.13.8. Application
- 17.13.9. End-Use Function
- 17.13.10. Distribution Channel
- 18. Asia Pacific Municipal Pump Market Analysis
- 18.1. Key Segment Analysis
- 18.2. Regional Snapshot
- 18.3. Asia Pacific Municipal Pump Market Size (Value - US$ Bn and Volume - Thousand Units), Analysis, and Forecasts, 2021-2035
- 18.3.1. Pump Type
- 18.3.2. Material
- 18.3.3. Operation Mode
- 18.3.4. Installation Type
- 18.3.5. Capacity Range
- 18.3.6. Flow Rate Range
- 18.3.7. Application
- 18.3.8. End-Use Function
- 18.3.9. Distribution Channel
- 18.3.10. Country
- 18.3.10.1. China
- 18.3.10.2. India
- 18.3.10.3. Japan
- 18.3.10.4. South Korea
- 18.3.10.5. Australia and New Zealand
- 18.3.10.6. Indonesia
- 18.3.10.7. Malaysia
- 18.3.10.8. Thailand
- 18.3.10.9. Vietnam
- 18.3.10.10. Rest of Asia Pacific
- 18.4. China Municipal Pump Market
- 18.4.1. Country Segmental Analysis
- 18.4.2. Pump Type
- 18.4.3. Material
- 18.4.4. Operation Mode
- 18.4.5. Installation Type
- 18.4.6. Capacity Range
- 18.4.7. Flow Rate Range
- 18.4.8. Application
- 18.4.9. End-Use Function
- 18.4.10. Distribution Channel
- 18.5. India Municipal Pump Market
- 18.5.1. Country Segmental Analysis
- 18.5.2. Pump Type
- 18.5.3. Material
- 18.5.4. Operation Mode
- 18.5.5. Installation Type
- 18.5.6. Capacity Range
- 18.5.7. Flow Rate Range
- 18.5.8. Application
- 18.5.9. End-Use Function
- 18.5.10. Distribution Channel
- 18.6. Japan Municipal Pump Market
- 18.6.1. Country Segmental Analysis
- 18.6.2. Pump Type
- 18.6.3. Material
- 18.6.4. Operation Mode
- 18.6.5. Installation Type
- 18.6.6. Capacity Range
- 18.6.7. Flow Rate Range
- 18.6.8. Application
- 18.6.9. End-Use Function
- 18.6.10. Distribution Channel
- 18.7. South Korea Municipal Pump Market
- 18.7.1. Country Segmental Analysis
- 18.7.2. Pump Type
- 18.7.3. Material
- 18.7.4. Operation Mode
- 18.7.5. Installation Type
- 18.7.6. Capacity Range
- 18.7.7. Flow Rate Range
- 18.7.8. Application
- 18.7.9. End-Use Function
- 18.7.10. Distribution Channel
- 18.8. Australia and New Zealand Municipal Pump Market
- 18.8.1. Country Segmental Analysis
- 18.8.2. Pump Type
- 18.8.3. Material
- 18.8.4. Operation Mode
- 18.8.5. Installation Type
- 18.8.6. Capacity Range
- 18.8.7. Flow Rate Range
- 18.8.8. Application
- 18.8.9. End-Use Function
- 18.8.10. Distribution Channel
- 18.9. Indonesia Municipal Pump Market
- 18.9.1. Country Segmental Analysis
- 18.9.2. Pump Type
- 18.9.3. Material
- 18.9.4. Operation Mode
- 18.9.5. Installation Type
- 18.9.6. Capacity Range
- 18.9.7. Flow Rate Range
- 18.9.8. Application
- 18.9.9. End-Use Function
- 18.9.10. Distribution Channel
- 18.10. Malaysia Municipal Pump Market
- 18.10.1. Country Segmental Analysis
- 18.10.2. Pump Type
- 18.10.3. Material
- 18.10.4. Operation Mode
- 18.10.5. Installation Type
- 18.10.6. Capacity Range
- 18.10.7. Flow Rate Range
- 18.10.8. Application
- 18.10.9. End-Use Function
- 18.10.10. Distribution Channel
- 18.11. Thailand Municipal Pump Market
- 18.11.1. Country Segmental Analysis
- 18.11.2. Pump Type
- 18.11.3. Material
- 18.11.4. Operation Mode
- 18.11.5. Installation Type
- 18.11.6. Capacity Range
- 18.11.7. Flow Rate Range
- 18.11.8. Application
- 18.11.9. End-Use Function
- 18.11.10. Distribution Channel
- 18.12. Vietnam Municipal Pump Market
- 18.12.1. Country Segmental Analysis
- 18.12.2. Pump Type
- 18.12.3. Material
- 18.12.4. Operation Mode
- 18.12.5. Installation Type
- 18.12.6. Capacity Range
- 18.12.7. Flow Rate Range
- 18.12.8. Application
- 18.12.9. End-Use Function
- 18.12.10. Distribution Channel
- 18.13. Rest of Asia Pacific Municipal Pump Market
- 18.13.1. Country Segmental Analysis
- 18.13.2. Pump Type
- 18.13.3. Material
- 18.13.4. Operation Mode
- 18.13.5. Installation Type
- 18.13.6. Capacity Range
- 18.13.7. Flow Rate Range
- 18.13.8. Application
- 18.13.9. End-Use Function
- 18.13.10. Distribution Channel
- 19. Middle East Municipal Pump Market Analysis
- 19.1. Key Segment Analysis
- 19.2. Regional Snapshot
- 19.3. Middle East Municipal Pump Market Size (Value - US$ Bn and Volume - Thousand Units), Analysis, and Forecasts, 2021-2035
- 19.3.1. Pump Type
- 19.3.2. Material
- 19.3.3. Operation Mode
- 19.3.4. Installation Type
- 19.3.5. Capacity Range
- 19.3.6. Flow Rate Range
- 19.3.7. Application
- 19.3.8. End-Use Function
- 19.3.9. Distribution Channel
- 19.3.10. Country
- 19.3.10.1. Turkey
- 19.3.10.2. UAE
- 19.3.10.3. Saudi Arabia
- 19.3.10.4. Israel
- 19.3.10.5. Rest of Middle East
- 19.4. Turkey Municipal Pump Market
- 19.4.1. Country Segmental Analysis
- 19.4.2. Pump Type
- 19.4.3. Material
- 19.4.4. Operation Mode
- 19.4.5. Installation Type
- 19.4.6. Capacity Range
- 19.4.7. Flow Rate Range
- 19.4.8. Application
- 19.4.9. End-Use Function
- 19.4.10. Distribution Channel
- 19.5. UAE Municipal Pump Market
- 19.5.1. Country Segmental Analysis
- 19.5.2. Pump Type
- 19.5.3. Material
- 19.5.4. Operation Mode
- 19.5.5. Installation Type
- 19.5.6. Capacity Range
- 19.5.7. Flow Rate Range
- 19.5.8. Application
- 19.5.9. End-Use Function
- 19.5.10. Distribution Channel
- 19.6. Saudi Arabia Municipal Pump Market
- 19.6.1. Country Segmental Analysis
- 19.6.2. Pump Type
- 19.6.3. Material
- 19.6.4. Operation Mode
- 19.6.5. Installation Type
- 19.6.6. Capacity Range
- 19.6.7. Flow Rate Range
- 19.6.8. Application
- 19.6.9. End-Use Function
- 19.6.10. Distribution Channel
- 19.7. Israel Municipal Pump Market
- 19.7.1. Country Segmental Analysis
- 19.7.2. Pump Type
- 19.7.3. Material
- 19.7.4. Operation Mode
- 19.7.5. Installation Type
- 19.7.6. Capacity Range
- 19.7.7. Flow Rate Range
- 19.7.8. Application
- 19.7.9. End-Use Function
- 19.7.10. Distribution Channel
- 19.8. Rest of Middle East Municipal Pump Market
- 19.8.1. Country Segmental Analysis
- 19.8.2. Pump Type
- 19.8.3. Material
- 19.8.4. Operation Mode
- 19.8.5. Installation Type
- 19.8.6. Capacity Range
- 19.8.7. Flow Rate Range
- 19.8.8. Application
- 19.8.9. End-Use Function
- 19.8.10. Distribution Channel
- 20. Africa Municipal Pump Market Analysis
- 20.1. Key Segment Analysis
- 20.2. Regional Snapshot
- 20.3. Africa Municipal Pump Market Size (Value - US$ Bn and Volume - Thousand Units), Analysis, and Forecasts, 2021-2035
- 20.3.1. Pump Type
- 20.3.2. Material
- 20.3.3. Operation Mode
- 20.3.4. Installation Type
- 20.3.5. Capacity Range
- 20.3.6. Flow Rate Range
- 20.3.7. Application
- 20.3.8. End-Use Function
- 20.3.9. Distribution Channel
- 20.3.10. Country
- 20.3.10.1. South Africa
- 20.3.10.2. Egypt
- 20.3.10.3. Nigeria
- 20.3.10.4. Algeria
- 20.3.10.5. Rest of Africa
- 20.4. South Africa Municipal Pump Market
- 20.4.1. Country Segmental Analysis
- 20.4.2. Pump Type
- 20.4.3. Material
- 20.4.4. Operation Mode
- 20.4.5. Installation Type
- 20.4.6. Capacity Range
- 20.4.7. Flow Rate Range
- 20.4.8. Application
- 20.4.9. End-Use Function
- 20.4.10. Distribution Channel
- 20.5. Egypt Municipal Pump Market
- 20.5.1. Country Segmental Analysis
- 20.5.2. Pump Type
- 20.5.3. Material
- 20.5.4. Operation Mode
- 20.5.5. Installation Type
- 20.5.6. Capacity Range
- 20.5.7. Flow Rate Range
- 20.5.8. Application
- 20.5.9. End-Use Function
- 20.5.10. Distribution Channel
- 20.6. Nigeria Municipal Pump Market
- 20.6.1. Country Segmental Analysis
- 20.6.2. Pump Type
- 20.6.3. Material
- 20.6.4. Operation Mode
- 20.6.5. Installation Type
- 20.6.6. Capacity Range
- 20.6.7. Flow Rate Range
- 20.6.8. Application
- 20.6.9. End-Use Function
- 20.6.10. Distribution Channel
- 20.7. Algeria Municipal Pump Market
- 20.7.1. Country Segmental Analysis
- 20.7.2. Pump Type
- 20.7.3. Material
- 20.7.4. Operation Mode
- 20.7.5. Installation Type
- 20.7.6. Capacity Range
- 20.7.7. Flow Rate Range
- 20.7.8. Application
- 20.7.9. End-Use Function
- 20.7.10. Distribution Channel
- 20.8. Rest of Africa Municipal Pump Market
- 20.8.1. Country Segmental Analysis
- 20.8.2. Pump Type
- 20.8.3. Material
- 20.8.4. Operation Mode
- 20.8.5. Installation Type
- 20.8.6. Capacity Range
- 20.8.7. Flow Rate Range
- 20.8.8. Application
- 20.8.9. End-Use Function
- 20.8.10. Distribution Channel
- 21. South America Municipal Pump Market Analysis
- 21.1. Key Segment Analysis
- 21.2. Regional Snapshot
- 21.3. South America Municipal Pump Market Size (Value - US$ Bn and Volume - Thousand Units), Analysis, and Forecasts, 2021-2035
- 21.3.1. Pump Type
- 21.3.2. Material
- 21.3.3. Operation Mode
- 21.3.4. Installation Type
- 21.3.5. Capacity Range
- 21.3.6. Flow Rate Range
- 21.3.7. Application
- 21.3.8. End-Use Function
- 21.3.9. Distribution Channel
- 21.3.10. Country
- 21.3.10.1. Brazil
- 21.3.10.2. Argentina
- 21.3.10.3. Rest of South America
- 21.4. Brazil Municipal Pump Market
- 21.4.1. Country Segmental Analysis
- 21.4.2. Pump Type
- 21.4.3. Material
- 21.4.4. Operation Mode
- 21.4.5. Installation Type
- 21.4.6. Capacity Range
- 21.4.7. Flow Rate Range
- 21.4.8. Application
- 21.4.9. End-Use Function
- 21.4.10. Distribution Channel
- 21.5. Argentina Municipal Pump Market
- 21.5.1. Country Segmental Analysis
- 21.5.2. Pump Type
- 21.5.3. Material
- 21.5.4. Operation Mode
- 21.5.5. Installation Type
- 21.5.6. Capacity Range
- 21.5.7. Flow Rate Range
- 21.5.8. Application
- 21.5.9. End-Use Function
- 21.5.10. Distribution Channel
- 21.6. Rest of South America Municipal Pump Market
- 21.6.1. Country Segmental Analysis
- 21.6.2. Pump Type
- 21.6.3. Material
- 21.6.4. Operation Mode
- 21.6.5. Installation Type
- 21.6.6. Capacity Range
- 21.6.7. Flow Rate Range
- 21.6.8. Application
- 21.6.9. End-Use Function
- 21.6.10. Distribution Channel
- 22. Key Players/ Company Profile
- 22.1. Baker Hughes (Pumps Division)
- 22.1.1. Company Details/ Overview
- 22.1.2. Company Financials
- 22.1.3. Key Customers and Competitors
- 22.1.4. Business/ Industry Portfolio
- 22.1.5. Product Portfolio/ Specification Details
- 22.1.6. Pricing Data
- 22.1.7. Strategic Overview
- 22.1.8. Recent Developments
- 22.2. Ebara Corporation
- 22.3. Flowserve Corporation
- 22.4. Franklin Electric
- 22.5. Grundfos
- 22.6. ITT Inc.
- 22.7. Kirloskar Brothers Limited (KBL)
- 22.8. KSB SE & Co. KGaA
- 22.9. NETZSCH Pumps & Systems
- 22.10. NOV Inc. (National Oilwell Varco)
- 22.11. Pentair plc
- 22.12. Pumpenfabrik Wangen GmbH
- 22.13. Ruhrpumpen Group
- 22.14. SPX FLOW, Inc.
- 22.15. Sulzer Ltd.
- 22.16. The Weir Group
- 22.17. Tsurumi Manufacturing Co., Ltd.
- 22.18. Vogelsang GmbH & Co. KG
- 22.19. Wilo SE
- 22.20. Xylem Inc.
- 22.21. Other Key Players
- 22.1. Baker Hughes (Pumps Division)
Note* - This is just tentative list of players. While providing the report, we will cover more number of players based on their revenue and share for each geography
Research Design
Our research design integrates both demand-side and supply-side analysis through a balanced combination of primary and secondary research methodologies. By utilizing both bottom-up and top-down approaches alongside rigorous data triangulation methods, we deliver robust market intelligence that supports strategic decision-making.
MarketGenics' comprehensive research design framework ensures the delivery of accurate, reliable, and actionable market intelligence. Through the integration of multiple research approaches, rigorous validation processes, and expert analysis, we provide our clients with the insights needed to make informed strategic decisions and capitalize on market opportunities.

MarketGenics leverages a dedicated industry panel of experts and a comprehensive suite of paid databases to effectively collect, consolidate, and analyze market intelligence.
Our approach has consistently proven to be reliable and effective in generating accurate market insights, identifying key industry trends, and uncovering emerging business opportunities.
Through both primary and secondary research, we capture and analyze critical company-level data such as manufacturing footprints, including technical centers, R&D facilities, sales offices, and headquarters.
Our expert panel further enhances our ability to estimate market size for specific brands based on validated field-level intelligence.
Our data mining techniques incorporate both parametric and non-parametric methods, allowing for structured data collection, sorting, processing, and cleaning.
Demand projections are derived from large-scale data sets analyzed through proprietary algorithms, culminating in robust and reliable market sizing.
Research Approach
The bottom-up approach builds market estimates by starting with the smallest addressable market units and systematically aggregating them to create comprehensive market size projections.
This method begins with specific, granular data points and builds upward to create the complete market landscape.
Customer Analysis → Segmental Analysis → Geographical Analysis
The top-down approach starts with the broadest possible market data and systematically narrows it down through a series of filters and assumptions to arrive at specific market segments or opportunities.
This method begins with the big picture and works downward to increasingly specific market slices.
TAM → SAM → SOM


Research Methods
Desk / Secondary Research
While analysing the market, we extensively study secondary sources, directories, and databases to identify and collect information useful for this technical, market-oriented, and commercial report. Secondary sources that we utilize are not only the public sources, but it is a combination of Open Source, Associations, Paid Databases, MG Repository & Knowledgebase, and others.
- Company websites, annual reports, financial reports, broker reports, and investor presentations
- National government documents, statistical databases and reports
- News articles, press releases and web-casts specific to the companies operating in the market, Magazines, reports, and others
- We gather information from commercial data sources for deriving company specific data such as segmental revenue, share for geography, product revenue, and others
- Internal and external proprietary databases (industry-specific), relevant patent, and regulatory databases
- Governing Bodies, Government Organizations
- Relevant Authorities, Country-specific Associations for Industries
We also employ the model mapping approach to estimate the product level market data through the players' product portfolio
Primary Research
Primary research/ interviews is vital in analyzing the market. Most of the cases involves paid primary interviews. Primary sources include primary interviews through e-mail interactions, telephonic interviews, surveys as well as face-to-face interviews with the different stakeholders across the value chain including several industry experts.
| Type of Respondents | Number of Primaries |
|---|---|
| Tier 2/3 Suppliers | ~20 |
| Tier 1 Suppliers | ~25 |
| End-users | ~25 |
| Industry Expert/ Panel/ Consultant | ~30 |
| Total | ~100 |
MG Knowledgebase
• Repository of industry blog, newsletter and case studies
• Online platform covering detailed market reports, and company profiles
Forecasting Factors and Models
Forecasting Factors
- Historical Trends – Past market patterns, cycles, and major events that shaped how markets behave over time. Understanding past trends helps predict future behavior.
- Industry Factors – Specific characteristics of the industry like structure, regulations, and innovation cycles that affect market dynamics.
- Macroeconomic Factors – Economic conditions like GDP growth, inflation, and employment rates that affect how much money people have to spend.
- Demographic Factors – Population characteristics like age, income, and location that determine who can buy your product.
- Technology Factors – How quickly people adopt new technology and how much technology infrastructure exists.
- Regulatory Factors – Government rules, laws, and policies that can help or restrict market growth.
- Competitive Factors – Analyzing competition structure such as degree of competition and bargaining power of buyers and suppliers.
Forecasting Models / Techniques
Multiple Regression Analysis
- Identify and quantify factors that drive market changes
- Statistical modeling to establish relationships between market drivers and outcomes
Time Series Analysis – Seasonal Patterns
- Understand regular cyclical patterns in market demand
- Advanced statistical techniques to separate trend, seasonal, and irregular components
Time Series Analysis – Trend Analysis
- Identify underlying market growth patterns and momentum
- Statistical analysis of historical data to project future trends
Expert Opinion – Expert Interviews
- Gather deep industry insights and contextual understanding
- In-depth interviews with key industry stakeholders
Multi-Scenario Development
- Prepare for uncertainty by modeling different possible futures
- Creating optimistic, pessimistic, and most likely scenarios
Time Series Analysis – Moving Averages
- Sophisticated forecasting for complex time series data
- Auto-regressive integrated moving average models with seasonal components
Econometric Models
- Apply economic theory to market forecasting
- Sophisticated economic models that account for market interactions
Expert Opinion – Delphi Method
- Harness collective wisdom of industry experts
- Structured, multi-round expert consultation process
Monte Carlo Simulation
- Quantify uncertainty and probability distributions
- Thousands of simulations with varying input parameters
Research Analysis
Our research framework is built upon the fundamental principle of validating market intelligence from both demand and supply perspectives. This dual-sided approach ensures comprehensive market understanding and reduces the risk of single-source bias.
Demand-Side Analysis: We understand end-user/application behavior, preferences, and market needs along with the penetration of the product for specific application.
Supply-Side Analysis: We estimate overall market revenue, analyze the segmental share along with industry capacity, competitive landscape, and market structure.
Validation & Evaluation
Data triangulation is a validation technique that uses multiple methods, sources, or perspectives to examine the same research question, thereby increasing the credibility and reliability of research findings. In market research, triangulation serves as a quality assurance mechanism that helps identify and minimize bias, validate assumptions, and ensure accuracy in market estimates.
- Data Source Triangulation – Using multiple data sources to examine the same phenomenon
- Methodological Triangulation – Using multiple research methods to study the same research question
- Investigator Triangulation – Using multiple researchers or analysts to examine the same data
- Theoretical Triangulation – Using multiple theoretical perspectives to interpret the same data

Custom Market Research Services
We will customise the research for you, in case the report listed above does not meet your requirements.
Get 10% Free Customisation