Oil Condition Monitoring Market Size, Share & Trends Analysis Report by Monitoring Technique (Viscosity Analysis, Density Measurement, Dielectric Constant Monitoring, Infrared Spectroscopy, Fourier Transform Infrared (FTIR) Analysis, Wear Debris Analysis, Ferrous Particle Monitoring, Total Acid Number (TAN) & Total Base Number (TBN) Testing, Others), Product Type, Measurement Parameter, Sampling Method, Equipment Type, Deployment Mode, Service Type, End Use Industry and Geography (North America, Europe, Asia Pacific, Middle East, Africa, and South America) – Global Industry Data, Trends, and Forecasts, 2026–2035
Market Overview:
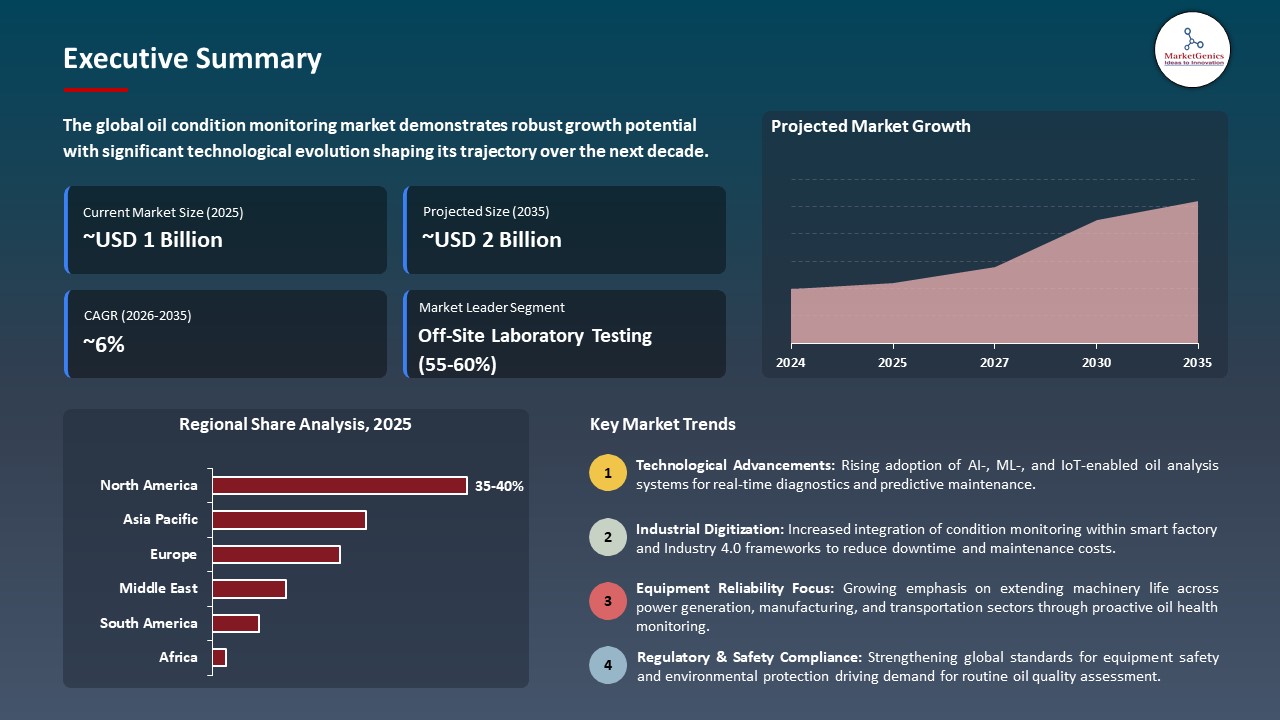
According to MarketGenics analysis only, the global oil condition monitoring market is witnessing robust growth, with an estimated valuation of USD 1.3 billion in 2025 and projected to reach USD 2.3 billion by 2035, registering a CAGR of 5.7% during the forecast period.
|
Market Structure & Evolution |
|
|
Segmental Data Insights |
|
|
Demand Trends |
|
|
Competitive Landscape |
|
|
Strategic Development |
|
|
Future Outlook & Opportunities |
|
Oil Condition Monitoring Market Size, Share, and Growth
Furthermore, industrial plants could not have an easier time handling their oil on a moment-to-moment basis, and they may also extract smart information like Remaining Oil Life by the aid of Shell Remote Sense technology - at the end of the day, their facilities will be running continuously, the maintenance expenses will be going down, and the equipment will be getting older at a slower rate.
The oil-condition-monitoring-market is rapidly changing globally with the help of various factors such as the shift of the industries to predictive maintenance and the advanced lubricant-health diagnostics, which have been proven reliable. Actual implementations are speeding up the change as Shell’s Remote Sense solution, for instance, is a way to provide continuous, real-time oil-condition insights like Remaining Oil Life and facilitate operators in reducing downtime and optimizing maintenance cycles. ExxonMobil’s Mobil Serv Lubricant Analysis program is being, in a similar fashion, widely accepted in manufacturing and heavy equipment sectors co-operating in the pursuit of fast, lab-accurate diagnostics to extend equipment life and improve asset performance.
On the contrary, the expansion of industrial automation and the rapid increase of the high-value equipment fleet in industries such as power generation, mining, and transportation are contributing to the rise of the demand for sophisticated, sensor-based oil monitoring systems. Equipment reliability improvement through regulatory measures and lessening of environmental impact by emission of fewer gases are among the reasons that push companies to adopt advanced solutions that can detect wear metals, contaminants and degradation in real time.
Moreover, the oil-condition monitoring market worldwide is open to additional opportunities arising from the proximity of market segments like IoT-enabled sensor manufacturing, industrial analytics platforms, AI-driven predictive maintenance tools, integrated asset-health dashboards, and cloud-based reliability management systems. Solution providers, by drawing on these adjacent segments, can not only offer more complete asset-health ecosystems but also gain more leverage in the industrial maintenance landscape.
Oil Condition Monitoring Market Dynamics and Trends
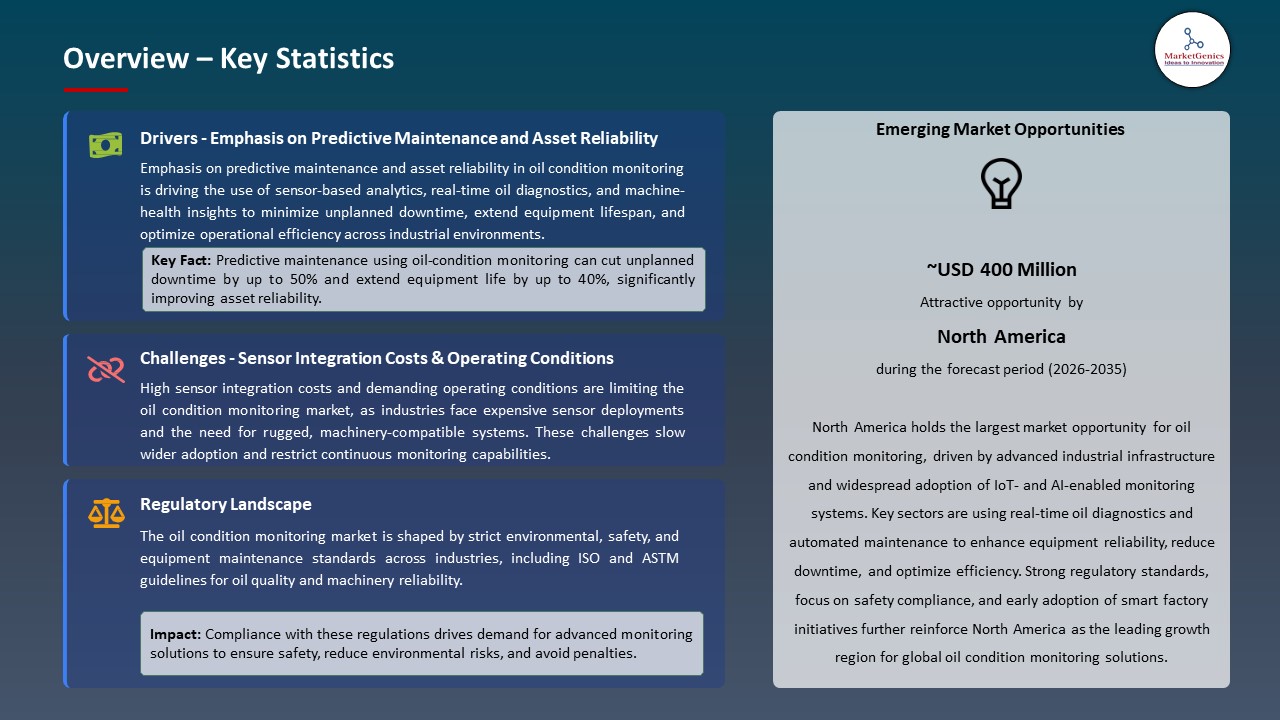
Driver: Growing Emphasis on Predictive Maintenance and Asset Reliability Driving Oil-Condition Monitoring Adoption
-
Industrial sectors are on a steep curve to change their maintenance strategies, heavily leaning into predictive maintenance programs. This is a direct consequence of the ever-increasing Costs of Downtime and Operational Reliability Requirements that have become more stringent. For instance, big mining, manufacturing, and power generation companies have progressively combined real-time oil analysis with their condition-based maintenance (CBM) systems to identify the earliest wear and thus avoid major breakdowns.
- Delving deeper, the proliferation of IoT and the industrial automation ecosystems has been a strong driver of uptake in the sectors that use modern equipment, e.g., wind energy, rail, and marine. These sectors now come with integrated onboard oil-quality sensors for better visibility of lubricant health, particle contamination, and oxidation levels. In August 2021, Shell and Baker Hughes (through its subsidiary Bently Nevada) introduced VitalyX - an intelligent oil-condition monitoring and machine-health service for the marine sector. The service leverages Shell’s expertise in lubricant-analysis (from Shell Remote Sense) and Bently Nevada’s over 50 years of experience in condition monitoring/protection.
- Besides these, environmental, sustainability, and governance (ESG) mandates as well as waste-reduction targets, are the primary reasons why the industries are now going the extra mile to extend lubricant life and curb the release of oil that has no business being in the environment. This transition greatly facilitates the incorporation of oil-condition analytics in the maintenance program to ascertain the safety of extension intervals and adherence to environmental regulations.
Restraint: High Sensor Integration Costs and Variability of Operating Conditions Limiting Widespread Use
-
Even though the monitoring tools are more sophisticated now, cost is still the major factor that limits the use of monitoring technologies, especially for smaller industrial facilities and fleet operators. The deployment complexity is still high due to expensive sensors, integration with the existing SCADA/ERP systems, and calibration that is required.
- The variability of harsh industrial environments such as very high or low temperature, heavy vibration, and the presence of chemicals, for example, reduces the lifespan of sensors and increases the maintenance cost. Inconsistent performance, in particular, by industries on the sea, mining, and remote locations, is a big challenge for them.
- Data standardization is still at a very low level as well, and different OEMs are using different data formats, thus it is very difficult to pool oil-condition data from various sources. The absence of interoperability layers and common diagnostic baselines are the factors that slow down the transition to advanced monitoring systems by a large number.
Opportunity: Rising Demand from Remote Operations, Autonomous Assets, and Digitalization Programs
-
Remote and autonomous operations like unmanned offshore platforms, remote mining sites, and automated manufacturing lines need continuous oil-condition tracking because they are not physically accessible for manual checks. This is resulting in the demand for fully automated oil-analysis modules and wireless sensor networks. Shell provides LubeAnalyst, a reliable oil-analysis service supported by more than 30 years of lubricant data. This program enables users to lubricate more efficiently, detect wear/contamination issues in the early stages, and save from unexpected failures.
- Digitally industrial national-level programs, for example, India’s Digital Manufacturing initiatives, the EU’s Industry 5.0 strategy, and Gulf-region smart-energy programs, are rapidly leading to increased investments in AI-driven maintenance platforms. These programs require very accurate machine-health data, which makes OCM a core element.
- Fleets in logistics, aviation ground support, and heavy transportation that are geographically dispersed are turning to cloud-based oil diagnostics to manage their assets. This is opening up opportunities for analytics providers, remote monitoring service vendors, and OEM-integrated lubrication health platforms.
Key Trend: AI-Enhanced Diagnostics, Cloud Integration, and On-Equipment Sensors Transforming Oil-Condition Monitoring
-
Artificial intelligence-driven interpretation of oil condition data is quickly becoming the dominant theme around models that can correlate wear metals, viscosity changes, particle morphology, and even thermal patterns to predict equipment failure far in advance of what is possible with traditional lab analysis. In this way, the time intervals between maintenance decisions are shortened, and the accuracy of the failure mode is enhanced.
- Micro in-situ sensors - employing optical, electrochemical, and acoustic methods - are getting smaller and more accurate, thus they can continuously measure lubricant degradation, water contamination, and metallic debris in real time. Their use is increasing in wind turbines, hydraulic systems, and diesel engines.
- The adoption of oil-condition analytics powered by the cloud into asset-management platforms (e.g., APM, EAM, CMMS systems) is leading to a complete transformation of how industries keep the tab on the local and remote assets. This connectivity trend allows the cross-facility benchmarking, machine-health dashboards at the fleet level, and data-driven optimization of lubrication intervals.
- The extended implementation of digital twins in industrial plants, power stations, and transportation fleets is another trend that is emerging. By integrating oil-condition data with vibration, thermal, and pressure data, the operators get the possibility to forecast equipment wear scenarios, change the strategies for maintenance, and increase the reliability of operations.
Oil-Condition-Monitoring-Market Analysis and Segmental Data
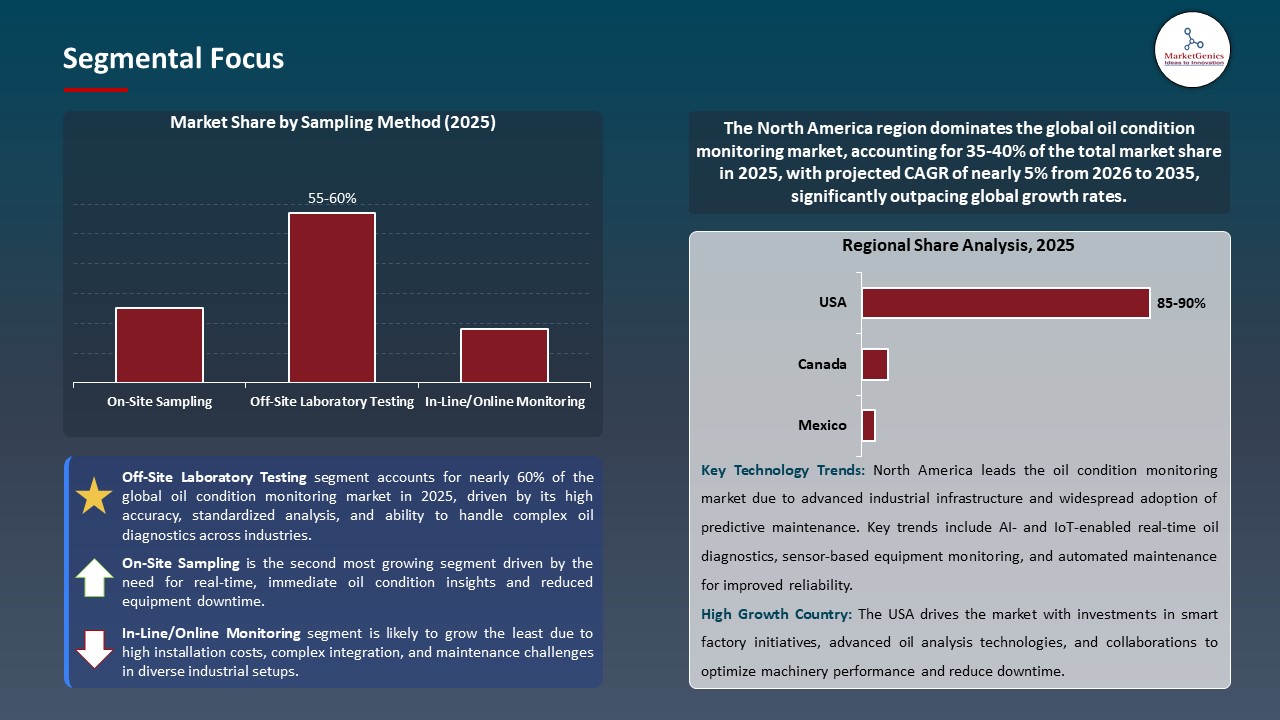
“Off-Site Laboratory Testing Dominates Global Oil Condition Monitoring Market amid Rising Demand for High-Accuracy Diagnostics"
-
As the precision of on-site detection methods and sensors slowly improve; the off-site laboratory testing segment continues to dominate the global oil condition monitoring market. This is because industries are turning to high-precision diagnostics to not only assess lubricant health but also detect wear metals and identify contamination with a much higher accuracy. Highly advanced instruments such as ICP spectrometers, FTIR analyzers, particle counters, and viscosity measurement systems in certified laboratories enable them to make detailed evaluations, crucial for the equipment in sectors like manufacturing, marine, power generation, mining, and transportation, and is used for heavy-duty or mission-critical tasks.
- The transition to CBM strategies, which need precise baseline and trend analyses to pinpoint the early stages of component wear, is the main reason why this supremacy is still very relevant. In fact, off-site labs offer not only standardized reporting but also expert interpretation and historical benchmarking, thus they become the enablers of the organizations which seek to make maintenance decisions informed by data, therefore, they minimize the risk of unplanned downtimes and maximize the lifespan of the equipment at their disposal.
- Shell (Shell LubeAnalyst) and ExxonMobil (Mobil Serv Lubricant Analysis) are two examples of industry leaders that are continuously promoting the laboratory services worldwide through their respective programs. This is in conformity with the major reliance of the current comprehensive diagnostic methods by real-time monitoring tools. These programs serve as a reference for the validation of field-detected anomalies and a means of ensuring that operations conform to the specifications given by OEMs and industrial quality standards.
“North American Supremacy in Oil Condition Monitoring Market amid Strong Industrial Automation and Predictive Maintenance Adoption"
-
North America is at the forefront of the global oil condition monitoring market, which is influenced by its advanced industrialized economy, quick automation adoption, and the use of predictive maintenance in various sectors such as manufacturing, power generation, marine, mining, and transportation. The region's well-developed industrial infrastructure and the common use of high-value rotating equipment make it very important to accurately assess the health of the lubricant in order to avoid downtime and maintain the production of the plant at a high level.
- The companies like Shell, ExxonMobil, SKF, and Parker Hannifin, in the U.S. and Canada, run large oil-analysis programs and laboratories providing a range of advanced services such as ICP-based wear metal analysis, FTIR degradation diagnostics, and particle counting. These services are extensively used in condition-based maintenance strategies in heavy industries, which is the main reason the region is leading in data-driven equipment health management.
- The regulations concentrating on environmental compliance and equipment reliability (including standards from agencies like OSHA, EPA, and industrial safety bodies at the state level) are the main reasons oil-condition monitoring is being adopted at a fast pace in order to save lubricants, minimize spills, and reduce waste. By investing more and more in IIoT, digital twins, and AI-enabled maintenance platforms, North America is still very influential in the transition of industries to fully predictive and reliability-centered maintenance models.
Oil-Condition-Monitoring-Market Ecosystem
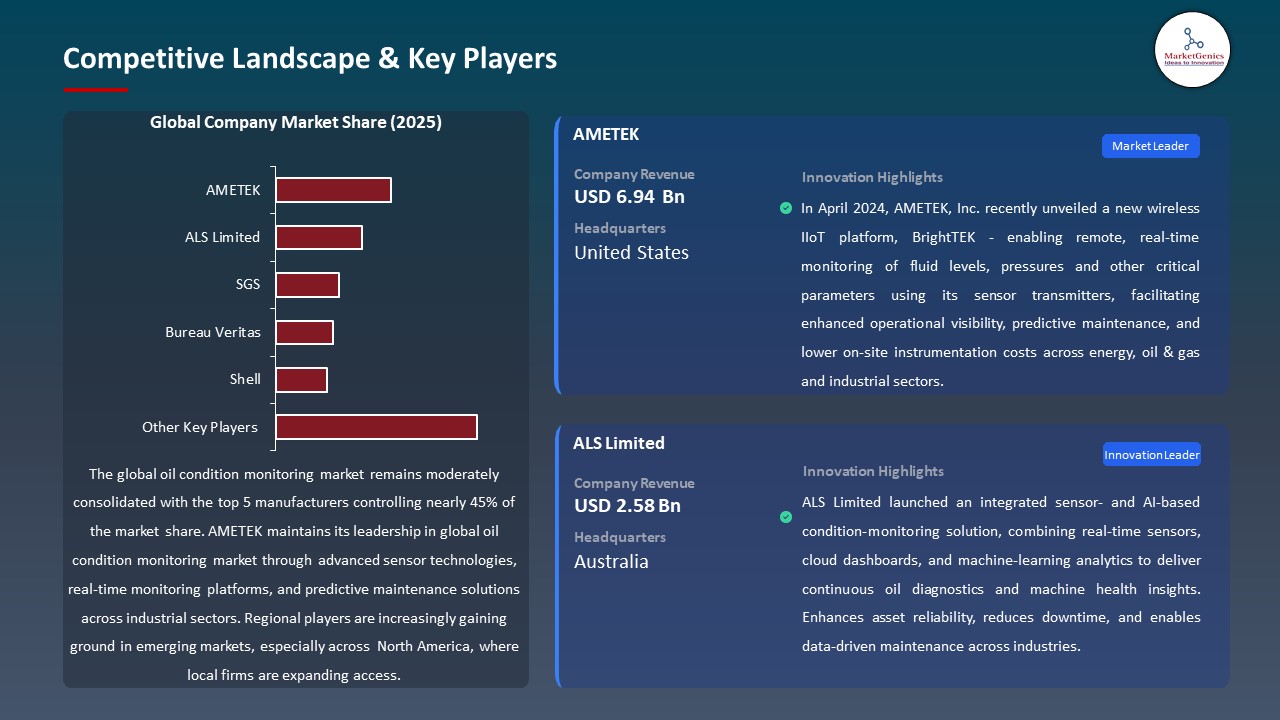
The worldwide oil-condition monitoring (OCM) market is moderately consolidated and mainly comprises a few large companies, which include Shell, ExxonMobil, Parker Hannifin, Spectro Scientific, Bureau Veritas, and SGS. These companies are leading the market by offering advanced technologies and wide service networks.
With products such as portable and online oil-analysis instruments, real-time sensors for hydraulic and heavy machinery, and lab-based diagnostics integrated with predictive maintenance programs, the companies are innovating in specialized solutions. Shell and ExxonMobil utilize the combination of lubricant expertise and various testing services to provide the most accurate and useful insights.
The trend of growth in this market is supported by the contributions of government bodies, institutions, and R&D organizations, who are the main sponsors of technology development. As an example, in March 2024, CM Technologies introduced its WBS IR Analyser, which uses infrared spectroscopy to quickly determine base number, water content, soot, and fuel dilution in cylinder and system oils, thereby improving diagnostic accuracy.
Market leaders are taking steps towards product diversification and integrated solutions that facilitate operational efficiency, minimize downtime, and increase the life of the equipment. Parker Hannifin unveiled a new series of sensors with real-time analytics for industrial assets in 2025. When combined with AI and machine-learning research for fault detection, these breakthroughs are leading to a predictive, data-driven maintenance landscape.
Recent Development and Strategic Overview:
- In September 2025, Shell took its Remote Sense platform further by adding AI-based predictive analytics for industrial fleets which is a great way to check lubricant health in real-time and detect wear or contamination at an early stage. The operators can thus, through this facility, arrange their maintenance visits in a timely manner, cut down on the occurrences of unexpected stoppages, and improve their total equipment reliability without the need for any human intervention.
- In July 2025, Parker Hannifin introduced its Smart Oil Sensor Suite for heavy machinery and hydraulic systems to keep an eye on the same condition of the equipment by measuring continuously the viscosity, particle contamination, and water content. By means of cloud-based dashboards, the platform delivers the predictive maintenance and lubricant usages that can be leveraged through the insights for operational efficiency gains and maintenance cost reductions at industrial sites that are geographically dispersed.
Report Scope
|
Attribute |
Detail |
|
Market Size in 2025 |
USD 1.3 Bn |
|
Market Forecast Value in 2035 |
USD 2.3 Bn |
|
Growth Rate (CAGR) |
5.7% |
|
Forecast Period |
2026 – 2035 |
|
Historical Data Available for |
2021 – 2024 |
|
Market Size Units |
USD Bn for Value Million Units for Volume |
|
Report Format |
Electronic (PDF) + Excel |
|
Regions and Countries Covered |
|||||
|
North America |
Europe |
Asia Pacific |
Middle East |
Africa |
South America |
|
|
|
|
|
|
|
Companies Covered |
|||||
|
|
|
|
|
|
Oil-Condition-Monitoring-Market Segmentation and Highlights
|
Segment |
Sub-segment |
|
Oil Condition Monitoring Market, By Monitoring Technique |
|
|
Oil Condition Monitoring Market, By Product Type |
|
|
Oil Condition Monitoring Market, By Measurement Parameter |
|
|
Oil Condition Monitoring Market, By Sampling Method |
|
|
Oil Condition Monitoring Market, By Equipment Type |
|
|
Oil Condition Monitoring Market, By Deployment Mode |
|
|
Oil Condition Monitoring Market, By Service Type |
|
|
Oil Condition Monitoring Market, By End Use Industry |
|
Frequently Asked Questions
Table of Contents
- 1. Research Methodology and Assumptions
- 1.1. Definitions
- 1.2. Research Design and Approach
- 1.3. Data Collection Methods
- 1.4. Base Estimates and Calculations
- 1.5. Forecasting Models
- 1.5.1. Key Forecast Factors & Impact Analysis
- 1.6. Secondary Research
- 1.6.1. Open Sources
- 1.6.2. Paid Databases
- 1.6.3. Associations
- 1.7. Primary Research
- 1.7.1. Primary Sources
- 1.7.2. Primary Interviews with Stakeholders across Ecosystem
- 2. Executive Summary
- 2.1. Global Oil Condition Monitoring Market Outlook
- 2.1.1. Oil Condition Monitoring Market Size (Value - US$ Bn and Volume - Million Units), and Forecasts, 2021-2035
- 2.1.2. Compounded Annual Growth Rate Analysis
- 2.1.3. Growth Opportunity Analysis
- 2.1.4. Segmental Share Analysis
- 2.1.5. Geographical Share Analysis
- 2.2. Market Analysis and Facts
- 2.3. Supply-Demand Analysis
- 2.4. Competitive Benchmarking
- 2.5. Go-to- Market Strategy
- 2.5.1. Customer/ End-use Industry Assessment
- 2.5.2. Growth Opportunity Data, 2026-2035
- 2.5.2.1. Regional Data
- 2.5.2.2. Country Data
- 2.5.2.3. Segmental Data
- 2.5.3. Identification of Potential Market Spaces
- 2.5.4. GAP Analysis
- 2.5.5. Potential Attractive Price Points
- 2.5.6. Prevailing Market Risks & Challenges
- 2.5.7. Preferred Sales & Marketing Strategies
- 2.5.8. Key Recommendations and Analysis
- 2.5.9. A Way Forward
- 2.1. Global Oil Condition Monitoring Market Outlook
- 3. Industry Data and Premium Insights
- 3.1. Global Automation & Process Control Overview, 2025
- 3.1.1. Automation & Process Control Industry Analysis
- 3.1.2. Key Trends for Automation & Process Control Industry
- 3.1.3. Regional Distribution for Automation & Process Control Industry
- 3.2. Supplier Customer Data
- 3.3. Technology Roadmap and Developments
- 3.1. Global Automation & Process Control Overview, 2025
- 4. Market Overview
- 4.1. Market Dynamics
- 4.1.1. Drivers
- 4.1.1.1. Rising demand for predictive maintenance and real-time equipment diagnostics to reduce downtime.
- 4.1.1.2. Growing adoption of IoT-enabled sensors and AI for detecting wear, contamination, and oil degradation.
- 4.1.1.3. Increasing investments in cloud-based OCM platforms and condition-based monitoring systems.
- 4.1.2. Restraints
- 4.1.2.1. High initial costs for advanced sensors and integration with existing equipment.
- 4.1.2.2. Challenges in standardizing monitoring across diverse machinery and lubricant types.
- 4.1.1. Drivers
- 4.2. Key Trend Analysis
- 4.3. Regulatory Framework
- 4.3.1. Key Regulations, Norms, and Subsidies, by Key Countries
- 4.3.2. Tariffs and Standards
- 4.3.3. Impact Analysis of Regulations on the Market
- 4.4. Value Chain Analysis
- 4.4.1. Sampling Hardware, Sensors & Analytical Instruments
- 4.4.2. System Integrators/ Technology Providers
- 4.4.3. Oil Condition Monitoring Providers
- 4.4.4. End Users
- 4.5. Cost Structure Analysis
- 4.5.1. Parameter’s Share for Cost Associated
- 4.5.2. COGP vs COGS
- 4.5.3. Profit Margin Analysis
- 4.6. Pricing Analysis
- 4.6.1. Regional Pricing Analysis
- 4.6.2. Segmental Pricing Trends
- 4.6.3. Factors Influencing Pricing
- 4.7. Porter’s Five Forces Analysis
- 4.8. PESTEL Analysis
- 4.9. Global Oil Condition Monitoring Market Demand
- 4.9.1. Historical Market Size –Value (US$ Bn) and Volume – (Million Units), 2020-2024
- 4.9.2. Current and Future Market Size –Value (US$ Bn) and Volume – (Million Units), 2026–2035
- 4.9.2.1. Y-o-Y Growth Trends
- 4.9.2.2. Absolute $ Opportunity Assessment
- 4.1. Market Dynamics
- 5. Competition Landscape
- 5.1. Competition structure
- 5.1.1. Fragmented v/s consolidated
- 5.2. Company Share Analysis, 2025
- 5.2.1. Global Company Market Share
- 5.2.2. By Region
- 5.2.2.1. North America
- 5.2.2.2. Europe
- 5.2.2.3. Asia Pacific
- 5.2.2.4. Middle East
- 5.2.2.5. Africa
- 5.2.2.6. South America
- 5.3. Product Comparison Matrix
- 5.3.1. Specifications
- 5.3.2. Market Positioning
- 5.3.3. Pricing
- 5.1. Competition structure
- 6. Global Oil Condition Monitoring Market Analysis, by Monitoring Technique
- 6.1. Key Segment Analysis
- 6.2. Oil Condition Monitoring Market Size (Value - US$ Bn and Volume - Million Units), Analysis, and Forecasts, by Monitoring Technique, 2021-2035
- 6.2.1. Viscosity Analysis
- 6.2.2. Density Measurement
- 6.2.3. Dielectric Constant Monitoring
- 6.2.4. Infrared Spectroscopy
- 6.2.5. Fourier Transform Infrared (FTIR) Analysis
- 6.2.6. Wear Debris Analysis
- 6.2.7. Ferrous Particle Monitoring
- 6.2.8. Total Acid Number (TAN) & Total Base Number (TBN) Testing
- 6.2.9. Others
- 7. Global Oil Condition Monitoring Market Analysis, by Product Type
- 7.1. Key Segment Analysis
- 7.2. Oil Condition Monitoring Market Size (Value - US$ Bn and Volume - Million Units), Analysis, and Forecasts, by Product Type, 2021-2035
- 7.2.1. Sampling & Testing Kits
- 7.2.2. Sensors & Monitoring Devices
- 7.2.3. On-site Oil Analysis Equipment
- 7.2.4. Portable Oil Analysis Systems
- 7.2.5. Remote/Online Monitoring Systems
- 7.2.6. Others
- 8. Global Oil Condition Monitoring Market Analysis, by Measurement Parameter
- 8.1. Key Segment Analysis
- 8.2. Oil Condition Monitoring Market Size (Value - US$ Bn and Volume - Million Units), Analysis, and Forecasts, by Measurement Parameter, 2021-2035
- 8.2.1. Contamination Level
- 8.2.2. Moisture & Water Content
- 8.2.3. Oxidation Stability
- 8.2.4. Additive Depletion
- 8.2.5. Particulate Count
- 8.2.6. Thermal Degradation
- 8.2.7. Fuel Dilution
- 8.2.8. Soot & Carbon Content
- 8.2.9. Others
- 9. Global Oil Condition Monitoring Market Analysis, by Sampling Method
- 9.1. Key Segment Analysis
- 9.2. Oil Condition Monitoring Market Size (Value - US$ Bn and Volume - Million Units), Analysis, and Forecasts, by Sampling Method, 2021-2035
- 9.2.1. On-Site Sampling
- 9.2.2. Off-Site Laboratory Testing
- 9.2.3. In-Line/Online Monitoring
- 10. Global Oil Condition Monitoring Market Analysis, by Equipment Type
- 10.1. Key Segment Analysis
- 10.2. Oil Condition Monitoring Market Size (Value - US$ Bn and Volume - Million Units), Analysis, and Forecasts, by Equipment Type, 2021-2035
- 10.2.1. Engines
- 10.2.2. Gearboxes
- 10.2.3. Turbines
- 10.2.4. Compressors
- 10.2.5. Hydraulic Systems
- 10.2.6. Wind Turbines
- 10.2.7. Industrial Machinery
- 10.2.8. Marine Equipment
- 10.2.9. Others
- 11. Global Oil Condition Monitoring Market Analysis, by Deployment Mode
- 11.1. Key Segment Analysis
- 11.2. Oil Condition Monitoring Market Size (Value - US$ Bn and Volume - Million Units), Analysis, and Forecasts, by Deployment Mode, 2021-2035
- 11.2.1. On-premise
- 11.2.2. Cloud-based
- 11.2.3. Hybrid
- 12. Global Oil Condition Monitoring Market Analysis, by Service Type
- 12.1. Key Segment Analysis
- 12.2. Oil Condition Monitoring Market Size (Value - US$ Bn and Volume - Million Units), Analysis, and Forecasts, by Service Type, 2021-2035
- 12.2.1. Predictive Maintenance Services
- 12.2.2. Laboratory Oil Analysis Services
- 12.2.3. Field Testing Services
- 12.2.4. Data Interpretation & Reporting Services
- 12.2.5. Condition-Based Maintenance Services
- 12.2.6. Others
- 13. Global Oil Condition Monitoring Market Analysis, by End Use Industry
- 13.1. Key Segment Analysis
- 13.2. Oil Condition Monitoring Market Size (Value - US$ Bn and Volume - Million Units), Analysis, and Forecasts, by End Use Industry, 2021-2035
- 13.2.1. Power Generation
- 13.2.2. Oil & Gas
- 13.2.3. Transportation
- 13.2.4. Automotive & Heavy Vehicles
- 13.2.5. Mining
- 13.2.6. Industrial Manufacturing
- 13.2.7. Marine
- 13.2.8. Aerospace
- 13.2.9. Others
- 14. Global Oil Condition Monitoring Market Analysis and Forecasts, by Region
- 14.1. Key Findings
- 14.2. Oil Condition Monitoring Market Size (Value - US$ Bn and Volume - Million Units), Analysis, and Forecasts, by Region, 2021-2035
- 14.2.1. North America
- 14.2.2. Europe
- 14.2.3. Asia Pacific
- 14.2.4. Middle East
- 14.2.5. Africa
- 14.2.6. South America
- 15. North America Oil Condition Monitoring Market Analysis
- 15.1. Key Segment Analysis
- 15.2. Regional Snapshot
- 15.3. North America Oil Condition Monitoring Market Size Value - US$ Bn and Volume - Million Units), Analysis, and Forecasts, 2021-2035
- 15.3.1. Monitoring Technique
- 15.3.2. Product Type
- 15.3.3. Measurement Parameter
- 15.3.4. Sampling Method
- 15.3.5. Equipment Type
- 15.3.6. Deployment Mode
- 15.3.7. Service Type
- 15.3.8. End Use Industry
- 15.3.9. Country
- 15.3.9.1. USA
- 15.3.9.2. Canada
- 15.3.9.3. Mexico
- 15.4. USA Oil Condition Monitoring Market
- 15.4.1. Country Segmental Analysis
- 15.4.2. Monitoring Technique
- 15.4.3. Product Type
- 15.4.4. Measurement Parameter
- 15.4.5. Sampling Method
- 15.4.6. Equipment Type
- 15.4.7. Deployment Mode
- 15.4.8. Service Type
- 15.4.9. End Use Industry
- 15.5. Canada Oil Condition Monitoring Market
- 15.5.1. Country Segmental Analysis
- 15.5.2. Monitoring Technique
- 15.5.3. Product Type
- 15.5.4. Measurement Parameter
- 15.5.5. Sampling Method
- 15.5.6. Equipment Type
- 15.5.7. Deployment Mode
- 15.5.8. Service Type
- 15.5.9. End Use Industry
- 15.6. Mexico Oil Condition Monitoring Market
- 15.6.1. Country Segmental Analysis
- 15.6.2. Monitoring Technique
- 15.6.3. Product Type
- 15.6.4. Measurement Parameter
- 15.6.5. Sampling Method
- 15.6.6. Equipment Type
- 15.6.7. Deployment Mode
- 15.6.8. Service Type
- 15.6.9. End Use Industry
- 16. Europe Oil Condition Monitoring Market Analysis
- 16.1. Key Segment Analysis
- 16.2. Regional Snapshot
- 16.3. Europe Oil Condition Monitoring Market Size (Value - US$ Bn and Volume - Million Units), Analysis, and Forecasts, 2021-2035
- 16.3.1. Monitoring Technique
- 16.3.2. Product Type
- 16.3.3. Measurement Parameter
- 16.3.4. Sampling Method
- 16.3.5. Equipment Type
- 16.3.6. Deployment Mode
- 16.3.7. Service Type
- 16.3.8. End Use Industry
- 16.3.9. Country
- 16.3.9.1. Germany
- 16.3.9.2. United Kingdom
- 16.3.9.3. France
- 16.3.9.4. Italy
- 16.3.9.5. Spain
- 16.3.9.6. Netherlands
- 16.3.9.7. Nordic Countries
- 16.3.9.8. Poland
- 16.3.9.9. Russia & CIS
- 16.3.9.10. Rest of Europe
- 16.4. Germany Oil Condition Monitoring Market
- 16.4.1. Country Segmental Analysis
- 16.4.2. Monitoring Technique
- 16.4.3. Product Type
- 16.4.4. Measurement Parameter
- 16.4.5. Sampling Method
- 16.4.6. Equipment Type
- 16.4.7. Deployment Mode
- 16.4.8. Service Type
- 16.4.9. End Use Industry
- 16.5. United Kingdom Oil Condition Monitoring Market
- 16.5.1. Country Segmental Analysis
- 16.5.2. Monitoring Technique
- 16.5.3. Product Type
- 16.5.4. Measurement Parameter
- 16.5.5. Sampling Method
- 16.5.6. Equipment Type
- 16.5.7. Deployment Mode
- 16.5.8. Service Type
- 16.5.9. End Use Industry
- 16.6. France Oil Condition Monitoring Market
- 16.6.1. Country Segmental Analysis
- 16.6.2. Monitoring Technique
- 16.6.3. Product Type
- 16.6.4. Measurement Parameter
- 16.6.5. Sampling Method
- 16.6.6. Equipment Type
- 16.6.7. Deployment Mode
- 16.6.8. Service Type
- 16.6.9. End Use Industry
- 16.7. Italy Oil Condition Monitoring Market
- 16.7.1. Country Segmental Analysis
- 16.7.2. Monitoring Technique
- 16.7.3. Product Type
- 16.7.4. Measurement Parameter
- 16.7.5. Sampling Method
- 16.7.6. Equipment Type
- 16.7.7. Deployment Mode
- 16.7.8. Service Type
- 16.7.9. End Use Industry
- 16.8. Spain Oil Condition Monitoring Market
- 16.8.1. Country Segmental Analysis
- 16.8.2. Monitoring Technique
- 16.8.3. Product Type
- 16.8.4. Measurement Parameter
- 16.8.5. Sampling Method
- 16.8.6. Equipment Type
- 16.8.7. Deployment Mode
- 16.8.8. Service Type
- 16.8.9. End Use Industry
- 16.9. Netherlands Oil Condition Monitoring Market
- 16.9.1. Country Segmental Analysis
- 16.9.2. Monitoring Technique
- 16.9.3. Product Type
- 16.9.4. Measurement Parameter
- 16.9.5. Sampling Method
- 16.9.6. Equipment Type
- 16.9.7. Deployment Mode
- 16.9.8. Service Type
- 16.9.9. End Use Industry
- 16.10. Nordic Countries Oil Condition Monitoring Market
- 16.10.1. Country Segmental Analysis
- 16.10.2. Monitoring Technique
- 16.10.3. Product Type
- 16.10.4. Measurement Parameter
- 16.10.5. Sampling Method
- 16.10.6. Equipment Type
- 16.10.7. Deployment Mode
- 16.10.8. Service Type
- 16.10.9. End Use Industry
- 16.11. Poland Oil Condition Monitoring Market
- 16.11.1. Country Segmental Analysis
- 16.11.2. Monitoring Technique
- 16.11.3. Product Type
- 16.11.4. Measurement Parameter
- 16.11.5. Sampling Method
- 16.11.6. Equipment Type
- 16.11.7. Deployment Mode
- 16.11.8. Service Type
- 16.11.9. End Use Industry
- 16.12. Russia & CIS Oil Condition Monitoring Market
- 16.12.1. Country Segmental Analysis
- 16.12.2. Monitoring Technique
- 16.12.3. Product Type
- 16.12.4. Measurement Parameter
- 16.12.5. Sampling Method
- 16.12.6. Equipment Type
- 16.12.7. Deployment Mode
- 16.12.8. Service Type
- 16.12.9. End Use Industry
- 16.13. Rest of Europe Oil Condition Monitoring Market
- 16.13.1. Country Segmental Analysis
- 16.13.2. Monitoring Technique
- 16.13.3. Product Type
- 16.13.4. Measurement Parameter
- 16.13.5. Sampling Method
- 16.13.6. Equipment Type
- 16.13.7. Deployment Mode
- 16.13.8. Service Type
- 16.13.9. End Use Industry
- 17. Asia Pacific Oil Condition Monitoring Market Analysis
- 17.1. Key Segment Analysis
- 17.2. Regional Snapshot
- 17.3. Asia Pacific Oil Condition Monitoring Market Size (Value - US$ Bn and Volume - Million Units), Analysis, and Forecasts, 2021-2035
- 17.3.1. Monitoring Technique
- 17.3.2. Product Type
- 17.3.3. Measurement Parameter
- 17.3.4. Sampling Method
- 17.3.5. Equipment Type
- 17.3.6. Deployment Mode
- 17.3.7. Service Type
- 17.3.8. End Use Industry
- 17.3.9. Country
- 17.3.9.1. China
- 17.3.9.2. India
- 17.3.9.3. Japan
- 17.3.9.4. South Korea
- 17.3.9.5. Australia and New Zealand
- 17.3.9.6. Indonesia
- 17.3.9.7. Malaysia
- 17.3.9.8. Thailand
- 17.3.9.9. Vietnam
- 17.3.9.10. Rest of Asia Pacific
- 17.4. China Oil Condition Monitoring Market
- 17.4.1. Country Segmental Analysis
- 17.4.2. Monitoring Technique
- 17.4.3. Product Type
- 17.4.4. Measurement Parameter
- 17.4.5. Sampling Method
- 17.4.6. Equipment Type
- 17.4.7. Deployment Mode
- 17.4.8. Service Type
- 17.4.9. End Use Industry
- 17.5. India Oil Condition Monitoring Market
- 17.5.1. Country Segmental Analysis
- 17.5.2. Monitoring Technique
- 17.5.3. Product Type
- 17.5.4. Measurement Parameter
- 17.5.5. Sampling Method
- 17.5.6. Equipment Type
- 17.5.7. Deployment Mode
- 17.5.8. Service Type
- 17.5.9. End Use Industry
- 17.6. Japan Oil Condition Monitoring Market
- 17.6.1. Country Segmental Analysis
- 17.6.2. Monitoring Technique
- 17.6.3. Product Type
- 17.6.4. Measurement Parameter
- 17.6.5. Sampling Method
- 17.6.6. Equipment Type
- 17.6.7. Deployment Mode
- 17.6.8. Service Type
- 17.6.9. End Use Industry
- 17.7. South Korea Oil Condition Monitoring Market
- 17.7.1. Country Segmental Analysis
- 17.7.2. Monitoring Technique
- 17.7.3. Product Type
- 17.7.4. Measurement Parameter
- 17.7.5. Sampling Method
- 17.7.6. Equipment Type
- 17.7.7. Deployment Mode
- 17.7.8. Service Type
- 17.7.9. End Use Industry
- 17.8. Australia and New Zealand Oil Condition Monitoring Market
- 17.8.1. Country Segmental Analysis
- 17.8.2. Monitoring Technique
- 17.8.3. Product Type
- 17.8.4. Measurement Parameter
- 17.8.5. Sampling Method
- 17.8.6. Equipment Type
- 17.8.7. Deployment Mode
- 17.8.8. Service Type
- 17.8.9. End Use Industry
- 17.9. Indonesia Oil Condition Monitoring Market
- 17.9.1. Country Segmental Analysis
- 17.9.2. Monitoring Technique
- 17.9.3. Product Type
- 17.9.4. Measurement Parameter
- 17.9.5. Sampling Method
- 17.9.6. Equipment Type
- 17.9.7. Deployment Mode
- 17.9.8. Service Type
- 17.9.9. End Use Industry
- 17.10. Malaysia Oil Condition Monitoring Market
- 17.10.1. Country Segmental Analysis
- 17.10.2. Monitoring Technique
- 17.10.3. Product Type
- 17.10.4. Measurement Parameter
- 17.10.5. Sampling Method
- 17.10.6. Equipment Type
- 17.10.7. Deployment Mode
- 17.10.8. Service Type
- 17.10.9. End Use Industry
- 17.11. Thailand Oil Condition Monitoring Market
- 17.11.1. Country Segmental Analysis
- 17.11.2. Monitoring Technique
- 17.11.3. Product Type
- 17.11.4. Measurement Parameter
- 17.11.5. Sampling Method
- 17.11.6. Equipment Type
- 17.11.7. Deployment Mode
- 17.11.8. Service Type
- 17.11.9. End Use Industry
- 17.12. Vietnam Oil Condition Monitoring Market
- 17.12.1. Country Segmental Analysis
- 17.12.2. Monitoring Technique
- 17.12.3. Product Type
- 17.12.4. Measurement Parameter
- 17.12.5. Sampling Method
- 17.12.6. Equipment Type
- 17.12.7. Deployment Mode
- 17.12.8. Service Type
- 17.12.9. End Use Industry
- 17.13. Rest of Asia Pacific Oil Condition Monitoring Market
- 17.13.1. Country Segmental Analysis
- 17.13.2. Monitoring Technique
- 17.13.3. Product Type
- 17.13.4. Measurement Parameter
- 17.13.5. Sampling Method
- 17.13.6. Equipment Type
- 17.13.7. Deployment Mode
- 17.13.8. Service Type
- 17.13.9. End Use Industry
- 18. Middle East Oil Condition Monitoring Market Analysis
- 18.1. Key Segment Analysis
- 18.2. Regional Snapshot
- 18.3. Middle East Oil Condition Monitoring Market Size (Value - US$ Bn and Volume - Million Units), Analysis, and Forecasts, 2021-2035
- 18.3.1. Monitoring Technique
- 18.3.2. Product Type
- 18.3.3. Measurement Parameter
- 18.3.4. Sampling Method
- 18.3.5. Equipment Type
- 18.3.6. Deployment Mode
- 18.3.7. Service Type
- 18.3.8. End Use Industry
- 18.3.9. Country
- 18.3.9.1. Turkey
- 18.3.9.2. UAE
- 18.3.9.3. Saudi Arabia
- 18.3.9.4. Israel
- 18.3.9.5. Rest of Middle East
- 18.4. Turkey Oil Condition Monitoring Market
- 18.4.1. Country Segmental Analysis
- 18.4.2. Monitoring Technique
- 18.4.3. Product Type
- 18.4.4. Measurement Parameter
- 18.4.5. Sampling Method
- 18.4.6. Equipment Type
- 18.4.7. Deployment Mode
- 18.4.8. Service Type
- 18.4.9. End Use Industry
- 18.5. UAE Oil Condition Monitoring Market
- 18.5.1. Country Segmental Analysis
- 18.5.2. Monitoring Technique
- 18.5.3. Product Type
- 18.5.4. Measurement Parameter
- 18.5.5. Sampling Method
- 18.5.6. Equipment Type
- 18.5.7. Deployment Mode
- 18.5.8. Service Type
- 18.5.9. End Use Industry
- 18.6. Saudi Arabia Oil Condition Monitoring Market
- 18.6.1. Country Segmental Analysis
- 18.6.2. Monitoring Technique
- 18.6.3. Product Type
- 18.6.4. Measurement Parameter
- 18.6.5. Sampling Method
- 18.6.6. Equipment Type
- 18.6.7. Deployment Mode
- 18.6.8. Service Type
- 18.6.9. End Use Industry
- 18.7. Israel Oil Condition Monitoring Market
- 18.7.1. Country Segmental Analysis
- 18.7.2. Monitoring Technique
- 18.7.3. Product Type
- 18.7.4. Measurement Parameter
- 18.7.5. Sampling Method
- 18.7.6. Equipment Type
- 18.7.7. Deployment Mode
- 18.7.8. Service Type
- 18.7.9. End Use Industry
- 18.8. Rest of Middle East Oil Condition Monitoring Market
- 18.8.1. Country Segmental Analysis
- 18.8.2. Monitoring Technique
- 18.8.3. Product Type
- 18.8.4. Measurement Parameter
- 18.8.5. Sampling Method
- 18.8.6. Equipment Type
- 18.8.7. Deployment Mode
- 18.8.8. Service Type
- 18.8.9. End Use Industry
- 19. Africa Oil Condition Monitoring Market Analysis
- 19.1. Key Segment Analysis
- 19.2. Regional Snapshot
- 19.3. Africa Oil Condition Monitoring Market Size (Value - US$ Bn and Volume - Million Units), Analysis, and Forecasts, 2021-2035
- 19.3.1. Monitoring Technique
- 19.3.2. Product Type
- 19.3.3. Measurement Parameter
- 19.3.4. Sampling Method
- 19.3.5. Equipment Type
- 19.3.6. Deployment Mode
- 19.3.7. Service Type
- 19.3.8. End Use Industry
- 19.3.9. Country
- 19.3.9.1. South Africa
- 19.3.9.2. Egypt
- 19.3.9.3. Nigeria
- 19.3.9.4. Algeria
- 19.3.9.5. Rest of Africa
- 19.4. South Africa Oil Condition Monitoring Market
- 19.4.1. Country Segmental Analysis
- 19.4.2. Monitoring Technique
- 19.4.3. Product Type
- 19.4.4. Measurement Parameter
- 19.4.5. Sampling Method
- 19.4.6. Equipment Type
- 19.4.7. Deployment Mode
- 19.4.8. Service Type
- 19.4.9. End Use Industry
- 19.5. Egypt Oil Condition Monitoring Market
- 19.5.1. Country Segmental Analysis
- 19.5.2. Monitoring Technique
- 19.5.3. Product Type
- 19.5.4. Measurement Parameter
- 19.5.5. Sampling Method
- 19.5.6. Equipment Type
- 19.5.7. Deployment Mode
- 19.5.8. Service Type
- 19.5.9. End Use Industry
- 19.6. Nigeria Oil Condition Monitoring Market
- 19.6.1. Country Segmental Analysis
- 19.6.2. Monitoring Technique
- 19.6.3. Product Type
- 19.6.4. Measurement Parameter
- 19.6.5. Sampling Method
- 19.6.6. Equipment Type
- 19.6.7. Deployment Mode
- 19.6.8. Service Type
- 19.6.9. End Use Industry
- 19.7. Algeria Oil Condition Monitoring Market
- 19.7.1. Country Segmental Analysis
- 19.7.2. Monitoring Technique
- 19.7.3. Product Type
- 19.7.4. Measurement Parameter
- 19.7.5. Sampling Method
- 19.7.6. Equipment Type
- 19.7.7. Deployment Mode
- 19.7.8. Service Type
- 19.7.9. End Use Industry
- 19.8. Rest of Africa Oil Condition Monitoring Market
- 19.8.1. Country Segmental Analysis
- 19.8.2. Monitoring Technique
- 19.8.3. Product Type
- 19.8.4. Measurement Parameter
- 19.8.5. Sampling Method
- 19.8.6. Equipment Type
- 19.8.7. Deployment Mode
- 19.8.8. Service Type
- 19.8.9. End Use Industry
- 20. South America Oil Condition Monitoring Market Analysis
- 20.1. Key Segment Analysis
- 20.2. Regional Snapshot
- 20.3. South America Oil Condition Monitoring Market Size (Value - US$ Bn and Volume - Million Units), Analysis, and Forecasts, 2021-2035
- 20.3.1. Monitoring Technique
- 20.3.2. Product Type
- 20.3.3. Measurement Parameter
- 20.3.4. Sampling Method
- 20.3.5. Equipment Type
- 20.3.6. Deployment Mode
- 20.3.7. Service Type
- 20.3.8. End Use Industry
- 20.3.9. Country
- 20.3.9.1. Brazil
- 20.3.9.2. Argentina
- 20.3.9.3. Rest of South America
- 20.4. Brazil Oil Condition Monitoring Market
- 20.4.1. Country Segmental Analysis
- 20.4.2. Monitoring Technique
- 20.4.3. Product Type
- 20.4.4. Measurement Parameter
- 20.4.5. Sampling Method
- 20.4.6. Equipment Type
- 20.4.7. Deployment Mode
- 20.4.8. Service Type
- 20.4.9. End Use Industry
- 20.5. Argentina Oil Condition Monitoring Market
- 20.5.1. Country Segmental Analysis
- 20.5.2. Monitoring Technique
- 20.5.3. Product Type
- 20.5.4. Measurement Parameter
- 20.5.5. Sampling Method
- 20.5.6. Equipment Type
- 20.5.7. Deployment Mode
- 20.5.8. Service Type
- 20.5.9. End Use Industry
- 20.6. Rest of South America Oil Condition Monitoring Market
- 20.6.1. Country Segmental Analysis
- 20.6.2. Monitoring Technique
- 20.6.3. Product Type
- 20.6.4. Measurement Parameter
- 20.6.5. Sampling Method
- 20.6.6. Equipment Type
- 20.6.7. Deployment Mode
- 20.6.8. Service Type
- 20.6.9. End Use Industry
- 21. Key Players/ Company Profile
- 21.1. ALS Limited
- 21.1.1. Company Details/ Overview
- 21.1.2. Company Financials
- 21.1.3. Key Customers and Competitors
- 21.1.4. Business/ Industry Portfolio
- 21.1.5. Product Portfolio/ Specification Details
- 21.1.6. Pricing Data
- 21.1.7. Strategic Overview
- 21.1.8. Recent Developments
- 21.2. AMETEK
- 21.3. BP
- 21.4. Bureau Veritas
- 21.5. Castrol
- 21.6. Chevron Corporation
- 21.7. CM Technologies
- 21.8. ExxonMobil
- 21.9. GasTOPS
- 21.10. Hydrotex
- 21.11. Intertek Group
- 21.12. OPTRONICS International
- 21.13. Parker Hannifin
- 21.14. SGS
- 21.15. Shell
- 21.16. SKF
- 21.17. Spectro Scientific
- 21.18. Teledyne Technologies
- 21.19. TotalEnergies
- 21.20. Trico Corporation
- 21.21. Other Key Players
- 21.1. ALS Limited
Note* - This is just tentative list of players. While providing the report, we will cover more number of players based on their revenue and share for each geography
Research Design
Our research design integrates both demand-side and supply-side analysis through a balanced combination of primary and secondary research methodologies. By utilizing both bottom-up and top-down approaches alongside rigorous data triangulation methods, we deliver robust market intelligence that supports strategic decision-making.
MarketGenics' comprehensive research design framework ensures the delivery of accurate, reliable, and actionable market intelligence. Through the integration of multiple research approaches, rigorous validation processes, and expert analysis, we provide our clients with the insights needed to make informed strategic decisions and capitalize on market opportunities.

MarketGenics leverages a dedicated industry panel of experts and a comprehensive suite of paid databases to effectively collect, consolidate, and analyze market intelligence.
Our approach has consistently proven to be reliable and effective in generating accurate market insights, identifying key industry trends, and uncovering emerging business opportunities.
Through both primary and secondary research, we capture and analyze critical company-level data such as manufacturing footprints, including technical centers, R&D facilities, sales offices, and headquarters.
Our expert panel further enhances our ability to estimate market size for specific brands based on validated field-level intelligence.
Our data mining techniques incorporate both parametric and non-parametric methods, allowing for structured data collection, sorting, processing, and cleaning.
Demand projections are derived from large-scale data sets analyzed through proprietary algorithms, culminating in robust and reliable market sizing.
Research Approach
The bottom-up approach builds market estimates by starting with the smallest addressable market units and systematically aggregating them to create comprehensive market size projections.
This method begins with specific, granular data points and builds upward to create the complete market landscape.
Customer Analysis → Segmental Analysis → Geographical Analysis
The top-down approach starts with the broadest possible market data and systematically narrows it down through a series of filters and assumptions to arrive at specific market segments or opportunities.
This method begins with the big picture and works downward to increasingly specific market slices.
TAM → SAM → SOM


Research Methods
Desk / Secondary Research
While analysing the market, we extensively study secondary sources, directories, and databases to identify and collect information useful for this technical, market-oriented, and commercial report. Secondary sources that we utilize are not only the public sources, but it is a combination of Open Source, Associations, Paid Databases, MG Repository & Knowledgebase, and others.
- Company websites, annual reports, financial reports, broker reports, and investor presentations
- National government documents, statistical databases and reports
- News articles, press releases and web-casts specific to the companies operating in the market, Magazines, reports, and others
- We gather information from commercial data sources for deriving company specific data such as segmental revenue, share for geography, product revenue, and others
- Internal and external proprietary databases (industry-specific), relevant patent, and regulatory databases
- Governing Bodies, Government Organizations
- Relevant Authorities, Country-specific Associations for Industries
We also employ the model mapping approach to estimate the product level market data through the players' product portfolio
Primary Research
Primary research/ interviews is vital in analyzing the market. Most of the cases involves paid primary interviews. Primary sources include primary interviews through e-mail interactions, telephonic interviews, surveys as well as face-to-face interviews with the different stakeholders across the value chain including several industry experts.
| Type of Respondents | Number of Primaries |
|---|---|
| Tier 2/3 Suppliers | ~20 |
| Tier 1 Suppliers | ~25 |
| End-users | ~25 |
| Industry Expert/ Panel/ Consultant | ~30 |
| Total | ~100 |
MG Knowledgebase
• Repository of industry blog, newsletter and case studies
• Online platform covering detailed market reports, and company profiles
Forecasting Factors and Models
Forecasting Factors
- Historical Trends – Past market patterns, cycles, and major events that shaped how markets behave over time. Understanding past trends helps predict future behavior.
- Industry Factors – Specific characteristics of the industry like structure, regulations, and innovation cycles that affect market dynamics.
- Macroeconomic Factors – Economic conditions like GDP growth, inflation, and employment rates that affect how much money people have to spend.
- Demographic Factors – Population characteristics like age, income, and location that determine who can buy your product.
- Technology Factors – How quickly people adopt new technology and how much technology infrastructure exists.
- Regulatory Factors – Government rules, laws, and policies that can help or restrict market growth.
- Competitive Factors – Analyzing competition structure such as degree of competition and bargaining power of buyers and suppliers.
Forecasting Models / Techniques
Multiple Regression Analysis
- Identify and quantify factors that drive market changes
- Statistical modeling to establish relationships between market drivers and outcomes
Time Series Analysis – Seasonal Patterns
- Understand regular cyclical patterns in market demand
- Advanced statistical techniques to separate trend, seasonal, and irregular components
Time Series Analysis – Trend Analysis
- Identify underlying market growth patterns and momentum
- Statistical analysis of historical data to project future trends
Expert Opinion – Expert Interviews
- Gather deep industry insights and contextual understanding
- In-depth interviews with key industry stakeholders
Multi-Scenario Development
- Prepare for uncertainty by modeling different possible futures
- Creating optimistic, pessimistic, and most likely scenarios
Time Series Analysis – Moving Averages
- Sophisticated forecasting for complex time series data
- Auto-regressive integrated moving average models with seasonal components
Econometric Models
- Apply economic theory to market forecasting
- Sophisticated economic models that account for market interactions
Expert Opinion – Delphi Method
- Harness collective wisdom of industry experts
- Structured, multi-round expert consultation process
Monte Carlo Simulation
- Quantify uncertainty and probability distributions
- Thousands of simulations with varying input parameters
Research Analysis
Our research framework is built upon the fundamental principle of validating market intelligence from both demand and supply perspectives. This dual-sided approach ensures comprehensive market understanding and reduces the risk of single-source bias.
Demand-Side Analysis: We understand end-user/application behavior, preferences, and market needs along with the penetration of the product for specific application.
Supply-Side Analysis: We estimate overall market revenue, analyze the segmental share along with industry capacity, competitive landscape, and market structure.
Validation & Evaluation
Data triangulation is a validation technique that uses multiple methods, sources, or perspectives to examine the same research question, thereby increasing the credibility and reliability of research findings. In market research, triangulation serves as a quality assurance mechanism that helps identify and minimize bias, validate assumptions, and ensure accuracy in market estimates.
- Data Source Triangulation – Using multiple data sources to examine the same phenomenon
- Methodological Triangulation – Using multiple research methods to study the same research question
- Investigator Triangulation – Using multiple researchers or analysts to examine the same data
- Theoretical Triangulation – Using multiple theoretical perspectives to interpret the same data

Custom Market Research Services
We will customise the research for you, in case the report listed above does not meet your requirements.
Get 10% Free Customisation