Power Distribution Automation Market Size, Share & Trends Analysis Report by Component (Field Devices, Software, Services), Product Type, Implementation/ Automation Stage, Communication Technology, Utility Type, Deployment Mode, Ownership Model, Application, End-User and Geography (North America, Europe, Asia Pacific, Middle East, Africa, and South America) – Global Industry Data, Trends, and Forecasts, 2026–2035
|
Market Structure & Evolution |
|
|
Segmental Data Insights |
|
|
Demand Trends |
|
|
Competitive Landscape |
|
|
Strategic Development |
|
|
Future Outlook & Opportunities |
|
Power Distribution Automation Market Size, Share, and Growth
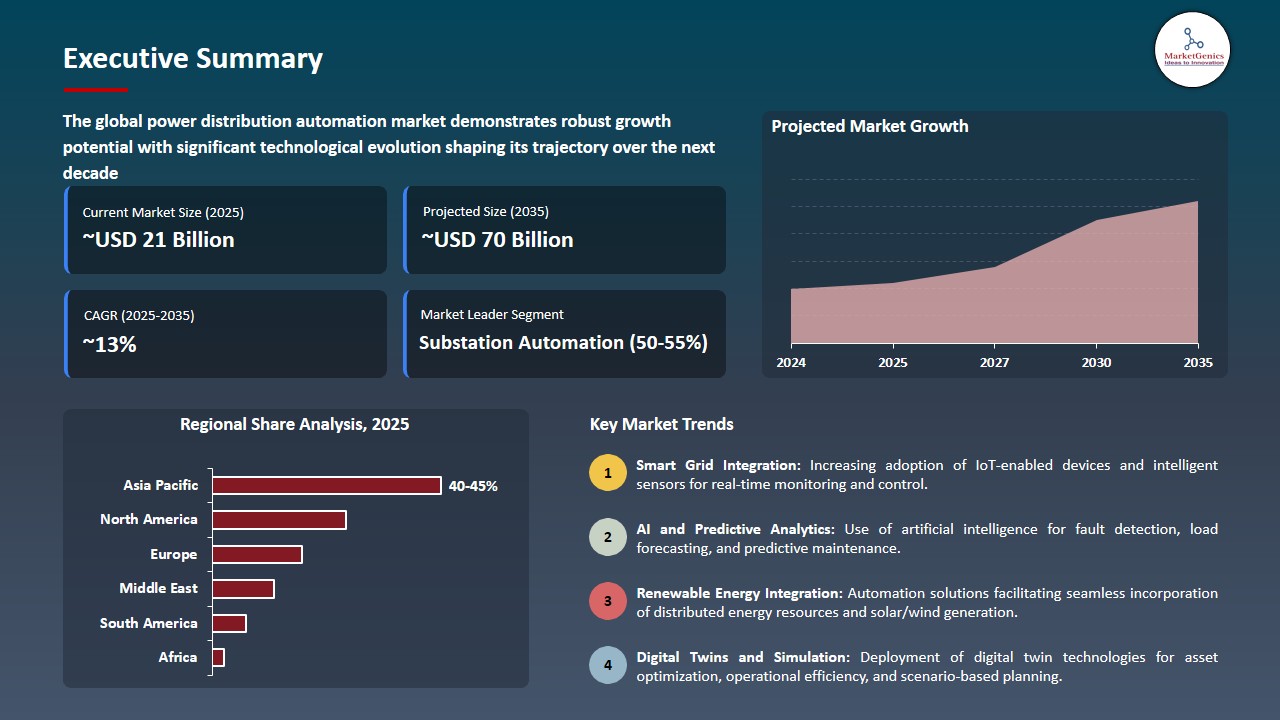
The global power distribution automation market is experiencing robust growth, with its estimated value of USD 21.3 billion in the year 2025 and USD 70.4 billion by 2035, registering a CAGR of 12.7% during the forecast period.
Mateo Jaramillo, Chief Executive Officer of Form Energy, stated that our iron-air battery technology delivers reliable multi-day energy storage because its system cost enables the operation of a completely renewable electric grid. We provide long-duration storage solutions which help utilities maintain their reliability standards while they work to adopt clean energy solutions.
Power distribution automation market growth is occurring worldwide because of multiple essential factors which include enhanced smart grid technology adoption and the demand for dependable electricity distribution systems. The grid automation solutions of Siemens and other utilities now include their advanced systems which detect faults and operate as automated recovery mechanisms for better network performance.
The current energy distribution systems now require more intelligent control systems because of the increased usage of renewable energy sources together with distributed energy resources. Schneider Electric has developed advanced distribution management systems which provide real-time monitoring capabilities and enable better grid control to facilitate distributed power generation.
Utilities are now required to develop automated distribution systems because of North America and Europe implementing strict regulations which mandate energy efficiency and grid modernization. The development of the power distribution automation market accelerates because digitalization and renewable energy integration together with regulatory backing create new market opportunities which enhance grid performance and operational productivity.
The global power distribution automation market provides additional business prospects through its connections to smart metering infrastructure and advanced distribution management systems and outage management systems and grid cybersecurity solutions and energy storage integration facilities. The development of power sector companies can achieve better grid intelligence and energy distribution efficiency and income growth through their use of adjacent markets.
Power Distribution Automation Market Dynamics and Trends
Driver: Increasing Grid Modernization Mandates Driving Adoption of Power Distribution Automation
-
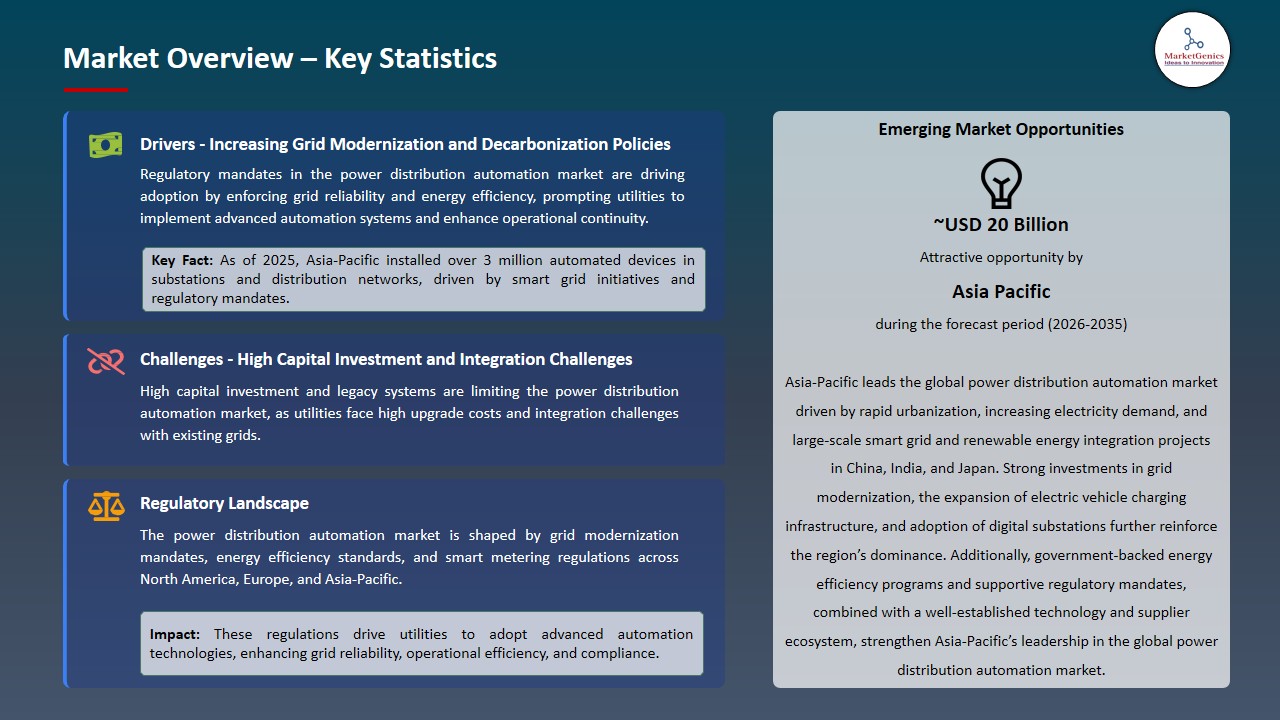
The power distribution automation market experiences rapid expansion because of changing regulatory frameworks which require improvements in grid systems and energy efficiency and system reliability. The European Union Clean Energy Package and smart grid requirements in the United States and China compel utilities to implement automated distribution systems with advanced monitoring technologies.
- The regulatory system establishes resilience-based rules while creating utility performance benchmarks which drive utility companies to invest in systems that manage outages and self-sustaining energy grids. The company ABB has expanded its digital distribution solutions portfolio which enables utility companies to achieve both reliability and regulatory compliance through automated systems and live data analysis.
- The growing demand for electricity in transportation and industrial sectors together with increasing power consumption creates a need for automated systems which protect continuous power delivery while satisfying efficiency and emissions reduction requirements. All these factors are likely to continue to escalate the growth of the power distribution automation market.
Restraint: High Capital Investment and Integration Challenges Limiting Widespread Adoption
-
The regulatory push for power distribution automation has failed to achieve successful implementation because power companies need to spend substantial money to upgrade their existing systems with automated and digital technology. Many utilities, especially in developing regions, still rely on aging infrastructure that is not easily compatible with modern automation solutions.
- The integration of advanced technologies that include intelligent electronic devices and communication networks and software platforms into existing systems needs substantial financial resources together with qualified personnel and extended timeframes for execution. The complexity of the system creates financial operational difficulties which small and mid-sized utilities need to handle.
- The main obstacle for organizations exists because they must find ways to control expenses while developing advanced grid systems when their return on investment remains unknown and regulatory backing is insufficient. All these elements are expected to restrict the expansion of the power distribution automation market.
Opportunity: Expansion of Smart Grid Projects and Rural Electrification Initiatives
-
Emerging economies across Asia Pacific, Africa, and Latin America are investing heavily in smart grid infrastructure and rural electrification programs which create strong business opportunities for power distribution automation solutions. India implements smart meters and automated distribution networks through national initiatives that aim to enhance energy access and efficiency.
- Global technology providers are working together with utilities and governments to create grid automation solutions that can be implemented at scale. General Electric has participated in establishing advanced distribution management systems and grid automation technologies through its work in emerging markets which aim to improve grid reliability and renewable energy integration.
- The initiatives enable vendors to extend their presence in high-growth regions through their automation hardware and communication technologies and software platforms. All these advancements are likely to create more opportunities in future for power distribution automation market.
Key Trend: Integration of AI, IoT, and Advanced Analytics Enhancing Grid Intelligence
-
The power distribution automation market sees its main trend through the combination of artificial intelligence with Internet of Things devices and advanced analytics technologies which create intelligent grid systems that adapt to changing conditions. Utilities use real-time data from their connected devices to forecast equipment failures and optimize their power distribution and minimize their service interruptions.
- Digital twins and predictive maintenance tools now experience increased implementation across the industry because they assist utility companies with operational efficiency and asset performance management. Siemens implements AI-driven analytics into its grid automation systems to improve decision-making and operational efficiency through advanced technological solutions.
- The combination of these technologies creates a new type of distribution network which operates as an intelligent self-healing system that enables worldwide power distribution automation to become more widespread. All these elements are expected to influence significant trends in the power distribution automation market.
Power Distribution Automation Market Analysis and Segmental Data
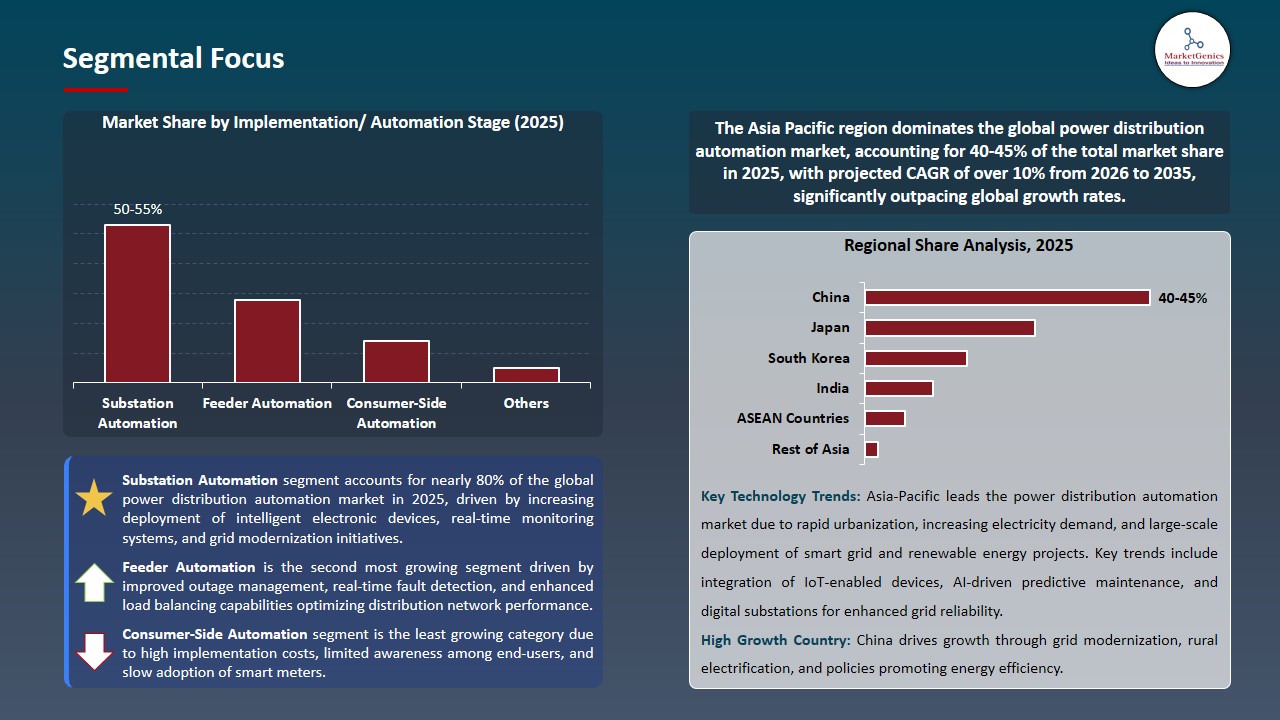
Substation Automation Dominates Global Power Distribution Automation Market amid Rising Grid Modernization and Digitalization
-
The global power distribution automation market is currently dominated by substation automation because utilities need to achieve dependable and effective grid operations while integrating renewable energy sources and using advanced monitoring and control systems.
- Real-time fault detection and predictive maintenance capabilities receive improvement from advanced communication networks together with intelligent electronic devices which enable better grid system protection.
- North America and Asia Pacific utilities used 2025 to speed up their substation digitalization initiatives which help them implement distributed energy resources and smart grid projects while proving that substation automation leads the field thus demonstrating the substation automation’s ongoing dominance within the power distribution automation market.
Asia Pacific Dominates Power Distribution Automation Market amid Rapid Electrification and Smart Grid Expansion
-
The Asia Pacific region leads the power distribution automation market because of its extensive state-driven infrastructure development projects and increasing electricity needs from urban and industrial expansion and its commitment to deploying smart meters and IoT grid technologies.
- China and India allocate substantial funds to develop advanced distribution systems which will enhance power system reliability and support their increasing use of renewable energy sources. Asia Pacific utilities implemented more than three million automation devices during 2024-25 through state-sponsored grid projects which aimed to improve operational performance and decrease service disruptions.
- The regional emphasis on creating connections between electric vehicle charging stations and distributed energy systems drives more businesses to implement automated systems. The region's continual strengthening is current global leadership in power distribution automation market.
Power Distribution Automation Market Ecosyste
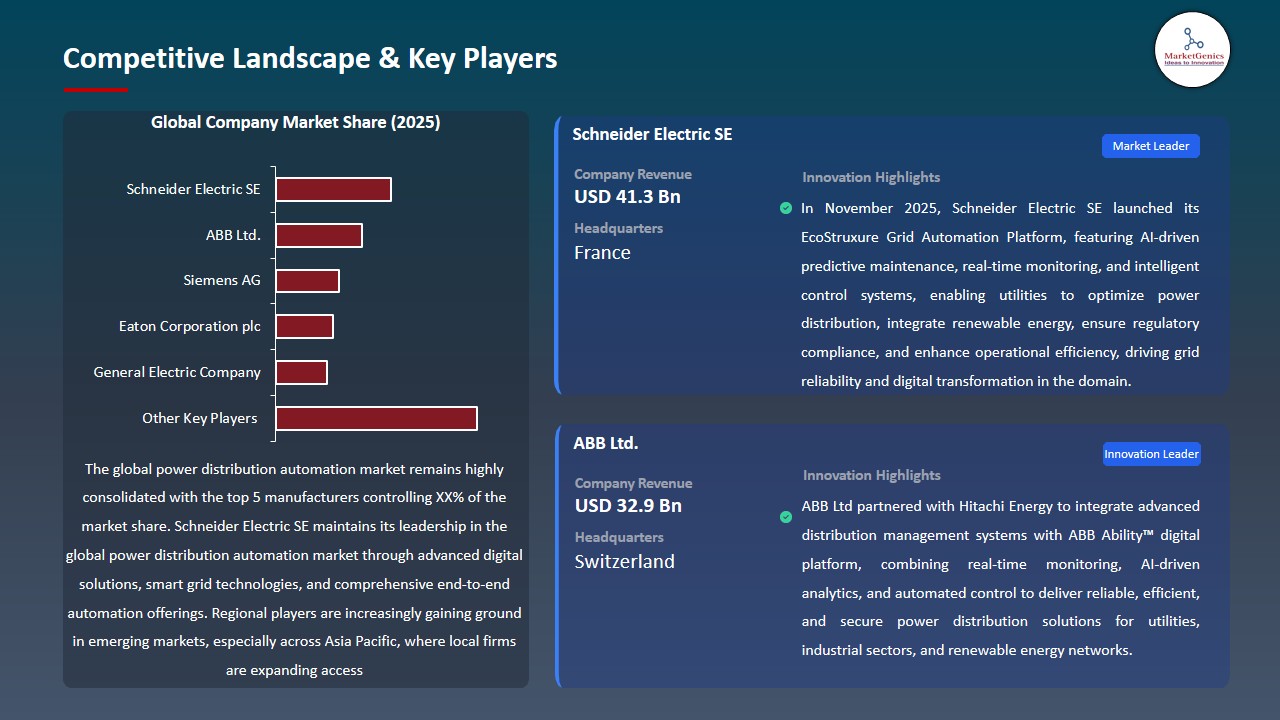
The power distribution automation market ecosystem displays high consolidation because Siemens ABB and Schneider Electric serve as the primary global market leaders while S&C Electric Company and NARI Technology Co Ltd operate as regional providers of specialized solutions.
The value chain consists of two components which include component manufacturing for intelligent electronic devices and sensors and system integration services that support utilities in their automation platform deployment. In February 2024 Siemens introduced new software which improves grid visibility and renewable energy integration functions to demonstrate their commitment to continuous software and integration development.
Recent Development and Strategic Overview:
-
In November 2025, General Electric introduced its GridIQ Adaptive Protection system, which uses real-time data analysis and edge computing technology to enable quicker fault detection and automatic restoration of distribution systems. The system improves operational resilience because it automatically adjusts protection mechanisms according to current grid conditions, which enables utilities to maintain service quality during periods of changing demand.
- In October 2025, Hitachi Energy introduced its Distribution Automation as a Service solution which combines AI-powered predictive maintenance with cloud-based distribution management. The service allows utilities to enhance asset performance by predicting equipment failures and achieving better grid performance through digital transformation of their existing distribution systems.
Report Scope
|
Attribute |
Detail |
|
Market Size in 2025 |
USD 21.3 Bn |
|
Market Forecast Value in 2035 |
USD 70.4 Bn |
|
Growth Rate (CAGR) |
12.7% |
|
Forecast Period |
2026 – 2035 |
|
Historical Data Available for |
2021 – 2024 |
|
Market Size Units |
USD Bn for Value |
|
Report Format |
Electronic (PDF) + Excel |
|
Regions and Countries Covered |
|||||
|
North America |
Europe |
Asia Pacific |
Middle East |
Africa |
South America |
|
|
|
|
|
|
|
Companies Covered |
|||||
|
|
|
|
|
|
Power Distribution Automation Market Segmentation and Highlights
|
Segment |
Sub-segment |
|
Power Distribution Automation Market, By Component |
|
|
Power Distribution Automation Market, By Product Type |
|
|
Power Distribution Automation Market, By Implementation/ Automation Stage |
|
|
Power Distribution Automation Market, By Communication Technology |
|
|
Power Distribution Automation Market, By Utility Type |
|
|
Power Distribution Automation Market, By Deployment Mode |
|
|
Power Distribution Automation Market, By Ownership Model |
|
|
Power Distribution Automation Market, By Application |
|
|
Power Distribution Automation Market, By End-User |
|
Frequently Asked Questions
Table of Contents
- 1. Research Methodology and Assumptions
- 1.1. Definitions
- 1.2. Research Design and Approach
- 1.3. Data Collection Methods
- 1.4. Base Estimates and Calculations
- 1.5. Forecasting Models
- 1.5.1. Key Forecast Factors & Impact Analysis
- 1.6. Secondary Research
- 1.6.1. Open Sources
- 1.6.2. Paid Databases
- 1.6.3. Associations
- 1.7. Primary Research
- 1.7.1. Primary Sources
- 1.7.2. Primary Interviews with Stakeholders across Ecosystem
- 2. Executive Summary
- 2.1. Global Power Distribution Automation Market Outlook
- 2.1.1. Power Distribution Automation Market Size (Value - US$ Bn), and Forecasts, 2021-2035
- 2.1.2. Compounded Annual Growth Rate Analysis
- 2.1.3. Growth Opportunity Analysis
- 2.1.4. Segmental Share Analysis
- 2.1.5. Geographical Share Analysis
- 2.2. Market Analysis and Facts
- 2.3. Supply-Demand Analysis
- 2.4. Competitive Benchmarking
- 2.5. Go-to- Market Strategy
- 2.5.1. Customer/ End-use Industry Assessment
- 2.5.2. Growth Opportunity Data, 2026-2035
- 2.5.2.1. Regional Data
- 2.5.2.2. Country Data
- 2.5.2.3. Segmental Data
- 2.5.3. Identification of Potential Market Spaces
- 2.5.4. GAP Analysis
- 2.5.5. Potential Attractive Price Points
- 2.5.6. Prevailing Market Risks & Challenges
- 2.5.7. Preferred Sales & Marketing Strategies
- 2.5.8. Key Recommendations and Analysis
- 2.5.9. A Way Forward
- 2.1. Global Power Distribution Automation Market Outlook
- 3. Industry Data and Premium Insights
- 3.1. Global Energy & Power Industry Overview, 2025
- 3.1.1. Energy & Power Industry Analysis
- 3.1.2. Key Trends for Energy & Power Industry
- 3.1.3. Regional Distribution for Energy & Power Industry
- 3.2. Supplier Customer Data
- 3.3. Technology Roadmap and Developments
- 3.1. Global Energy & Power Industry Overview, 2025
- 4. Market Overview
- 4.1. Market Dynamics
- 4.1.1. Drivers
- 4.1.1.1. Rising grid modernization initiatives and smart grid deployments worldwide.
- 4.1.1.2. Increasing integration of renewable energy and distributed energy resources (DERs).
- 4.1.1.3. Adoption of AI, IoT, and real-time analytics for predictive maintenance and fault management.
- 4.1.2. Restraints
- 4.1.2.1. High capital investment and upgrade costs for legacy infrastructure.
- 4.1.2.2. Complexity in integrating diverse devices and ensuring interoperability.
- 4.1.1. Drivers
- 4.2. Key Trend Analysis
- 4.3. Regulatory Framework
- 4.3.1. Key Regulations, Norms, and Subsidies, by Key Countries
- 4.3.2. Tariffs and Standards
- 4.3.3. Impact Analysis of Regulations on the Market
- 4.4. Value Chain Analysis
- 4.5. Porter’s Five Forces Analysis
- 4.6. PESTEL Analysis
- 4.7. Global Power Distribution Automation Market Demand
- 4.7.1. Historical Market Size – Value (US$ Bn), 2020-2024
- 4.7.2. Current and Future Market Size – Value (US$ Bn), 2026–2035
- 4.7.2.1. Y-o-Y Growth Trends
- 4.7.2.2. Absolute $ Opportunity Assessment
- 4.1. Market Dynamics
- 5. Competition Landscape
- 5.1. Competition structure
- 5.1.1. Fragmented v/s consolidated
- 5.2. Company Share Analysis, 2025
- 5.2.1. Global Company Market Share
- 5.2.2. By Region
- 5.2.2.1. North America
- 5.2.2.2. Europe
- 5.2.2.3. Asia Pacific
- 5.2.2.4. Middle East
- 5.2.2.5. Africa
- 5.2.2.6. South America
- 5.3. Product Comparison Matrix
- 5.3.1. Specifications
- 5.3.2. Market Positioning
- 5.3.3. Pricing
- 5.1. Competition structure
- 6. Global Power Distribution Automation Market Analysis, by Component
- 6.1. Key Segment Analysis
- 6.2. Power Distribution Automation Market Size (Value - US$ Bn), Analysis, and Forecasts, by Component, 2021-2035
- 6.2.1. Field Devices
- 6.2.1.1. Intelligent Electronic Devices (IEDs)
- 6.2.1.2. Remote Terminal Units (RTUs)
- 6.2.1.3. Smart Sensors
- 6.2.1.4. Automated Switches & Reclosers
- 6.2.1.5. Others
- 6.2.2. Software
- 6.2.2.1. Distribution Management Systems (DMS)
- 6.2.2.2. Outage Management Systems (OMS)
- 6.2.2.3. SCADA Systems
- 6.2.2.4. Others
- 6.2.3. Services
- 6.2.3.1. Consulting
- 6.2.3.2. Integration & Deployment
- 6.2.3.3. Maintenance & Support
- 6.2.3.4. Communication Infrastructure
- 6.2.3.5. Others
- 6.2.1. Field Devices
- 7. OthersGlobal Power Distribution Automation Market Analysis, by Product Type
- 7.1. Key Segment Analysis
- 7.2. Power Distribution Automation Market Size (Value - US$ Bn), Analysis, and Forecasts, by Product Type, 2021-2035
- 7.2.1. Switchgear
- 7.2.2. Circuit Breakers
- 7.2.3. Protection Relays
- 7.2.4. Fault Detectors
- 7.2.5. Smart Meters
- 7.2.6. Voltage Regulators
- 7.2.7. Others
- 8. Global Power Distribution Automation Market Analysis, by Implementation/ Automation Stage
- 8.1. Key Segment Analysis
- 8.2. Power Distribution Automation Market Size (Value - US$ Bn), Analysis, and Forecasts, by Implementation/ Automation Stage, 2021-2035
- 8.2.1. Substation Automation
- 8.2.2. Feeder Automation
- 8.2.3. Consumer-Side Automation
- 8.2.4. Others
- 9. Global Power Distribution Automation Market Analysis, by Communication Technology
- 9.1. Key Segment Analysis
- 9.2. Power Distribution Automation Market Size (Value - US$ Bn), Analysis, and Forecasts, by Communication Technology, 2021-2035
- 9.2.1. Wired Communication
- 9.2.1.1. Fiber Optics
- 9.2.1.2. Ethernet
- 9.2.2. Wireless Communication
- 9.2.2.1. RF Mesh
- 9.2.2.2. Cellular (3G/4G/5G)
- 9.2.2.3. Satellite
- 9.2.1. Wired Communication
- 10. Global Power Distribution Automation Market Analysis, by Utility Type
- 10.1. Key Segment Analysis
- 10.2. Power Distribution Automation Market Size (Value - US$ Bn), Analysis, and Forecasts, by Utility Type, 2021-2035
- 10.2.1. Public Utilities
- 10.2.2. Private Utilities
- 11. Global Power Distribution Automation Market Analysis, by Deployment Mode
- 11.1. Key Segment Analysis
- 11.2. Power Distribution Automation Market Size (Value - US$ Bn), Analysis, and Forecasts, by Deployment Mode, 2021-2035
- 11.2.1. On-Premises
- 11.2.2. Cloud-Based
- 11.2.3. Hybrid
- 12. Global Power Distribution Automation Market Analysis, by Ownership Model
- 12.1. Key Segment Analysis
- 12.2. Power Distribution Automation Market Size (Value - US$ Bn), Analysis, and Forecasts, by Ownership Model, 2021-2035
- 12.2.1. Utility-Owned
- 12.2.2. Customer-Owned
- 12.2.3. Third-Party Owned
- 13. Global Power Distribution Automation Market Analysis and Forecasts, by Application
- 13.1. Key Findings
- 13.2. Power Distribution Automation Market Size (Value - US$ Bn), Analysis, and Forecasts, by Application, 2021-2035
- 13.2.1. Fault Detection, Isolation & Restoration (FDIR)
- 13.2.2. Voltage & VAR Optimization (VVO)
- 13.2.3. Load Management
- 13.2.4. Energy Management
- 13.2.5. Distribution Network Monitoring
- 13.2.6. Others
- 14. Global Power Distribution Automation Market Analysis and Forecasts, by End-User
- 14.1. Key Findings
- 14.2. Power Distribution Automation Market Size (Value - US$ Bn), Analysis, and Forecasts, by End-User, 2021-2035
- 14.2.1. Industrial
- 14.2.2. Commercial
- 14.2.3. Residential
- 14.2.4. Utilities
- 15. Global Power Distribution Automation Market Analysis and Forecasts, by Region
- 15.1. Key Findings
- 15.2. Power Distribution Automation Market Size (Value - US$ Bn), Analysis, and Forecasts, by Region, 2021-2035
- 15.2.1. North America
- 15.2.2. Europe
- 15.2.3. Asia Pacific
- 15.2.4. Middle East
- 15.2.5. Africa
- 15.2.6. South America
- 16. North America Power Distribution Automation Market Analysis
- 16.1. Key Segment Analysis
- 16.2. Regional Snapshot
- 16.3. North America Power Distribution Automation Market Size (Value - US$ Bn), Analysis, and Forecasts, 2021-2035
- 16.3.1. Component
- 16.3.2. Product Type
- 16.3.3. Implementation/ Automation Stage
- 16.3.4. Communication Technology
- 16.3.5. Utility Type
- 16.3.6. Deployment Mode
- 16.3.7. Ownership Model
- 16.3.8. Application
- 16.3.9. End-User
- 16.3.10. Country
- 16.3.10.1. USA
- 16.3.10.2. Canada
- 16.3.10.3. Mexico
- 16.4. USA Power Distribution Automation Market
- 16.4.1. Country Segmental Analysis
- 16.4.2. Component
- 16.4.3. Product Type
- 16.4.4. Implementation/ Automation Stage
- 16.4.5. Communication Technology
- 16.4.6. Utility Type
- 16.4.7. Deployment Mode
- 16.4.8. Ownership Model
- 16.4.9. Application
- 16.4.10. End-User
- 16.5. Canada Power Distribution Automation Market
- 16.5.1. Country Segmental Analysis
- 16.5.2. Component
- 16.5.3. Product Type
- 16.5.4. Implementation/ Automation Stage
- 16.5.5. Communication Technology
- 16.5.6. Utility Type
- 16.5.7. Deployment Mode
- 16.5.8. Ownership Model
- 16.5.9. Application
- 16.5.10. End-User
- 16.6. Mexico Power Distribution Automation Market
- 16.6.1. Country Segmental Analysis
- 16.6.2. Component
- 16.6.3. Product Type
- 16.6.4. Implementation/ Automation Stage
- 16.6.5. Communication Technology
- 16.6.6. Utility Type
- 16.6.7. Deployment Mode
- 16.6.8. Ownership Model
- 16.6.9. Application
- 16.6.10. End-User
- 17. Europe Power Distribution Automation Market Analysis
- 17.1. Key Segment Analysis
- 17.2. Regional Snapshot
- 17.3. Europe Power Distribution Automation Market Size (Value - US$ Bn), Analysis, and Forecasts, 2021-2035
- 17.3.1. Component
- 17.3.2. Product Type
- 17.3.3. Implementation/ Automation Stage
- 17.3.4. Communication Technology
- 17.3.5. Utility Type
- 17.3.6. Deployment Mode
- 17.3.7. Ownership Model
- 17.3.8. Application
- 17.3.9. End-User
- 17.3.10. Country
- 17.3.10.1. Germany
- 17.3.10.2. United Kingdom
- 17.3.10.3. France
- 17.3.10.4. Italy
- 17.3.10.5. Spain
- 17.3.10.6. Netherlands
- 17.3.10.7. Nordic Countries
- 17.3.10.8. Poland
- 17.3.10.9. Russia & CIS
- 17.3.10.10. Rest of Europe
- 17.4. Germany Power Distribution Automation Market
- 17.4.1. Country Segmental Analysis
- 17.4.2. Component
- 17.4.3. Product Type
- 17.4.4. Implementation/ Automation Stage
- 17.4.5. Communication Technology
- 17.4.6. Utility Type
- 17.4.7. Deployment Mode
- 17.4.8. Ownership Model
- 17.4.9. Application
- 17.4.10. End-User
- 17.5. United Kingdom Power Distribution Automation Market
- 17.5.1. Country Segmental Analysis
- 17.5.2. Component
- 17.5.3. Product Type
- 17.5.4. Implementation/ Automation Stage
- 17.5.5. Communication Technology
- 17.5.6. Utility Type
- 17.5.7. Deployment Mode
- 17.5.8. Ownership Model
- 17.5.9. Application
- 17.5.10. End-User
- 17.6. France Power Distribution Automation Market
- 17.6.1. Country Segmental Analysis
- 17.6.2. Component
- 17.6.3. Product Type
- 17.6.4. Implementation/ Automation Stage
- 17.6.5. Communication Technology
- 17.6.6. Utility Type
- 17.6.7. Deployment Mode
- 17.6.8. Ownership Model
- 17.6.9. Application
- 17.6.10. End-User
- 17.7. Italy Power Distribution Automation Market
- 17.7.1. Country Segmental Analysis
- 17.7.2. Component
- 17.7.3. Product Type
- 17.7.4. Implementation/ Automation Stage
- 17.7.5. Communication Technology
- 17.7.6. Utility Type
- 17.7.7. Deployment Mode
- 17.7.8. Ownership Model
- 17.7.9. Application
- 17.7.10. End-User
- 17.8. Spain Power Distribution Automation Market
- 17.8.1. Country Segmental Analysis
- 17.8.2. Component
- 17.8.3. Product Type
- 17.8.4. Implementation/ Automation Stage
- 17.8.5. Communication Technology
- 17.8.6. Utility Type
- 17.8.7. Deployment Mode
- 17.8.8. Ownership Model
- 17.8.9. Application
- 17.8.10. End-User
- 17.9. Netherlands Power Distribution Automation Market
- 17.9.1. Country Segmental Analysis
- 17.9.2. Component
- 17.9.3. Product Type
- 17.9.4. Implementation/ Automation Stage
- 17.9.5. Communication Technology
- 17.9.6. Utility Type
- 17.9.7. Deployment Mode
- 17.9.8. Ownership Model
- 17.9.9. Application
- 17.9.10. End-User
- 17.10. Nordic Countries Power Distribution Automation Market
- 17.10.1. Country Segmental Analysis
- 17.10.2. Component
- 17.10.3. Product Type
- 17.10.4. Implementation/ Automation Stage
- 17.10.5. Communication Technology
- 17.10.6. Utility Type
- 17.10.7. Deployment Mode
- 17.10.8. Ownership Model
- 17.10.9. Application
- 17.10.10. End-User
- 17.11. Poland Power Distribution Automation Market
- 17.11.1. Country Segmental Analysis
- 17.11.2. Component
- 17.11.3. Product Type
- 17.11.4. Implementation/ Automation Stage
- 17.11.5. Communication Technology
- 17.11.6. Utility Type
- 17.11.7. Deployment Mode
- 17.11.8. Ownership Model
- 17.11.9. Application
- 17.11.10. End-User
- 17.12. Russia & CIS Power Distribution Automation Market
- 17.12.1. Country Segmental Analysis
- 17.12.2. Component
- 17.12.3. Product Type
- 17.12.4. Implementation/ Automation Stage
- 17.12.5. Communication Technology
- 17.12.6. Utility Type
- 17.12.7. Deployment Mode
- 17.12.8. Ownership Model
- 17.12.9. Application
- 17.12.10. End-User
- 17.13. Rest of Europe Power Distribution Automation Market
- 17.13.1. Country Segmental Analysis
- 17.13.2. Component
- 17.13.3. Product Type
- 17.13.4. Implementation/ Automation Stage
- 17.13.5. Communication Technology
- 17.13.6. Utility Type
- 17.13.7. Deployment Mode
- 17.13.8. Ownership Model
- 17.13.9. Application
- 17.13.10. End-User
- 18. Asia Pacific Power Distribution Automation Market Analysis
- 18.1. Key Segment Analysis
- 18.2. Regional Snapshot
- 18.3. Asia Pacific Power Distribution Automation Market Size (Value - US$ Bn), Analysis, and Forecasts, 2021-2035
- 18.3.1. Component
- 18.3.2. Product Type
- 18.3.3. Implementation/ Automation Stage
- 18.3.4. Communication Technology
- 18.3.5. Utility Type
- 18.3.6. Deployment Mode
- 18.3.7. Ownership Model
- 18.3.8. Application
- 18.3.9. End-User
- 18.3.10. Country
- 18.3.10.1. China
- 18.3.10.2. India
- 18.3.10.3. Japan
- 18.3.10.4. South Korea
- 18.3.10.5. Australia and New Zealand
- 18.3.10.6. Indonesia
- 18.3.10.7. Malaysia
- 18.3.10.8. Thailand
- 18.3.10.9. Vietnam
- 18.3.10.10. Rest of Asia Pacific
- 18.4. China Power Distribution Automation Market
- 18.4.1. Country Segmental Analysis
- 18.4.2. Component
- 18.4.3. Product Type
- 18.4.4. Implementation/ Automation Stage
- 18.4.5. Communication Technology
- 18.4.6. Utility Type
- 18.4.7. Deployment Mode
- 18.4.8. Ownership Model
- 18.4.9. Application
- 18.4.10. End-User
- 18.5. India Power Distribution Automation Market
- 18.5.1. Country Segmental Analysis
- 18.5.2. Component
- 18.5.3. Product Type
- 18.5.4. Implementation/ Automation Stage
- 18.5.5. Communication Technology
- 18.5.6. Utility Type
- 18.5.7. Deployment Mode
- 18.5.8. Ownership Model
- 18.5.9. Application
- 18.5.10. End-User
- 18.6. Japan Power Distribution Automation Market
- 18.6.1. Country Segmental Analysis
- 18.6.2. Component
- 18.6.3. Product Type
- 18.6.4. Implementation/ Automation Stage
- 18.6.5. Communication Technology
- 18.6.6. Utility Type
- 18.6.7. Deployment Mode
- 18.6.8. Ownership Model
- 18.6.9. Application
- 18.6.10. End-User
- 18.7. South Korea Power Distribution Automation Market
- 18.7.1. Country Segmental Analysis
- 18.7.2. Component
- 18.7.3. Product Type
- 18.7.4. Implementation/ Automation Stage
- 18.7.5. Communication Technology
- 18.7.6. Utility Type
- 18.7.7. Deployment Mode
- 18.7.8. Ownership Model
- 18.7.9. Application
- 18.7.10. End-User
- 18.8. Australia and New Zealand Power Distribution Automation Market
- 18.8.1. Country Segmental Analysis
- 18.8.2. Component
- 18.8.3. Product Type
- 18.8.4. Implementation/ Automation Stage
- 18.8.5. Communication Technology
- 18.8.6. Utility Type
- 18.8.7. Deployment Mode
- 18.8.8. Ownership Model
- 18.8.9. Application
- 18.8.10. End-User
- 18.9. Indonesia Power Distribution Automation Market
- 18.9.1. Country Segmental Analysis
- 18.9.2. Component
- 18.9.3. Product Type
- 18.9.4. Implementation/ Automation Stage
- 18.9.5. Communication Technology
- 18.9.6. Utility Type
- 18.9.7. Deployment Mode
- 18.9.8. Ownership Model
- 18.9.9. Application
- 18.9.10. End-User
- 18.10. Malaysia Power Distribution Automation Market
- 18.10.1. Country Segmental Analysis
- 18.10.2. Component
- 18.10.3. Product Type
- 18.10.4. Implementation/ Automation Stage
- 18.10.5. Communication Technology
- 18.10.6. Utility Type
- 18.10.7. Deployment Mode
- 18.10.8. Ownership Model
- 18.10.9. Application
- 18.10.10. End-User
- 18.11. Thailand Power Distribution Automation Market
- 18.11.1. Country Segmental Analysis
- 18.11.2. Component
- 18.11.3. Product Type
- 18.11.4. Implementation/ Automation Stage
- 18.11.5. Communication Technology
- 18.11.6. Utility Type
- 18.11.7. Deployment Mode
- 18.11.8. Ownership Model
- 18.11.9. Application
- 18.11.10. End-User
- 18.12. Vietnam Power Distribution Automation Market
- 18.12.1. Country Segmental Analysis
- 18.12.2. Component
- 18.12.3. Product Type
- 18.12.4. Implementation/ Automation Stage
- 18.12.5. Communication Technology
- 18.12.6. Utility Type
- 18.12.7. Deployment Mode
- 18.12.8. Ownership Model
- 18.12.9. Application
- 18.12.10. End-User
- 18.13. Rest of Asia Pacific Power Distribution Automation Market
- 18.13.1. Country Segmental Analysis
- 18.13.2. Component
- 18.13.3. Product Type
- 18.13.4. Implementation/ Automation Stage
- 18.13.5. Communication Technology
- 18.13.6. Utility Type
- 18.13.7. Deployment Mode
- 18.13.8. Ownership Model
- 18.13.9. Application
- 18.13.10. End-User
- 19. Middle East Power Distribution Automation Market Analysis
- 19.1. Key Segment Analysis
- 19.2. Regional Snapshot
- 19.3. Middle East Power Distribution Automation Market Size (Value - US$ Bn), Analysis, and Forecasts, 2021-2035
- 19.3.1. Component
- 19.3.2. Product Type
- 19.3.3. Implementation/ Automation Stage
- 19.3.4. Communication Technology
- 19.3.5. Utility Type
- 19.3.6. Deployment Mode
- 19.3.7. Ownership Model
- 19.3.8. Application
- 19.3.9. End-User
- 19.3.10. Country
- 19.3.10.1. Turkey
- 19.3.10.2. UAE
- 19.3.10.3. Saudi Arabia
- 19.3.10.4. Israel
- 19.3.10.5. Rest of Middle East
- 19.4. Turkey Power Distribution Automation Market
- 19.4.1. Country Segmental Analysis
- 19.4.2. Component
- 19.4.3. Product Type
- 19.4.4. Implementation/ Automation Stage
- 19.4.5. Communication Technology
- 19.4.6. Utility Type
- 19.4.7. Deployment Mode
- 19.4.8. Ownership Model
- 19.4.9. Application
- 19.4.10. End-User
- 19.5. UAE Power Distribution Automation Market
- 19.5.1. Country Segmental Analysis
- 19.5.2. Component
- 19.5.3. Product Type
- 19.5.4. Implementation/ Automation Stage
- 19.5.5. Communication Technology
- 19.5.6. Utility Type
- 19.5.7. Deployment Mode
- 19.5.8. Ownership Model
- 19.5.9. Application
- 19.5.10. End-User
- 19.6. Saudi Arabia Power Distribution Automation Market
- 19.6.1. Country Segmental Analysis
- 19.6.2. Component
- 19.6.3. Product Type
- 19.6.4. Implementation/ Automation Stage
- 19.6.5. Communication Technology
- 19.6.6. Utility Type
- 19.6.7. Deployment Mode
- 19.6.8. Ownership Model
- 19.6.9. Application
- 19.6.10. End-User
- 19.7. Israel Power Distribution Automation Market
- 19.7.1. Country Segmental Analysis
- 19.7.2. Component
- 19.7.3. Product Type
- 19.7.4. Implementation/ Automation Stage
- 19.7.5. Communication Technology
- 19.7.6. Utility Type
- 19.7.7. Deployment Mode
- 19.7.8. Ownership Model
- 19.7.9. Application
- 19.7.10. End-User
- 19.8. Rest of Middle East Power Distribution Automation Market
- 19.8.1. Country Segmental Analysis
- 19.8.2. Component
- 19.8.3. Product Type
- 19.8.4. Implementation/ Automation Stage
- 19.8.5. Communication Technology
- 19.8.6. Utility Type
- 19.8.7. Deployment Mode
- 19.8.8. Ownership Model
- 19.8.9. Application
- 19.8.10. End-User
- 20. Africa Power Distribution Automation Market Analysis
- 20.1. Key Segment Analysis
- 20.2. Regional Snapshot
- 20.3. Africa Power Distribution Automation Market Size (Value - US$ Bn), Analysis, and Forecasts, 2021-2035
- 20.3.1. Component
- 20.3.2. Product Type
- 20.3.3. Implementation/ Automation Stage
- 20.3.4. Communication Technology
- 20.3.5. Utility Type
- 20.3.6. Deployment Mode
- 20.3.7. Ownership Model
- 20.3.8. Application
- 20.3.9. End-User
- 20.3.10. Country
- 20.3.10.1. South Africa
- 20.3.10.2. Egypt
- 20.3.10.3. Nigeria
- 20.3.10.4. Algeria
- 20.3.10.5. Rest of Africa
- 20.4. South Africa Power Distribution Automation Market
- 20.4.1. Country Segmental Analysis
- 20.4.2. Component
- 20.4.3. Product Type
- 20.4.4. Implementation/ Automation Stage
- 20.4.5. Communication Technology
- 20.4.6. Utility Type
- 20.4.7. Deployment Mode
- 20.4.8. Ownership Model
- 20.4.9. Application
- 20.4.10. End-User
- 20.5. Egypt Power Distribution Automation Market
- 20.5.1. Country Segmental Analysis
- 20.5.2. Component
- 20.5.3. Product Type
- 20.5.4. Implementation/ Automation Stage
- 20.5.5. Communication Technology
- 20.5.6. Utility Type
- 20.5.7. Deployment Mode
- 20.5.8. Ownership Model
- 20.5.9. Application
- 20.5.10. End-User
- 20.6. Nigeria Power Distribution Automation Market
- 20.6.1. Country Segmental Analysis
- 20.6.2. Component
- 20.6.3. Product Type
- 20.6.4. Implementation/ Automation Stage
- 20.6.5. Communication Technology
- 20.6.6. Utility Type
- 20.6.7. Deployment Mode
- 20.6.8. Ownership Model
- 20.6.9. Application
- 20.6.10. End-User
- 20.7. Algeria Power Distribution Automation Market
- 20.7.1. Country Segmental Analysis
- 20.7.2. Component
- 20.7.3. Product Type
- 20.7.4. Implementation/ Automation Stage
- 20.7.5. Communication Technology
- 20.7.6. Utility Type
- 20.7.7. Deployment Mode
- 20.7.8. Ownership Model
- 20.7.9. Application
- 20.7.10. End-User
- 20.8. Rest of Africa Power Distribution Automation Market
- 20.8.1. Country Segmental Analysis
- 20.8.2. Component
- 20.8.3. Product Type
- 20.8.4. Implementation/ Automation Stage
- 20.8.5. Communication Technology
- 20.8.6. Utility Type
- 20.8.7. Deployment Mode
- 20.8.8. Ownership Model
- 20.8.9. Application
- 20.8.10. End-User
- 21. South America Power Distribution Automation Market Analysis
- 21.1. Key Segment Analysis
- 21.2. Regional Snapshot
- 21.3. South America Power Distribution Automation Market Size (Value - US$ Bn), Analysis, and Forecasts, 2021-2035
- 21.3.1. Component
- 21.3.2. Product Type
- 21.3.3. Implementation/ Automation Stage
- 21.3.4. Communication Technology
- 21.3.5. Utility Type
- 21.3.6. Deployment Mode
- 21.3.7. Ownership Model
- 21.3.8. Application
- 21.3.9. End-User
- 21.3.10. Country
- 21.3.10.1. Brazil
- 21.3.10.2. Argentina
- 21.3.10.3. Rest of South America
- 21.4. Brazil Power Distribution Automation Market
- 21.4.1. Country Segmental Analysis
- 21.4.2. Component
- 21.4.3. Product Type
- 21.4.4. Implementation/ Automation Stage
- 21.4.5. Communication Technology
- 21.4.6. Utility Type
- 21.4.7. Deployment Mode
- 21.4.8. Ownership Model
- 21.4.9. Application
- 21.4.10. End-User
- 21.5. Argentina Power Distribution Automation Market
- 21.5.1. Country Segmental Analysis
- 21.5.2. Component
- 21.5.3. Product Type
- 21.5.4. Implementation/ Automation Stage
- 21.5.5. Communication Technology
- 21.5.6. Utility Type
- 21.5.7. Deployment Mode
- 21.5.8. Ownership Model
- 21.5.9. Application
- 21.5.10. End-User
- 21.6. Rest of South America Power Distribution Automation Market
- 21.6.1. Country Segmental Analysis
- 21.6.2. Component
- 21.6.3. Product Type
- 21.6.4. Implementation/ Automation Stage
- 21.6.5. Communication Technology
- 21.6.6. Utility Type
- 21.6.7. Deployment Mode
- 21.6.8. Ownership Model
- 21.6.9. Application
- 21.6.10. End-User
- 22. Key Players/ Company Profile
- 22.1. ABB Ltd.
- 22.1.1. Company Details/ Overview
- 22.1.2. Company Financials
- 22.1.3. Key Customers and Competitors
- 22.1.4. Business/ Industry Portfolio
- 22.1.5. Product Portfolio/ Specification Details
- 22.1.6. Pricing Data
- 22.1.7. Strategic Overview
- 22.1.8. Recent Developments
- 22.2. CG Power and Industrial Solutions Limited
- 22.3. Cisco Systems, Inc.
- 22.4. Eaton Corporation plc
- 22.5. Emerson Electric Co.
- 22.6. General Electric Company
- 22.7. Hitachi, Ltd.
- 22.8. Honeywell International Inc.
- 22.9. Itron, Inc.
- 22.10. Landis+Gyr Group AG
- 22.11. Larsen & Toubro Limited
- 22.12. Mitsubishi Electric Corporation
- 22.13. NARI Technology Co., Ltd.
- 22.14. Rockwell Automation, Inc.
- 22.15. S&C Electric Company
- 22.16. Schneider Electric SE
- 22.17. Schweitzer Engineering Laboratories, Inc.
- 22.18. Siemens AG
- 22.19. Toshiba Corporation
- 22.20. Trilliant Holdings Inc.
- 22.21. Other Key Players
- 22.1. ABB Ltd.
Note* - This is just tentative list of players. While providing the report, we will cover more number of players based on their revenue and share for each geography
Research Design
Our research design integrates both demand-side and supply-side analysis through a balanced combination of primary and secondary research methodologies. By utilizing both bottom-up and top-down approaches alongside rigorous data triangulation methods, we deliver robust market intelligence that supports strategic decision-making.
MarketGenics' comprehensive research design framework ensures the delivery of accurate, reliable, and actionable market intelligence. Through the integration of multiple research approaches, rigorous validation processes, and expert analysis, we provide our clients with the insights needed to make informed strategic decisions and capitalize on market opportunities.

MarketGenics leverages a dedicated industry panel of experts and a comprehensive suite of paid databases to effectively collect, consolidate, and analyze market intelligence.
Our approach has consistently proven to be reliable and effective in generating accurate market insights, identifying key industry trends, and uncovering emerging business opportunities.
Through both primary and secondary research, we capture and analyze critical company-level data such as manufacturing footprints, including technical centers, R&D facilities, sales offices, and headquarters.
Our expert panel further enhances our ability to estimate market size for specific brands based on validated field-level intelligence.
Our data mining techniques incorporate both parametric and non-parametric methods, allowing for structured data collection, sorting, processing, and cleaning.
Demand projections are derived from large-scale data sets analyzed through proprietary algorithms, culminating in robust and reliable market sizing.
Research Approach
The bottom-up approach builds market estimates by starting with the smallest addressable market units and systematically aggregating them to create comprehensive market size projections.
This method begins with specific, granular data points and builds upward to create the complete market landscape.
Customer Analysis → Segmental Analysis → Geographical Analysis
The top-down approach starts with the broadest possible market data and systematically narrows it down through a series of filters and assumptions to arrive at specific market segments or opportunities.
This method begins with the big picture and works downward to increasingly specific market slices.
TAM → SAM → SOM


Research Methods
Desk / Secondary Research
While analysing the market, we extensively study secondary sources, directories, and databases to identify and collect information useful for this technical, market-oriented, and commercial report. Secondary sources that we utilize are not only the public sources, but it is a combination of Open Source, Associations, Paid Databases, MG Repository & Knowledgebase, and others.
- Company websites, annual reports, financial reports, broker reports, and investor presentations
- National government documents, statistical databases and reports
- News articles, press releases and web-casts specific to the companies operating in the market, Magazines, reports, and others
- We gather information from commercial data sources for deriving company specific data such as segmental revenue, share for geography, product revenue, and others
- Internal and external proprietary databases (industry-specific), relevant patent, and regulatory databases
- Governing Bodies, Government Organizations
- Relevant Authorities, Country-specific Associations for Industries
We also employ the model mapping approach to estimate the product level market data through the players' product portfolio
Primary Research
Primary research/ interviews is vital in analyzing the market. Most of the cases involves paid primary interviews. Primary sources include primary interviews through e-mail interactions, telephonic interviews, surveys as well as face-to-face interviews with the different stakeholders across the value chain including several industry experts.
| Type of Respondents | Number of Primaries |
|---|---|
| Tier 2/3 Suppliers | ~20 |
| Tier 1 Suppliers | ~25 |
| End-users | ~25 |
| Industry Expert/ Panel/ Consultant | ~30 |
| Total | ~100 |
MG Knowledgebase
• Repository of industry blog, newsletter and case studies
• Online platform covering detailed market reports, and company profiles
Forecasting Factors and Models
Forecasting Factors
- Historical Trends – Past market patterns, cycles, and major events that shaped how markets behave over time. Understanding past trends helps predict future behavior.
- Industry Factors – Specific characteristics of the industry like structure, regulations, and innovation cycles that affect market dynamics.
- Macroeconomic Factors – Economic conditions like GDP growth, inflation, and employment rates that affect how much money people have to spend.
- Demographic Factors – Population characteristics like age, income, and location that determine who can buy your product.
- Technology Factors – How quickly people adopt new technology and how much technology infrastructure exists.
- Regulatory Factors – Government rules, laws, and policies that can help or restrict market growth.
- Competitive Factors – Analyzing competition structure such as degree of competition and bargaining power of buyers and suppliers.
Forecasting Models / Techniques
Multiple Regression Analysis
- Identify and quantify factors that drive market changes
- Statistical modeling to establish relationships between market drivers and outcomes
Time Series Analysis – Seasonal Patterns
- Understand regular cyclical patterns in market demand
- Advanced statistical techniques to separate trend, seasonal, and irregular components
Time Series Analysis – Trend Analysis
- Identify underlying market growth patterns and momentum
- Statistical analysis of historical data to project future trends
Expert Opinion – Expert Interviews
- Gather deep industry insights and contextual understanding
- In-depth interviews with key industry stakeholders
Multi-Scenario Development
- Prepare for uncertainty by modeling different possible futures
- Creating optimistic, pessimistic, and most likely scenarios
Time Series Analysis – Moving Averages
- Sophisticated forecasting for complex time series data
- Auto-regressive integrated moving average models with seasonal components
Econometric Models
- Apply economic theory to market forecasting
- Sophisticated economic models that account for market interactions
Expert Opinion – Delphi Method
- Harness collective wisdom of industry experts
- Structured, multi-round expert consultation process
Monte Carlo Simulation
- Quantify uncertainty and probability distributions
- Thousands of simulations with varying input parameters
Research Analysis
Our research framework is built upon the fundamental principle of validating market intelligence from both demand and supply perspectives. This dual-sided approach ensures comprehensive market understanding and reduces the risk of single-source bias.
Demand-Side Analysis: We understand end-user/application behavior, preferences, and market needs along with the penetration of the product for specific application.
Supply-Side Analysis: We estimate overall market revenue, analyze the segmental share along with industry capacity, competitive landscape, and market structure.
Validation & Evaluation
Data triangulation is a validation technique that uses multiple methods, sources, or perspectives to examine the same research question, thereby increasing the credibility and reliability of research findings. In market research, triangulation serves as a quality assurance mechanism that helps identify and minimize bias, validate assumptions, and ensure accuracy in market estimates.
- Data Source Triangulation – Using multiple data sources to examine the same phenomenon
- Methodological Triangulation – Using multiple research methods to study the same research question
- Investigator Triangulation – Using multiple researchers or analysts to examine the same data
- Theoretical Triangulation – Using multiple theoretical perspectives to interpret the same data

Custom Market Research Services
We will customise the research for you, in case the report listed above does not meet your requirements.
Get 10% Free Customisation