Power Electronics Market Size, Share & Trends Analysis Report by Product Type (Power Management ICs, Passive Components, Power Management ICs, Passive Components), Voltage Range, Power Rating, Technology, Form Factor, End-Use Industry, and Geography (North America, Europe, Asia Pacific, Middle East, Africa, and South America) – Global Industry Data, Trends, and Forecasts, 2026–2035
|
|
|
Segmental Data Insights |
|
|
Demand Trends |
|
|
Competitive Landscape |
|
|
Strategic Development |
|
|
Future Outlook & Opportunities |
|
Power Electronics Market Size, Share, and Growth
The global power electronics market is witnessing strong growth, valued at USD 37.8 billion in 2025 and projected to reach USD 67.1 billion by 2035, expanding at a CAGR of 5.9% during the forecast period. North America is the fastest-growing region for the Power Electronics market due to strong investments in electric vehicles, renewable energy projects, and advanced industrial automation technologies.
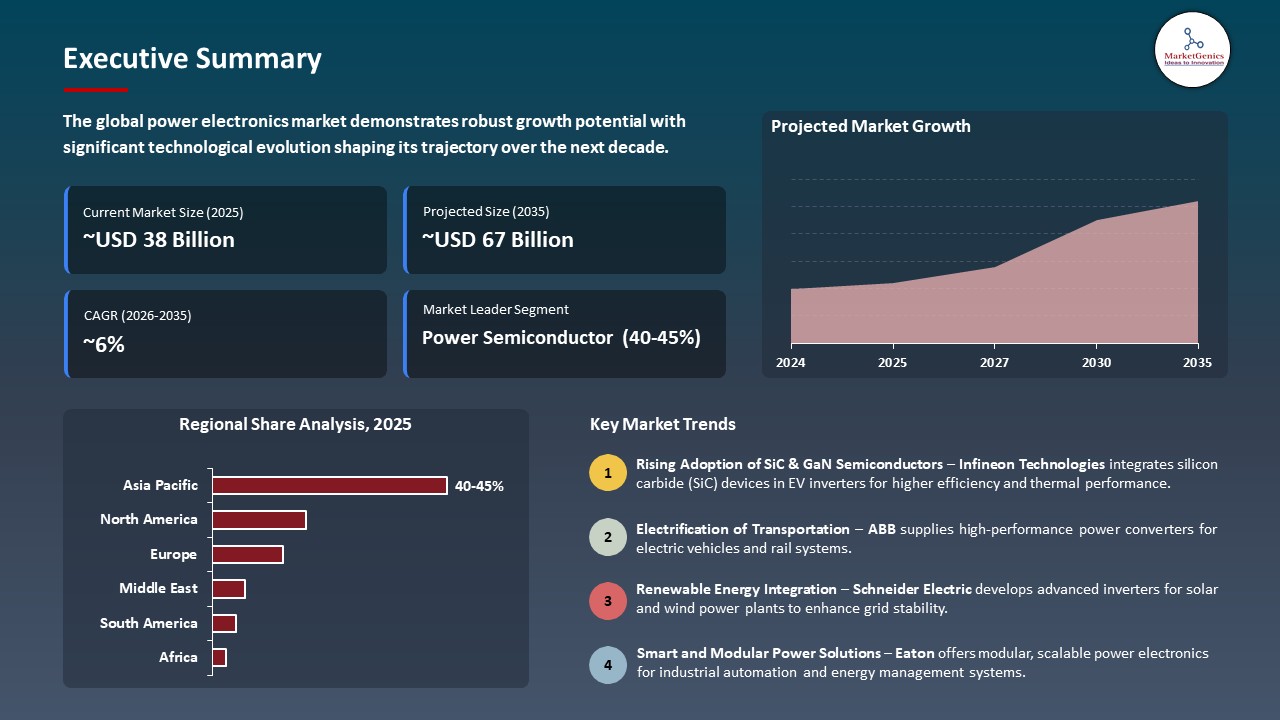
Dominik Bilo, Executive Vice President and Chief Sales Officer Industrial & Infrastructure at Infineon Technologies, said, “Electreon's wireless charging system is a real game changer on the road to reducing carbon emissions in transportation, We're proud to contribute to this groundbreaking innovation with our customized SiC power modules, which efficiently convert electrical energy to charge vehicles on the go, tailored to meet Electreon's specific needs. The solution fits perfectly with our goal to contribute to a climate-neutral future, further driving decarbonization and digitalization.”
Power electronics market is growing at a high rate as more and more industries, transport systems, and renewable energy are becoming electrified, and efficiency in power conversion and energy management is paramount to performance and energy conservation. The increasing use of electric vehicles and high-speed chargers is increasing the need to have high-efficiency inverters, converters, and semiconductor devices, and renewable energy systems are also in need of complex power-controlling systems to keep the grid stable.
Infineon Technologies increased its silicon carbide power semiconductor to enable EV and solar inverter applications in 2025 to reinforce the power device supply in high-efficiency devices. The same year onsemi launched next-generation EliteSiC power modules to be used in EV tractors and industrial power systems, which is more efficient and thermal conductive. These trends indicate the investment by the manufacturers in wide-bandgap technologies to address the increasing performance needs in various industries.
Adjacent opportunities for the power electronics market include electric vehicle charging infrastructure, renewable energy inverters, energy storage systems, industrial automation drives, and data center power management, as these applications require efficient power conversion, control, and thermal management technologies to improve performance, reliability, and energy efficiency across modern electrical systems.
 Power Electronics Market Dynamics and Trends
Driver: Increasing Electrification Across Automotive, Renewable, And Industrial Systems Driving Power Electronics Demand
-
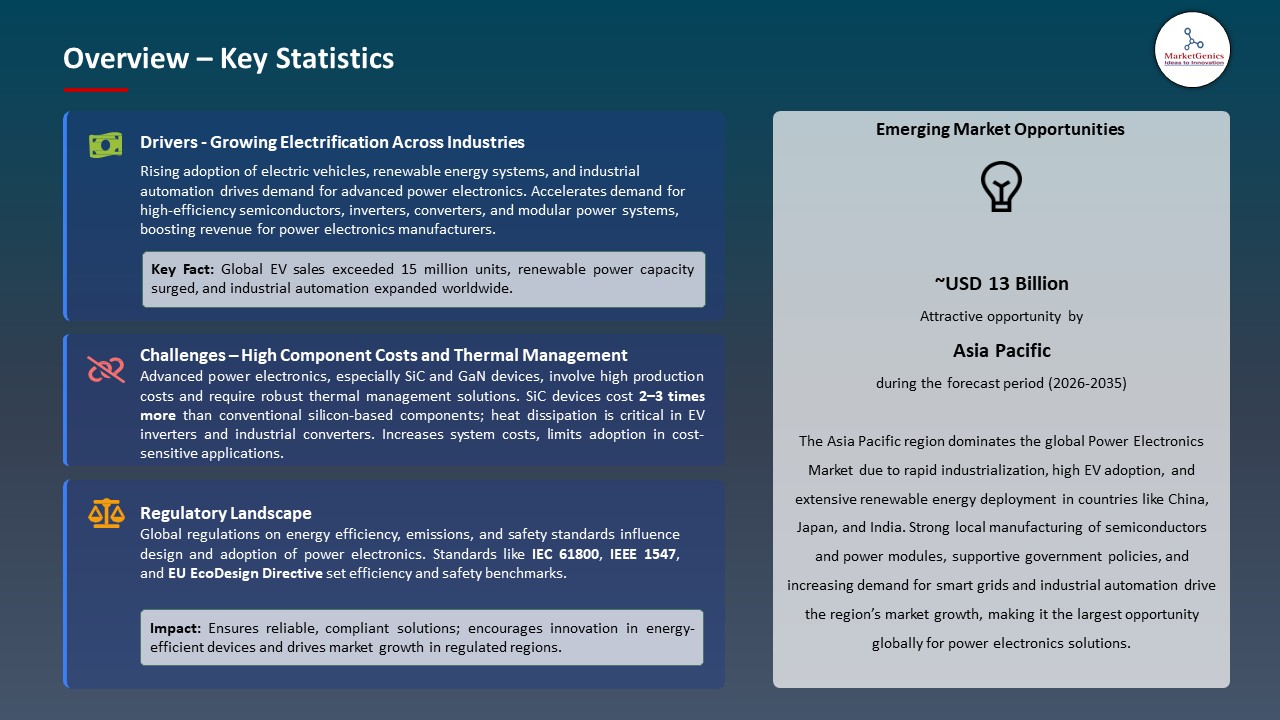
The high pace of electrification of electric vehicles, renewable energy systems, and industrial automation is causing a rise in the demand of efficient power conversion, control, and energy management systems. Power electronics provide a means of precise voltage regulation, fast switching, and greater energy efficiency, which are required in the current electrical infrastructure.
- The recent move toward increased use of EV drivetrains, solar inverters, wind power converters and smart industrial equipment, among others is increasing the use of advanced semiconductors like silicon carbide and gallium nitride to serve high power loads at higher performance and reliability.
- In May 2025, Infineon Technologies released CoolSiC JFET silicon-carbide components, which made faster, high-efficiency solid-state power distribution with lower losses and increased reliability in automotive, industrial, and AI data centres.
- The increased electrification of various industries is further enhancing the use of high-efficiency power devices, which offers the global power electronics market a consistent increase.
Restraint: High Development Cost and Complex Manufacturing Limiting Power Electronics Market Expansion
-
Production of power electronics involves high level of semiconductor fabrication, high precision packaging and special materials like silicon carbide and gallium nitride which makes the production very capital intensive. Setting up of fabrication plants, quality control and high levels of reliability make it much more expensive to the manufacturers in terms of development and operational costs.
- Further, financial strain is put by the fact that in order to live up to efficiency and performance demands, constant research and technological advancements are necessary. In smaller companies there is sometimes a problem of scale of production and long qualification times in automotive, industrial and energy use may slow commercialization and raise risk.
- High capital needs and technicality make new entrants slow and restrict quick growth, which leads to high reliance on existing international manufacturers.
Opportunity: Expansion of Data Centers, EV Charging, And Energy Storage Creating New Opportunities
-
Increasing populations of data centers, electric vehicle charging applications, and energy storage systems with high power demand are placing significant demand on high voltage, high-speed, and low-energy conversion power electronics. The converters, inverters, and power modules used in these applications need to be reliable so that they can sustain performance and minimize energy loss as well as being able to operate continuously.
- The growing use of high-power digital infrastructure and electrified transport is driving manufacturers to create miniature, high-performance and thermally resolute power-hungry devices.
- In 2025, onsemi introduced EliteSiC intelligent power modules, aimed at industrial drives, EV systems, and power converters, with better efficiency and power density than traditional IGBT-based designs.
- The global power electronics market is experiencing an increased use case and accelerated innovation with emerging high-power applications.
Key Trend: Wide-Bandgap Semiconductor Technologies Transforming Efficiency, Density, And Performance of Power Devices
-
The use of wide-bandgap semiconductor materials, including silicon carbide (SiC) and gallium nitride (GaN), is emerging as a significant trend in power electronics since these materials can achieve higher switching speeds, reduced energy loss, and better thermal characteristics than traditional silicon devices. This enables smaller, light, and efficient power systems to be developed.
- The growing application of the technologies in electric vehicles, inverters of renewable energy, in industrial drive data centers, and inverters in industry is pushing manufacturers to make the transition to high-performance semiconductor platforms.
- STMicroelectronics announced Gen-4 silicon carbide MOSFET technology in EV traction inverters, developing a better efficiency and power density and thermal performance, by automotive, energy storage and industrial systems.
- The next stage of innovation in power electronics is being driven by the widespread adoption of wide-bandgap that is enhancing efficiency and power density.
 Power Electronics Market Analysis and Segmental Data
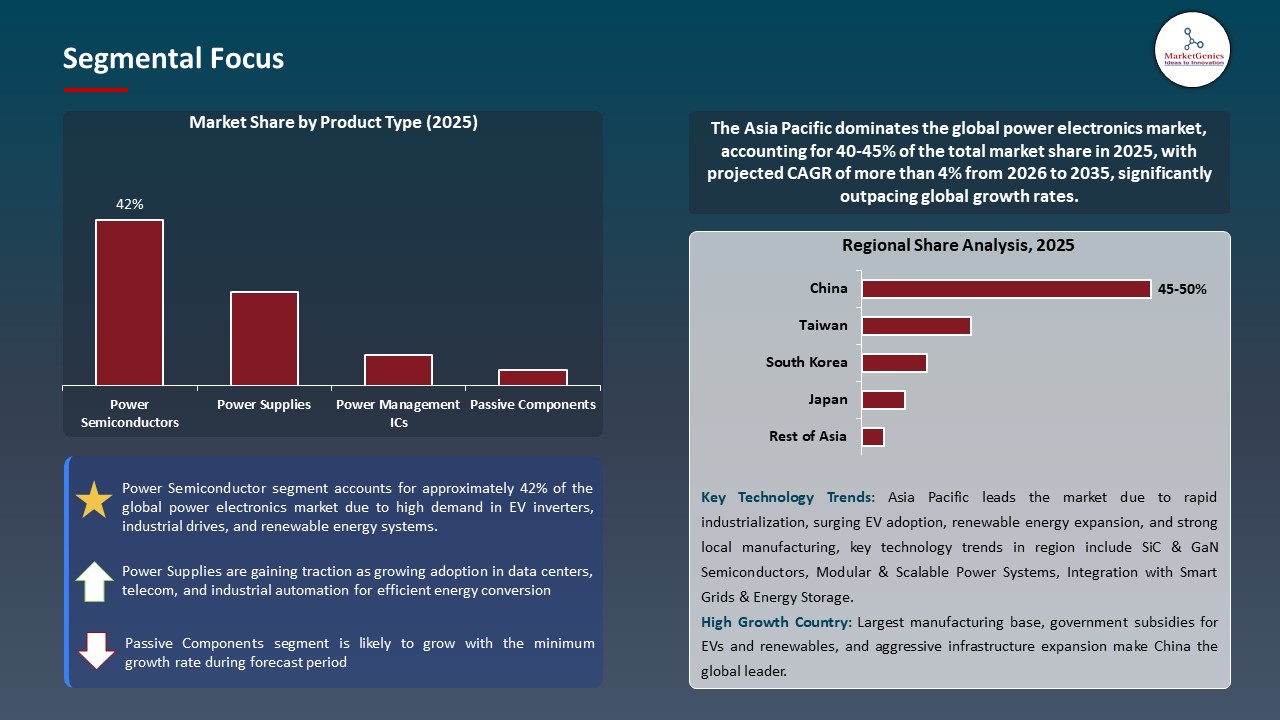
Power Semiconductor Dominate Global Power Electronics Market
-
Power semiconductors hold the largest share in the power electronics market as they form the core of power conversion, switching, and control across automotive, renewable energy, industrial automation, consumer electronics, and data center infrastructure. Devices that use IGBTs, MOSFETs, silicon carbide (SiC), gallium nitride (GaN), and similar materials have been used in the modern electrical systems to achieve efficient energy management, reduced losses, and high performance of the electrical system.
- The high development of electric cars and solar and wind systems, EV charging systems, and high-efficiency power systems is driving the demand of high-efficiency semiconductor devices to a faster pace. The movement toward wide-bandgap technologies is also boosting the efficiency of the systems, power density, and thermal reliability, which is improving the dominance of the segment in the market place.
- The power semiconductors have been dominated to guarantee the perpetual technological progress, which has resulted in efficiency gains and the growth of the power electronics market in the long run.
Asia Pacific Leads Global Power Electronics Market Demand
-
Asia Pacific dominates the power electronics market because there is a high level of manufacturing, high industrialization and the high volume of acceptance of electric cars, renewable energy and consumer electronics. Power devices are in sustained demand in a variety of applications due to countries like China, Japan, South Korea, and India which are manufacturing hubs of major semiconductor, automotive, and electronics. Semiconductor production and electrification programs supported by the government are also an additional strength of regional growth.
- Big Solar, wind, EV charging, rail electrification, and data center investments are driving the emergence of the efficient power conversion systems. The use of silicon carbide and gallium nitride technologies, expansion of domestic supply chains, and further adoption is strengthening the leadership of the region.
- Asia Pacific continues to lead the highest proportion of worldwide power electronics demand because of its high manufacturing ecosystem and investment in electrification.
Power Electronics Market Ecosystem
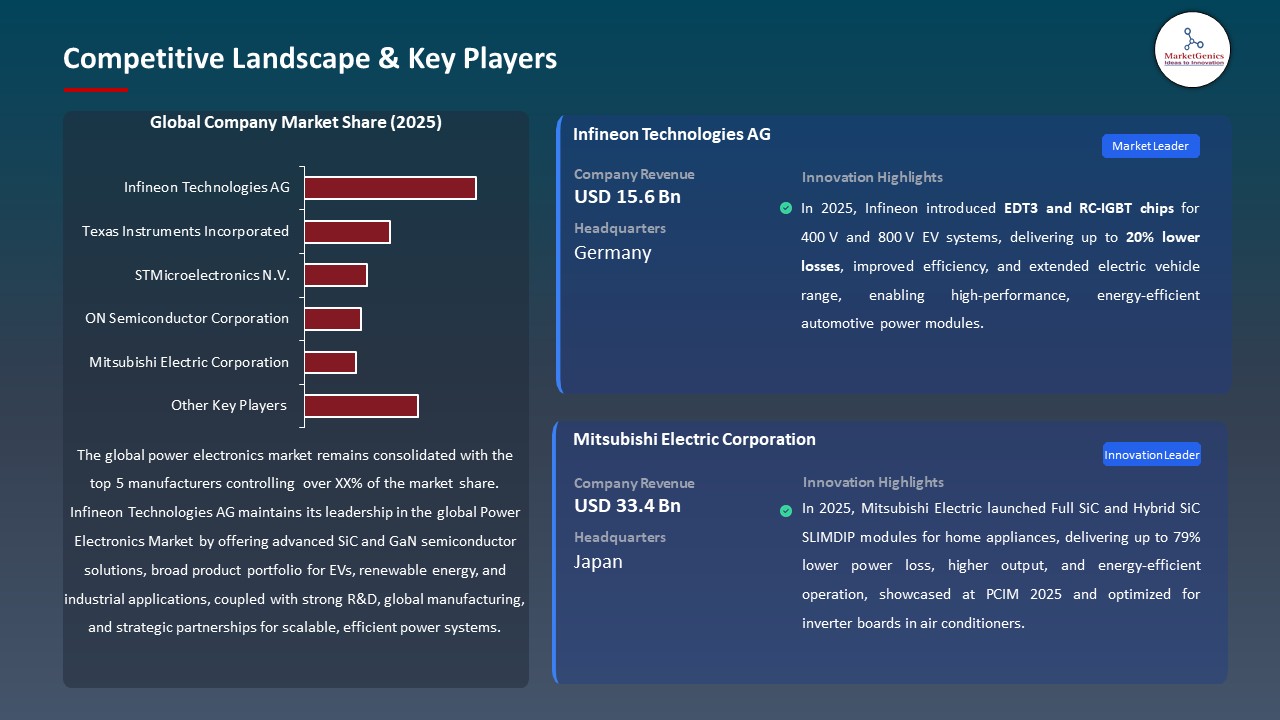
The global power electronics market is consolidated, with leading players including Infineon Technologies AG, Texas Instruments Incorporated, STMicroelectronics N.V., ON Semiconductor Corporation, and Mitsubishi Electric Corporation. The firms capitalize on more powerful power semiconductor technologies, wide-bandgap, and highly integrated device structures backed by effective international manufacturing and distribution networks. Their position in the market is supported by the strategic alliances with automotive and renewable energy and industrial automation and consumer electronics manufacturers and continued R&D of high-efficiency, high-voltage and high-frequency power device applications in the next-generation.
Value chain includes sourcing of raw materials (silicon wafers, silicon carbide, semiconductor substrates, semiconductor fabrics, semiconductor devices, semiconductor package, semiconductor module, power systems, semiconductor software, semiconductor control systems, deployment, after sales services including testing, monitoring and maintenance. The individual stages are aimed at efficiency, thermal performance, miniaturization, as well as long-term reliability in automotive, industrial, telecom, renewable, and data-centres use.
The barriers to entry are high because of the complexities in fabrication of semiconductor, capital-intensive manufacturing plants, high quality demands, and close relationships between the OEMs and the suppliers. Sustained growth of the power electronics market worldwide will be facilitated by the continuous innovation in SiC, GaN and intelligent power modules that provide the differentiation of products, scalability and sustainable growth of the products.
 Recent Development and Strategic Overview:
- In April 2025, Mitsubishi Electric Corporation began shipping Full-SiC and Hybrid-SiC SLIMDIP power semiconductor modules for home appliances, delivering up to 79% lower power loss and higher output compared to silicon-based modules, strengthening adoption of silicon-carbide technology in high-efficiency power electronics applications.
- In October 2025, Texas Instruments Incorporated introduced advanced power-management chips and GaN-based solutions for AI data centers, supporting scalable 800V power architectures and high-density server power supplies, highlighting the growing role of high-efficiency power electronics in next-generation computing infrastructure.
Report Scope
|
Detail |
|
|
Market Size in 2025 |
USD 37.8 Bn |
|
Market Forecast Value in 2035 |
USD 67.1 Bn |
|
Growth Rate (CAGR) |
5.9% |
|
Forecast Period |
2026 – 2035 |
|
Historical Data Available for |
2021 – 2024 |
|
Market Size Units |
US$ Billion for Value Million Units for Volume |
|
Report Format |
Electronic (PDF) + Excel |
|
North America |
Europe |
Asia Pacific |
Middle East |
Africa |
South America |
|
|
|
|
|
|
|
Companies Covered |
|||||
|
|
Mitsubishi Electric Corporation |
|
|
|
Power Electronics Market Segmentation and Highlights
|
Segment |
Sub-segment |
|
Power Electronics Market, By Product Type |
|
|
Power Electronics Market, By Voltage Range |
|
|
Power Electronics Market, By Power Rating |
|
|
Power Electronics Market, By Technology |
|
|
Power Electronics Market, By Form Factor |
|
|
Power Electronics Market, By End-use Industry |
|
Frequently Asked Questions
Table of Contents
- 1. Research Methodology and Assumptions
- 1.1. Definitions
- 1.2. Research Design and Approach
- 1.3. Data Collection Methods
- 1.4. Base Estimates and Calculations
- 1.5. Forecasting Models
- 1.5.1. Key Forecast Factors & Impact Analysis
- 1.6. Secondary Research
- 1.6.1. Open Sources
- 1.6.2. Paid Databases
- 1.6.3. Associations
- 1.7. Primary Research
- 1.7.1. Primary Sources
- 1.7.2. Primary Interviews with Stakeholders across Ecosystem
- 2. Executive Summary
- 2.1. Global Power Electronics Market Outlook
- 2.1.1. Power Electronics Market Size (Volume (Million Units) and Value (US$ Bn)), and Forecasts, 2021-2035
- 2.1.2. Compounded Annual Growth Rate Analysis
- 2.1.3. Growth Opportunity Analysis
- 2.1.4. Segmental Share Analysis
- 2.1.5. Geographical Share Analysis
- 2.2. Market Analysis and Facts
- 2.3. Supply-Demand Analysis
- 2.4. Competitive Benchmarking
- 2.5. Go-to- Market Strategy
- 2.5.1. Customer/ End-use Industry Assessment
- 2.5.2. Growth Opportunity Data, 2026-2035
- 2.5.2.1. Regional Data
- 2.5.2.2. Country Data
- 2.5.2.3. Segmental Data
- 2.5.3. Identification of Potential Market Spaces
- 2.5.4. GAP Analysis
- 2.5.5. Potential Attractive Price Points
- 2.5.6. Prevailing Market Risks & Challenges
- 2.5.7. Preferred Sales & Marketing Strategies
- 2.5.8. Key Recommendations and Analysis
- 2.5.9. A Way Forward
- 2.1. Global Power Electronics Market Outlook
- 3. Industry Data and Premium Insights
- 3.1. Global Energy & Power Industry Overview, 2025
- 3.1.1. Energy & Power Industry Ecosystem Analysis
- 3.1.2. Key Trends for Energy & Power Industry
- 3.1.3. Regional Distribution for Energy & Power Industry
- 3.2. Supplier Customer Data
- 3.3. Technology Roadmap and Developments
- 3.4. Trade Analysis
- 3.4.1. Import & Export Analysis, 2025
- 3.4.2. Top Importing Countries
- 3.4.3. Top Exporting Countries
- 3.5. Trump Tariff Impact Analysis
- 3.5.1. Manufacturer
- 3.5.1.1. Based on the component & Raw material
- 3.5.2. Supply Chain
- 3.5.3. End Consumer
- 3.5.1. Manufacturer
- 3.6. Raw Material Analysis
- 3.1. Global Energy & Power Industry Overview, 2025
- 4. Market Overview
- 4.1. Market Dynamics
- 4.1.1. Drivers
- 4.1.1.1. Growing adoption of renewable energy and energy storage systems
- 4.1.1.2. Rising demand for electric vehicles and charging infrastructure
- 4.1.1.3. Expansion of industrial automation and power-efficient electronics
- 4.1.2. Restraints
- 4.1.2.1. High cost of advanced semiconductor materials (SiC, GaN)
- 4.1.2.2. Complex design and thermal management requirements
- 4.1.1. Drivers
- 4.2. Key Trend Analysis
- 4.3. Regulatory Framework
- 4.3.1. Key Regulations, Norms, and Subsidies, by Key Countries
- 4.3.2. Tariffs and Standards
- 4.3.3. Impact Analysis of Regulations on the Market
- 4.4. Value Chain Analysis
- 4.4.1. Raw Material Suppliers
- 4.4.2. Semiconductor & Component Manufacturers
- 4.4.3. System Integrators & OEMs
- 4.4.4. Distributors & Suppliers
- 4.4.5. End-Use Industries
- 4.5. Porter’s Five Forces Analysis
- 4.6. PESTEL Analysis
- 4.7. Global Power Electronics Market Demand
- 4.7.1. Historical Market Size – (Volume (Million Units) and Value (US$ Bn)), 2020-2024
- 4.7.2. Current and Future Market Size – (Volume (Million Units) and Value (US$ Bn)), 2026–2035
- 4.7.2.1. Y-o-Y Growth Trends
- 4.7.2.2. Absolute $ Opportunity Assessment
- 4.1. Market Dynamics
- 5. Competition Landscape
- 5.1. Competition structure
- 5.1.1. Fragmented v/s consolidated
- 5.2. Company Share Analysis, 2025
- 5.2.1. Global Company Market Share
- 5.2.2. By Region
- 5.2.2.1. North America
- 5.2.2.2. Europe
- 5.2.2.3. Asia Pacific
- 5.2.2.4. Middle East
- 5.2.2.5. Africa
- 5.2.2.6. South America
- 5.3. Product Comparison Matrix
- 5.3.1. Specifications
- 5.3.2. Market Positioning
- 5.3.3. Pricing
- 5.1. Competition structure
- 6. Global Power Electronics Market Analysis, by Product Type
- 6.1. Key Segment Analysis
- 6.2. Power Electronics Market Size (Volume (Million Units) and Value (US$ Bn)), Analysis, and Forecasts, by Product Type, 2021-2035
- 6.2.1. Power Semiconductors
- 6.2.1.1. MOSFETs
- 6.2.1.2. IGBTs
- 6.2.1.3. Thyristors
- 6.2.1.4. Diodes
- 6.2.1.5. Power Modules
- 6.2.1.6. Others
- 6.2.2. Power Supplies
- 6.2.2.1. AC-DC Power Supplies
- 6.2.2.2. DC-DC Converters
- 6.2.2.3. UPS Systems
- 6.2.2.4. Others
- 6.2.3. Power Management ICs
- 6.2.4. Passive Components
- 6.2.4.1. Inductors
- 6.2.4.2. Capacitors
- 6.2.4.3. Resistors
- 6.2.4.4. Others
- 6.2.1. Power Semiconductors
- 7. Global Power Electronics Market Analysis, by Voltage Range
- 7.1. Key Segment Analysis
- 7.2. Power Electronics Market Size (Volume (Million Units) and Value (US$ Bn)), Analysis, and Forecasts, by Voltage Range, 2021-2035
- 7.2.1. Up to 50V
- 7.2.2. 50V-600V
- 7.2.3. 600V-1000V
- 7.2.4. Above 1000V
- 8. Global Power Electronics Market Analysis, Power Rating
- 8.1. Key Segment Analysis
- 8.2. Power Electronics Market Size (Volume (Million Units) and Value (US$ Bn)), Analysis, and Forecasts, by y Power Rating, 2021-2035
- 8.2.1. Up to 100W
- 8.2.2. 100W - 500W
- 8.2.3. 500W - 1500W
- 8.2.4. Above 1500W
- 9. Global Power Electronics Market Analysis, by Technology
- 9.1. Key Segment Analysis
- 9.2. Power Electronics Market Size (Volume (Million Units) and Value (US$ Bn)), Analysis, and Forecasts, by Storage Duration, 2021-2035
- 9.2.1. Silicon-based
- 9.2.1.1. MOSFET Technology
- 9.2.1.2. IGBT Technology
- 9.2.1.3. Thyristor Technology
- 9.2.1.4. Others
- 9.2.2. Wide Bandgap Semiconductors
- 9.2.2.1. GaN (Gallium Nitride)
- 9.2.2.2. SiC (Silicon Carbide)
- 9.2.2.3. Diamond-based
- 9.2.2.4. Others
- 9.2.3. Emerging Technologies
- 9.2.3.1. GaAs (Gallium Arsenide)
- 9.2.3.2. AlN (Aluminum Nitride)
- 9.2.3.3. Others
- 9.2.1. Silicon-based
- 10. Global Power Electronics Market Analysis, by Form Factor
- 10.1. Key Segment Analysis
- 10.2. Power Electronics Market Size (Volume (Million Units) and Value (US$ Bn)), Analysis, and Forecasts, by Form Factor, 2021-2035
- 10.2.1. Through-Hole Components
- 10.2.2. Surface Mount Devices (SMD)
- 10.2.3. Integrated Modules
- 10.2.4. Discrete Packages
- 10.2.5. Hybrid Packages
- 11. Global Power Electronics Market Analysis, by End-use Industry
- 11.1. Key Segment Analysis
- 11.2. Power Electronics Market Size (Volume (Million Units) and Value (US$ Bn)), Analysis, and Forecasts, by End-use Industry, 2021-2035
- 11.2.1. Automotive & Transportation
- 11.2.2. Industrial Manufacturing
- 11.2.3. Consumer Electronics
- 11.2.4. Telecommunications & Data Centers
- 11.2.5. Renewable Energy & Power Generation
- 11.2.6. Aerospace & Defense
- 11.2.7. Healthcare & Medical Devices
- 11.2.8. Smart Grid & Utility Infrastructure
- 11.2.9. Other Industries
- 12. Global Power Electronics Market Analysis and Forecasts, by Region
- 12.1. Key Findings
- 12.2. Power Electronics Market Size (Volume (Million Units) and Value (US$ Bn)), Analysis, and Forecasts, by Region, 2021-2035
- 12.2.1. North America
- 12.2.2. Europe
- 12.2.3. Asia Pacific
- 12.2.4. Middle East
- 12.2.5. Africa
- 12.2.6. South America
- 13. North America Power Electronics Market Analysis
- 13.1. Key Segment Analysis
- 13.2. Regional Snapshot
- 13.3. North America Power Electronics Market Size (Volume (Million Units) and Value (US$ Bn)), Analysis, and Forecasts, 2021-2035
- 13.3.1. Product Type
- 13.3.2. Voltage Range
- 13.3.3. Power Rating
- 13.3.4. Technology
- 13.3.5. Form Factor
- 13.3.6. End-use Industry
- 13.3.7. Country
- 13.3.7.1. USA
- 13.3.7.2. Canada
- 13.3.7.3. Mexico
- 13.4. USA Power Electronics Market
- 13.4.1. Country Segmental Analysis
- 13.4.2. Product Type
- 13.4.3. Voltage Range
- 13.4.4. Power Rating
- 13.4.5. Technology
- 13.4.6. Form Factor
- 13.4.7. End-use Industry
- 13.5. Canada Power Electronics Market
- 13.5.1. Country Segmental Analysis
- 13.5.2. Product Type
- 13.5.3. Voltage Range
- 13.5.4. Power Rating
- 13.5.5. Technology
- 13.5.6. Form Factor
- 13.5.7. End-use Industry
- 13.6. Mexico Power Electronics Market
- 13.6.1. Country Segmental Analysis
- 13.6.2. Product Type
- 13.6.3. Voltage Range
- 13.6.4. Power Rating
- 13.6.5. Technology
- 13.6.6. Form Factor
- 13.6.7. End-use Industry
- 14. Europe Power Electronics Market Analysis
- 14.1. Key Segment Analysis
- 14.2. Regional Snapshot
- 14.3. Europe Power Electronics Market Size (Volume (Million Units) and Value (US$ Bn)), Analysis, and Forecasts, 2021-2035
- 14.3.1. Product Type
- 14.3.2. Voltage Range
- 14.3.3. Power Rating
- 14.3.4. Technology
- 14.3.5. Form Factor
- 14.3.6. End-use Industry
- 14.3.7. Country
- 14.3.7.1. Germany
- 14.3.7.2. United Kingdom
- 14.3.7.3. France
- 14.3.7.4. Italy
- 14.3.7.5. Spain
- 14.3.7.6. Netherlands
- 14.3.7.7. Nordic Countries
- 14.3.7.8. Poland
- 14.3.7.9. Russia & CIS
- 14.3.7.10. Rest of Europe
- 14.4. Germany Power Electronics Market
- 14.4.1. Country Segmental Analysis
- 14.4.2. Product Type
- 14.4.3. Voltage Range
- 14.4.4. Power Rating
- 14.4.5. Technology
- 14.4.6. Form Factor
- 14.4.7. End-use Industry
- 14.5. United Kingdom Power Electronics Market
- 14.5.1. Country Segmental Analysis
- 14.5.2. Product Type
- 14.5.3. Voltage Range
- 14.5.4. Power Rating
- 14.5.5. Technology
- 14.5.6. Form Factor
- 14.5.7. End-use Industry
- 14.6. France Power Electronics Market
- 14.6.1. Country Segmental Analysis
- 14.6.2. Product Type
- 14.6.3. Voltage Range
- 14.6.4. Power Rating
- 14.6.5. Technology
- 14.6.6. Form Factor
- 14.6.7. End-use Industry
- 14.7. Italy Power Electronics Market
- 14.7.1. Country Segmental Analysis
- 14.7.2. Product Type
- 14.7.3. Voltage Range
- 14.7.4. Power Rating
- 14.7.5. Technology
- 14.7.6. Form Factor
- 14.7.7. End-use Industry
- 14.8. Spain Power Electronics Market
- 14.8.1. Country Segmental Analysis
- 14.8.2. Product Type
- 14.8.3. Voltage Range
- 14.8.4. Power Rating
- 14.8.5. Technology
- 14.8.6. Form Factor
- 14.8.7. End-use Industry
- 14.9. Netherlands Power Electronics Market
- 14.9.1. Country Segmental Analysis
- 14.9.2. Product Type
- 14.9.3. Voltage Range
- 14.9.4. Power Rating
- 14.9.5. Technology
- 14.9.6. Form Factor
- 14.9.7. End-use Industry
- 14.10. Nordic Countries Power Electronics Market
- 14.10.1. Country Segmental Analysis
- 14.10.2. Product Type
- 14.10.3. Voltage Range
- 14.10.4. Power Rating
- 14.10.5. Technology
- 14.10.6. Form Factor
- 14.10.7. End-use Industry
- 14.11. Poland Power Electronics Market
- 14.11.1. Country Segmental Analysis
- 14.11.2. Product Type
- 14.11.3. Voltage Range
- 14.11.4. Power Rating
- 14.11.5. Technology
- 14.11.6. Form Factor
- 14.11.7. End-use Industry
- 14.12. Russia & CIS Power Electronics Market
- 14.12.1. Country Segmental Analysis
- 14.12.2. Product Type
- 14.12.3. Voltage Range
- 14.12.4. Power Rating
- 14.12.5. Technology
- 14.12.6. Form Factor
- 14.12.7. End-use Industry
- 14.13. Rest of Europe Power Electronics Market
- 14.13.1. Country Segmental Analysis
- 14.13.2. Product Type
- 14.13.3. Voltage Range
- 14.13.4. Power Rating
- 14.13.5. Technology
- 14.13.6. Form Factor
- 14.13.7. End-use Industry
- 15. Asia Pacific Power Electronics Market Analysis
- 15.1. Key Segment Analysis
- 15.2. Regional Snapshot
- 15.3. Asia Pacific Power Electronics Market Size (Volume (Million Units) and Value (US$ Bn)), Analysis, and Forecasts, 2021-2035
- 15.3.1. Product Type
- 15.3.2. Voltage Range
- 15.3.3. Power Rating
- 15.3.4. Technology
- 15.3.5. Form Factor
- 15.3.6. End-use Industry
- 15.3.7. Country
- 15.3.7.1. China
- 15.3.7.2. India
- 15.3.7.3. Japan
- 15.3.7.4. South Korea
- 15.3.7.5. Australia and New Zealand
- 15.3.7.6. Indonesia
- 15.3.7.7. Malaysia
- 15.3.7.8. Thailand
- 15.3.7.9. Vietnam
- 15.3.7.10. Rest of Asia Pacific
- 15.4. China Power Electronics Market
- 15.4.1. Country Segmental Analysis
- 15.4.2. Product Type
- 15.4.3. Voltage Range
- 15.4.4. Power Rating
- 15.4.5. Technology
- 15.4.6. Form Factor
- 15.4.7. End-use Industry
- 15.5. India Power Electronics Market
- 15.5.1. Country Segmental Analysis
- 15.5.2. Product Type
- 15.5.3. Voltage Range
- 15.5.4. Power Rating
- 15.5.5. Technology
- 15.5.6. Form Factor
- 15.5.7. End-use Industry
- 15.6. Japan Power Electronics Market
- 15.6.1. Country Segmental Analysis
- 15.6.2. Product Type
- 15.6.3. Voltage Range
- 15.6.4. Power Rating
- 15.6.5. Technology
- 15.6.6. Form Factor
- 15.6.7. End-use Industry
- 15.7. South Korea Power Electronics Market
- 15.7.1. Country Segmental Analysis
- 15.7.2. Product Type
- 15.7.3. Voltage Range
- 15.7.4. Power Rating
- 15.7.5. Technology
- 15.7.6. Form Factor
- 15.7.7. End-use Industry
- 15.8. Australia and New Zealand Power Electronics Market
- 15.8.1. Country Segmental Analysis
- 15.8.2. Product Type
- 15.8.3. Voltage Range
- 15.8.4. Power Rating
- 15.8.5. Technology
- 15.8.6. Form Factor
- 15.8.7. End-use Industry
- 15.9. Indonesia Power Electronics Market
- 15.9.1. Country Segmental Analysis
- 15.9.2. Product Type
- 15.9.3. Voltage Range
- 15.9.4. Power Rating
- 15.9.5. Technology
- 15.9.6. Form Factor
- 15.9.7. End-use Industry
- 15.10. Malaysia Power Electronics Market
- 15.10.1. Country Segmental Analysis
- 15.10.2. Product Type
- 15.10.3. Voltage Range
- 15.10.4. Power Rating
- 15.10.5. Technology
- 15.10.6. Form Factor
- 15.10.7. End-use Industry
- 15.11. Thailand Power Electronics Market
- 15.11.1. Country Segmental Analysis
- 15.11.2. Product Type
- 15.11.3. Voltage Range
- 15.11.4. Power Rating
- 15.11.5. Technology
- 15.11.6. Form Factor
- 15.11.7. End-use Industry
- 15.12. Vietnam Power Electronics Market
- 15.12.1. Country Segmental Analysis
- 15.12.2. Product Type
- 15.12.3. Voltage Range
- 15.12.4. Power Rating
- 15.12.5. Technology
- 15.12.6. Form Factor
- 15.12.7. End-use Industry
- 15.13. Rest of Asia Pacific Power Electronics Market
- 15.13.1. Country Segmental Analysis
- 15.13.2. Product Type
- 15.13.3. Voltage Range
- 15.13.4. Power Rating
- 15.13.5. Technology
- 15.13.6. Form Factor
- 15.13.7. End-use Industry
- 16. Middle East Power Electronics Market Analysis
- 16.1. Key Segment Analysis
- 16.2. Regional Snapshot
- 16.3. Middle East Power Electronics Market Size (Volume (Million Units) and Value (US$ Bn)), Analysis, and Forecasts, 2021-2035
- 16.3.1. Product Type
- 16.3.2. Voltage Range
- 16.3.3. Power Rating
- 16.3.4. Technology
- 16.3.5. Form Factor
- 16.3.6. End-use Industry
- 16.3.7. Country
- 16.3.7.1. Turkey
- 16.3.7.2. UAE
- 16.3.7.3. Saudi Arabia
- 16.3.7.4. Israel
- 16.3.7.5. Rest of Middle East
- 16.4. Turkey Power Electronics Market
- 16.4.1. Country Segmental Analysis
- 16.4.2. Product Type
- 16.4.3. Voltage Range
- 16.4.4. Power Rating
- 16.4.5. Technology
- 16.4.6. Form Factor
- 16.4.7. End-use Industry
- 16.5. UAE Power Electronics Market
- 16.5.1. Country Segmental Analysis
- 16.5.2. Product Type
- 16.5.3. Voltage Range
- 16.5.4. Power Rating
- 16.5.5. Technology
- 16.5.6. Form Factor
- 16.5.7. End-use Industry
- 16.6. Saudi Arabia Power Electronics Market
- 16.6.1. Country Segmental Analysis
- 16.6.2. Product Type
- 16.6.3. Voltage Range
- 16.6.4. Power Rating
- 16.6.5. Technology
- 16.6.6. Form Factor
- 16.6.7. End-use Industry
- 16.7. Israel Power Electronics Market
- 16.7.1. Country Segmental Analysis
- 16.7.2. Product Type
- 16.7.3. Voltage Range
- 16.7.4. Power Rating
- 16.7.5. Technology
- 16.7.6. Form Factor
- 16.7.7. End-use Industry
- 16.8. Rest of Middle East Power Electronics Market
- 16.8.1. Country Segmental Analysis
- 16.8.2. Product Type
- 16.8.3. Voltage Range
- 16.8.4. Power Rating
- 16.8.5. Technology
- 16.8.6. Form Factor
- 16.8.7. End-use Industry
- 17. Africa Power Electronics Market Analysis
- 17.1. Key Segment Analysis
- 17.2. Regional Snapshot
- 17.3. Africa Power Electronics Market Size (Volume (Million Units) and Value (US$ Bn)), Analysis, and Forecasts, 2021-2035
- 17.3.1. Product Type
- 17.3.2. Voltage Range
- 17.3.3. Power Rating
- 17.3.4. Technology
- 17.3.5. Form Factor
- 17.3.6. End-use Industry
- 17.3.7. Country
- 17.3.7.1. South Africa
- 17.3.7.2. Egypt
- 17.3.7.3. Nigeria
- 17.3.7.4. Algeria
- 17.3.7.5. Rest of Africa
- 17.4. South Africa Power Electronics Market
- 17.4.1. Country Segmental Analysis
- 17.4.2. Product Type
- 17.4.3. Voltage Range
- 17.4.4. Power Rating
- 17.4.5. Technology
- 17.4.6. Form Factor
- 17.4.7. End-use Industry
- 17.5. Egypt Power Electronics Market
- 17.5.1. Country Segmental Analysis
- 17.5.2. Product Type
- 17.5.3. Voltage Range
- 17.5.4. Power Rating
- 17.5.5. Technology
- 17.5.6. Form Factor
- 17.5.7. End-use Industry
- 17.6. Nigeria Power Electronics Market
- 17.6.1. Country Segmental Analysis
- 17.6.2. Product Type
- 17.6.3. Voltage Range
- 17.6.4. Power Rating
- 17.6.5. Technology
- 17.6.6. Form Factor
- 17.6.7. End-use Industry
- 17.7. Algeria Power Electronics Market
- 17.7.1. Country Segmental Analysis
- 17.7.2. Product Type
- 17.7.3. Voltage Range
- 17.7.4. Power Rating
- 17.7.5. Technology
- 17.7.6. Form Factor
- 17.7.7. End-use Industry
- 17.8. Rest of Africa Power Electronics Market
- 17.8.1. Country Segmental Analysis
- 17.8.2. Product Type
- 17.8.3. Voltage Range
- 17.8.4. Power Rating
- 17.8.5. Technology
- 17.8.6. Form Factor
- 17.8.7. End-use Industry
- 18. South America Power Electronics Market Analysis
- 18.1. Key Segment Analysis
- 18.2. Regional Snapshot
- 18.3. South America Power Electronics Market Size (Volume (Million Units) and Value (US$ Bn)), Analysis, and Forecasts, 2021-2035
- 18.3.1. Product Type
- 18.3.2. Voltage Range
- 18.3.3. Power Rating
- 18.3.4. Technology
- 18.3.5. Form Factor
- 18.3.6. End-use Industry
- 18.3.7. Country
- 18.3.7.1. Brazil
- 18.3.7.2. Argentina
- 18.3.7.3. Rest of South America
- 18.4. Brazil Power Electronics Market
- 18.4.1. Country Segmental Analysis
- 18.4.2. Product Type
- 18.4.3. Voltage Range
- 18.4.4. Power Rating
- 18.4.5. Technology
- 18.4.6. Form Factor
- 18.4.7. End-use Industry
- 18.5. Argentina Power Electronics Market
- 18.5.1. Country Segmental Analysis
- 18.5.2. Product Type
- 18.5.3. Voltage Range
- 18.5.4. Power Rating
- 18.5.5. Technology
- 18.5.6. Form Factor
- 18.5.7. End-use Industry
- 18.6. Rest of South America Power Electronics Market
- 18.6.1. Country Segmental Analysis
- 18.6.2. Product Type
- 18.6.3. Voltage Range
- 18.6.4. Power Rating
- 18.6.5. Technology
- 18.6.6. Form Factor
- 18.6.7. End-use Industry
- 19. Key Players/ Company Profile
- 19.1. ABB Ltd.
- 19.1.1. Company Details/ Overview
- 19.1.2. Company Financials
- 19.1.3. Key Customers and Competitors
- 19.1.4. Business/ Industry Portfolio
- 19.1.5. Product Portfolio/ Specification Details
- 19.1.6. Pricing Data
- 19.1.7. Strategic Overview
- 19.1.8. Recent Developments
- 19.2. Analog Devices Inc.
- 19.3. Eaton Corporation
- 19.4. Emerson Electric Co.
- 19.5. Fuji Electric Co. Ltd.
- 19.6. General Electric Company
- 19.7. Infineon Technologies AG
- 19.8. Littelfuse Inc.
- 19.9. Maxim Integrated Products
- 19.10. Microchip Technology Incorporated
- 19.11. Mitsubishi Electric Corporation
- 19.12. NXP Semiconductors N.V.
- 19.13. ON Semiconductor Corporation
- 19.14. Renesas Electronics Corporation
- 19.15. Rohm Co. Ltd.
- 19.16. Schneider Electric SE
- 19.17. SEMIKRON International
- 19.18. Siemens AG
- 19.19. Skyworks Solutions Inc.
- 19.20. STMicroelectronics N.V.
- 19.21. Texas Instruments Incorporated
- 19.22. Vishay Intertechnology Inc.
- 19.23. Other Key Players
- 19.1. ABB Ltd.
Note* - This is just tentative list of players. While providing the report, we will cover more number of players based on their revenue and share for each geography
Research Design
Our research design integrates both demand-side and supply-side analysis through a balanced combination of primary and secondary research methodologies. By utilizing both bottom-up and top-down approaches alongside rigorous data triangulation methods, we deliver robust market intelligence that supports strategic decision-making.
MarketGenics' comprehensive research design framework ensures the delivery of accurate, reliable, and actionable market intelligence. Through the integration of multiple research approaches, rigorous validation processes, and expert analysis, we provide our clients with the insights needed to make informed strategic decisions and capitalize on market opportunities.

MarketGenics leverages a dedicated industry panel of experts and a comprehensive suite of paid databases to effectively collect, consolidate, and analyze market intelligence.
Our approach has consistently proven to be reliable and effective in generating accurate market insights, identifying key industry trends, and uncovering emerging business opportunities.
Through both primary and secondary research, we capture and analyze critical company-level data such as manufacturing footprints, including technical centers, R&D facilities, sales offices, and headquarters.
Our expert panel further enhances our ability to estimate market size for specific brands based on validated field-level intelligence.
Our data mining techniques incorporate both parametric and non-parametric methods, allowing for structured data collection, sorting, processing, and cleaning.
Demand projections are derived from large-scale data sets analyzed through proprietary algorithms, culminating in robust and reliable market sizing.
Research Approach
The bottom-up approach builds market estimates by starting with the smallest addressable market units and systematically aggregating them to create comprehensive market size projections.
This method begins with specific, granular data points and builds upward to create the complete market landscape.
Customer Analysis → Segmental Analysis → Geographical Analysis
The top-down approach starts with the broadest possible market data and systematically narrows it down through a series of filters and assumptions to arrive at specific market segments or opportunities.
This method begins with the big picture and works downward to increasingly specific market slices.
TAM → SAM → SOM


Research Methods
Desk / Secondary Research
While analysing the market, we extensively study secondary sources, directories, and databases to identify and collect information useful for this technical, market-oriented, and commercial report. Secondary sources that we utilize are not only the public sources, but it is a combination of Open Source, Associations, Paid Databases, MG Repository & Knowledgebase, and others.
- Company websites, annual reports, financial reports, broker reports, and investor presentations
- National government documents, statistical databases and reports
- News articles, press releases and web-casts specific to the companies operating in the market, Magazines, reports, and others
- We gather information from commercial data sources for deriving company specific data such as segmental revenue, share for geography, product revenue, and others
- Internal and external proprietary databases (industry-specific), relevant patent, and regulatory databases
- Governing Bodies, Government Organizations
- Relevant Authorities, Country-specific Associations for Industries
We also employ the model mapping approach to estimate the product level market data through the players' product portfolio
Primary Research
Primary research/ interviews is vital in analyzing the market. Most of the cases involves paid primary interviews. Primary sources include primary interviews through e-mail interactions, telephonic interviews, surveys as well as face-to-face interviews with the different stakeholders across the value chain including several industry experts.
| Type of Respondents | Number of Primaries |
|---|---|
| Tier 2/3 Suppliers | ~20 |
| Tier 1 Suppliers | ~25 |
| End-users | ~25 |
| Industry Expert/ Panel/ Consultant | ~30 |
| Total | ~100 |
MG Knowledgebase
• Repository of industry blog, newsletter and case studies
• Online platform covering detailed market reports, and company profiles
Forecasting Factors and Models
Forecasting Factors
- Historical Trends – Past market patterns, cycles, and major events that shaped how markets behave over time. Understanding past trends helps predict future behavior.
- Industry Factors – Specific characteristics of the industry like structure, regulations, and innovation cycles that affect market dynamics.
- Macroeconomic Factors – Economic conditions like GDP growth, inflation, and employment rates that affect how much money people have to spend.
- Demographic Factors – Population characteristics like age, income, and location that determine who can buy your product.
- Technology Factors – How quickly people adopt new technology and how much technology infrastructure exists.
- Regulatory Factors – Government rules, laws, and policies that can help or restrict market growth.
- Competitive Factors – Analyzing competition structure such as degree of competition and bargaining power of buyers and suppliers.
Forecasting Models / Techniques
Multiple Regression Analysis
- Identify and quantify factors that drive market changes
- Statistical modeling to establish relationships between market drivers and outcomes
Time Series Analysis – Seasonal Patterns
- Understand regular cyclical patterns in market demand
- Advanced statistical techniques to separate trend, seasonal, and irregular components
Time Series Analysis – Trend Analysis
- Identify underlying market growth patterns and momentum
- Statistical analysis of historical data to project future trends
Expert Opinion – Expert Interviews
- Gather deep industry insights and contextual understanding
- In-depth interviews with key industry stakeholders
Multi-Scenario Development
- Prepare for uncertainty by modeling different possible futures
- Creating optimistic, pessimistic, and most likely scenarios
Time Series Analysis – Moving Averages
- Sophisticated forecasting for complex time series data
- Auto-regressive integrated moving average models with seasonal components
Econometric Models
- Apply economic theory to market forecasting
- Sophisticated economic models that account for market interactions
Expert Opinion – Delphi Method
- Harness collective wisdom of industry experts
- Structured, multi-round expert consultation process
Monte Carlo Simulation
- Quantify uncertainty and probability distributions
- Thousands of simulations with varying input parameters
Research Analysis
Our research framework is built upon the fundamental principle of validating market intelligence from both demand and supply perspectives. This dual-sided approach ensures comprehensive market understanding and reduces the risk of single-source bias.
Demand-Side Analysis: We understand end-user/application behavior, preferences, and market needs along with the penetration of the product for specific application.
Supply-Side Analysis: We estimate overall market revenue, analyze the segmental share along with industry capacity, competitive landscape, and market structure.
Validation & Evaluation
Data triangulation is a validation technique that uses multiple methods, sources, or perspectives to examine the same research question, thereby increasing the credibility and reliability of research findings. In market research, triangulation serves as a quality assurance mechanism that helps identify and minimize bias, validate assumptions, and ensure accuracy in market estimates.
- Data Source Triangulation – Using multiple data sources to examine the same phenomenon
- Methodological Triangulation – Using multiple research methods to study the same research question
- Investigator Triangulation – Using multiple researchers or analysts to examine the same data
- Theoretical Triangulation – Using multiple theoretical perspectives to interpret the same data

Custom Market Research Services
We will customise the research for you, in case the report listed above does not meet your requirements.
Get 10% Free Customisation