Process Analytics Market Size, Share & Trends Analysis Report by Component (Software, Services), Deployment Mode, Organization Size, Technology, Functionality, Data Source, Integration Level, End-Use Industry and Geography (North America, Europe, Asia Pacific, Middle East, Africa, and South America) – Global Industry Data, Trends, and Forecasts, 2026–2035
|
|
|
Segmental Data Insights |
|
|
Demand Trends |
|
|
Competitive Landscape |
|
|
Strategic Development |
|
|
Future Outlook & Opportunities |
|
Process Analytics Market Size, Share, and Growth
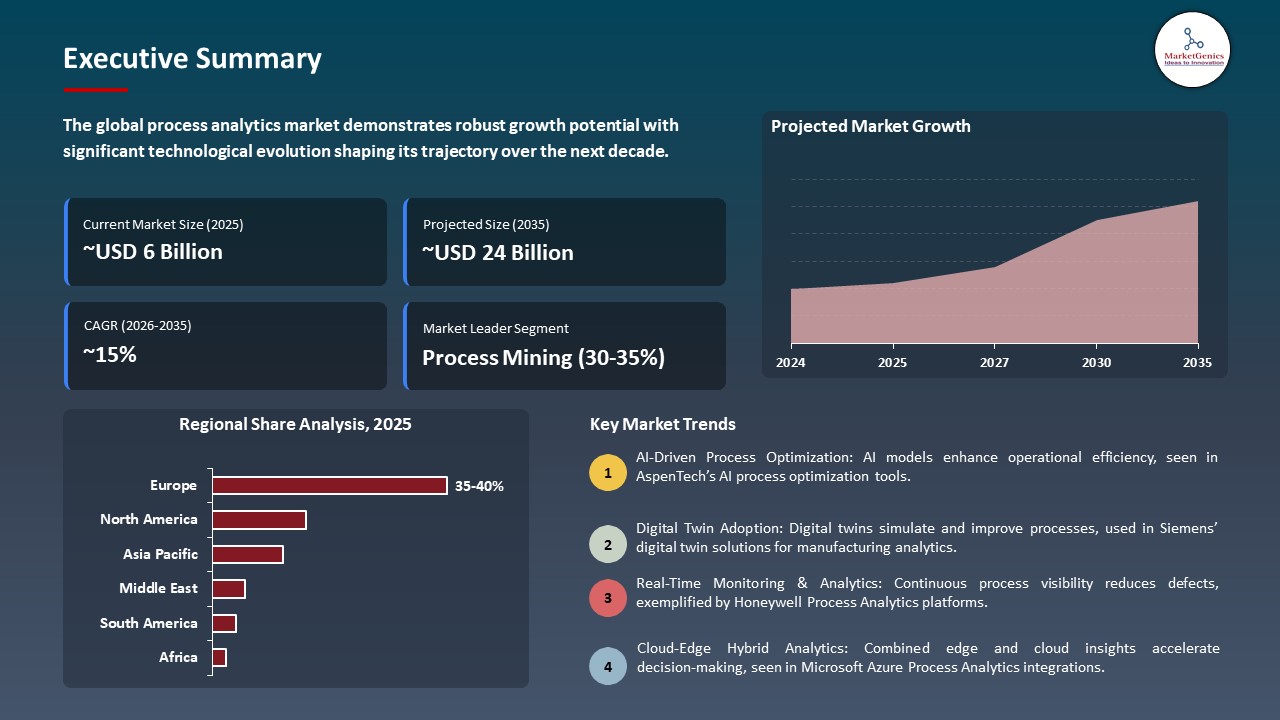
The global process analytics market is witnessing strong growth, valued at USD 6.2 billion in 2025 and projected to reach USD 24.2 billion by 2035, expanding at a CAGR of 14.6% during the forecast period. Asia Pacific is the fastest-growing region in the process analytics market due to rapid digital transformation, expanding industrial activity, increasing automation adoption, and growing demand for data-driven process optimization across emerging economies.
Daniel Brown, Chief Product Officer at Celonis, said, “To truly operationalize AI, you need to identify the right use cases, redesign your business processes, and orchestrate the agents alongside your people and existing systems, Our enhanced capabilities empower our customers and their partners to build AI solutions that lift their operations to unprecedented levels of efficiency and agility”.
Process analytics solutions are under demand due to the rapid rate of digital transformation in the manufacturing and service industries. Organizations are implementing innovative analytics and Artificial Intelligence and process mining solutions to streamline their activities, automate business processes, and enhance decision-making. The efficiency provided by this transformation results in lower operational cost, real-time monitoring of complex processes, and makes process analytics an essential facilitator of scalable, data-based business transformation in any industry.
The increased interest in sustainability and compliance with laws has become an opportunity of process analytics market. Combining analytics platforms with ESG reporting and carbon monitoring, enterprises have the opportunity to track the environmental impact, improve the use of resources, and adopt the global standards. This allows data-driven sustainability initiatives, improves corporate responsibility, and places process analytics solutions as key mechanisms of attaining operational efficiencies in addressing the environmental and social governance goals.
Key adjacent opportunities include process mining for supply chain optimization, real-time IoT-enabled monitoring, AI-assisted workflow automation, adoption in public sector and healthcare industries, and integration with advanced analytics for sustainability and ESG initiatives. These areas enable organizations to gain deeper insights, improve operational efficiency, and expand use cases for process analytics solutions.
 Process Analytics Market Dynamics and Trends
Driver: Accelerating Enterprise AI Integration into Process Analytics Platforms for Operational Efficiency Gains
-
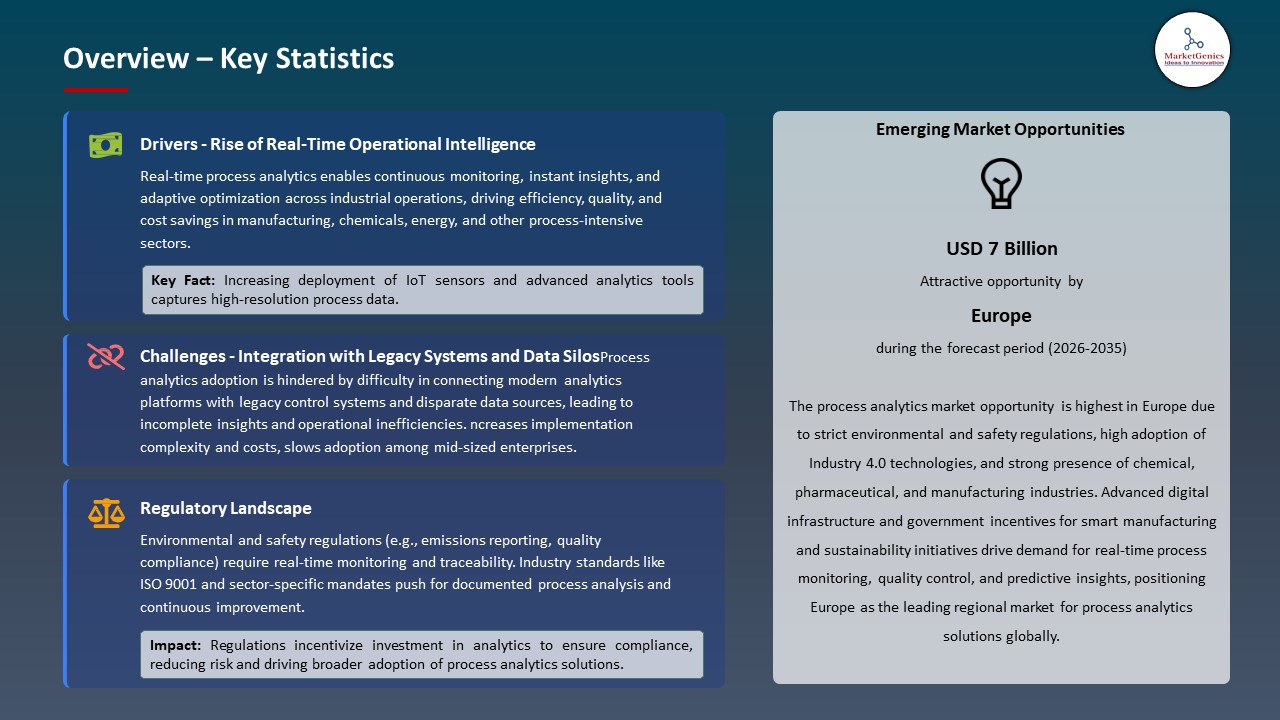
The rapid adoption of artificial intelligence into analytics platforms to improve operational efficiency, decision accuracy, and process agility is propelling the process analytics market. Businesses are starting to incorporate machine learning algorithms, predictive modelling and smart automation as part of their process analytics software to move beyond fixed, descriptive insights and proactive and prescriptive process optimization.
- AI allows constant tracking of complicated workflows, early detection and remuneration of inefficiencies, and automatic suggestions of corrective measures in both operational and business processes. The ability will lead to less dependency on manual analysis, a shorter response time, and a high level of consistency in executing a process.
- In November 2025, Celonis announced significant additions to its process intelligence platform to reinforce AI-driven, composable enterprise operations. These improvements comprise a digital twin of operations multimodal, zero-copy data lake, state-of-the-art object-based process mining, and an orchestration engine to orchestrate the activities of AI agents and people and systems.
- The growing pace of AI integration in process analytics is changing the operations of enterprises by allowing process optimization real-time and independent, thus reinforcing market expansion by increasing efficiency, scalability, and long-term adoption of digital transformations.
Restraint: Persistent High Implementation and Integration Costs with Complex Digital Infrastructure Demands
-
The process analytics market is limited by the high implementation and integration expenses due to the complexity of implementing advanced analytics solutions in the diverse enterprise digital environments. To undertake software licensing, system integration, and data harmonization, as well as upskilling employees, organizations need to pay considerably more, raise the total cost of ownership, and reduce the adoption speed.
- The development of process analytics platforms involved with legacy ERP systems, operational technologies, and fragmented data sources can typically demand expert knowledge and extended implementation periods, increasing the chances of an unsuccessful execution and affecting current operations. Additional costs in operations are also related to ongoing maintenance, upgrades of the platform and cybersecurity needs.
- These financial and technical barriers especially limit small and mid-sized companies that have small budgets on digital transformation and eventually curtail the rate of market growth despite a high demand of advanced process intelligence services.
Opportunity: Expansion of Cloud-Native and SaaS-Based Process Analytics Platforms
-
The increasing transformation towards cloud-native and SaaS-based methods of delivery is a great chance to the process analytics market. Businesses are becoming more attracted to scalable, subscription-based services that minimize initial infrastructure expenses, limit deployment timeframes and enable remote working environments.
- Cloud-native architecture has allowed continuous updates, integration between enterprise systems and elastic computing to process vast amounts of process data in real time. The small and mid-sized organizations are also facilitated to access these platforms that had experienced cost and complexity limitations previously.
- In 2025, Snowflake increased its fiscal 2026 product revenue outlook, as a result of high enterprise demand of its cloud-native, AI-behaviour data analytics system. To achieve the modernization of data infrastructure, central hosting and management of AI models, and streamlining analytics in multi-cloud setups, organizations started implementing Snowflake at greater rates.
- The growth of cloud-native, SaaS analytics solutions is increasing the rate of acceptance of scalable real-time process analytics, leading to market growth, wider enterprise usage and higher recurring revenue prospects.
Key Trend: Rapid Adoption of Process Mining and Intelligence Platforms Driven by Demand for Real-Time Process Transparency
-
The increased need of process transparency in real-time has led to faster implementation of process mining and process intelligence platforms within enterprises that want to have a round the clock visibility of the process. Companies are finding greater opportunities in these platforms to tap into event-level data-sets out of enterprise systems that enables them dynamic visualization of process flows, the ability to spot bottlenecks, and the ability to detect compliance deviations during their occurrence.
- These changes indicate a larger trend of moving towards real-time, data-driven performance management, as opposed to periodic, retrospective review of the processes. Sophisticated process mining services enable companies to track interrelated processes of finance, supply chain, manufacturing, and customer operations and facilitate quicker corrective measures and timely decisions.
- In November 2025, SAP Signavio enhanced its process mining features with significant improvements to SAP Signavio Process Insights and Process Intelligence. The release announced an AI-Assisted Process Analyzer which allows natural-language interaction with text-to-insights, text-to-widget functions to make process mining exploration easier to business users.
- The increased use of process mining platforms with advanced capabilities is facilitating uninterrupted, real-time process visibility and accelerated decision making and enhancing operational efficiency of enterprises and stimulating the enduring growth of process analytics market.
Process-Analytics-Market Analysis and Segmental Data
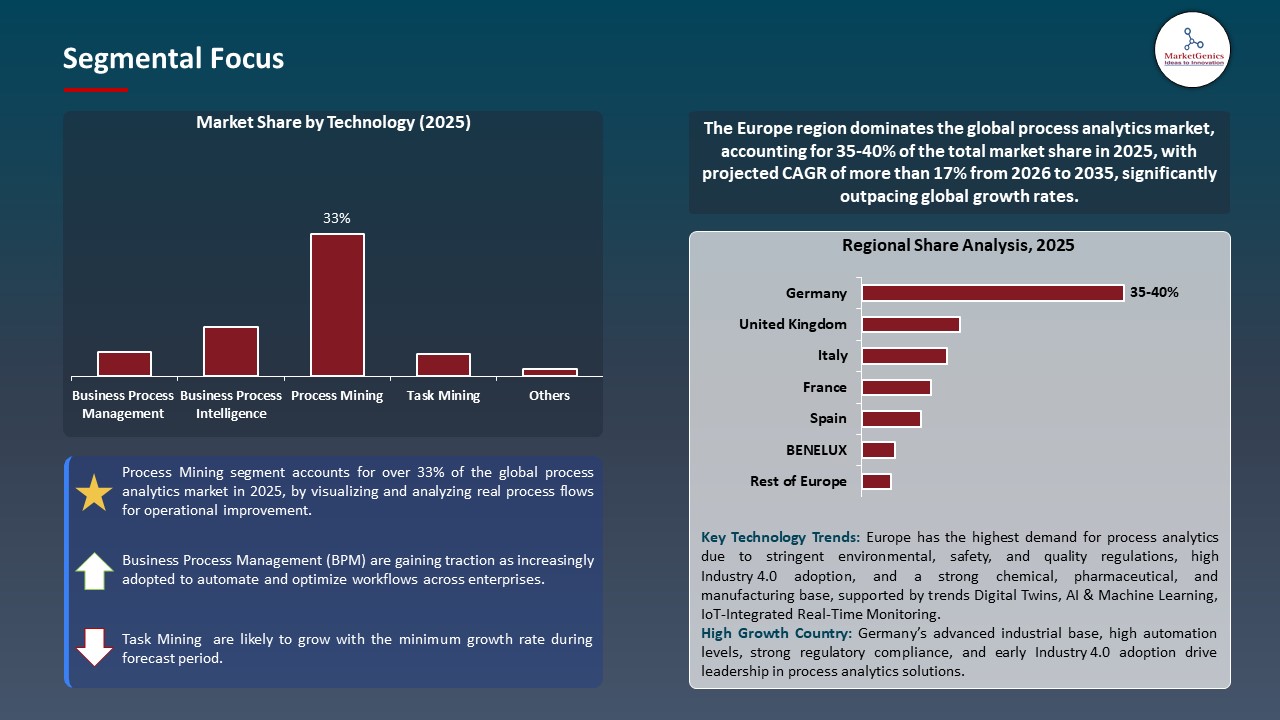
Process Mining Dominate Global Process Analytics Market
-
Process mining has emerged as the dominant segment within the global process analytics market, driven by enterprises’ increasing need for transparency, efficiency, and optimization across complex operational workflows.
- Process mining enables organizations to have a live, visual picture of the real process flows based on event-level data retrieved and analyzed by enterprise systems and identify the existence of bottlenecks, inefficiency, and compliance deviations. This ability enables businesses to get out of the past and backward process analysis, and embrace ongoing monitoring and decision-making based on data.
- The integration with artificial intelligence, machine learning, and advanced analytics tools which also makes process mining predictive and prescriptive, further accelerate its adoption, is also a feature of process mining. The use of process mining in industries such as finance, manufacturing, supply chain, and healthcare sectors are using the technology to enhance operational outcomes, cut costs, and achieve compliance.
- The rise of cloud-based and SaaS-based process mining solutions is also exposing the market to small and mid-sized businesses, adding to the domination of the market segment and making it one of the key drivers of growth in the worldwide process analytics sector.
Europe Leads Global Process Analytics Market Demand
-
Europe has emerged as a leading region in the global process analytics market, driven by strong digital transformation initiatives, stringent regulatory frameworks, and increasing adoption of advanced analytics solutions across enterprises.
- Organizations in manufacturing, automotive, pharmaceutical and financial sectors among others are busy investing in process analytics platforms to maximize operational performance, control business compliance and decision-making using real-time insights. Industry 4.0 and the smart manufacturing focus in the region also contributes to the increased rate of implementing process mining and analytics software.
- Moreover, the presence of extensive IT infrastructure and cloud and SaaS penetration in Europe allows businesses to adopt higher-order process analytics comparatively easily. Information transparency, sustainability monitoring, and operational efficiency are also encouraged by governments, regulatory agencies, and this provides good environment in implementing process intelligence solutions.
- Technological preparedness, regulatory encouragement, and enterprise demand in Europe have placed the region in the leading position of the process analytics market in the world, and is spurring high growth and innovations within the region.
Process-Analytics-Market Ecosystem
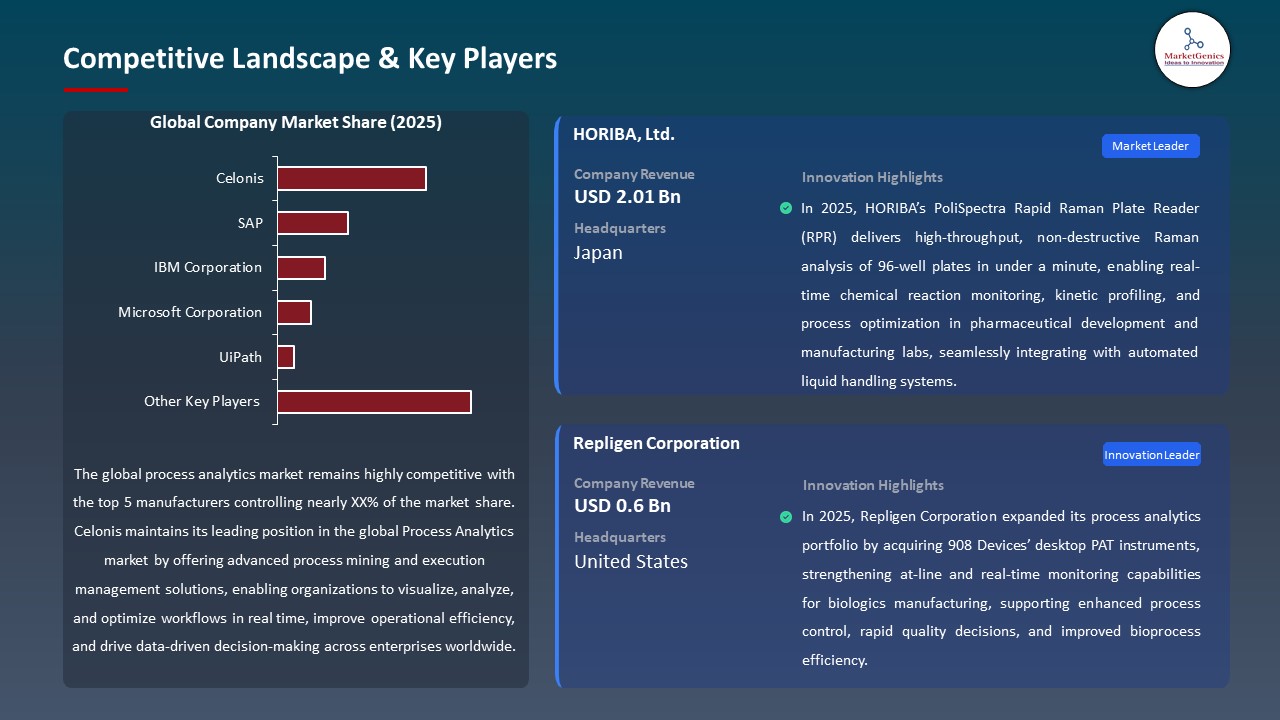
The global process analytics market is fragmented, with leading players including Celonis, SAP, IBM Corporation, Microsoft Corporation, and UiPath. These firms retain a high competitive advantage due to well-developed technological capacity, integrated analytics and process mining systems, and the capacity to provide scalable AI-driven solutions in any industry. They leverage their strengths as the large global enterprise partnerships, cloud and on-premises deployment alternatives, built-in ecosystems with the ERP and CRM platforms, and compliance with the data security and regulatory requirements.
Process analytics market value chain includes the processes of data extraction and integration with enterprise systems, process discovery and visualization, sophisticated analytics and AI-based insights, workflow optimization, real-time monitoring, dashboard reporting, and post-deployment support such as training, updates, and maintenance of the system. The stages make sure that actionable insights, better operational efficiency, as well as better enterprise adoption, are achieved.
The barriers to entry are high because of the complexity of process mining technologies, legacy system integration, and AI and cloud infrastructure needs, and the constant necessity of new and continuous automation, predictive analytics, and real-time monitoring systems. The ongoing advancement of AI-driven process intelligence, cloud-native, and scalable SaaS, is boosting market differentiation, aiding expansion, and solidifying market leadership of main actors in the Process Analytics market globally.
 Recent Development and Strategic Overview:
-
In August 2025, Celonis, in partnership with the Indian Institute of Information Technology, Allahabad (IIITA), launched India’s first academic research centre for Process Intelligence. The centre focuses on object-centric process mining, AI-driven business optimization, and real-world enterprise applications, while fostering talent through workshops, projects, and hands-on learning.
- In September 2025, UiPath partnered with OpenAI to integrate ChatGPT and frontier AI models into enterprise workflows via UiPath’s agentic automation platform. The collaboration enables seamless AI agent development, orchestration through UiPath Maestro, and large-action model (LAM) deployment, accelerating automation, improving process efficiency, and enhancing ROI while simplifying enterprise adoption of AI-driven process analytics and agentic automation.
Report Scope
|
Detail |
|
|
Market Size in 2025 |
USD 6.2 Bn |
|
Market Forecast Value in 2035 |
USD 24.2 Bn |
|
Growth Rate (CAGR) |
14.6% |
|
Forecast Period |
2026 – 2035 |
|
Historical Data Available for |
2021 – 2024 |
|
Market Size Units |
US$ Billion for Value |
|
Report Format |
Electronic (PDF) + Excel |
|
North America |
Europe |
Asia Pacific |
Middle East |
Africa |
South America |
|
|
|
|
|
|
|
Companies Covered |
|||||
|
|
|
|
|
|
Process-Analytics-Market Segmentation and Highlights
|
Segment |
Sub-segment |
|
Process Analytics Market, By Component |
|
|
Process Analytics Market, By Deployment Mode |
|
|
Process Analytics Market, By Organization Size |
|
|
Process Analytics Market, By Technology |
|
|
Process Analytics Market, By Functionality |
|
|
Process Analytics Market, By Data Source |
|
|
Process Analytics Market, By Integration Level |
|
|
Process Analytics Market, By End-Use Industry |
|
Frequently Asked Questions
Table of Contents
- 1. Research Methodology and Assumptions
- 1.1. Definitions
- 1.2. Research Design and Approach
- 1.3. Data Collection Methods
- 1.4. Base Estimates and Calculations
- 1.5. Forecasting Models
- 1.5.1. Key Forecast Factors & Impact Analysis
- 1.6. Secondary Research
- 1.6.1. Open Sources
- 1.6.2. Paid Databases
- 1.6.3. Associations
- 1.7. Primary Research
- 1.7.1. Primary Sources
- 1.7.2. Primary Interviews with Stakeholders across Ecosystem
- 2. Executive Summary
- 2.1. Global Process Analytics Market Outlook
- 2.1.1. Process Analytics Market Size Value (US$ Bn), and Forecasts, 2021-2035
- 2.1.2. Compounded Annual Growth Rate Analysis
- 2.1.3. Growth Opportunity Analysis
- 2.1.4. Segmental Share Analysis
- 2.1.5. Geographical Share Analysis
- 2.2. Market Analysis and Facts
- 2.3. Supply-Demand Analysis
- 2.4. Competitive Benchmarking
- 2.5. Go-to- Market Strategy
- 2.5.1. Customer/ End-use Industry Assessment
- 2.5.2. Growth Opportunity Data, 2026-2035
- 2.5.2.1. Regional Data
- 2.5.2.2. Country Data
- 2.5.2.3. Segmental Data
- 2.5.3. Identification of Potential Market Spaces
- 2.5.4. GAP Analysis
- 2.5.5. Potential Attractive Price Points
- 2.5.6. Prevailing Market Risks & Challenges
- 2.5.7. Preferred Sales & Marketing Strategies
- 2.5.8. Key Recommendations and Analysis
- 2.5.9. A Way Forward
- 2.1. Global Process Analytics Market Outlook
- 3. Industry Data and Premium Insights
- 3.1. Global Automation & Process Control Industry Overview, 2025
- 3.1.1. Automation & Process Control Industry Ecosystem Analysis
- 3.1.2. Key Trends for Automation & Process Control Industry
- 3.1.3. Regional Distribution for Automation & Process Control Industry
- 3.2. Supplier Customer Data
- 3.3. Technology Roadmap and Developments
- 3.4. Trade Analysis
- 3.4.1. Import & Export Analysis, 2025
- 3.4.2. Top Importing Countries
- 3.4.3. Top Exporting Countries
- 3.5. Trump Tariff Impact Analysis
- 3.5.1. Manufacturer
- 3.5.1.1. Based on the component & Raw material
- 3.5.2. Supply Chain
- 3.5.3. End Consumer
- 3.5.1. Manufacturer
- 3.6. Raw Material Analysis
- 3.1. Global Automation & Process Control Industry Overview, 2025
- 4. Market Overview
- 4.1. Market Dynamics
- 4.1.1. Drivers
- 4.1.1.1. Increasing demand for real-time monitoring and control in manufacturing and chemical processes.
- 4.1.1.2. Growing adoption of Industry 4.0 and IoT-enabled analytical solutions.
- 4.1.1.3. Regulatory requirements for quality, safety, and environmental compliance.
- 4.1.2. Restraints
- 4.1.2.1. High implementation and maintenance costs of advanced analytics systems.
- 4.1.2.2. Integration challenges with existing legacy infrastructure.
- 4.1.1. Drivers
- 4.2. Key Trend Analysis
- 4.3. Regulatory Framework
- 4.3.1. Key Regulations, Norms, and Subsidies, by Key Countries
- 4.3.2. Tariffs and Standards
- 4.3.3. Impact Analysis of Regulations on the Market
- 4.4. Ecosystem Analysis
- 4.5. Porter’s Five Forces Analysis
- 4.6. PESTEL Analysis
- 4.7. Global Process Analytics Market Demand
- 4.7.1. Historical Market Size – Value (US$ Bn), 2020-2024
- 4.7.2. Current and Future Market Size – Value (US$ Bn), 2026–2035
- 4.7.2.1. Y-o-Y Growth Trends
- 4.7.2.2. Absolute $ Opportunity Assessment
- 4.1. Market Dynamics
- 5. Competition Landscape
- 5.1. Competition structure
- 5.1.1. Fragmented v/s consolidated
- 5.2. Company Share Analysis, 2025
- 5.2.1. Global Company Market Share
- 5.2.2. By Region
- 5.2.2.1. North America
- 5.2.2.2. Europe
- 5.2.2.3. Asia Pacific
- 5.2.2.4. Middle East
- 5.2.2.5. Africa
- 5.2.2.6. South America
- 5.3. Product Comparison Matrix
- 5.3.1. Specifications
- 5.3.2. Market Positioning
- 5.3.3. Pricing
- 5.1. Competition structure
- 6. Global Process Analytics Market Analysis, by Component
- 6.1. Key Segment Analysis
- 6.2. Process Analytics Market Size Value (US$ Bn), Analysis, and Forecasts, by Component, 2021-2035
- 6.2.1. Software
- 6.2.1.1. Standalone Software
- 6.2.1.2. Integrated Software Suites
- 6.2.2. Services
- 6.2.2.1. Professional Services
- 6.2.2.1.1. Consulting Services
- 6.2.2.1.2. Implementation Services
- 6.2.2.1.3. Training and Education
- 6.2.2.2. Managed Services
- 6.2.2.1. Professional Services
- 6.2.1. Software
- 7. Global Process Analytics Market Analysis, by Deployment Mode
- 7.1. Key Segment Analysis
- 7.2. Process Analytics Market Size Value (US$ Bn), Analysis, and Forecasts, by Deployment Mode, 2021-2035
- 7.2.1. On-Premises
- 7.2.2. Cloud-Based
- 8. Global Process Analytics Market Analysis, by Organization Size
- 8.1. Key Segment Analysis
- 8.2. Process Analytics Market Size Value (US$ Bn), Analysis, and Forecasts, by Organization Size, 2021-2035
- 8.2.1. Large Enterprises
- 8.2.2. Small and Medium Enterprises (SMEs)
- 9. Global Process Analytics Market Analysis, by Technology
- 9.1. Key Segment Analysis
- 9.2. Process Analytics Market Size Value (US$ Bn), Analysis, and Forecasts, by Technology, 2021-2035
- 9.2.1. Business Process Management (BPM)
- 9.2.2. Business Process Intelligence
- 9.2.3. Process Mining
- 9.2.4. Task Mining
- 9.2.5. Robotic Process Automation (RPA) Analytics
- 9.2.6. Artificial Intelligence and Machine Learning
- 9.2.7. Real-Time Analytics
- 9.2.8. Predictive Analytics
- 9.2.9. Others
- 10. Global Process Analytics Market Analysis, by Functionality
- 10.1. Key Segment Analysis
- 10.2. Process Analytics Market Size Value (US$ Bn), Analysis, and Forecasts, by Functionality, 2021-2035
- 10.2.1. Process Discovery
- 10.2.2. Process Monitoring
- 10.2.3. Process Optimization
- 10.2.4. Conformance Checking
- 10.2.5. Root Cause Analysis
- 10.2.6. Performance Benchmarking
- 10.2.7. Workflow Automation
- 10.2.8. Others
- 11. Global Process Analytics Market Analysis, by Data Source
- 11.1. Key Segment Analysis
- 11.2. Process Analytics Market Size Value (US$ Bn), Analysis, and Forecasts, by Data Source, 2021-2035
- 11.2.1. ERP Systems
- 11.2.2. CRM Systems
- 11.2.3. Event Logs
- 11.2.4. Database Systems
- 11.2.5. IoT Sensors and Devices
- 11.2.6. Cloud Applications
- 11.2.7. Legacy Systems
- 12. Global Process Analytics Market Analysis, by Integration Level
- 12.1. Key Segment Analysis
- 12.2. Process Analytics Market Size Value (US$ Bn), Analysis, and Forecasts, by Integration Level, 2021-2035
- 12.2.1. Standalone Solutions
- 12.2.2. Integrated with BPM Suites
- 12.2.3. Integrated with Business Intelligence Tools
- 12.2.4. API-Based Integration
- 13. Global Process Analytics Market Analysis and Forecasts, by End-Use Industry
- 13.1. Key Findings
- 13.2. Process Analytics Market Size Value (US$ Bn), Analysis, and Forecasts, by End-Use Industry, 2021-2035
- 13.2.1. Manufacturing
- 13.2.2. Banking, Financial Services, and Insurance (BFSI)
- 13.2.3. Healthcare and Life Sciences
- 13.2.4. Retail and E-commerce
- 13.2.5. Telecommunications
- 13.2.6. Energy and Utilities
- 13.2.7. Transportation and Logistics
- 13.2.8. IT and Telecom Services
- 13.2.9. Government and Public Sector
- 13.2.10. Hospitality and Travel
- 13.2.11. Others
- 14. Global Process Analytics Market Analysis and Forecasts, by Region
- 14.1. Key Findings
- 14.2. Process Analytics Market Size Value (US$ Bn), Analysis, and Forecasts, by Region, 2021-2035
- 14.2.1. North America
- 14.2.2. Europe
- 14.2.3. Asia Pacific
- 14.2.4. Middle East
- 14.2.5. Africa
- 14.2.6. South America
- 15. North America Process Analytics Market Analysis
- 15.1. Key Segment Analysis
- 15.2. Regional Snapshot
- 15.3. North America Process Analytics Market Size Value (US$ Bn), Analysis, and Forecasts, 2021-2035
- 15.3.1. Component
- 15.3.2. Deployment Mode
- 15.3.3. Organization Size
- 15.3.4. Technology
- 15.3.5. Functionality
- 15.3.6. Data Source
- 15.3.7. Age Group
- 15.3.8. Integration Level
- 15.3.9. End-Use Industry
- 15.3.10. Country
- 15.3.10.1. USA
- 15.3.10.2. Canada
- 15.3.10.3. Mexico
- 15.4. USA Process Analytics Market
- 15.4.1. Country Segmental Analysis
- 15.4.2. Component
- 15.4.3. Deployment Mode
- 15.4.4. Organization Size
- 15.4.5. Technology
- 15.4.6. Functionality
- 15.4.7. Data Source
- 15.4.8. Age Group
- 15.4.9. Integration Level
- 15.4.10. End-Use Industry
- 15.5. Canada Process Analytics Market
- 15.5.1. Country Segmental Analysis
- 15.5.2. Component
- 15.5.3. Deployment Mode
- 15.5.4. Organization Size
- 15.5.5. Technology
- 15.5.6. Functionality
- 15.5.7. Data Source
- 15.5.8. Age Group
- 15.5.9. Integration Level
- 15.5.10. End-Use Industry
- 15.6. Mexico Process Analytics Market
- 15.6.1. Country Segmental Analysis
- 15.6.2. Component
- 15.6.3. Deployment Mode
- 15.6.4. Organization Size
- 15.6.5. Technology
- 15.6.6. Functionality
- 15.6.7. Data Source
- 15.6.8. Age Group
- 15.6.9. Integration Level
- 15.6.10. End-Use Industry
- 16. Europe Process Analytics Market Analysis
- 16.1. Key Segment Analysis
- 16.2. Regional Snapshot
- 16.3. Europe Process Analytics Market Size Value (US$ Bn), Analysis, and Forecasts, 2021-2035
- 16.3.1. Component
- 16.3.2. Deployment Mode
- 16.3.3. Organization Size
- 16.3.4. Technology
- 16.3.5. Functionality
- 16.3.6. Data Source
- 16.3.7. Age Group
- 16.3.8. Integration Level
- 16.3.9. End-Use Industry
- 16.3.10. Country
- 16.3.10.1. Germany
- 16.3.10.2. United Kingdom
- 16.3.10.3. France
- 16.3.10.4. Italy
- 16.3.10.5. Spain
- 16.3.10.6. Netherlands
- 16.3.10.7. Nordic Countries
- 16.3.10.8. Poland
- 16.3.10.9. Russia & CIS
- 16.3.10.10. Rest of Europe
- 16.4. Germany Process Analytics Market
- 16.4.1. Country Segmental Analysis
- 16.4.2. Component
- 16.4.3. Deployment Mode
- 16.4.4. Organization Size
- 16.4.5. Technology
- 16.4.6. Functionality
- 16.4.7. Data Source
- 16.4.8. Age Group
- 16.4.9. Integration Level
- 16.4.10. End-Use Industry
- 16.5. United Kingdom Process Analytics Market
- 16.5.1. Country Segmental Analysis
- 16.5.2. Component
- 16.5.3. Deployment Mode
- 16.5.4. Organization Size
- 16.5.5. Technology
- 16.5.6. Functionality
- 16.5.7. Data Source
- 16.5.8. Age Group
- 16.5.9. Integration Level
- 16.5.10. End-Use Industry
- 16.6. France Process Analytics Market
- 16.6.1. Country Segmental Analysis
- 16.6.2. Component
- 16.6.3. Deployment Mode
- 16.6.4. Organization Size
- 16.6.5. Technology
- 16.6.6. Functionality
- 16.6.7. Data Source
- 16.6.8. Age Group
- 16.6.9. Integration Level
- 16.6.10. End-Use Industry
- 16.7. Italy Process Analytics Market
- 16.7.1. Country Segmental Analysis
- 16.7.2. Component
- 16.7.3. Deployment Mode
- 16.7.4. Organization Size
- 16.7.5. Technology
- 16.7.6. Functionality
- 16.7.7. Data Source
- 16.7.8. Age Group
- 16.7.9. Integration Level
- 16.7.10. End-Use Industry
- 16.8. Spain Process Analytics Market
- 16.8.1. Country Segmental Analysis
- 16.8.2. Component
- 16.8.3. Deployment Mode
- 16.8.4. Organization Size
- 16.8.5. Technology
- 16.8.6. Functionality
- 16.8.7. Data Source
- 16.8.8. Age Group
- 16.8.9. Integration Level
- 16.8.10. End-Use Industry
- 16.9. Netherlands Process Analytics Market
- 16.9.1. Country Segmental Analysis
- 16.9.2. Component
- 16.9.3. Deployment Mode
- 16.9.4. Organization Size
- 16.9.5. Technology
- 16.9.6. Functionality
- 16.9.7. Data Source
- 16.9.8. Age Group
- 16.9.9. Integration Level
- 16.9.10. End-Use Industry
- 16.10. Nordic Countries Process Analytics Market
- 16.10.1. Country Segmental Analysis
- 16.10.2. Component
- 16.10.3. Deployment Mode
- 16.10.4. Organization Size
- 16.10.5. Technology
- 16.10.6. Functionality
- 16.10.7. Data Source
- 16.10.8. Age Group
- 16.10.9. Integration Level
- 16.10.10. End-Use Industry
- 16.11. Poland Process Analytics Market
- 16.11.1. Country Segmental Analysis
- 16.11.2. Component
- 16.11.3. Deployment Mode
- 16.11.4. Organization Size
- 16.11.5. Technology
- 16.11.6. Functionality
- 16.11.7. Data Source
- 16.11.8. Age Group
- 16.11.9. Integration Level
- 16.11.10. End-Use Industry
- 16.12. Russia & CIS Process Analytics Market
- 16.12.1. Country Segmental Analysis
- 16.12.2. Component
- 16.12.3. Deployment Mode
- 16.12.4. Organization Size
- 16.12.5. Technology
- 16.12.6. Functionality
- 16.12.7. Data Source
- 16.12.8. Age Group
- 16.12.9. Integration Level
- 16.12.10. End-Use Industry
- 16.13. Rest of Europe Process Analytics Market
- 16.13.1. Country Segmental Analysis
- 16.13.2. Component
- 16.13.3. Deployment Mode
- 16.13.4. Organization Size
- 16.13.5. Technology
- 16.13.6. Functionality
- 16.13.7. Data Source
- 16.13.8. Age Group
- 16.13.9. Integration Level
- 16.13.10. End-Use Industry
- 17. Asia Pacific Process Analytics Market Analysis
- 17.1. Key Segment Analysis
- 17.2. Regional Snapshot
- 17.3. Asia Pacific Process Analytics Market Size Value (US$ Bn), Analysis, and Forecasts, 2021-2035
- 17.3.1. Component
- 17.3.2. Deployment Mode
- 17.3.3. Organization Size
- 17.3.4. Technology
- 17.3.5. Functionality
- 17.3.6. Data Source
- 17.3.7. Age Group
- 17.3.8. Integration Level
- 17.3.9. End-Use Industry
- 17.3.10. Country
- 17.3.10.1. China
- 17.3.10.2. India
- 17.3.10.3. Japan
- 17.3.10.4. South Korea
- 17.3.10.5. Australia and New Zealand
- 17.3.10.6. Indonesia
- 17.3.10.7. Malaysia
- 17.3.10.8. Thailand
- 17.3.10.9. Vietnam
- 17.3.10.10. Rest of Asia Pacific
- 17.4. China Process Analytics Market
- 17.4.1. Country Segmental Analysis
- 17.4.2. Component
- 17.4.3. Deployment Mode
- 17.4.4. Organization Size
- 17.4.5. Technology
- 17.4.6. Functionality
- 17.4.7. Data Source
- 17.4.8. Age Group
- 17.4.9. Integration Level
- 17.4.10. End-Use Industry
- 17.5. India Process Analytics Market
- 17.5.1. Country Segmental Analysis
- 17.5.2. Component
- 17.5.3. Deployment Mode
- 17.5.4. Organization Size
- 17.5.5. Technology
- 17.5.6. Functionality
- 17.5.7. Data Source
- 17.5.8. Age Group
- 17.5.9. Integration Level
- 17.5.10. End-Use Industry
- 17.6. Japan Process Analytics Market
- 17.6.1. Country Segmental Analysis
- 17.6.2. Component
- 17.6.3. Deployment Mode
- 17.6.4. Organization Size
- 17.6.5. Technology
- 17.6.6. Functionality
- 17.6.7. Data Source
- 17.6.8. Age Group
- 17.6.9. Integration Level
- 17.6.10. End-Use Industry
- 17.7. South Korea Process Analytics Market
- 17.7.1. Country Segmental Analysis
- 17.7.2. Component
- 17.7.3. Deployment Mode
- 17.7.4. Organization Size
- 17.7.5. Technology
- 17.7.6. Functionality
- 17.7.7. Data Source
- 17.7.8. Age Group
- 17.7.9. Integration Level
- 17.7.10. End-Use Industry
- 17.8. Australia and New Zealand Process Analytics Market
- 17.8.1. Country Segmental Analysis
- 17.8.2. Component
- 17.8.3. Deployment Mode
- 17.8.4. Organization Size
- 17.8.5. Technology
- 17.8.6. Functionality
- 17.8.7. Data Source
- 17.8.8. Age Group
- 17.8.9. Integration Level
- 17.8.10. End-Use Industry
- 17.9. Indonesia Process Analytics Market
- 17.9.1. Country Segmental Analysis
- 17.9.2. Component
- 17.9.3. Deployment Mode
- 17.9.4. Organization Size
- 17.9.5. Technology
- 17.9.6. Functionality
- 17.9.7. Data Source
- 17.9.8. Age Group
- 17.9.9. Integration Level
- 17.9.10. End-Use Industry
- 17.10. Malaysia Process Analytics Market
- 17.10.1. Country Segmental Analysis
- 17.10.2. Component
- 17.10.3. Deployment Mode
- 17.10.4. Organization Size
- 17.10.5. Technology
- 17.10.6. Functionality
- 17.10.7. Data Source
- 17.10.8. Age Group
- 17.10.9. Integration Level
- 17.10.10. End-Use Industry
- 17.11. Thailand Process Analytics Market
- 17.11.1. Country Segmental Analysis
- 17.11.2. Component
- 17.11.3. Deployment Mode
- 17.11.4. Organization Size
- 17.11.5. Technology
- 17.11.6. Functionality
- 17.11.7. Data Source
- 17.11.8. Age Group
- 17.11.9. Integration Level
- 17.11.10. End-Use Industry
- 17.12. Vietnam Process Analytics Market
- 17.12.1. Country Segmental Analysis
- 17.12.2. Component
- 17.12.3. Deployment Mode
- 17.12.4. Organization Size
- 17.12.5. Technology
- 17.12.6. Functionality
- 17.12.7. Data Source
- 17.12.8. Age Group
- 17.12.9. Integration Level
- 17.12.10. End-Use Industry
- 17.13. Rest of Asia Pacific Process Analytics Market
- 17.13.1. Country Segmental Analysis
- 17.13.2. Component
- 17.13.3. Deployment Mode
- 17.13.4. Organization Size
- 17.13.5. Technology
- 17.13.6. Functionality
- 17.13.7. Data Source
- 17.13.8. Age Group
- 17.13.9. Integration Level
- 17.13.10. End-Use Industry
- 18. Middle East Process Analytics Market Analysis
- 18.1. Key Segment Analysis
- 18.2. Regional Snapshot
- 18.3. Middle East Process Analytics Market Size Value (US$ Bn), Analysis, and Forecasts, 2021-2035
- 18.3.1. Component
- 18.3.2. Deployment Mode
- 18.3.3. Organization Size
- 18.3.4. Technology
- 18.3.5. Functionality
- 18.3.6. Data Source
- 18.3.7. Age Group
- 18.3.8. Integration Level
- 18.3.9. End-Use Industry
- 18.3.10. Country
- 18.3.10.1. Turkey
- 18.3.10.2. UAE
- 18.3.10.3. Saudi Arabia
- 18.3.10.4. Israel
- 18.3.10.5. Rest of Middle East
- 18.4. Turkey Process Analytics Market
- 18.4.1. Country Segmental Analysis
- 18.4.2. Component
- 18.4.3. Deployment Mode
- 18.4.4. Organization Size
- 18.4.5. Technology
- 18.4.6. Functionality
- 18.4.7. Data Source
- 18.4.8. Age Group
- 18.4.9. Integration Level
- 18.4.10. End-Use Industry
- 18.5. UAE Process Analytics Market
- 18.5.1. Country Segmental Analysis
- 18.5.2. Component
- 18.5.3. Deployment Mode
- 18.5.4. Organization Size
- 18.5.5. Technology
- 18.5.6. Functionality
- 18.5.7. Data Source
- 18.5.8. Age Group
- 18.5.9. Integration Level
- 18.5.10. End-Use Industry
- 18.6. Saudi Arabia Process Analytics Market
- 18.6.1. Country Segmental Analysis
- 18.6.2. Component
- 18.6.3. Deployment Mode
- 18.6.4. Organization Size
- 18.6.5. Technology
- 18.6.6. Functionality
- 18.6.7. Data Source
- 18.6.8. Age Group
- 18.6.9. Integration Level
- 18.6.10. End-Use Industry
- 18.7. Israel Process Analytics Market
- 18.7.1. Country Segmental Analysis
- 18.7.2. Component
- 18.7.3. Deployment Mode
- 18.7.4. Organization Size
- 18.7.5. Technology
- 18.7.6. Functionality
- 18.7.7. Data Source
- 18.7.8. Age Group
- 18.7.9. Integration Level
- 18.7.10. End-Use Industry
- 18.8. Rest of Middle East Process Analytics Market
- 18.8.1. Country Segmental Analysis
- 18.8.2. Component
- 18.8.3. Deployment Mode
- 18.8.4. Organization Size
- 18.8.5. Technology
- 18.8.6. Functionality
- 18.8.7. Data Source
- 18.8.8. Age Group
- 18.8.9. Integration Level
- 18.8.10. End-Use Industry
- 19. Africa Process Analytics Market Analysis
- 19.1. Key Segment Analysis
- 19.2. Regional Snapshot
- 19.3. Africa Process Analytics Market Size Value (US$ Bn), Analysis, and Forecasts, 2021-2035
- 19.3.1. Component
- 19.3.2. Deployment Mode
- 19.3.3. Organization Size
- 19.3.4. Technology
- 19.3.5. Functionality
- 19.3.6. Data Source
- 19.3.7. Age Group
- 19.3.8. Integration Level
- 19.3.9. End-Use Industry
- 19.3.10. Country
- 19.3.10.1. South Africa
- 19.3.10.2. Egypt
- 19.3.10.3. Nigeria
- 19.3.10.4. Algeria
- 19.3.10.5. Rest of Africa
- 19.4. South Africa Process Analytics Market
- 19.4.1. Country Segmental Analysis
- 19.4.2. Component
- 19.4.3. Deployment Mode
- 19.4.4. Organization Size
- 19.4.5. Technology
- 19.4.6. Functionality
- 19.4.7. Data Source
- 19.4.8. Age Group
- 19.4.9. Integration Level
- 19.4.10. End-Use Industry
- 19.5. Egypt Process Analytics Market
- 19.5.1. Country Segmental Analysis
- 19.5.2. Component
- 19.5.3. Deployment Mode
- 19.5.4. Organization Size
- 19.5.5. Technology
- 19.5.6. Functionality
- 19.5.7. Data Source
- 19.5.8. Age Group
- 19.5.9. Integration Level
- 19.5.10. End-Use Industry
- 19.6. Nigeria Process Analytics Market
- 19.6.1. Country Segmental Analysis
- 19.6.2. Component
- 19.6.3. Deployment Mode
- 19.6.4. Organization Size
- 19.6.5. Technology
- 19.6.6. Functionality
- 19.6.7. Data Source
- 19.6.8. Age Group
- 19.6.9. Integration Level
- 19.6.10. End-Use Industry
- 19.7. Algeria Process Analytics Market
- 19.7.1. Country Segmental Analysis
- 19.7.2. Component
- 19.7.3. Deployment Mode
- 19.7.4. Organization Size
- 19.7.5. Technology
- 19.7.6. Functionality
- 19.7.7. Data Source
- 19.7.8. Age Group
- 19.7.9. Integration Level
- 19.7.10. End-Use Industry
- 19.8. Rest of Africa Process Analytics Market
- 19.8.1. Country Segmental Analysis
- 19.8.2. Component
- 19.8.3. Deployment Mode
- 19.8.4. Organization Size
- 19.8.5. Technology
- 19.8.6. Functionality
- 19.8.7. Data Source
- 19.8.8. Age Group
- 19.8.9. Integration Level
- 19.8.10. End-Use Industry
- 20. South America Process Analytics Market Analysis
- 20.1. Key Segment Analysis
- 20.2. Regional Snapshot
- 20.3. South America Process Analytics Market Size Value (US$ Bn), Analysis, and Forecasts, 2021-2035
- 20.3.1. Component
- 20.3.2. Deployment Mode
- 20.3.3. Organization Size
- 20.3.4. Technology
- 20.3.5. Functionality
- 20.3.6. Data Source
- 20.3.7. Age Group
- 20.3.8. Integration Level
- 20.3.9. End-Use Industry
- 20.3.10. Country
- 20.3.10.1. Brazil
- 20.3.10.2. Argentina
- 20.3.10.3. Rest of South America
- 20.4. Brazil Process Analytics Market
- 20.4.1. Country Segmental Analysis
- 20.4.2. Component
- 20.4.3. Deployment Mode
- 20.4.4. Organization Size
- 20.4.5. Technology
- 20.4.6. Functionality
- 20.4.7. Data Source
- 20.4.8. Age Group
- 20.4.9. Integration Level
- 20.4.10. End-Use Industry
- 20.5. Argentina Process Analytics Market
- 20.5.1. Country Segmental Analysis
- 20.5.2. Component
- 20.5.3. Deployment Mode
- 20.5.4. Organization Size
- 20.5.5. Technology
- 20.5.6. Functionality
- 20.5.7. Data Source
- 20.5.8. Age Group
- 20.5.9. Integration Level
- 20.5.10. End-Use Industry
- 20.6. Rest of South America Process Analytics Market
- 20.6.1. Country Segmental Analysis
- 20.6.2. Component
- 20.6.3. Deployment Mode
- 20.6.4. Organization Size
- 20.6.5. Technology
- 20.6.6. Functionality
- 20.6.7. Data Source
- 20.6.8. Age Group
- 20.6.9. Integration Level
- 20.6.10. End-Use Industry
- 21. Key Players/ Company Profile
- 21.1. ABBYY
- 21.1.1. Company Details/ Overview
- 21.1.2. Company Financials
- 21.1.3. Key Customers and Competitors
- 21.1.4. Business/ Industry Portfolio
- 21.1.5. Product Portfolio/ Specification Details
- 21.1.6. Pricing Data
- 21.1.7. Strategic Overview
- 21.1.8. Recent Developments
- 21.2. Appian Corporation
- 21.3. Apromore Pty Ltd
- 21.4. Celonis
- 21.5. Everflow
- 21.6. Fluxicon
- 21.7. IBM Corporation
- 21.8. Lana Labs
- 21.9. Mehrwerk
- 21.10. Microsoft Corporation
- 21.11. Nintex RPA
- 21.12. Oracle Corporation
- 21.13. PAFnow
- 21.14. Pegasystems Inc.
- 21.15. QPR Software
- 21.16. SAP
- 21.17. ServiceNow
- 21.18. Software AG
- 21.19. StereoLOGIC
- 21.20. TIBCO Software
- 21.21. UiPath
- 21.22. Other Key Players
- 21.1. ABBYY
Note* - This is just tentative list of players. While providing the report, we will cover more number of players based on their revenue and share for each geography
Research Design
Our research design integrates both demand-side and supply-side analysis through a balanced combination of primary and secondary research methodologies. By utilizing both bottom-up and top-down approaches alongside rigorous data triangulation methods, we deliver robust market intelligence that supports strategic decision-making.
MarketGenics' comprehensive research design framework ensures the delivery of accurate, reliable, and actionable market intelligence. Through the integration of multiple research approaches, rigorous validation processes, and expert analysis, we provide our clients with the insights needed to make informed strategic decisions and capitalize on market opportunities.

MarketGenics leverages a dedicated industry panel of experts and a comprehensive suite of paid databases to effectively collect, consolidate, and analyze market intelligence.
Our approach has consistently proven to be reliable and effective in generating accurate market insights, identifying key industry trends, and uncovering emerging business opportunities.
Through both primary and secondary research, we capture and analyze critical company-level data such as manufacturing footprints, including technical centers, R&D facilities, sales offices, and headquarters.
Our expert panel further enhances our ability to estimate market size for specific brands based on validated field-level intelligence.
Our data mining techniques incorporate both parametric and non-parametric methods, allowing for structured data collection, sorting, processing, and cleaning.
Demand projections are derived from large-scale data sets analyzed through proprietary algorithms, culminating in robust and reliable market sizing.
Research Approach
The bottom-up approach builds market estimates by starting with the smallest addressable market units and systematically aggregating them to create comprehensive market size projections.
This method begins with specific, granular data points and builds upward to create the complete market landscape.
Customer Analysis → Segmental Analysis → Geographical Analysis
The top-down approach starts with the broadest possible market data and systematically narrows it down through a series of filters and assumptions to arrive at specific market segments or opportunities.
This method begins with the big picture and works downward to increasingly specific market slices.
TAM → SAM → SOM


Research Methods
Desk / Secondary Research
While analysing the market, we extensively study secondary sources, directories, and databases to identify and collect information useful for this technical, market-oriented, and commercial report. Secondary sources that we utilize are not only the public sources, but it is a combination of Open Source, Associations, Paid Databases, MG Repository & Knowledgebase, and others.
- Company websites, annual reports, financial reports, broker reports, and investor presentations
- National government documents, statistical databases and reports
- News articles, press releases and web-casts specific to the companies operating in the market, Magazines, reports, and others
- We gather information from commercial data sources for deriving company specific data such as segmental revenue, share for geography, product revenue, and others
- Internal and external proprietary databases (industry-specific), relevant patent, and regulatory databases
- Governing Bodies, Government Organizations
- Relevant Authorities, Country-specific Associations for Industries
We also employ the model mapping approach to estimate the product level market data through the players' product portfolio
Primary Research
Primary research/ interviews is vital in analyzing the market. Most of the cases involves paid primary interviews. Primary sources include primary interviews through e-mail interactions, telephonic interviews, surveys as well as face-to-face interviews with the different stakeholders across the value chain including several industry experts.
| Type of Respondents | Number of Primaries |
|---|---|
| Tier 2/3 Suppliers | ~20 |
| Tier 1 Suppliers | ~25 |
| End-users | ~25 |
| Industry Expert/ Panel/ Consultant | ~30 |
| Total | ~100 |
MG Knowledgebase
• Repository of industry blog, newsletter and case studies
• Online platform covering detailed market reports, and company profiles
Forecasting Factors and Models
Forecasting Factors
- Historical Trends – Past market patterns, cycles, and major events that shaped how markets behave over time. Understanding past trends helps predict future behavior.
- Industry Factors – Specific characteristics of the industry like structure, regulations, and innovation cycles that affect market dynamics.
- Macroeconomic Factors – Economic conditions like GDP growth, inflation, and employment rates that affect how much money people have to spend.
- Demographic Factors – Population characteristics like age, income, and location that determine who can buy your product.
- Technology Factors – How quickly people adopt new technology and how much technology infrastructure exists.
- Regulatory Factors – Government rules, laws, and policies that can help or restrict market growth.
- Competitive Factors – Analyzing competition structure such as degree of competition and bargaining power of buyers and suppliers.
Forecasting Models / Techniques
Multiple Regression Analysis
- Identify and quantify factors that drive market changes
- Statistical modeling to establish relationships between market drivers and outcomes
Time Series Analysis – Seasonal Patterns
- Understand regular cyclical patterns in market demand
- Advanced statistical techniques to separate trend, seasonal, and irregular components
Time Series Analysis – Trend Analysis
- Identify underlying market growth patterns and momentum
- Statistical analysis of historical data to project future trends
Expert Opinion – Expert Interviews
- Gather deep industry insights and contextual understanding
- In-depth interviews with key industry stakeholders
Multi-Scenario Development
- Prepare for uncertainty by modeling different possible futures
- Creating optimistic, pessimistic, and most likely scenarios
Time Series Analysis – Moving Averages
- Sophisticated forecasting for complex time series data
- Auto-regressive integrated moving average models with seasonal components
Econometric Models
- Apply economic theory to market forecasting
- Sophisticated economic models that account for market interactions
Expert Opinion – Delphi Method
- Harness collective wisdom of industry experts
- Structured, multi-round expert consultation process
Monte Carlo Simulation
- Quantify uncertainty and probability distributions
- Thousands of simulations with varying input parameters
Research Analysis
Our research framework is built upon the fundamental principle of validating market intelligence from both demand and supply perspectives. This dual-sided approach ensures comprehensive market understanding and reduces the risk of single-source bias.
Demand-Side Analysis: We understand end-user/application behavior, preferences, and market needs along with the penetration of the product for specific application.
Supply-Side Analysis: We estimate overall market revenue, analyze the segmental share along with industry capacity, competitive landscape, and market structure.
Validation & Evaluation
Data triangulation is a validation technique that uses multiple methods, sources, or perspectives to examine the same research question, thereby increasing the credibility and reliability of research findings. In market research, triangulation serves as a quality assurance mechanism that helps identify and minimize bias, validate assumptions, and ensure accuracy in market estimates.
- Data Source Triangulation – Using multiple data sources to examine the same phenomenon
- Methodological Triangulation – Using multiple research methods to study the same research question
- Investigator Triangulation – Using multiple researchers or analysts to examine the same data
- Theoretical Triangulation – Using multiple theoretical perspectives to interpret the same data

Custom Market Research Services
We will customise the research for you, in case the report listed above does not meet your requirements.
Get 10% Free Customisation