Process Instrumentation Market Size, Share & Trends Analysis Report by Instrument Type (Flow Meters, Pressure Transmitters, Temperature Sensors, Level Instruments, Analytical Instruments, Control Valves, Recorders & Indicators), Technology, Measurement Parameter, Installation Type, Distribution Channel, End-Use Industry, and Geography (North America, Europe, Asia Pacific, Middle East, Africa, and South America) – Global Industry Data, Trends, and Forecasts, 2026–2035
|
|
|
Segmental Data Insights |
|
|
Demand Trends |
|
|
Competitive Landscape |
|
|
Strategic Development |
|
|
Future Outlook & Opportunities |
|
Process Instrumentation Market Size, Share, and Growth
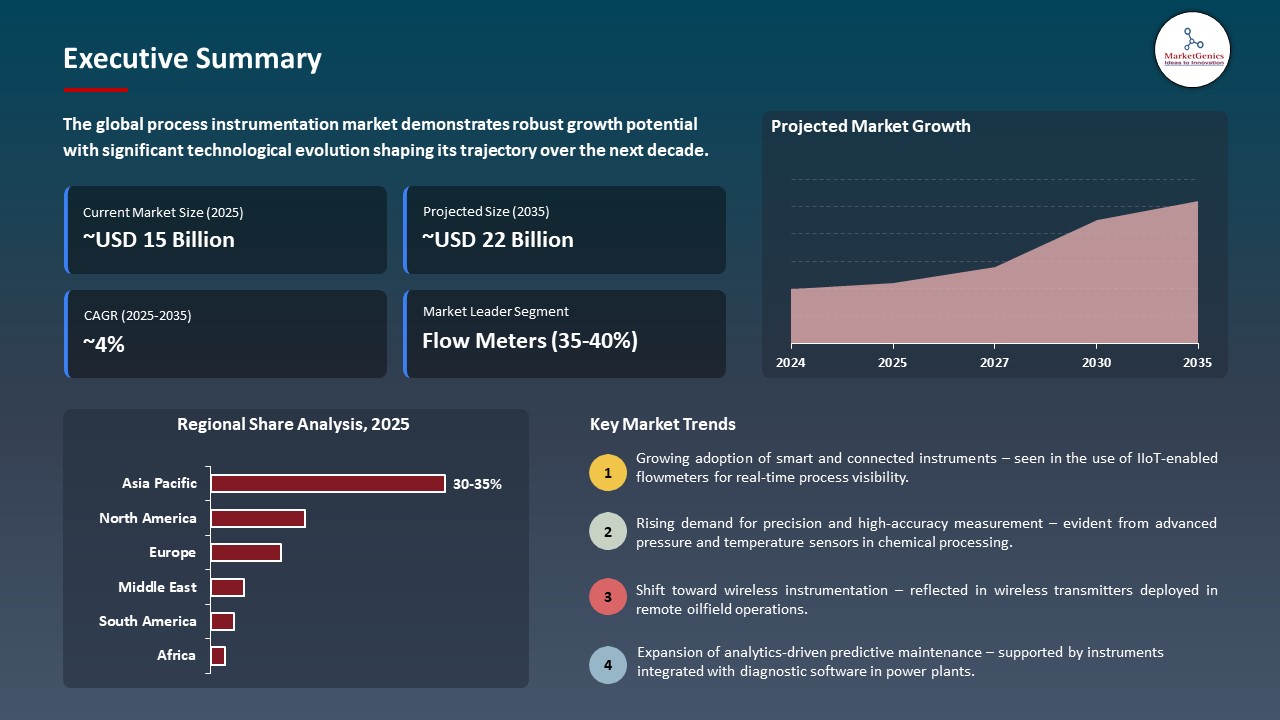
The global process instrumentation market is witnessing strong growth, valued at USD 15.3 billion in 2025 and projected to reach USD 22.2 billion by 2035, expanding at a CAGR of 3.8% during the forecast period. North America is the fastest-growing region in the Process Instrumentation market due to rapid adoption of advanced automation, smart instrumentation, and Industry 4.0 technologies.
Dr. Mats Gökstorp, Chairman of the Executive Board of SICK AG, said, “We are pleased that the strategic partnership for process automation is now starting. Together, we can better support customers worldwide and guide them into a sustainable future with leading technological solutions. We are convinced that the transformation of the process industry offers enormous opportunities for growth and development, which we will optimally leverage as strong partners”.
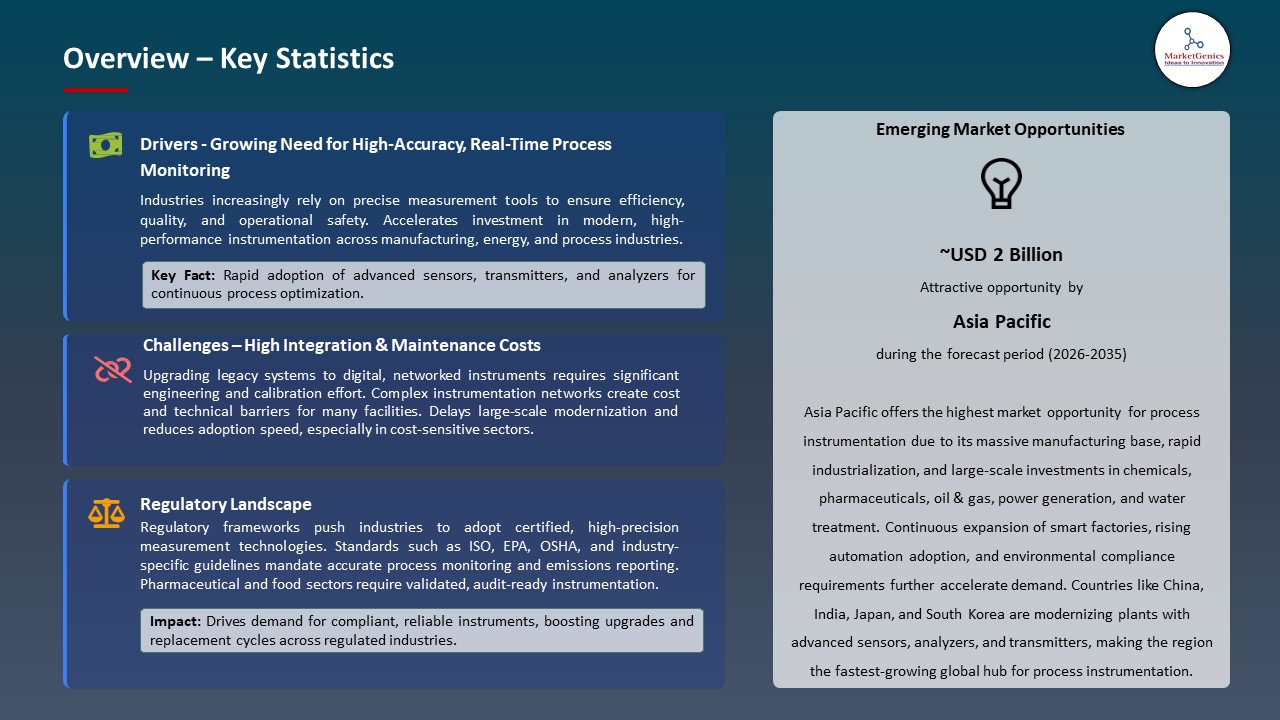
The growing need for precise measurement, monitoring, and control in industrial processes is driving the process instrumentation market. Accurate instrumentation ensures consistent product quality, optimizes production efficiency, and minimizes operational risks. Industries rely on advanced sensors, transmitters, and analyzers to monitor critical variables like pressure, temperature, and flow, enabling real-time decision-making and improved process reliability across diverse sectors.
Collaborations in the process instrumentation market drive growth by accelerating innovation, expanding market reach, and enhancing adoption of advanced, energy-efficient, and digitalized instrumentation solutions. For instance, In January 2025, SICK and Endress+Hauser launched a joint venture to develop process instrumentation, including analyzers and gas flow meters, supporting decarbonization, emission monitoring, and energy-efficient operations across process industries.
The growing demand for data-driven decision-making and advanced analytics in process industries presents a significant opportunity for the process instrumentation market. Industries are increasingly leveraging real-time data from sensors and smart instruments to optimize operations, predict equipment failures, and enhance productivity. Advanced analytics enable better process control, reduced downtime, and improved resource utilization, creating strong demand for innovative instrumentation solutions that support intelligent monitoring and actionable insights across various industrial sectors.
Process Instrumentation Market Dynamics and Trends
Driver: Expansion of Process Industries in Emerging Economies
-
The expansion of process industries in emerging economies is a key driver for the Process Instrumentation market. Rapid industrialization in countries across Asia, Latin America, and Africa has led to increased demand for chemical manufacturing, oil & gas processing, pharmaceuticals, food & beverages, and other process-based industries. As these industries grow, there is a rising need for accurate measurement, monitoring, and control of critical process parameters such as temperature, pressure, flow, and level.
- Advanced process instrumentation helps enhance operational efficiency, maintain consistent product quality, ensure regulatory compliance, and reduce energy consumption. Additionally, the push toward automation and digitalization in these emerging markets further accelerates the adoption of smart sensors, transmitters, and analyzers, supporting overall market growth.
- In 2024, ABB’s Bengaluru facility in India manufactured integrated gas analyzer systems, with 85% of the units exported to international customers including Argentina, the UAE, Canada, and Australia. These systems play a critical role in ensuring process safety, efficiency, and real-time monitoring in energy industries such as oil and gas.
- The instance highlights how ABB leverages an emerging economy to scale advanced process instrumentation solutions for both domestic and global markets, supporting the growth of process industries and the adoption of advanced analytical technologies.
- Overall, emerging economies are becoming pivotal hubs for driving global growth and innovation in the Process Instrumentation market.
Restraint: Price Sensitivity in Commoditized Product Categories
-
Price Sensitivity in Commoditized Product Categories is a notable restraint for the Process Instrumentation market. Many instrumentation products, such as basic pressure transmitters, flow meters, and level sensors, have become increasingly commoditized, with multiple suppliers offering similar specifications and performance. This intensifies competition, forcing manufacturers to focus heavily on pricing strategies rather than innovation or value-added features. As a result, profit margins for standard instrumentation products are often under pressure, which can limit investments in research and development of advanced solutions.
- Additionally, end-users in industries like chemical, food & beverages, and water treatment are highly cost-conscious, often prioritizing lower-priced options to manage operational budgets. This tendency can slow the adoption of high-performance or smart instrumentation systems, even when such products offer long-term efficiency, safety, or energy benefits.
- Consequently, companies must carefully balance cost competitiveness with technological differentiation, ensuring that pricing pressures in commoditized categories do not hinder overall market growth and the deployment of innovative instrumentation solutions.
Opportunity: Digital Transformation of Process Plants with Smart Instrumentation
-
The digital transformation of process plants with smart instrumentation presents a significant opportunity for the Process Instrumentation market. Industries are increasingly adopting advanced sensors, transmitters, and analyzers integrated with Industrial Internet of Things (IIoT) platforms to enable real-time monitoring, predictive maintenance, and data-driven decision-making. Smart instrumentation allows plants to optimize operations, improve process efficiency, ensure product quality, and reduce downtime.
- Furthermore, digital transformation supports regulatory compliance, energy efficiency, and sustainability goals by providing accurate, continuous insights into critical process parameters. As companies modernize legacy systems and invest in automated, connected solutions, the demand for innovative, smart instrumentation technologies is expected to grow rapidly, driving market expansion across chemical, pharmaceutical, oil & gas, and food & beverage industries.
- In 2025, Emerson launched its Synchros IIoT Wireless Monitoring Platform, designed to enhance asset and condition monitoring in process plants. The platform provides increased accessibility to hard-to-instrument measurement points, seamless wireless connectivity via WirelessHART, and integration with Plantweb Insight Analytics for real-time monitoring and actionable insights.
- This enables proactive maintenance, minimizes downtime, and improves operational efficiency, demonstrating that smart instrumentation drives digital transformation and supports data-driven decision-making in modern process industries.
- This illustrates that smart, connected instrumentation is transforming process plants, creating substantial growth opportunities for the global Process Instrumentation market.
Key Trend: Adoption of Wireless and Battery-Free Instrumentation
-
The adoption of wireless and battery-free instrumentation is emerging as a key trend in the Process Instrumentation market. Industries are increasingly deploying wireless sensors, transmitters, and analyzers to reduce installation complexity, eliminate extensive cabling, and enhance flexibility in monitoring hard-to-reach or hazardous locations.
- Battery-free devices, often powered by energy harvesting technologies, offer sustainable, low-maintenance solutions by minimizing downtime associated with battery replacement and reducing environmental impact. These instruments enable seamless integration with Industrial Internet of Things (IIoT) platforms, providing real-time data for predictive maintenance, process optimization, and operational efficiency.
- In June 2025, Energous launched the e-Sense tag, a battery-free, wireless sensor for real-time temperature and location monitoring. Powered via over-the-air energy and integrated with the e-Compass cloud platform, it enables continuous asset visibility, operational efficiency, and low-maintenance, highlighting the growing adoption of wireless, battery-free instrumentation in industrial and supply chain applications.
- As industries prioritize digitalization, cost-effective maintenance, and sustainable operations, the demand for wireless and battery-free instrumentation is expected to grow significantly across chemical, oil & gas, pharmaceutical, and food & beverage sectors.
Process-Instrumentation-Market Analysis and Segmental Data
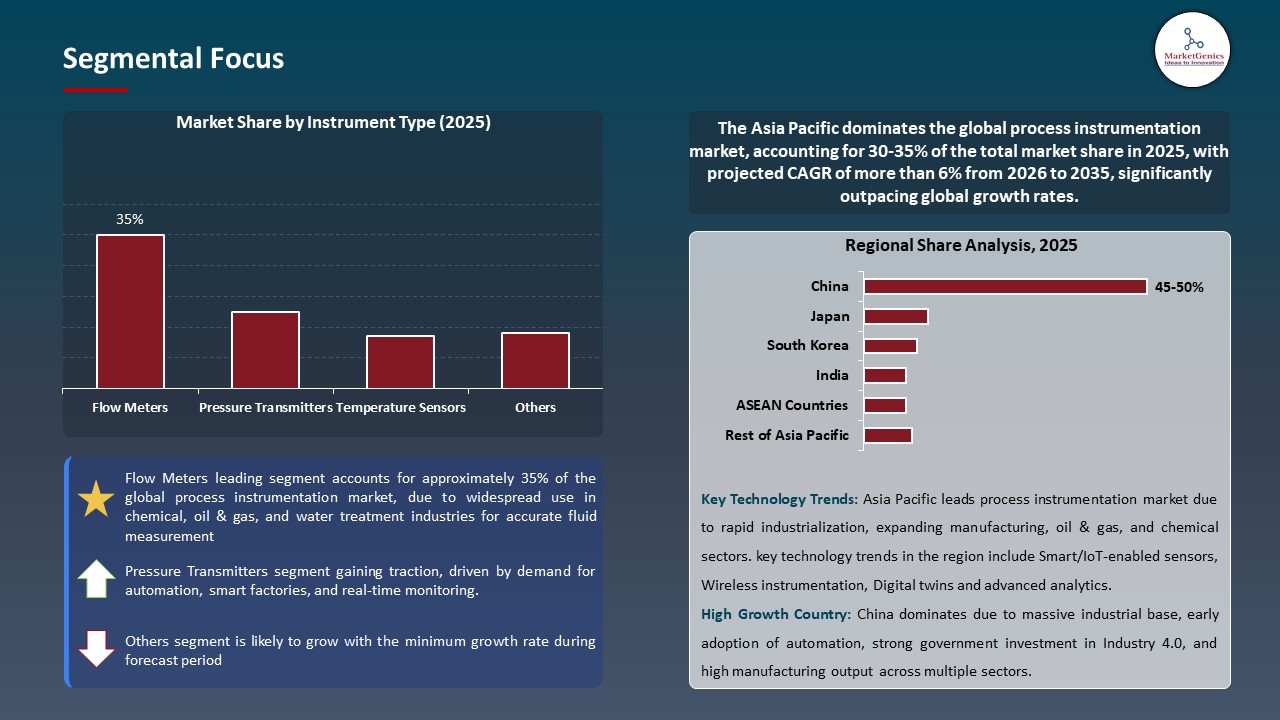
Flow Meters Dominate Global Process Instrumentation Market
-
Flow meters dominate the global Process Instrumentation market as the leading segment due to their critical role in measuring, monitoring, and controlling the flow of liquids, gases, and steam across various industrial processes. They are widely used in chemical, oil & gas, water treatment, food & beverage, and pharmaceutical industries to ensure accurate process control, maintain product quality, and optimize operational efficiency.
- The segment benefits from technological advancements, including ultrasonic, electromagnetic, Coriolis, and vortex flow meters, which offer high precision, reliability, and integration with digital and IIoT systems. Growing demand for real-time monitoring, energy efficiency, and regulatory compliance further reinforces flow meters as a key driver and the largest revenue contributor in the Process Instrumentation market.
- In April 2025, Emerson launched the Flexim FLUXUS / PIOX 731 series, non-intrusive ultrasonic flow meters for accurate liquid and gas measurement. The series offers versatile, clamp-on installation, advanced features like disturbance and wet gas correction, and seamless software integration, enabling reliable, efficient flow monitoring across diverse industrial applications.
- This underscores the pivotal role of flow meters as the leading segment driving precision, efficiency, and growth in the global Process Instrumentation market.
Asia Pacific Leads Global Process Instrumentation Market Demand
-
Asia Pacific leads the global process instrumentation market demand due to rapid industrialization, expanding manufacturing activities, and increasing adoption of automation technologies across key sectors. The region’s growth in chemical, oil & gas, pharmaceutical, food & beverage, and water treatment industries has driven significant demand for accurate measurement, monitoring, and control solutions.
- Rising investments in smart instrumentation, digitalization, and energy-efficient processes further support market expansion. Additionally, government initiatives promoting industrial modernization, infrastructure development, and process safety have accelerated the adoption of advanced sensors, transmitters, and analyzers.
- In July 2025, Yokogawa India expanded its local presence by delivering next-generation AXG magnetic flowmeters to Pune, Maharashtra. The AXG series provides excellent accuracy, robustness, and smart diagnostics for industrial sectors such as water, wastewater, and process industries. This milestone demonstrates Yokogawa's dedication to "Make in India," which enables smarter, more scalable instrumentation solutions and drives the use of sophisticated process measurement technologies in Asia Pacific's constantly expanding industrial landscape.
- The combination of a large industrial base, technological adoption, and supportive policies positions Asia Pacific as a critical hub for Process Instrumentation demand and innovation in the global market.
Process-Instrumentation-Market Ecosystem
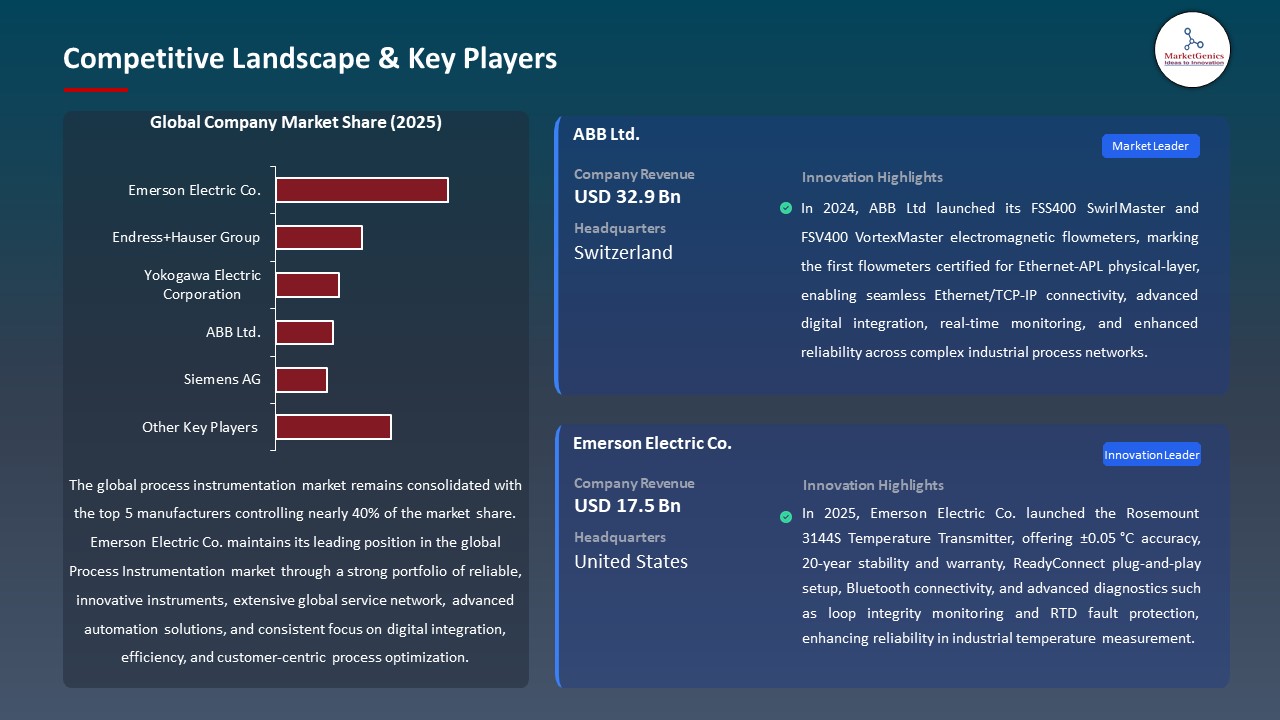
The global process instrumentation market is moderately consolidated, with key players such as Emerson Electric Co., Endress+Hauser Group, Yokogawa Electric Corporation, ABB Ltd., and Siemens AG collectively accounting for approximately 38% of the market. These leading companies maintain their position through strong customer relationships, high-reliability instrumentation solutions, and seamless integration of sensors, transmitters, and analyzers across diverse industrial applications.
The market value chain encompasses sensor and actuator manufacturing, transmitter and analyzer development, communication protocol design, system integration, calibration, and post-installation services such as predictive maintenance, compliance verification, and digital monitoring solutions.
High entry barriers exist due to the need for precision, certified instrumentation, and established trust among industrial customers. Meanwhile, specialized and regional vendors continue to innovate, driving technological advancement and enabling niche applications in process industries.
Recent Development and Strategic Overview:
-
In November 2025, ABB launched Ethernet-APL-enabled ProcessMaster flowmeters as part of its process instrumentation portfolio, offering high-speed, secure data transmission in hazardous environments. Supporting real-time monitoring, predictive maintenance, and process optimization across chemical, oil & gas, power, and water industries, these intrinsically safe flowmeters integrate Profinet, Modbus TCP, and cybersecurity features, delivering scalable, efficient digital instrumentation for enhanced operational performance and data-driven decision-making.
- In November 2025, Yokogawa Engineering Asia and Singapore’s A*STAR signed a Master Research Collaboration Agreement to co-develop next-generation process instrumentation and automation solutions. The partnership focuses on advanced sensing, measurement, and control technologies to optimize operations, improve energy efficiency, and reduce emissions in process industries such as oil & gas, petrochemical, chemical, and pharmaceuticals.
Report Scope
|
Detail |
|
|
Market Size in 2025 |
USD 15.3 Bn |
|
Market Forecast Value in 2035 |
USD 22.2 Bn |
|
Growth Rate (CAGR) |
3.8% |
|
Forecast Period |
2026 – 2035 |
|
Historical Data Available for |
2021 – 2024 |
|
Market Size Units |
US$ Billion for Value Million Units for Volume |
|
Report Format |
Electronic (PDF) + Excel |
|
North America |
Europe |
Asia Pacific |
Middle East |
Africa |
South America |
|
|
|
|
|
|
|
Companies Covered |
|||||
|
|
|
|
|
|
Process-Instrumentation-Market Segmentation and Highlights
|
Segment |
Sub-segment |
|
Process Instrumentation Market, By Instrument Type |
|
|
Process Instrumentation Market, By Technology |
|
|
Process Instrumentation Market, By Measurement Parameter |
|
|
Process Instrumentation Market, By Installation Type |
|
|
Process Instrumentation Market, By Distribution Channel |
|
|
Process Instrumentation Market, By End-Use Industry |
|
Frequently Asked Questions
Table of Contents
- 1. Research Methodology and Assumptions
- 1.1. Definitions
- 1.2. Research Design and Approach
- 1.3. Data Collection Methods
- 1.4. Base Estimates and Calculations
- 1.5. Forecasting Models
- 1.5.1. Key Forecast Factors & Impact Analysis
- 1.6. Secondary Research
- 1.6.1. Open Sources
- 1.6.2. Paid Databases
- 1.6.3. Associations
- 1.7. Primary Research
- 1.7.1. Primary Sources
- 1.7.2. Primary Interviews with Stakeholders across Ecosystem
- 2. Executive Summary
- 2.1. Global Process Instrumentation Market Outlook
- 2.1.1. Process Instrumentation Market Size Volume (Million units) and Value (US$ Bn), and Forecasts, 2021-2035
- 2.1.2. Compounded Annual Growth Rate Analysis
- 2.1.3. Growth Opportunity Analysis
- 2.1.4. Segmental Share Analysis
- 2.1.5. Geographical Share Analysis
- 2.2. Market Analysis and Facts
- 2.3. Supply-Demand Analysis
- 2.4. Competitive Benchmarking
- 2.5. Go-to- Market Strategy
- 2.5.1. Customer/ End-use Industry Assessment
- 2.5.2. Growth Opportunity Data, 2026-2035
- 2.5.2.1. Regional Data
- 2.5.2.2. Country Data
- 2.5.2.3. Segmental Data
- 2.5.3. Identification of Potential Market Spaces
- 2.5.4. GAP Analysis
- 2.5.5. Potential Attractive Price Points
- 2.5.6. Prevailing Market Risks & Challenges
- 2.5.7. Preferred Sales & Marketing Strategies
- 2.5.8. Key Recommendations and Analysis
- 2.5.9. A Way Forward
- 2.1. Global Process Instrumentation Market Outlook
- 3. Industry Data and Premium Insights
- 3.1. Global Automation & Process Control Industry Overview, 2025
- 3.1.1. Automation & Process Control Industry Ecosystem Analysis
- 3.1.2. Key Trends for Automation & Process Control Industry
- 3.1.3. Regional Distribution for Automation & Process Control Industry
- 3.2. Supplier Customer Data
- 3.3. Technology Roadmap and Developments
- 3.4. Trade Analysis
- 3.4.1. Import & Export Analysis, 2025
- 3.4.2. Top Importing Countries
- 3.4.3. Top Exporting Countries
- 3.5. Trump Tariff Impact Analysis
- 3.5.1. Manufacturer
- 3.5.1.1. Based on the component & Raw material
- 3.5.2. Supply Chain
- 3.5.3. End Consumer
- 3.5.1. Manufacturer
- 3.6. Raw Material Analysis
- 3.1. Global Automation & Process Control Industry Overview, 2025
- 4. Market Overview
- 4.1. Market Dynamics
- 4.1.1. Drivers
- 4.1.1.1. Digitalization & IIoT adoption (smart sensors, real-time monitoring, predictive maintenance)
- 4.1.1.2. Stringent safety, quality and environmental regulations driving instrumentation upgrades
- 4.1.1.3. Expansion and modernization of process industries (oil & gas, chemicals, pharma, food & beverage)
- 4.1.2. Restraints
- 4.1.2.1. High upfront cost and integration complexity of advanced instrumentation systems
- 4.1.2.2. Cybersecurity, interoperability and legacy-system compatibility challenges
- 4.1.1. Drivers
- 4.2. Key Trend Analysis
- 4.3. Regulatory Framework
- 4.3.1. Key Regulations, Norms, and Subsidies, by Key Countries
- 4.3.2. Tariffs and Standards
- 4.3.3. Impact Analysis of Regulations on the Market
- 4.4. Value Chain Analysis
- 4.4.1. Component Suppliers
- 4.4.2. Sensor & Transducer Manufacturers
- 4.4.3. Distributors & Channel Partners
- 4.4.4. End-User Industries
- 4.5. Cost Structure Analysis
- 4.5.1. Parameter’s Share for Cost Associated
- 4.5.2. COGP vs COGS
- 4.5.3. Profit Margin Analysis
- 4.6. Pricing Analysis
- 4.6.1. Regional Pricing Analysis
- 4.6.2. Segmental Pricing Trends
- 4.6.3. Factors Influencing Pricing
- 4.7. Porter’s Five Forces Analysis
- 4.8. PESTEL Analysis
- 4.9. Global Process Instrumentation Market Demand
- 4.9.1. Historical Market Size – Volume (Million Units) and Value (US$ Bn), 2020-2024
- 4.9.2. Current and Future Market Size – Volume (Million Units) and Value (US$ Bn), 2026–2035
- 4.9.2.1. Y-o-Y Growth Trends
- 4.9.2.2. Absolute $ Opportunity Assessment
- 4.1. Market Dynamics
- 5. Competition Landscape
- 5.1. Competition structure
- 5.1.1. Fragmented v/s consolidated
- 5.2. Company Share Analysis, 2025
- 5.2.1. Global Company Market Share
- 5.2.2. By Region
- 5.2.2.1. North America
- 5.2.2.2. Europe
- 5.2.2.3. Asia Pacific
- 5.2.2.4. Middle East
- 5.2.2.5. Africa
- 5.2.2.6. South America
- 5.3. Product Comparison Matrix
- 5.3.1. Specifications
- 5.3.2. Market Positioning
- 5.3.3. Pricing
- 5.1. Competition structure
- 6. Global Process Instrumentation Market Analysis, by Instrument Type
- 6.1. Key Segment Analysis
- 6.2. Process Instrumentation Market Size Volume (Million units) and Value (US$ Bn), Analysis, and Forecasts, by Instrument Type, 2021-2035
- 6.2.1. Flow Meters
- 6.2.1.1. Electromagnetic Flow Meters
- 6.2.1.2. Ultrasonic Flow Meters
- 6.2.1.3. Coriolis Flow Meters
- 6.2.1.4. Turbine Flow Meters
- 6.2.1.5. Vortex Flow Meters
- 6.2.1.6. Differential Pressure Flow Meters
- 6.2.1.7. Others
- 6.2.2. Pressure Transmitters
- 6.2.2.1. Absolute Pressure Transmitters
- 6.2.2.2. Gauge Pressure Transmitters
- 6.2.2.3. Differential Pressure Transmitters
- 6.2.2.4. Others
- 6.2.3. Temperature Sensors
- 6.2.3.1. Thermocouples
- 6.2.3.2. Resistance Temperature Detectors (RTDs)
- 6.2.3.3. Thermistors
- 6.2.3.4. Infrared Sensors
- 6.2.3.5. Others
- 6.2.4. Level Instruments
- 6.2.4.1. Radar Level Transmitters
- 6.2.4.2. Ultrasonic Level Transmitters
- 6.2.4.3. Capacitance Level Transmitters
- 6.2.4.4. Hydrostatic Level Transmitters
- 6.2.4.5. Others
- 6.2.5. Analytical Instruments
- 6.2.5.1. Gas Analyzers
- 6.2.5.2. Liquid Analyzers
- 6.2.5.3. pH Meters
- 6.2.5.4. Conductivity Meters
- 6.2.5.5. Others
- 6.2.6. Control Valves
- 6.2.7. Recorders & Indicators
- 6.2.1. Flow Meters
- 7. Global Process Instrumentation Market Analysis, by Technology
- 7.1. Key Segment Analysis
- 7.2. Process Instrumentation Market Size Volume (Million units) and Value (US$ Bn), Analysis, and Forecasts, by Technology, 2021-2035
- 7.2.1. Wired Instrumentation
- 7.2.2. Wireless Instrumentation
- 7.2.2.1. WirelessHART
- 7.2.2.2. ISA100.11a
- 7.2.2.3. Zigbee
- 7.2.2.4. Bluetooth
- 7.2.2.5. Others
- 7.2.3. Smart Instrumentation
- 7.2.4. Conventional Instrumentation
- 8. Global Process Instrumentation Market Analysis, by Measurement Parameter
- 8.1. Key Segment Analysis
- 8.2. Process Instrumentation Market Size Volume (Million units) and Value (US$ Bn), Analysis, and Forecasts, by Measurement Parameter, 2021-2035
- 8.2.1. Flow Measurement
- 8.2.2. Pressure Measurement
- 8.2.3. Temperature Measurement
- 8.2.4. Level Measurement
- 8.2.5. Humidity Measurement
- 8.2.6. Force Measurement
- 8.2.7. Others
- 9. Global Process Instrumentation Market Analysis, by Installation Type
- 9.1. Key Segment Analysis
- 9.2. Process Instrumentation Market Size Volume (Million units) and Value (US$ Bn), Analysis, and Forecasts, by Installation Type, 2021-2035
- 9.2.1. In-line Installation
- 9.2.2. Insertion Type
- 9.2.3. Clamp-on Type
- 9.2.4. Portable/Handheld
- 9.2.5. Fixed Installation
- 10. Global Process Instrumentation Market Analysis, by Distribution Channel
- 10.1. Key Segment Analysis
- 10.2. Process Instrumentation Market Size Volume (Million units) and Value (US$ Bn), Analysis, and Forecasts, by Distribution Channel, 2021-2035
- 10.2.1. Direct Sales
- 10.2.2. Distributors
- 10.2.3. Online Channels
- 11. Global Process Instrumentation Market Analysis, by End-Use Industry
- 11.1. Key Segment Analysis
- 11.2. Process Instrumentation Market Size Volume (Million units) and Value (US$ Bn), Analysis, and Forecasts, by End-Use Industry, 2021-2035
- 11.2.1. Metal & Mining Industry
- 11.2.2. Power Generation
- 11.2.3. Food & Beverage
- 11.2.4. Chemical & Petrochemical
- 11.2.5. Oil & Gas
- 11.2.6. Water & Wastewater Treatment
- 11.2.7. Pharmaceutical & Biotechnology
- 11.2.8. Pulp & Paper
- 11.2.9. Automotive
- 11.2.10. Cement & Construction Materials
- 11.2.11. Others
- 12. Global Process Instrumentation Market Analysis and Forecasts, by Region
- 12.1. Key Findings
- 12.2. Process Instrumentation Market Size Volume (Million units) and Value (US$ Bn), Analysis, and Forecasts, by Region, 2021-2035
- 12.2.1. North America
- 12.2.2. Europe
- 12.2.3. Asia Pacific
- 12.2.4. Middle East
- 12.2.5. Africa
- 12.2.6. South America
- 13. North America Process Instrumentation Market Analysis
- 13.1. Key Segment Analysis
- 13.2. Regional Snapshot
- 13.3. North America Process Instrumentation Market Size Volume (Million units) and Value (US$ Bn), Analysis, and Forecasts, 2021-2035
- 13.3.1. Instrument Type
- 13.3.2. Technology
- 13.3.3. Measurement Parameter
- 13.3.4. Installation Type
- 13.3.5. Distribution Channel
- 13.3.6. End-Use Industry
- 13.3.7. Country
- 13.3.7.1. USA
- 13.3.7.2. Canada
- 13.3.7.3. Mexico
- 13.4. USA Process Instrumentation Market
- 13.4.1. Country Segmental Analysis
- 13.4.2. Instrument Type
- 13.4.3. Technology
- 13.4.4. Measurement Parameter
- 13.4.5. Installation Type
- 13.4.6. Distribution Channel
- 13.4.7. End-Use Industry
- 13.5. Canada Process Instrumentation Market
- 13.5.1. Country Segmental Analysis
- 13.5.2. Instrument Type
- 13.5.3. Technology
- 13.5.4. Measurement Parameter
- 13.5.5. Installation Type
- 13.5.6. Distribution Channel
- 13.5.7. End-Use Industry
- 13.6. Mexico Process Instrumentation Market
- 13.6.1. Country Segmental Analysis
- 13.6.2. Instrument Type
- 13.6.3. Technology
- 13.6.4. Measurement Parameter
- 13.6.5. Installation Type
- 13.6.6. Distribution Channel
- 13.6.7. End-Use Industry
- 14. Europe Process Instrumentation Market Analysis
- 14.1. Key Segment Analysis
- 14.2. Regional Snapshot
- 14.3. Europe Process Instrumentation Market Size Volume (Million units) and Value (US$ Bn), Analysis, and Forecasts, 2021-2035
- 14.3.1. Instrument Type
- 14.3.2. Technology
- 14.3.3. Measurement Parameter
- 14.3.4. Installation Type
- 14.3.5. Distribution Channel
- 14.3.6. End-Use Industry
- 14.3.7. Country
- 14.3.7.1. Germany
- 14.3.7.2. United Kingdom
- 14.3.7.3. France
- 14.3.7.4. Italy
- 14.3.7.5. Spain
- 14.3.7.6. Netherlands
- 14.3.7.7. Nordic Countries
- 14.3.7.8. Poland
- 14.3.7.9. Russia & CIS
- 14.3.7.10. Rest of Europe
- 14.4. Germany Process Instrumentation Market
- 14.4.1. Country Segmental Analysis
- 14.4.2. Instrument Type
- 14.4.3. Technology
- 14.4.4. Measurement Parameter
- 14.4.5. Installation Type
- 14.4.6. Distribution Channel
- 14.4.7. End-Use Industry
- 14.5. United Kingdom Process Instrumentation Market
- 14.5.1. Country Segmental Analysis
- 14.5.2. Instrument Type
- 14.5.3. Technology
- 14.5.4. Measurement Parameter
- 14.5.5. Installation Type
- 14.5.6. Distribution Channel
- 14.5.7. End-Use Industry
- 14.6. France Process Instrumentation Market
- 14.6.1. Country Segmental Analysis
- 14.6.2. Instrument Type
- 14.6.3. Technology
- 14.6.4. Measurement Parameter
- 14.6.5. Installation Type
- 14.6.6. Distribution Channel
- 14.6.7. End-Use Industry
- 14.7. Italy Process Instrumentation Market
- 14.7.1. Country Segmental Analysis
- 14.7.2. Instrument Type
- 14.7.3. Technology
- 14.7.4. Measurement Parameter
- 14.7.5. Installation Type
- 14.7.6. Distribution Channel
- 14.7.7. End-Use Industry
- 14.8. Spain Process Instrumentation Market
- 14.8.1. Country Segmental Analysis
- 14.8.2. Instrument Type
- 14.8.3. Technology
- 14.8.4. Measurement Parameter
- 14.8.5. Installation Type
- 14.8.6. Distribution Channel
- 14.8.7. End-Use Industry
- 14.9. Netherlands Process Instrumentation Market
- 14.9.1. Country Segmental Analysis
- 14.9.2. Instrument Type
- 14.9.3. Technology
- 14.9.4. Measurement Parameter
- 14.9.5. Installation Type
- 14.9.6. Distribution Channel
- 14.9.7. End-Use Industry
- 14.10. Nordic Countries Process Instrumentation Market
- 14.10.1. Country Segmental Analysis
- 14.10.2. Instrument Type
- 14.10.3. Technology
- 14.10.4. Measurement Parameter
- 14.10.5. Installation Type
- 14.10.6. Distribution Channel
- 14.10.7. End-Use Industry
- 14.11. Poland Process Instrumentation Market
- 14.11.1. Country Segmental Analysis
- 14.11.2. Instrument Type
- 14.11.3. Technology
- 14.11.4. Measurement Parameter
- 14.11.5. Installation Type
- 14.11.6. Distribution Channel
- 14.11.7. End-Use Industry
- 14.12. Russia & CIS Process Instrumentation Market
- 14.12.1. Country Segmental Analysis
- 14.12.2. Instrument Type
- 14.12.3. Technology
- 14.12.4. Measurement Parameter
- 14.12.5. Installation Type
- 14.12.6. Distribution Channel
- 14.12.7. End-Use Industry
- 14.13. Rest of Europe Process Instrumentation Market
- 14.13.1. Country Segmental Analysis
- 14.13.2. Instrument Type
- 14.13.3. Technology
- 14.13.4. Measurement Parameter
- 14.13.5. Installation Type
- 14.13.6. Distribution Channel
- 14.13.7. End-Use Industry
- 15. Asia Pacific Process Instrumentation Market Analysis
- 15.1. Key Segment Analysis
- 15.2. Regional Snapshot
- 15.3. Asia Pacific Process Instrumentation Market Size Volume (Million units) and Value (US$ Bn), Analysis, and Forecasts, 2021-2035
- 15.3.1. Instrument Type
- 15.3.2. Technology
- 15.3.3. Measurement Parameter
- 15.3.4. Installation Type
- 15.3.5. Distribution Channel
- 15.3.6. End-Use Industry
- 15.3.7. Country
- 15.3.7.1. China
- 15.3.7.2. India
- 15.3.7.3. Japan
- 15.3.7.4. South Korea
- 15.3.7.5. Australia and New Zealand
- 15.3.7.6. Indonesia
- 15.3.7.7. Malaysia
- 15.3.7.8. Thailand
- 15.3.7.9. Vietnam
- 15.3.7.10. Rest of Asia Pacific
- 15.4. China Process Instrumentation Market
- 15.4.1. Country Segmental Analysis
- 15.4.2. Instrument Type
- 15.4.3. Technology
- 15.4.4. Measurement Parameter
- 15.4.5. Installation Type
- 15.4.6. Distribution Channel
- 15.4.7. End-Use Industry
- 15.5. India Process Instrumentation Market
- 15.5.1. Country Segmental Analysis
- 15.5.2. Instrument Type
- 15.5.3. Technology
- 15.5.4. Measurement Parameter
- 15.5.5. Installation Type
- 15.5.6. Distribution Channel
- 15.5.7. End-Use Industry
- 15.6. Japan Process Instrumentation Market
- 15.6.1. Country Segmental Analysis
- 15.6.2. Instrument Type
- 15.6.3. Technology
- 15.6.4. Measurement Parameter
- 15.6.5. Installation Type
- 15.6.6. Distribution Channel
- 15.6.7. End-Use Industry
- 15.7. South Korea Process Instrumentation Market
- 15.7.1. Country Segmental Analysis
- 15.7.2. Instrument Type
- 15.7.3. Technology
- 15.7.4. Measurement Parameter
- 15.7.5. Installation Type
- 15.7.6. Distribution Channel
- 15.7.7. End-Use Industry
- 15.8. Australia and New Zealand Process Instrumentation Market
- 15.8.1. Country Segmental Analysis
- 15.8.2. Instrument Type
- 15.8.3. Technology
- 15.8.4. Measurement Parameter
- 15.8.5. Installation Type
- 15.8.6. Distribution Channel
- 15.8.7. End-Use Industry
- 15.9. Indonesia Process Instrumentation Market
- 15.9.1. Country Segmental Analysis
- 15.9.2. Instrument Type
- 15.9.3. Technology
- 15.9.4. Measurement Parameter
- 15.9.5. Installation Type
- 15.9.6. Distribution Channel
- 15.9.7. End-Use Industry
- 15.10. Malaysia Process Instrumentation Market
- 15.10.1. Country Segmental Analysis
- 15.10.2. Instrument Type
- 15.10.3. Technology
- 15.10.4. Measurement Parameter
- 15.10.5. Installation Type
- 15.10.6. Distribution Channel
- 15.10.7. End-Use Industry
- 15.11. Thailand Process Instrumentation Market
- 15.11.1. Country Segmental Analysis
- 15.11.2. Instrument Type
- 15.11.3. Technology
- 15.11.4. Measurement Parameter
- 15.11.5. Installation Type
- 15.11.6. Distribution Channel
- 15.11.7. End-Use Industry
- 15.12. Vietnam Process Instrumentation Market
- 15.12.1. Country Segmental Analysis
- 15.12.2. Instrument Type
- 15.12.3. Technology
- 15.12.4. Measurement Parameter
- 15.12.5. Installation Type
- 15.12.6. Distribution Channel
- 15.12.7. End-Use Industry
- 15.13. Rest of Asia Pacific Process Instrumentation Market
- 15.13.1. Country Segmental Analysis
- 15.13.2. Instrument Type
- 15.13.3. Technology
- 15.13.4. Measurement Parameter
- 15.13.5. Installation Type
- 15.13.6. Distribution Channel
- 15.13.7. End-Use Industry
- 16. Middle East Process Instrumentation Market Analysis
- 16.1. Key Segment Analysis
- 16.2. Regional Snapshot
- 16.3. Middle East Process Instrumentation Market Size Volume (Million units) and Value (US$ Bn), Analysis, and Forecasts, 2021-2035
- 16.3.1. Instrument Type
- 16.3.2. Technology
- 16.3.3. Measurement Parameter
- 16.3.4. Installation Type
- 16.3.5. Distribution Channel
- 16.3.6. End-Use Industry
- 16.3.7. Country
- 16.3.7.1. Turkey
- 16.3.7.2. UAE
- 16.3.7.3. Saudi Arabia
- 16.3.7.4. Israel
- 16.3.7.5. Rest of Middle East
- 16.4. Turkey Process Instrumentation Market
- 16.4.1. Country Segmental Analysis
- 16.4.2. Instrument Type
- 16.4.3. Technology
- 16.4.4. Measurement Parameter
- 16.4.5. Installation Type
- 16.4.6. Distribution Channel
- 16.4.7. End-Use Industry
- 16.5. UAE Process Instrumentation Market
- 16.5.1. Country Segmental Analysis
- 16.5.2. Instrument Type
- 16.5.3. Technology
- 16.5.4. Measurement Parameter
- 16.5.5. Installation Type
- 16.5.6. Distribution Channel
- 16.5.7. End-Use Industry
- 16.6. Saudi Arabia Process Instrumentation Market
- 16.6.1. Country Segmental Analysis
- 16.6.2. Instrument Type
- 16.6.3. Technology
- 16.6.4. Measurement Parameter
- 16.6.5. Installation Type
- 16.6.6. Distribution Channel
- 16.6.7. End-Use Industry
- 16.7. Israel Process Instrumentation Market
- 16.7.1. Country Segmental Analysis
- 16.7.2. Instrument Type
- 16.7.3. Technology
- 16.7.4. Measurement Parameter
- 16.7.5. Installation Type
- 16.7.6. Distribution Channel
- 16.7.7. End-Use Industry
- 16.8. Rest of Middle East Process Instrumentation Market
- 16.8.1. Country Segmental Analysis
- 16.8.2. Instrument Type
- 16.8.3. Technology
- 16.8.4. Measurement Parameter
- 16.8.5. Installation Type
- 16.8.6. Distribution Channel
- 16.8.7. End-Use Industry
- 17. Africa Process Instrumentation Market Analysis
- 17.1. Key Segment Analysis
- 17.2. Regional Snapshot
- 17.3. Africa Process Instrumentation Market Size Volume (Million units) and Value (US$ Bn), Analysis, and Forecasts, 2021-2035
- 17.3.1. Instrument Type
- 17.3.2. Technology
- 17.3.3. Measurement Parameter
- 17.3.4. Installation Type
- 17.3.5. Distribution Channel
- 17.3.6. End-Use Industry
- 17.3.7. Country
- 17.3.7.1. South Africa
- 17.3.7.2. Egypt
- 17.3.7.3. Nigeria
- 17.3.7.4. Algeria
- 17.3.7.5. Rest of Africa
- 17.4. South Africa Process Instrumentation Market
- 17.4.1. Country Segmental Analysis
- 17.4.2. Instrument Type
- 17.4.3. Technology
- 17.4.4. Measurement Parameter
- 17.4.5. Installation Type
- 17.4.6. Distribution Channel
- 17.4.7. End-Use Industry
- 17.5. Egypt Process Instrumentation Market
- 17.5.1. Country Segmental Analysis
- 17.5.2. Instrument Type
- 17.5.3. Technology
- 17.5.4. Measurement Parameter
- 17.5.5. Installation Type
- 17.5.6. Distribution Channel
- 17.5.7. End-Use Industry
- 17.6. Nigeria Process Instrumentation Market
- 17.6.1. Country Segmental Analysis
- 17.6.2. Instrument Type
- 17.6.3. Technology
- 17.6.4. Measurement Parameter
- 17.6.5. Installation Type
- 17.6.6. Distribution Channel
- 17.6.7. End-Use Industry
- 17.7. Algeria Process Instrumentation Market
- 17.7.1. Country Segmental Analysis
- 17.7.2. Instrument Type
- 17.7.3. Technology
- 17.7.4. Measurement Parameter
- 17.7.5. Installation Type
- 17.7.6. Distribution Channel
- 17.7.7. End-Use Industry
- 17.8. Rest of Africa Process Instrumentation Market
- 17.8.1. Country Segmental Analysis
- 17.8.2. Instrument Type
- 17.8.3. Technology
- 17.8.4. Measurement Parameter
- 17.8.5. Installation Type
- 17.8.6. Distribution Channel
- 17.8.7. End-Use Industry
- 18. South America Process Instrumentation Market Analysis
- 18.1. Key Segment Analysis
- 18.2. Regional Snapshot
- 18.3. South America Process Instrumentation Market Size Volume (Million units) and Value (US$ Bn), Analysis, and Forecasts, 2021-2035
- 18.3.1. Instrument Type
- 18.3.2. Technology
- 18.3.3. Measurement Parameter
- 18.3.4. Installation Type
- 18.3.5. Distribution Channel
- 18.3.6. End-Use Industry
- 18.3.7. Country
- 18.3.7.1. Brazil
- 18.3.7.2. Argentina
- 18.3.7.3. Rest of South America
- 18.4. Brazil Process Instrumentation Market
- 18.4.1. Country Segmental Analysis
- 18.4.2. Instrument Type
- 18.4.3. Technology
- 18.4.4. Measurement Parameter
- 18.4.5. Installation Type
- 18.4.6. Distribution Channel
- 18.4.7. End-Use Industry
- 18.5. Argentina Process Instrumentation Market
- 18.5.1. Country Segmental Analysis
- 18.5.2. Instrument Type
- 18.5.3. Technology
- 18.5.4. Measurement Parameter
- 18.5.5. Installation Type
- 18.5.6. Distribution Channel
- 18.5.7. End-Use Industry
- 18.6. Rest of South America Process Instrumentation Market
- 18.6.1. Country Segmental Analysis
- 18.6.2. Instrument Type
- 18.6.3. Technology
- 18.6.4. Measurement Parameter
- 18.6.5. Installation Type
- 18.6.6. Distribution Channel
- 18.6.7. End-Use Industry
- 19. Key Players/ Company Profile
- 19.1. ABB Ltd.
- 19.1.1. Company Details/ Overview
- 19.1.2. Company Financials
- 19.1.3. Key Customers and Competitors
- 19.1.4. Business/ Industry Portfolio
- 19.1.5. Product Portfolio/ Specification Details
- 19.1.6. Pricing Data
- 19.1.7. Strategic Overview
- 19.1.8. Recent Developments
- 19.2. Azbil Corporation (Yamatake)
- 19.3. Badger Meter Inc.
- 19.4. Brooks Instrument
- 19.5. Burkert Fluid Control Systems
- 19.6. Dwyer Instruments Inc.
- 19.7. Emerson Electric Co.
- 19.8. Endress+Hauser Group
- 19.9. Fuji Electric Co. Ltd.
- 19.10. General Electric (GE)
- 19.11. Honeywell International Inc.
- 19.12. Keyence Corporation
- 19.13. KROHNE Group
- 19.14. Omega Engineering
- 19.15. Rockwell Automation Inc.
- 19.16. Schneider Electric SE
- 19.17. Siemens AG
- 19.18. VEGA Grieshaber KG
- 19.19. WIKA Instrument Corporation
- 19.20. Yokogawa Electric Corporation
- 19.21. Other Key Players
- 19.1. ABB Ltd.
Note* - This is just tentative list of players. While providing the report, we will cover more number of players based on their revenue and share for each geography
Research Design
Our research design integrates both demand-side and supply-side analysis through a balanced combination of primary and secondary research methodologies. By utilizing both bottom-up and top-down approaches alongside rigorous data triangulation methods, we deliver robust market intelligence that supports strategic decision-making.
MarketGenics' comprehensive research design framework ensures the delivery of accurate, reliable, and actionable market intelligence. Through the integration of multiple research approaches, rigorous validation processes, and expert analysis, we provide our clients with the insights needed to make informed strategic decisions and capitalize on market opportunities.

MarketGenics leverages a dedicated industry panel of experts and a comprehensive suite of paid databases to effectively collect, consolidate, and analyze market intelligence.
Our approach has consistently proven to be reliable and effective in generating accurate market insights, identifying key industry trends, and uncovering emerging business opportunities.
Through both primary and secondary research, we capture and analyze critical company-level data such as manufacturing footprints, including technical centers, R&D facilities, sales offices, and headquarters.
Our expert panel further enhances our ability to estimate market size for specific brands based on validated field-level intelligence.
Our data mining techniques incorporate both parametric and non-parametric methods, allowing for structured data collection, sorting, processing, and cleaning.
Demand projections are derived from large-scale data sets analyzed through proprietary algorithms, culminating in robust and reliable market sizing.
Research Approach
The bottom-up approach builds market estimates by starting with the smallest addressable market units and systematically aggregating them to create comprehensive market size projections.
This method begins with specific, granular data points and builds upward to create the complete market landscape.
Customer Analysis → Segmental Analysis → Geographical Analysis
The top-down approach starts with the broadest possible market data and systematically narrows it down through a series of filters and assumptions to arrive at specific market segments or opportunities.
This method begins with the big picture and works downward to increasingly specific market slices.
TAM → SAM → SOM


Research Methods
Desk / Secondary Research
While analysing the market, we extensively study secondary sources, directories, and databases to identify and collect information useful for this technical, market-oriented, and commercial report. Secondary sources that we utilize are not only the public sources, but it is a combination of Open Source, Associations, Paid Databases, MG Repository & Knowledgebase, and others.
- Company websites, annual reports, financial reports, broker reports, and investor presentations
- National government documents, statistical databases and reports
- News articles, press releases and web-casts specific to the companies operating in the market, Magazines, reports, and others
- We gather information from commercial data sources for deriving company specific data such as segmental revenue, share for geography, product revenue, and others
- Internal and external proprietary databases (industry-specific), relevant patent, and regulatory databases
- Governing Bodies, Government Organizations
- Relevant Authorities, Country-specific Associations for Industries
We also employ the model mapping approach to estimate the product level market data through the players' product portfolio
Primary Research
Primary research/ interviews is vital in analyzing the market. Most of the cases involves paid primary interviews. Primary sources include primary interviews through e-mail interactions, telephonic interviews, surveys as well as face-to-face interviews with the different stakeholders across the value chain including several industry experts.
| Type of Respondents | Number of Primaries |
|---|---|
| Tier 2/3 Suppliers | ~20 |
| Tier 1 Suppliers | ~25 |
| End-users | ~25 |
| Industry Expert/ Panel/ Consultant | ~30 |
| Total | ~100 |
MG Knowledgebase
• Repository of industry blog, newsletter and case studies
• Online platform covering detailed market reports, and company profiles
Forecasting Factors and Models
Forecasting Factors
- Historical Trends – Past market patterns, cycles, and major events that shaped how markets behave over time. Understanding past trends helps predict future behavior.
- Industry Factors – Specific characteristics of the industry like structure, regulations, and innovation cycles that affect market dynamics.
- Macroeconomic Factors – Economic conditions like GDP growth, inflation, and employment rates that affect how much money people have to spend.
- Demographic Factors – Population characteristics like age, income, and location that determine who can buy your product.
- Technology Factors – How quickly people adopt new technology and how much technology infrastructure exists.
- Regulatory Factors – Government rules, laws, and policies that can help or restrict market growth.
- Competitive Factors – Analyzing competition structure such as degree of competition and bargaining power of buyers and suppliers.
Forecasting Models / Techniques
Multiple Regression Analysis
- Identify and quantify factors that drive market changes
- Statistical modeling to establish relationships between market drivers and outcomes
Time Series Analysis – Seasonal Patterns
- Understand regular cyclical patterns in market demand
- Advanced statistical techniques to separate trend, seasonal, and irregular components
Time Series Analysis – Trend Analysis
- Identify underlying market growth patterns and momentum
- Statistical analysis of historical data to project future trends
Expert Opinion – Expert Interviews
- Gather deep industry insights and contextual understanding
- In-depth interviews with key industry stakeholders
Multi-Scenario Development
- Prepare for uncertainty by modeling different possible futures
- Creating optimistic, pessimistic, and most likely scenarios
Time Series Analysis – Moving Averages
- Sophisticated forecasting for complex time series data
- Auto-regressive integrated moving average models with seasonal components
Econometric Models
- Apply economic theory to market forecasting
- Sophisticated economic models that account for market interactions
Expert Opinion – Delphi Method
- Harness collective wisdom of industry experts
- Structured, multi-round expert consultation process
Monte Carlo Simulation
- Quantify uncertainty and probability distributions
- Thousands of simulations with varying input parameters
Research Analysis
Our research framework is built upon the fundamental principle of validating market intelligence from both demand and supply perspectives. This dual-sided approach ensures comprehensive market understanding and reduces the risk of single-source bias.
Demand-Side Analysis: We understand end-user/application behavior, preferences, and market needs along with the penetration of the product for specific application.
Supply-Side Analysis: We estimate overall market revenue, analyze the segmental share along with industry capacity, competitive landscape, and market structure.
Validation & Evaluation
Data triangulation is a validation technique that uses multiple methods, sources, or perspectives to examine the same research question, thereby increasing the credibility and reliability of research findings. In market research, triangulation serves as a quality assurance mechanism that helps identify and minimize bias, validate assumptions, and ensure accuracy in market estimates.
- Data Source Triangulation – Using multiple data sources to examine the same phenomenon
- Methodological Triangulation – Using multiple research methods to study the same research question
- Investigator Triangulation – Using multiple researchers or analysts to examine the same data
- Theoretical Triangulation – Using multiple theoretical perspectives to interpret the same data

Custom Market Research Services
We will customise the research for you, in case the report listed above does not meet your requirements.
Get 10% Free Customisation