Remote Asset Monitoring Market Size, Share & Trends Analysis Report by Asset Type (Fixed Assets, Mobile Assets), Component, Technology, Connectivity, End-users, and Geography (North America, Europe, Asia Pacific, Middle East, Africa, and South America) – Global Industry Data, Trends, and Forecasts, 2026–2035
Market Overview:
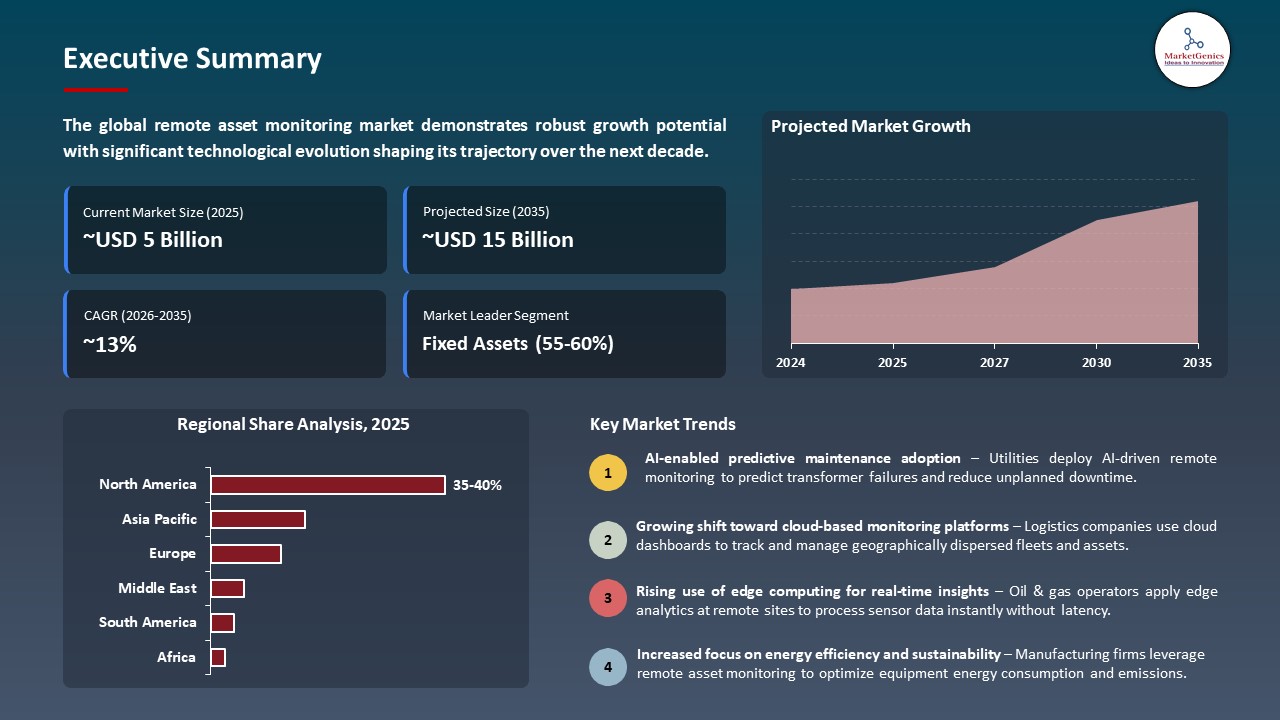
According to MarketGenics analysis only, the global remote asset monitoring market is witnessing strong growth, with an estimated valuation of USD 4.6 billion in 2025 and projected to reach USD 15.1 billion by 2035, registering a CAGR of 12.6% during the forecast period.
|
|
|
Segmental Data Insights |
|
|
Demand Trends |
|
|
Competitive Landscape |
|
|
Strategic Development |
|
|
Future Outlook & Opportunities |
|
Remote Asset Monitoring Market Size, Share, and Growth
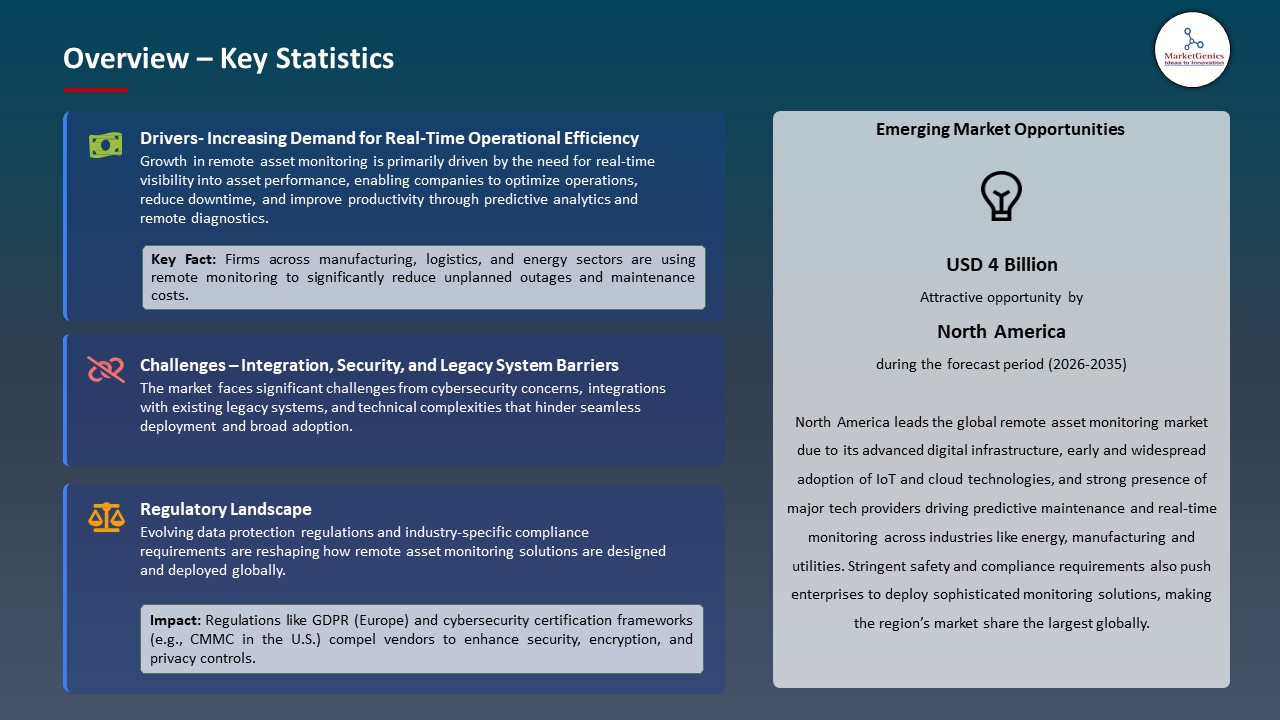
The demand for the remote-asset-monitoring-market is driven by the growing need for real-time asset visibility, predictive maintenance, and operational cost reduction, supported by rising adoption of IoT, cloud platforms, and advanced analytics across industries to improve efficiency, uptime, and decision-making.
The innovative platform integrates, organizes, and visualizes data from various sources to accelerate analytics processes and digitalize utility grid data into actionable, real-time business and operational insights. It can run a variety of applications, including those from both Honeywell and third-party partners such as SparkMeter.
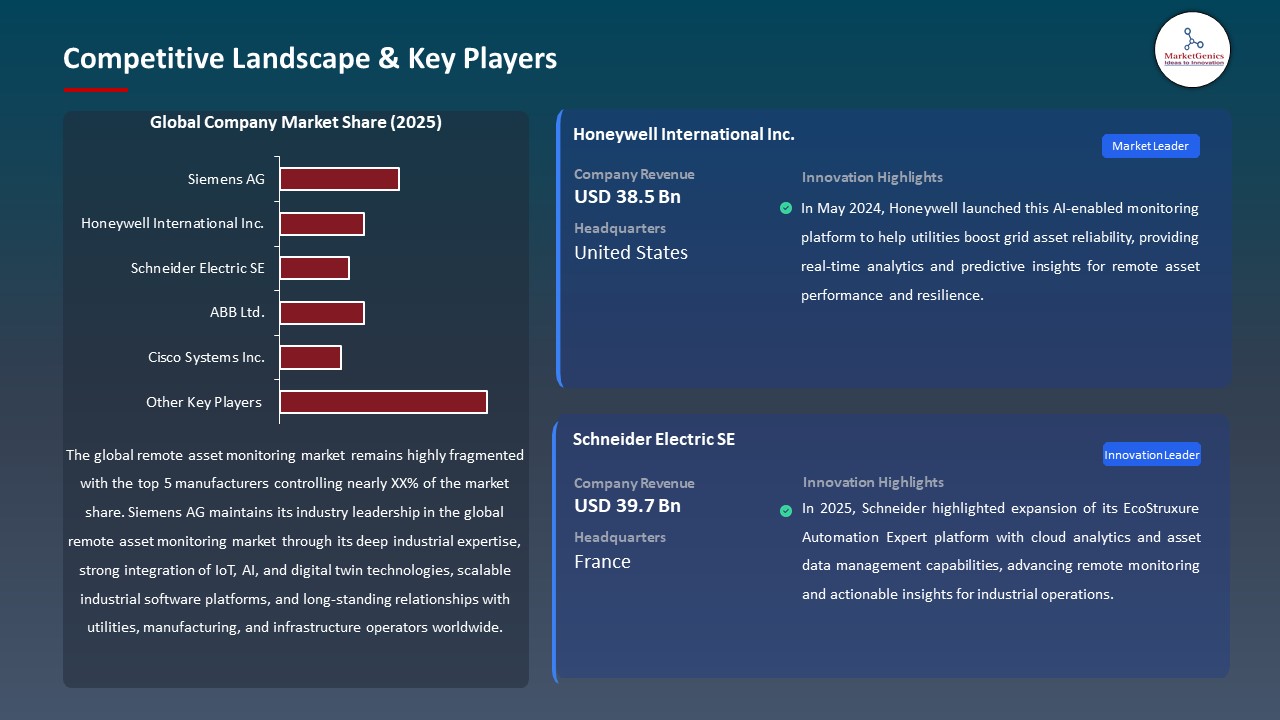
The remote asset monitoring market is primarily propelled by the growing use of IoT-enabled and cloud-based solutions that enable real-time asset monitoring and state-of-the-art predictive analytics which help organizations to improve operational efficiency, optimize asset utilization, and minimize unexpected downtimes across various industry sectors. For instance, in May 2024, Honeywell launched its Honeywell Forge Performance+ to Utilities, an AI-powered platform that harnesses the power of AI, machine learning and remote monitoring to enable utility companies to monitor grid assets and draw near-real-time insights, the utilities that were launched have the power of AI. This driver increases the rate of market expansion by making it possible to predict the assets management, minimize operational risks, and decrease the costs of maintaining the lifecycle.
Additionally, the growing demand for integrated, cloud-based remote monitoring solutions is driving the market by enabling continuous, location-independent management and control of geographically distributed assets. For instance, the Remote Building Manager (RBM) cloud software created by Honeywell will give a safe remote access and control of building management systems, including portfolios of sites so organizations can centralize the operational data of remote assets. This driver enhances centralized asset control, enhances operational responsiveness as well as facilitating scalable management of distributed asset networks.
Key opportunities adjacent to the global remote asset monitoring market include industrial IoT platforms, predictive maintenance services, smart grid management, condition-based monitoring solutions, and cloud-based asset analytics, all enabling enhanced operational efficiency, data-driven decision-making, and real-time insights. These adjacent markets increase revenue base and speed up integrated monitoring ecosystem adoption in industries.
Remote Asset Monitoring Market Dynamics and Trends
Driver: Rising Adoption of Industrial IoT for Real-Time Asset Performance Monitoring
-
The growing integration of Industrial Internet of Things (IIoT) technologies is driving the remote asset monitoring market by enabling continuous, real-time visibility into asset performance, operational health, and maintenance needs, allowing organizations to respond proactively to potential issues before they escalate into costly failures.
- The scalability, interoperability and integration capabilities of the platform with existing enterprise systems in various industrial assets is further boost to the adoption of the technology among both large and mid-sized businesses that need smarter, connected operations. For instance, the MindSphere IoT platform is a Siemens digital platform that allows industrial operators to integrate machines, gather and process data on the real-time operations of machines, and adopt predictive approaches to maintenance. The ability facilitates better up time, efficient resource use, less risk in operations, and informed decision making in manufacturing, energy, transportation, and logistics industries.
- IIoT-enabled remote monitoring is increasing operational efficiency, lowering maintenance expenses, helping to aid sustainability, and fast tracking the pace of market expansion through more proactive, smart, and automated asset management.
Restraint: High Initial Investment and Implementation Costs for Remote Monitoring Solutions
-
The significant upfront costs of deploying IoT sensors, edge devices, cloud platforms, and the required integration services continue to impede adoption, especially among small and mid-sized businesses with constrained capital budgets, despite the obvious operational and efficiency benefits of remote asset monitoring.
- The cost of purchasing the hardware, software, network connectivity, and training employees can be heavy, typically postponing deployment or constraining it. This is further compounded by the maintenance and cybersecurity requirements that are necessary and represent an addition to total ownership expenses. As a result, organizations can delay the process of modernization, reducing the scalability of remote monitoring systems and slowing down the market growth.
- Initial and continuing high cost limits its application in cost-sensitive industries, with relatively damping short-term growth but long-term demand is high based on efficiency in operations and predictive maintenance value.
Opportunity: Expansion of AI‑Enhanced IoT Monitoring for Asset Reliability
-
The trend of artificial intelligence (AI) and machine learning (ML) combined with IoT monitoring systems is a massive expansion potential in the remote asset monitoring market. Through real-time data acquisition, integrated with smart analytics, organizations would be able to have high-level anomaly detection, predictive maintenance, and autonomous decision-making and minimize unplanned downtime and increase asset life.
- For instance, the AI-driven monitoring functions at IBM Maximo currently enable tracking of the condition in near-real time and making predictive recommendations to help businesses anticipate possible equipment breakdowns, optimize the maintenance process, and increase the overall uptime of their assets in a more cost-effective manner than traditional monitoring methods. The solution will also permit centralized monitoring of geographically distributed assets and improve operational visibility as well as proactive data-driven decision-making.
- AI-based IoT monitoring spurs more operational efficiency, less maintenance, and new monetization possibilities around services, which enables the overall value order of remote asset monitoring solutions.
Key Trend: Convergence of Edge Computing with Remote Asset Monitoring
-
The increasing use of edge computing in remote asset monitoring is major trend in the industry, where data is computed nearer to the source instead of just depending on centralized cloud computing. With analysis of assets at the edge, organizations are able to lower latency, lower bandwidth expenses, and speed up operations decision-making.
- Many industrial IoT frameworks are now integrating edge analytics into their remote monitoring systems to allow real-time notifications, autonomous reaction to anomalies, and more timely corrective measures, and are no longer reliant on the cloud. This method is especially useful in high-stress conditions like offshore plants, energy systems, transportation systems and other remote infrastructure, where real-time information is critically needed to keep operations on track and safe.
- Distributed intelligence also supports more resilient and scalable monitoring architectures across diverse industrial landscapes.
- The integration of edge computing and remote asset monitoring leads to the improvement of responsiveness, reliability, and scalability of the system and provides an opportunity to conduct industrial processes much faster, smarter, and autonomously.
Remote-Asset-Monitoring-Market Analysis and Segmental Data
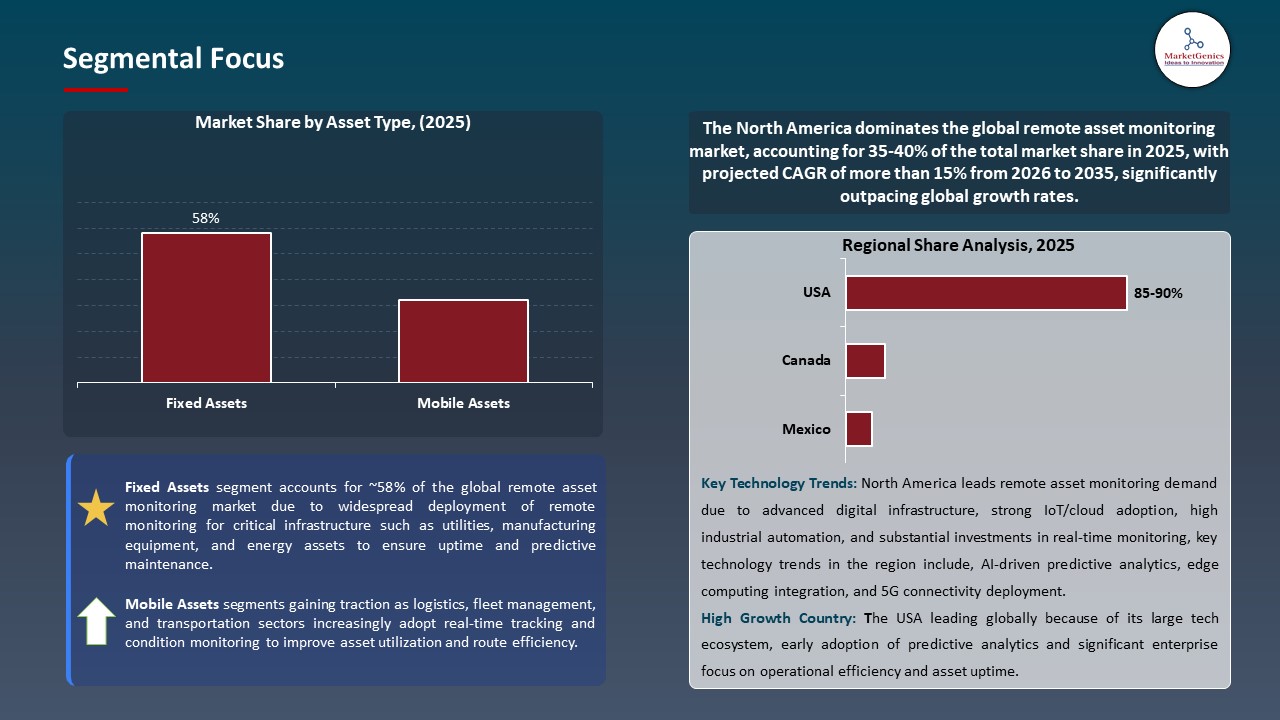
Fixed Assets Dominate Global Remote Asset Monitoring Market
-
The fixed assets segment dominates the global remote asset monitoring market, which its organization focuses on the value of the long-term physical infrastructure such as industrial machine and production equipment, power plants, and transmission lines whose constant supervision is necessary to maximize their performance and minimize expensive unexpected failures. This is motivating the massive implementation of new sophisticated monitoring systems to improve efficiency and operational reliability.
- For instance, Remote Asset Monitoring service of Cat generators offered by Avesco, which provides the opportunity to monitor fixed power generation assets at several locations in real-time. The platform offers data performance and alerts, which enables the maintenance teams to address problems in advance, optimize the uptime, and extend the fixed asset life, thus depicting the strategic value of monitoring fixed assets in the industrial operations.
- Emphasis on the fixed assets increases reliability, minimizes downtime and increases the life cycle of critical investments in infrastructure and industrial investments.
North America Leads Global Remote Asset Monitoring Market Demand
-
North America leads the remote asset monitoring market is driven by the use of IoT and cloud-based remote asset monitoring systems in manufacturing, energy, utilities, and transportation sectors which are leading to real-time operational visibility and predictive maintenance. For instance, the Connected Operations Cloud offered by Samsara, which is very popular among enterprises in North America to track equipment fleets and distributed industrial property in real time to enhance safety and efficiency.
- Moreover, strong investments in smart infrastructure and digital transformation projects in the United States and Canada are causing the remote asset monitoring market, as remote monitoring systems are already being implemented in industries. For instance, the IoT asset tracking solutions provided by Powerfleet are implemented in any industry to track high-value fixed and mobile assets and improve visibility and usage.
- These drivers are establishing North America as a global leader in remote asset monitoring, enhancing the efficiency of operational activities, transforming them into predictive maintenance, and accelerating the adoption of advanced monitoring technologies across various industrial sectors.
Remote-Asset-Monitoring-Market Ecosystem
The global remote asset monitoring market is highly fragmented, with leading players such as Siemens AG, Honeywell International Inc., Schneider Electric SE, ABB Ltd., and Cisco Systems Inc. dominating through advanced IoT, AI, and cloud-enabled solutions that provide real‑time visibility and predictive insights across industries. These players leverage technological expertise and global networks to maintain a competitive edge.
Key companies increasingly focus on specialized solutions, such as Siemens’ industrial IoT platforms, Honeywell’s Forge analytics suites, Schneider Electric’s EcoStruxure ecosystems, ABB’s energy and infrastructure monitoring solutions, and Cisco’s secure connectivity frameworks, fostering innovation in asset performance optimization.
Additionally, there are government agencies, institutions of higher learning, and research and development institutions. For instance, Microsoft and Schneider Electric partnered in March 2025 to unify Azure IoT and EcoStruxure to boost predictive maintenance and real-time monitoring of industrial assets, an example of innovation in the industry on a public-private basis. This team-up resulted in a substantial enhancement of operating efficiency, a decrease in unplanned downtimes, and the ability to make more decisions based on data in multi-sited industrial processes.
Recent Development and Strategic Overview:
-
In January 2025, Honeywell announced the availability of updated secure communication and monitoring solutions, SMX 203.2 and GARD 203.3, designed to strengthen cybersecurity and remote asset connectivity for industrial control systems, thereby enhancing secure remote diagnostics, system integrity, and overall operational visibility.
- In 2025, ABB has enhanced its cloud-based ABB Ability Energy and Asset Manager platform to enable real-time remote monitoring and analytics of electrical and energy assets across multiple locations through a consolidated, unified dashboard.
Report Scope
|
Detail |
|
|
Market Size in 2025 |
USD 4.6 Bn |
|
Market Forecast Value in 2035 |
USD 15.1 Bn |
|
Growth Rate (CAGR) |
12.6% |
|
Forecast Period |
2026 – 2035 |
|
Historical Data Available for |
2021 – 2024 |
|
Market Size Units |
US$ Billion for Value |
|
Report Format |
Electronic (PDF) + Excel |
|
North America |
Europe |
Asia Pacific |
Middle East |
Africa |
South America |
|
|
|
|
|
|
|
Companies Covered |
|||||
|
|
|
|
|
|
Remote-Asset-Monitoring-Market Segmentation and Highlights
|
Segment |
Sub-segment |
|
Remote Asset Monitoring Market, By Asset Type |
|
|
Remote Asset Monitoring Market, By Component |
|
|
Remote Asset Monitoring Market, By Technology |
|
|
Remote Asset Monitoring Market, By Connectivity |
|
|
Remote Asset Monitoring Market, By End-users |
|
Frequently Asked Questions
Table of Contents
- 1. Research Methodology and Assumptions
- 1.1. Definitions
- 1.2. Research Design and Approach
- 1.3. Data Collection Methods
- 1.4. Base Estimates and Calculations
- 1.5. Forecasting Models
- 1.5.1. Key Forecast Factors & Impact Analysis
- 1.6. Secondary Research
- 1.6.1. Open Sources
- 1.6.2. Paid Databases
- 1.6.3. Associations
- 1.7. Primary Research
- 1.7.1. Primary Sources
- 1.7.2. Primary Interviews with Stakeholders across Ecosystem
- 2. Executive Summary
- 2.1. Global Remote Asset Monitoring Market Outlook
- 2.1.1. Remote Asset Monitoring Market Size (Value - US$ Bn), and Forecasts, 2021-2035
- 2.1.2. Compounded Annual Growth Rate Analysis
- 2.1.3. Growth Opportunity Analysis
- 2.1.4. Segmental Share Analysis
- 2.1.5. Geographical Share Analysis
- 2.2. Market Analysis and Facts
- 2.3. Supply-Demand Analysis
- 2.4. Competitive Benchmarking
- 2.5. Go-to- Market Strategy
- 2.5.1. Customer/ End-use Industry Assessment
- 2.5.2. Growth Opportunity Data, 2026-2035
- 2.5.2.1. Regional Data
- 2.5.2.2. Country Data
- 2.5.2.3. Segmental Data
- 2.5.3. Identification of Potential Market Spaces
- 2.5.4. GAP Analysis
- 2.5.5. Potential Attractive Price Points
- 2.5.6. Prevailing Market Risks & Challenges
- 2.5.7. Preferred Sales & Marketing Strategies
- 2.5.8. Key Recommendations and Analysis
- 2.5.9. A Way Forward
- 2.1. Global Remote Asset Monitoring Market Outlook
- 3. Industry Data and Premium Insights
- 3.1. Global Automation & Process Control Industry Overview, 2025
- 3.1.1. Automation & Process Control Industry Ecosystem Analysis
- 3.1.2. Key Trends for Automation & Process Control Industry
- 3.1.3. Regional Distribution for Automation & Process Control Industry
- 3.2. Supplier Customer Data
- 3.3. Technology Roadmap and Developments
- 3.4. Trade Analysis
- 3.4.1. Import & Export Analysis, 2025
- 3.4.2. Top Importing Countries
- 3.4.3. Top Exporting Countries
- 3.5. Trump Tariff Impact Analysis
- 3.5.1. Manufacturer
- 3.5.1.1. Based on the component & Raw material
- 3.5.2. Supply Chain
- 3.5.3. End Consumer
- 3.5.1. Manufacturer
- 3.6. Raw Material Analysis
- 3.1. Global Automation & Process Control Industry Overview, 2025
- 4. Market Overview
- 4.1. Market Dynamics
- 4.1.1. Drivers
- 4.1.1.1. Increasing adoption of IoT, sensors, and cloud-based monitoring platforms
- 4.1.1.2. Rising demand for predictive maintenance and operational cost optimization
- 4.1.1.3. Growth of industrial automation and remote infrastructure management
- 4.1.2. Restraints
- 4.1.2.1. High initial deployment and system integration costs
- 4.1.2.2. Data security, privacy, and cybersecurity concerns
- 4.1.1. Drivers
- 4.2. Key Trend Analysis
- 4.3. Regulatory Framework
- 4.3.1. Key Regulations, Norms, and Subsidies, by Key Countries
- 4.3.2. Tariffs and Standards
- 4.3.3. Impact Analysis of Regulations on the Market
- 4.4. Ecosystem/ Value Chain Analysis
- 4.5. Porter’s Five Forces Analysis
- 4.6. PESTEL Analysis
- 4.7. Global Remote Asset Monitoring Market Demand
- 4.7.1. Historical Market Size – Value (US$ Bn), 2020-2024
- 4.7.2. Current and Future Market Size – Value (US$ Bn), 2026–2035
- 4.7.2.1. Y-o-Y Growth Trends
- 4.7.2.2. Absolute $ Opportunity Assessment
- 4.1. Market Dynamics
- 5. Competition Landscape
- 5.1. Competition structure
- 5.1.1. Fragmented v/s consolidated
- 5.2. Company Share Analysis, 2025
- 5.2.1. Global Company Market Share
- 5.2.2. By Region
- 5.2.2.1. North America
- 5.2.2.2. Europe
- 5.2.2.3. Asia Pacific
- 5.2.2.4. Middle East
- 5.2.2.5. Africa
- 5.2.2.6. South America
- 5.3. Product Comparison Matrix
- 5.3.1. Specifications
- 5.3.2. Market Positioning
- 5.3.3. Pricing
- 5.1. Competition structure
- 6. Global Remote Asset Monitoring Market Analysis, by Asset Type
- 6.1. Key Segment Analysis
- 6.2. Remote Asset Monitoring Market Size (Value - US$ Bn), Analysis, and Forecasts, by Asset Type, 2021-2035
- 6.2.1. Fixed Assets
- 6.2.1.1. Buildings and Facilities
- 6.2.1.2. Manufacturing Equipment
- 6.2.1.3. Infrastructure
- 6.2.1.4. Storage Tanks
- 6.2.1.5. Pipelines
- 6.2.1.6. Others
- 6.2.2. Mobile Assets
- 6.2.2.1. Vehicles and Fleet
- 6.2.2.2. Containers
- 6.2.2.3. Portable Equipment
- 6.2.2.4. Heavy Machinery
- 6.2.2.5. Others
- 6.2.1. Fixed Assets
- 7. Global Remote Asset Monitoring Market Analysis, by Component
- 7.1. Key Segment Analysis
- 7.2. Remote Asset Monitoring Market Size (Value - US$ Bn), Analysis, and Forecasts, by Component, 2021-2035
- 7.2.1. Hardware
- 7.2.1.1. Sensors
- 7.2.1.1.1. Temperature Sensors
- 7.2.1.1.2. Pressure Sensors
- 7.2.1.1.3. Vibration Sensors
- 7.2.1.1.4. Flow Sensors
- 7.2.1.1.5. Level Sensors
- 7.2.1.1.6. Others
- 7.2.1.2. Controllers & Processors
- 7.2.1.3. Communication Modules
- 7.2.1.4. Data Acquisition Systems
- 7.2.1.5. Power Supply Units
- 7.2.1.1. Sensors
- 7.2.2. Software
- 7.2.2.1. On-Premise
- 7.2.2.2. Cloud-Based
- 7.2.3. Services
- 7.2.3.1. Professional Services
- 7.2.3.1.1. Consulting
- 7.2.3.1.2. Integration and Deployment
- 7.2.3.1.3. Support and Maintenance
- 7.2.3.2. Managed Services
- 7.2.3.1. Professional Services
- 7.2.1. Hardware
- 8. Global Remote Asset Monitoring Market Analysis, by Technology
- 8.1. Key Segment Analysis
- 8.2. Remote Asset Monitoring Market Size (Value - US$ Bn), Analysis, and Forecasts, by Technology, 2021-2035
- 8.2.1. IoT-Based Monitoring
- 8.2.2. SCADA Systems
- 8.2.3. GPS/GNSS Tracking
- 8.2.4. RFID Technology
- 8.2.5. Satellite Communication
- 8.2.6. Cellular Communication
- 8.2.6.1. 2G/3G
- 8.2.6.2. 4G LTE
- 8.2.6.3. 5G
- 8.2.7. LPWAN (Low Power Wide Area Network)
- 8.2.7.1. LoRaWAN
- 8.2.7.2. NB-IoT
- 8.2.7.3. Sigfox
- 9. Global Remote Asset Monitoring Market Analysis, by Connectivity
- 9.1. Key Segment Analysis
- 9.2. Remote Asset Monitoring Market Size (Value - US$ Bn), Analysis, and Forecasts, by Connectivity, 2021-2035
- 9.2.1. Wired
- 9.2.1.1. Ethernet
- 9.2.1.2. Serial Communication
- 9.2.1.3. Fieldbus
- 9.2.1.4. Others
- 9.2.2. Wireless
- 9.2.2.1. Wi-Fi
- 9.2.2.2. Bluetooth
- 9.2.2.3. Zigbee
- 9.2.2.4. Cellular
- 9.2.2.5. Satellite
- 9.2.2.6. Others
- 9.2.1. Wired
- 10. Global Remote Asset Monitoring Market Analysis, by End-users
- 10.1. Key Segment Analysis
- 10.2. Remote Asset Monitoring Market Size (Value - US$ Bn), Analysis, and Forecasts, by End-users, 2021-2035
- 10.2.1. Manufacturing
- 10.2.2. Oil & Gas
- 10.2.3. Transportation & Logistics
- 10.2.4. Energy & Utilities
- 10.2.5. Healthcare
- 10.2.6. Construction & Mining
- 10.2.7. Agriculture
- 10.2.8. Retail & Warehousing
- 10.2.9. Aerospace & Defense
- 10.2.10. Marine & Shipping
- 10.2.11. Telecommunications
- 10.2.12. Government & Public Sector
- 10.2.13. Others
- 11. Global Remote Asset Monitoring Market Analysis and Forecasts, by Region
- 11.1. Key Findings
- 11.2. Remote Asset Monitoring Market Size (Value - US$ Bn), Analysis, and Forecasts, by Region, 2021-2035
- 11.2.1. North America
- 11.2.2. Europe
- 11.2.3. Asia Pacific
- 11.2.4. Middle East
- 11.2.5. Africa
- 11.2.6. South America
- 12. North America Remote Asset Monitoring Market Analysis
- 12.1. Key Segment Analysis
- 12.2. Regional Snapshot
- 12.3. North America Remote Asset Monitoring Market Size (Value - US$ Bn), Analysis, and Forecasts, 2021-2035
- 12.3.1. Asset Type
- 12.3.2. Component
- 12.3.3. Technology
- 12.3.4. Connectivity
- 12.3.5. End-users
- 12.3.6. Country
- 12.3.6.1. USA
- 12.3.6.2. Canada
- 12.3.6.3. Mexico
- 12.4. USA Remote Asset Monitoring Market
- 12.4.1. Country Segmental Analysis
- 12.4.2. Asset Type
- 12.4.3. Component
- 12.4.4. Technology
- 12.4.5. Connectivity
- 12.4.6. End-users
- 12.5. Canada Remote Asset Monitoring Market
- 12.5.1. Country Segmental Analysis
- 12.5.2. Asset Type
- 12.5.3. Component
- 12.5.4. Technology
- 12.5.5. Connectivity
- 12.5.6. End-users
- 12.6. Mexico Remote Asset Monitoring Market
- 12.6.1. Country Segmental Analysis
- 12.6.2. Asset Type
- 12.6.3. Component
- 12.6.4. Technology
- 12.6.5. Connectivity
- 12.6.6. End-users
- 13. Europe Remote Asset Monitoring Market Analysis
- 13.1. Key Segment Analysis
- 13.2. Regional Snapshot
- 13.3. Europe Remote Asset Monitoring Market Size (Value - US$ Bn), Analysis, and Forecasts, 2021-2035
- 13.3.1. Asset Type
- 13.3.2. Component
- 13.3.3. Technology
- 13.3.4. Connectivity
- 13.3.5. End-users
- 13.3.6. Country
- 13.3.6.1. Germany
- 13.3.6.2. United Kingdom
- 13.3.6.3. France
- 13.3.6.4. Italy
- 13.3.6.5. Spain
- 13.3.6.6. Netherlands
- 13.3.6.7. Nordic Countries
- 13.3.6.8. Poland
- 13.3.6.9. Russia & CIS
- 13.3.6.10. Rest of Europe
- 13.4. Germany Remote Asset Monitoring Market
- 13.4.1. Country Segmental Analysis
- 13.4.2. Asset Type
- 13.4.3. Component
- 13.4.4. Technology
- 13.4.5. Connectivity
- 13.4.6. End-users
- 13.5. United Kingdom Remote Asset Monitoring Market
- 13.5.1. Country Segmental Analysis
- 13.5.2. Asset Type
- 13.5.3. Component
- 13.5.4. Technology
- 13.5.5. Connectivity
- 13.5.6. End-users
- 13.6. France Remote Asset Monitoring Market
- 13.6.1. Country Segmental Analysis
- 13.6.2. Asset Type
- 13.6.3. Component
- 13.6.4. Technology
- 13.6.5. Connectivity
- 13.6.6. End-users
- 13.7. Italy Remote Asset Monitoring Market
- 13.7.1. Country Segmental Analysis
- 13.7.2. Asset Type
- 13.7.3. Component
- 13.7.4. Technology
- 13.7.5. Connectivity
- 13.7.6. End-users
- 13.8. Spain Remote Asset Monitoring Market
- 13.8.1. Country Segmental Analysis
- 13.8.2. Asset Type
- 13.8.3. Component
- 13.8.4. Technology
- 13.8.5. Connectivity
- 13.8.6. End-users
- 13.9. Netherlands Remote Asset Monitoring Market
- 13.9.1. Country Segmental Analysis
- 13.9.2. Asset Type
- 13.9.3. Component
- 13.9.4. Technology
- 13.9.5. Connectivity
- 13.9.6. End-users
- 13.10. Nordic Countries Remote Asset Monitoring Market
- 13.10.1. Country Segmental Analysis
- 13.10.2. Asset Type
- 13.10.3. Component
- 13.10.4. Technology
- 13.10.5. Connectivity
- 13.10.6. End-users
- 13.11. Poland Remote Asset Monitoring Market
- 13.11.1. Country Segmental Analysis
- 13.11.2. Asset Type
- 13.11.3. Component
- 13.11.4. Technology
- 13.11.5. Connectivity
- 13.11.6. End-users
- 13.12. Russia & CIS Remote Asset Monitoring Market
- 13.12.1. Country Segmental Analysis
- 13.12.2. Asset Type
- 13.12.3. Component
- 13.12.4. Technology
- 13.12.5. Connectivity
- 13.12.6. End-users
- 13.13. Rest of Europe Remote Asset Monitoring Market
- 13.13.1. Country Segmental Analysis
- 13.13.2. Asset Type
- 13.13.3. Component
- 13.13.4. Technology
- 13.13.5. Connectivity
- 13.13.6. End-users
- 14. Asia Pacific Remote Asset Monitoring Market Analysis
- 14.1. Key Segment Analysis
- 14.2. Regional Snapshot
- 14.3. Asia Pacific Remote Asset Monitoring Market Size (Value - US$ Bn), Analysis, and Forecasts, 2021-2035
- 14.3.1. Asset Type
- 14.3.2. Component
- 14.3.3. Technology
- 14.3.4. Connectivity
- 14.3.5. End-users
- 14.3.6. Country
- 14.3.6.1. China
- 14.3.6.2. India
- 14.3.6.3. Japan
- 14.3.6.4. South Korea
- 14.3.6.5. Australia and New Zealand
- 14.3.6.6. Indonesia
- 14.3.6.7. Malaysia
- 14.3.6.8. Thailand
- 14.3.6.9. Vietnam
- 14.3.6.10. Rest of Asia Pacific
- 14.4. China Remote Asset Monitoring Market
- 14.4.1. Country Segmental Analysis
- 14.4.2. Asset Type
- 14.4.3. Component
- 14.4.4. Technology
- 14.4.5. Connectivity
- 14.4.6. End-users
- 14.5. India Remote Asset Monitoring Market
- 14.5.1. Country Segmental Analysis
- 14.5.2. Asset Type
- 14.5.3. Component
- 14.5.4. Technology
- 14.5.5. Connectivity
- 14.5.6. End-users
- 14.6. Japan Remote Asset Monitoring Market
- 14.6.1. Country Segmental Analysis
- 14.6.2. Asset Type
- 14.6.3. Component
- 14.6.4. Technology
- 14.6.5. Connectivity
- 14.6.6. End-users
- 14.7. South Korea Remote Asset Monitoring Market
- 14.7.1. Country Segmental Analysis
- 14.7.2. Asset Type
- 14.7.3. Component
- 14.7.4. Technology
- 14.7.5. Connectivity
- 14.7.6. End-users
- 14.8. Australia and New Zealand Remote Asset Monitoring Market
- 14.8.1. Country Segmental Analysis
- 14.8.2. Asset Type
- 14.8.3. Component
- 14.8.4. Technology
- 14.8.5. Connectivity
- 14.8.6. End-users
- 14.9. Indonesia Remote Asset Monitoring Market
- 14.9.1. Country Segmental Analysis
- 14.9.2. Asset Type
- 14.9.3. Component
- 14.9.4. Technology
- 14.9.5. Connectivity
- 14.9.6. End-users
- 14.10. Malaysia Remote Asset Monitoring Market
- 14.10.1. Country Segmental Analysis
- 14.10.2. Asset Type
- 14.10.3. Component
- 14.10.4. Technology
- 14.10.5. Connectivity
- 14.10.6. End-users
- 14.11. Thailand Remote Asset Monitoring Market
- 14.11.1. Country Segmental Analysis
- 14.11.2. Asset Type
- 14.11.3. Component
- 14.11.4. Technology
- 14.11.5. Connectivity
- 14.11.6. End-users
- 14.12. Vietnam Remote Asset Monitoring Market
- 14.12.1. Country Segmental Analysis
- 14.12.2. Asset Type
- 14.12.3. Component
- 14.12.4. Technology
- 14.12.5. Connectivity
- 14.12.6. End-users
- 14.13. Rest of Asia Pacific Remote Asset Monitoring Market
- 14.13.1. Country Segmental Analysis
- 14.13.2. Asset Type
- 14.13.3. Component
- 14.13.4. Technology
- 14.13.5. Connectivity
- 14.13.6. End-users
- 15. Middle East Remote Asset Monitoring Market Analysis
- 15.1. Key Segment Analysis
- 15.2. Regional Snapshot
- 15.3. Middle East Remote Asset Monitoring Market Size (Value - US$ Bn), Analysis, and Forecasts, 2021-2035
- 15.3.1. Asset Type
- 15.3.2. Component
- 15.3.3. Technology
- 15.3.4. Connectivity
- 15.3.5. End-users
- 15.3.6. Country
- 15.3.6.1. Turkey
- 15.3.6.2. UAE
- 15.3.6.3. Saudi Arabia
- 15.3.6.4. Israel
- 15.3.6.5. Rest of Middle East
- 15.4. Turkey Remote Asset Monitoring Market
- 15.4.1. Country Segmental Analysis
- 15.4.2. Asset Type
- 15.4.3. Component
- 15.4.4. Technology
- 15.4.5. Connectivity
- 15.4.6. End-users
- 15.5. UAE Remote Asset Monitoring Market
- 15.5.1. Country Segmental Analysis
- 15.5.2. Asset Type
- 15.5.3. Component
- 15.5.4. Technology
- 15.5.5. Connectivity
- 15.5.6. End-users
- 15.6. Saudi Arabia Remote Asset Monitoring Market
- 15.6.1. Country Segmental Analysis
- 15.6.2. Asset Type
- 15.6.3. Component
- 15.6.4. Technology
- 15.6.5. Connectivity
- 15.6.6. End-users
- 15.7. Israel Remote Asset Monitoring Market
- 15.7.1. Country Segmental Analysis
- 15.7.2. Asset Type
- 15.7.3. Component
- 15.7.4. Technology
- 15.7.5. Connectivity
- 15.7.6. End-users
- 15.8. Rest of Middle East Remote Asset Monitoring Market
- 15.8.1. Country Segmental Analysis
- 15.8.2. Asset Type
- 15.8.3. Component
- 15.8.4. Technology
- 15.8.5. Connectivity
- 15.8.6. End-users
- 16. Africa Remote Asset Monitoring Market Analysis
- 16.1. Key Segment Analysis
- 16.2. Regional Snapshot
- 16.3. Africa Remote Asset Monitoring Market Size (Value - US$ Bn), Analysis, and Forecasts, 2021-2035
- 16.3.1. Asset Type
- 16.3.2. Component
- 16.3.3. Technology
- 16.3.4. Connectivity
- 16.3.5. End-users
- 16.3.6. Country
- 16.3.6.1. South Africa
- 16.3.6.2. Egypt
- 16.3.6.3. Nigeria
- 16.3.6.4. Algeria
- 16.3.6.5. Rest of Africa
- 16.4. South Africa Remote Asset Monitoring Market
- 16.4.1. Country Segmental Analysis
- 16.4.2. Asset Type
- 16.4.3. Component
- 16.4.4. Technology
- 16.4.5. Connectivity
- 16.4.6. End-users
- 16.5. Egypt Remote Asset Monitoring Market
- 16.5.1. Country Segmental Analysis
- 16.5.2. Asset Type
- 16.5.3. Component
- 16.5.4. Technology
- 16.5.5. Connectivity
- 16.5.6. End-users
- 16.6. Nigeria Remote Asset Monitoring Market
- 16.6.1. Country Segmental Analysis
- 16.6.2. Asset Type
- 16.6.3. Component
- 16.6.4. Technology
- 16.6.5. Connectivity
- 16.6.6. End-users
- 16.7. Algeria Remote Asset Monitoring Market
- 16.7.1. Country Segmental Analysis
- 16.7.2. Asset Type
- 16.7.3. Component
- 16.7.4. Technology
- 16.7.5. Connectivity
- 16.7.6. End-users
- 16.8. Rest of Africa Remote Asset Monitoring Market
- 16.8.1. Country Segmental Analysis
- 16.8.2. Asset Type
- 16.8.3. Component
- 16.8.4. Technology
- 16.8.5. Connectivity
- 16.8.6. End-users
- 17. South America Remote Asset Monitoring Market Analysis
- 17.1. Key Segment Analysis
- 17.2. Regional Snapshot
- 17.3. South America Remote Asset Monitoring Market Size (Value - US$ Bn), Analysis, and Forecasts, 2021-2035
- 17.3.1. Asset Type
- 17.3.2. Component
- 17.3.3. Technology
- 17.3.4. Connectivity
- 17.3.5. End-users
- 17.3.6. Country
- 17.3.6.1. Brazil
- 17.3.6.2. Argentina
- 17.3.6.3. Rest of South America
- 17.4. Brazil Remote Asset Monitoring Market
- 17.4.1. Country Segmental Analysis
- 17.4.2. Asset Type
- 17.4.3. Component
- 17.4.4. Technology
- 17.4.5. Connectivity
- 17.4.6. End-users
- 17.5. Argentina Remote Asset Monitoring Market
- 17.5.1. Country Segmental Analysis
- 17.5.2. Asset Type
- 17.5.3. Component
- 17.5.4. Technology
- 17.5.5. Connectivity
- 17.5.6. End-users
- 17.6. Rest of South America Remote Asset Monitoring Market
- 17.6.1. Country Segmental Analysis
- 17.6.2. Asset Type
- 17.6.3. Component
- 17.6.4. Technology
- 17.6.5. Connectivity
- 17.6.6. End-users
- 18. Key Players/ Company Profile
- 18.1. 6 ABB Ltd.
- 18.1.1. Company Details/ Overview
- 18.1.2. Company Financials
- 18.1.3. Key Customers and Competitors
- 18.1.4. Business/ Industry Portfolio
- 18.1.5. Product Portfolio/ Specification Details
- 18.1.6. Pricing Data
- 18.1.7. Strategic Overview
- 18.1.8. Recent Developments
- 18.2. AT&T Inc.
- 18.3. Cisco Systems Inc.
- 18.4. Emerson Electric Co.
- 18.5. General Electric Company
- 18.6. Geotab Inc.
- 18.7. Hitachi Ltd.
- 18.8. Honeywell International Inc.
- 18.9. IBM Corporation
- 18.10. Oracle Corporation
- 18.11. PTC Inc.
- 18.12. Roambee Corporation
- 18.13. Rockwell Automation Inc.
- 18.14. Samsara Inc.
- 18.15. SAP SE
- 18.16. Schneider Electric SE
- 18.17. Siemens AG
- 18.18. Spirent Communications plc
- 18.19. Symboticware Inc.
- 18.20. Tive Inc.
- 18.21. Topcon Corporation
- 18.22. Trimble Inc.
- 18.23. Verizon Communications Inc.
- 18.24. Other Key Players
- 18.1. 6 ABB Ltd.
Note* - This is just tentative list of players. While providing the report, we will cover more number of players based on their revenue and share for each geography
Research Design
Our research design integrates both demand-side and supply-side analysis through a balanced combination of primary and secondary research methodologies. By utilizing both bottom-up and top-down approaches alongside rigorous data triangulation methods, we deliver robust market intelligence that supports strategic decision-making.
MarketGenics' comprehensive research design framework ensures the delivery of accurate, reliable, and actionable market intelligence. Through the integration of multiple research approaches, rigorous validation processes, and expert analysis, we provide our clients with the insights needed to make informed strategic decisions and capitalize on market opportunities.

MarketGenics leverages a dedicated industry panel of experts and a comprehensive suite of paid databases to effectively collect, consolidate, and analyze market intelligence.
Our approach has consistently proven to be reliable and effective in generating accurate market insights, identifying key industry trends, and uncovering emerging business opportunities.
Through both primary and secondary research, we capture and analyze critical company-level data such as manufacturing footprints, including technical centers, R&D facilities, sales offices, and headquarters.
Our expert panel further enhances our ability to estimate market size for specific brands based on validated field-level intelligence.
Our data mining techniques incorporate both parametric and non-parametric methods, allowing for structured data collection, sorting, processing, and cleaning.
Demand projections are derived from large-scale data sets analyzed through proprietary algorithms, culminating in robust and reliable market sizing.
Research Approach
The bottom-up approach builds market estimates by starting with the smallest addressable market units and systematically aggregating them to create comprehensive market size projections.
This method begins with specific, granular data points and builds upward to create the complete market landscape.
Customer Analysis → Segmental Analysis → Geographical Analysis
The top-down approach starts with the broadest possible market data and systematically narrows it down through a series of filters and assumptions to arrive at specific market segments or opportunities.
This method begins with the big picture and works downward to increasingly specific market slices.
TAM → SAM → SOM


Research Methods
Desk / Secondary Research
While analysing the market, we extensively study secondary sources, directories, and databases to identify and collect information useful for this technical, market-oriented, and commercial report. Secondary sources that we utilize are not only the public sources, but it is a combination of Open Source, Associations, Paid Databases, MG Repository & Knowledgebase, and others.
- Company websites, annual reports, financial reports, broker reports, and investor presentations
- National government documents, statistical databases and reports
- News articles, press releases and web-casts specific to the companies operating in the market, Magazines, reports, and others
- We gather information from commercial data sources for deriving company specific data such as segmental revenue, share for geography, product revenue, and others
- Internal and external proprietary databases (industry-specific), relevant patent, and regulatory databases
- Governing Bodies, Government Organizations
- Relevant Authorities, Country-specific Associations for Industries
We also employ the model mapping approach to estimate the product level market data through the players' product portfolio
Primary Research
Primary research/ interviews is vital in analyzing the market. Most of the cases involves paid primary interviews. Primary sources include primary interviews through e-mail interactions, telephonic interviews, surveys as well as face-to-face interviews with the different stakeholders across the value chain including several industry experts.
| Type of Respondents | Number of Primaries |
|---|---|
| Tier 2/3 Suppliers | ~20 |
| Tier 1 Suppliers | ~25 |
| End-users | ~25 |
| Industry Expert/ Panel/ Consultant | ~30 |
| Total | ~100 |
MG Knowledgebase
• Repository of industry blog, newsletter and case studies
• Online platform covering detailed market reports, and company profiles
Forecasting Factors and Models
Forecasting Factors
- Historical Trends – Past market patterns, cycles, and major events that shaped how markets behave over time. Understanding past trends helps predict future behavior.
- Industry Factors – Specific characteristics of the industry like structure, regulations, and innovation cycles that affect market dynamics.
- Macroeconomic Factors – Economic conditions like GDP growth, inflation, and employment rates that affect how much money people have to spend.
- Demographic Factors – Population characteristics like age, income, and location that determine who can buy your product.
- Technology Factors – How quickly people adopt new technology and how much technology infrastructure exists.
- Regulatory Factors – Government rules, laws, and policies that can help or restrict market growth.
- Competitive Factors – Analyzing competition structure such as degree of competition and bargaining power of buyers and suppliers.
Forecasting Models / Techniques
Multiple Regression Analysis
- Identify and quantify factors that drive market changes
- Statistical modeling to establish relationships between market drivers and outcomes
Time Series Analysis – Seasonal Patterns
- Understand regular cyclical patterns in market demand
- Advanced statistical techniques to separate trend, seasonal, and irregular components
Time Series Analysis – Trend Analysis
- Identify underlying market growth patterns and momentum
- Statistical analysis of historical data to project future trends
Expert Opinion – Expert Interviews
- Gather deep industry insights and contextual understanding
- In-depth interviews with key industry stakeholders
Multi-Scenario Development
- Prepare for uncertainty by modeling different possible futures
- Creating optimistic, pessimistic, and most likely scenarios
Time Series Analysis – Moving Averages
- Sophisticated forecasting for complex time series data
- Auto-regressive integrated moving average models with seasonal components
Econometric Models
- Apply economic theory to market forecasting
- Sophisticated economic models that account for market interactions
Expert Opinion – Delphi Method
- Harness collective wisdom of industry experts
- Structured, multi-round expert consultation process
Monte Carlo Simulation
- Quantify uncertainty and probability distributions
- Thousands of simulations with varying input parameters
Research Analysis
Our research framework is built upon the fundamental principle of validating market intelligence from both demand and supply perspectives. This dual-sided approach ensures comprehensive market understanding and reduces the risk of single-source bias.
Demand-Side Analysis: We understand end-user/application behavior, preferences, and market needs along with the penetration of the product for specific application.
Supply-Side Analysis: We estimate overall market revenue, analyze the segmental share along with industry capacity, competitive landscape, and market structure.
Validation & Evaluation
Data triangulation is a validation technique that uses multiple methods, sources, or perspectives to examine the same research question, thereby increasing the credibility and reliability of research findings. In market research, triangulation serves as a quality assurance mechanism that helps identify and minimize bias, validate assumptions, and ensure accuracy in market estimates.
- Data Source Triangulation – Using multiple data sources to examine the same phenomenon
- Methodological Triangulation – Using multiple research methods to study the same research question
- Investigator Triangulation – Using multiple researchers or analysts to examine the same data
- Theoretical Triangulation – Using multiple theoretical perspectives to interpret the same data

Custom Market Research Services
We will customise the research for you, in case the report listed above does not meet your requirements.
Get 10% Free Customisation