Renewable Energy Market Size, Share & Trends Analysis Report by Energy Source (Solar Photovoltaic (PV), Solar Thermal, Wind Energy, Hydroelectric Power, Geothermal Energy, Biomass & Biofuel, Tidal & Wave Energy, Hydrogen & Fuel Cells), Component/Equipment Type, Installation Type, Grid Connection Type, End-User Type, Capacity Range and Geography (North America, Europe, Asia Pacific, Middle East, Africa, and South America) – Global Industry Data, Trends, and Forecasts, 2026–2035
|
|
|
Segmental Data Insights |
|
|
Demand Trends |
|
|
Competitive Landscape |
|
|
Strategic Development |
|
|
Future Outlook & Opportunities |
|
Renewable Energy Market Size, Share, and Growth
The global renewable energy market is witnessing strong growth, valued at USD 1694 billion in 2025 and projected to reach USD 7408.8 billion by 2035, expanding at a CAGR of 15.9% during the forecast period. North America is the fastest-growing region due to increasing investments in large-scale renewable power projects, expansion of grid modernization programs, and strong policy support for clean energy adoption across power, transportation, and industrial sectors.
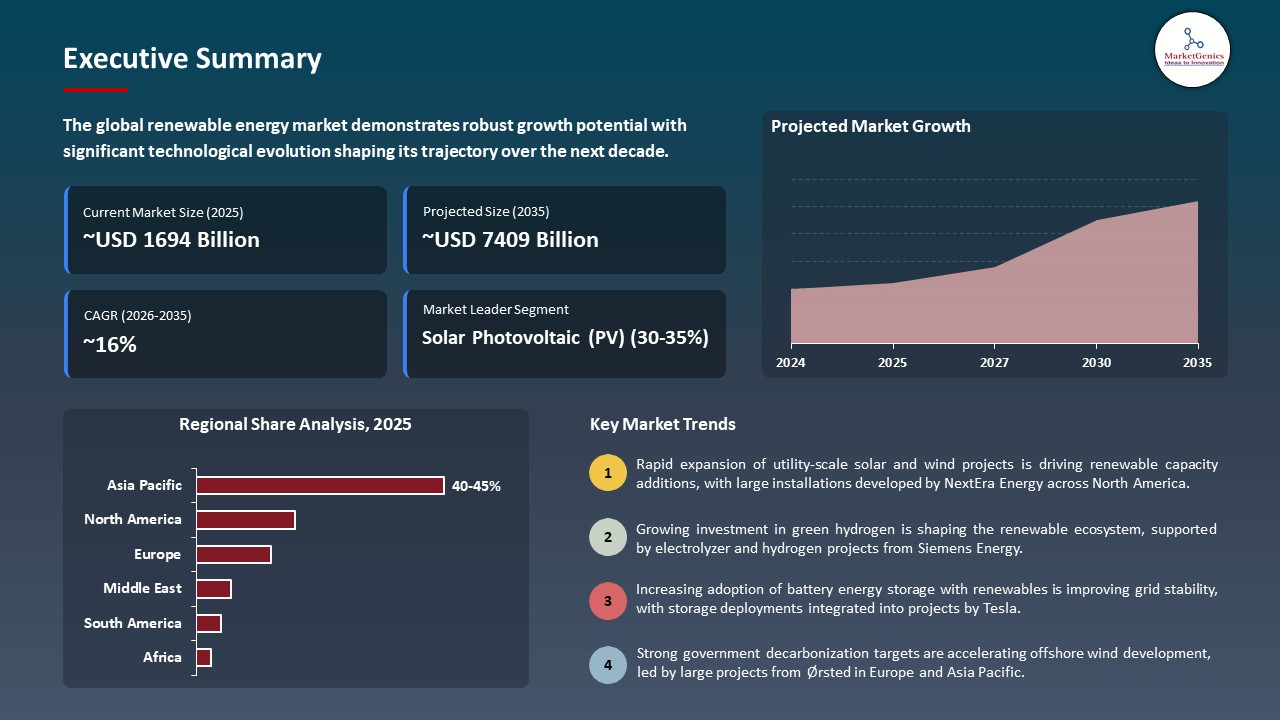
Stéphane Michel, President Gas, Renewables & Power at TotalEnergies, said, “We are delighted to strengthen our partnership with Google with this agreement to supply renewable electricity to their data centers in Ohio, this agreement illustrates TotalEnergies’s ability to meet the growing energy demands of major tech companies by leveraging its integrated portfolio of renewable and flexible assets. It also contributes to achieving our target of 12% profitability in the power sector.”
Increasing attention to grid decarbonization, long-term energy cost predictability, and generation of clean power at home is starting to speed up the implementation of renewable energy by utilities, industries, and governments around the globe. The mass production of capacity by big equipment manufacturers is making technology efficient and also allowing quicker project completion.
Tata Power Renewable Energy funded 752 MW of new solar projects in a quarter in 2025, and boosted its renewable portfolio operations and utility-scale installation capacity, and Siemens Gamesa Renewable Energy began 14 MW offshore wind turbine nacelle production at its new facility in Taiwan to serve the next-generation high-capacity wind farms. The growth in the use of large solar parks, offshore wind facilities and storage-based hybrid renewable facilities is making clean power supply more reliable and influencing utilities to displace fossil-based generation with scalable renewable technologies. Growing sun scale and offshore wind production facility rapidly are driving world renewable developments and maintaining a robust growth in the market.
Adjacent opportunities for the renewable energy market include energy storage systems, green hydrogen production, electric vehicle charging infrastructure, smart grid technologies, and power electronics for grid management are key adjacent opportunities to the renewable energy market, as higher renewable penetration requires efficient storage, transmission, and electrification support solutions across power, transport, and industrial sectors.
 Renewable Energy Market Dynamics and Trends
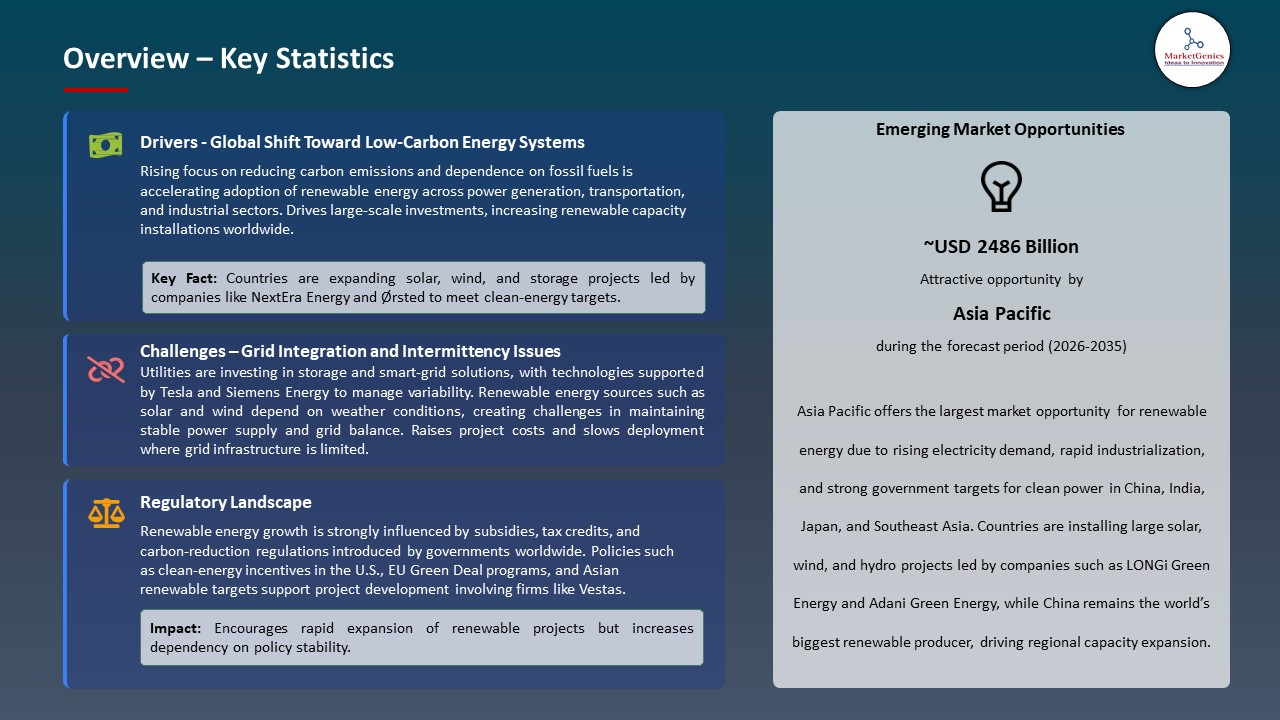
Driver: Rising Corporate and Industrial Commitments Toward Renewable Energy Adoption Worldwide
-
Corporations and industrial consumers are increasingly making commitments to decarbonization and sustainability, which are driving the renewable energy market. Companies through large-scale Power Purchases Agreements (PPAs) and direct investments of renewable energy projects are also acquiring long-term and low-carbon electricity, and can support new clean energy capacity.
- Such industrial and corporate projects stimulate the use of renewable energy, foster development of infrastructure and promote innovation in the solar energy systems, wind and hybrid energy systems.
- In 2025, TotalEnergies entered into a 15-year PPA with Google to produce 1.5 TWh of renewable energy at its Montpelier solar farm in Ohio, illustrating the direct impact of corporate promises on the development of renewable energy, the expansion of infrastructure, and the development of solar, wind, and hybrid energy systems.
- The corporate and industrial adoption forms will reinforce market demand, enhance the development of large-scale projects and promote the long-term increase in renewable energy capacity across the globe.
Restraint: Regulatory and Policy Uncertainty Affecting Renewable Deployment
-
The renewable energy market experiences significant constraints that are caused by the regulatory and policy uncertainty in major regions. Varying incentives, subsidies and renewable energy requirements may topple project planning, financing and execution and developers and investors are wary of this problem. The complexity arises as inconsistent regulations of states or countries raise the operational and compliance expenses of renewable energy projects.
- Moreover, inefficiencies in processes of permitting, grid approvals, or adjustments in tariffs may slow down commissioning of a project, constrain scalability, and lower short-term returns on investment. Ambiguous or changing policies can also influence the application of an improved technology like energy storage, offshore wind energy and hybrid systems.
- Regulatory confusion may hinder the project implementation, market development, and investment confidence, which is why consistent and long-term policies should be implemented to support the renewable energy development.
Opportunity: Hybrid Renewable Projects and Energy Storage as Emerging Opportunities
-
Renewable energy market is also very much gaining out of the incorporation of hybrid projects incorporating solar, wind energy and energy storage systems. Such solutions enhance reliability of the grid, decrease intermittency and provide stability in power supply, providing new opportunities in investment and development.
- Energy storage technologies such as batteries and improved grid management systems increase the efficacy and versatility of renewable generation to permit an increase in the clean energy penetration.
- ReNew Energy inaugurated a 2.8 GW hybrid solar-wind facility with 2 Gwh storage in Andhra Pradesh in 2025 to establish one of the largest renewable complexes in India and provide a reliable and dispatchable clean energy supply during peak demand.
- Integration and hybrid projects increase the market opportunities, enhance energy reliability and develop new solutions in the deployment of renewable power.
Key Trend: Digitalization and Smart Grid Technologies Driving Renewable Efficiency
-
The digitalization and use of smart grids are increasingly affecting the renewable energy market and optimizes this energy generation, distribution, and consumption. The use of advanced technologies like AI analytics, IoT sensors, and SCADA systems can be used to monitor the grid in real-time, predictive maintenance, and better management.
- These innovations increase operational efficiency, decrease downtimes and enable integration of the distributed renewable resources into the power system in a better manner. Digital and smart grid solutions can contribute to a greater penetration of renewables and more reliable and cost-effective delivery of clean energy by making it possible to predict accurately and dispatch energy.
- In 2025, Huawei Digital Power introduced its all scenario Smart PV+ESS grid-forming solutions, which can provide flexible dispatch, complete lifecycle digitalization, and stable renewable integration of generation, transmission, and distribution to progress high-quality, reliable renewable energy systems around the world.
- Renewable energy systems are made more efficient, reliable, and scalable with the use of digitalization and smart grid, which leads to the rapid market development.
 Renewable-Energy-Market Analysis and Segmental Data
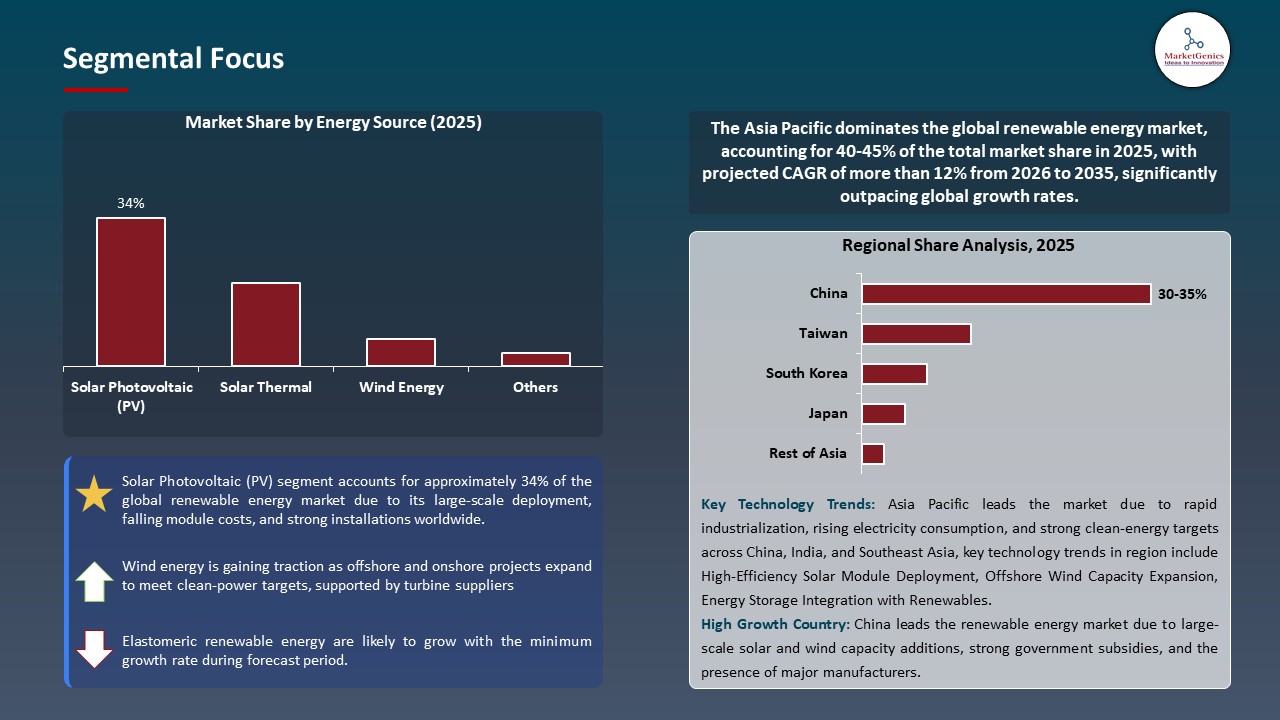
Solar Photovoltaic (PV) Dominate Global Renewable Energy Market
-
The PV technology is the most promising segment of the renewable energy market in the world because of its scalability, decreasing cost and the ability to be utilized in residential, commercial, and utility-scale applications. High-speed growth of technology in the PV panels, such as efficiency improvement, bifacial, and integration with energy storage systems have up to now contributed greatly to the adoption of PV panels globally.
- Solar PV is a favoured new renewable energy project, and the government is promoting it in several areas using incentives, subsidies, and policies. The fact that it can produce electricity in various climates, as well as, the low operation and maintenance cost, also enhance its market position.
- The clean energy is gaining momentum in investments, and the world is becoming more and more interested in the sustainable electricity making solar PV gain an additional market share and stimulate the development of innovations, generating jobs, and sharing the process of globalization of the sustainable energy.
Asia Pacific Leads Global Renewable Energy Market Demand
-
The Asia Pacific region dominates the global renewable energy market due to rapid industrialization, urbanization, and strong government initiatives promoting clean energy adoption. Significant investments in large-scale solar, wind, and hydropower projects are being made to meet rising electricity demand and climate goals.
- Natural resources such as high solar potential and a long coastline that can support offshore wind, are abundant, which makes the deployment of renewable energy strong. Policy stimulus like feed-in tariffs, renewable energy certificates and tax incentives continue to boost development in the area.
- Combined with the falling prices of solar panels, wind turbines, and energy storage systems, the Asia Pacific region will remain one of the leaders in the production of renewable energy, contributing to the development of the global market and the shift toward sustainable energy.
Renewable-Energy-Market Ecosystem
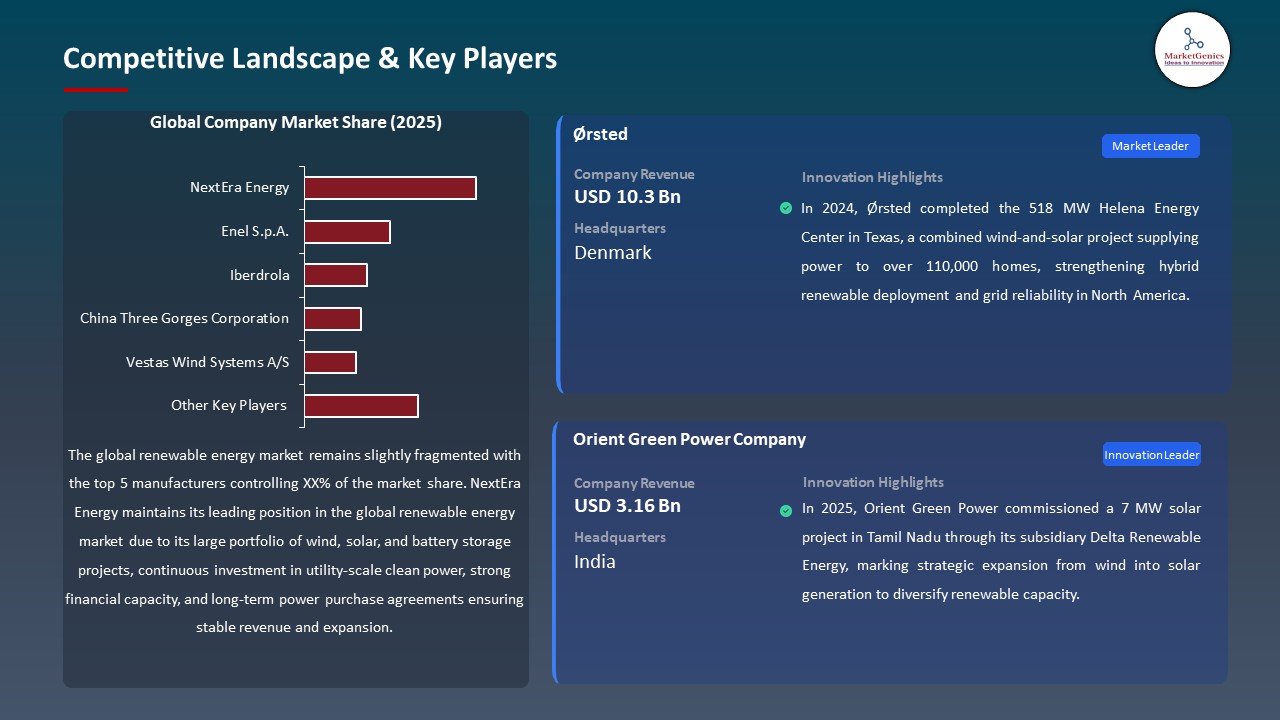
The global renewable energy market is fargmented, with key players including NextEra Energy, Enel S.p.A., Iberdrola, China Three Gorges Corporation, and Vestas Wind Systems A/S. These companies take advantage of diversified renewable energy portfolios, such as wind, solar, and hydropower, and enhanced grid integration technologies as well as large global networks of project development and distribution. Their market power is strengthened by their strategic partnerships, continued research and development on high-efficiency turbines, solar pv system, energy storage and investment in clean energy infrastructure of the future.
Value chain includes resource evaluation, project design, equipment production, construction and installation, grid interaction, energy transmission, and post sales services in the form of performance monitoring, preventive maintenance and optimization of lifecycle. Every step guarantees reliability, efficiency, and sustainability of power production in the case of residential, commercial, and industrial power production.
The barriers to entry are high because of the complexity of technology, capital-reliant infrastructure, and the durability of regulatory licenses. Differentiation, scalability and sustainability in the renewable energy market are made through continuous innovation of high-efficiency turbines, advanced solar PV materials, offshore wind technology as well as energy storage solutions.
 Recent Development and Strategic Overview:
-
In December 2025, NextEra Energy Resources and Meta signed 2.5 GW of clean energy contracts, including solar PPAs and battery storage agreements across ERCOT, SPP, MISO, and New Mexico, advancing large-scale renewable deployment, energy storage integration, and support for corporate clean energy operations.
- In March 2026, Ozora Electrical and Renewable Energy achieved dual NETCC approval, certifying its solar and battery installations across Adelaide, Sydney, and Mildura, ensuring compliance with Australian safety standards, enhancing consumer protection, and enabling access to government renewable energy rebate programs.
Report Scope
|
Detail |
|
|
Market Size in 2025 |
USD 1694 Bn |
|
Market Forecast Value in 2035 |
USD 7408.8 Bn |
|
Growth Rate (CAGR) |
15.9% |
|
Forecast Period |
2026 – 2035 |
|
Historical Data Available for |
2021 – 2024 |
|
Market Size Units |
US$ Billion for Value |
|
Report Format |
Electronic (PDF) + Excel |
|
North America |
Europe |
Asia Pacific |
Middle East |
Africa |
South America |
|
|
|
|
|
|
|
Companies Covered |
|||||
|
|
|
|
|
|
Renewable-Energy-Market Segmentation and Highlights
|
Segment |
Sub-segment |
|
Renewable Energy Market, By Energy Source |
|
|
Renewable Energy Market, By Component/Equipment Type |
|
|
Renewable Energy Market, By Installation Type |
|
|
Renewable Energy Market, By Grid Connection Type |
|
|
Renewable Energy Market, By End-User Type |
|
|
Renewable Energy Market, By Capacity Range |
|
Frequently Asked Questions
Table of Contents
- 1. Research Methodology and Assumptions
- 1.1. Definitions
- 1.2. Research Design and Approach
- 1.3. Data Collection Methods
- 1.4. Base Estimates and Calculations
- 1.5. Forecasting Models
- 1.5.1. Key Forecast Factors & Impact Analysis
- 1.6. Secondary Research
- 1.6.1. Open Sources
- 1.6.2. Paid Databases
- 1.6.3. Associations
- 1.7. Primary Research
- 1.7.1. Primary Sources
- 1.7.2. Primary Interviews with Stakeholders across Ecosystem
- 2. Executive Summary
- 2.1. Global Renewable Energy Market Outlook
- 2.1.1. Renewable Energy Market Size Value (US$ Bn), and Forecasts, 2021-2035
- 2.1.2. Compounded Annual Growth Rate Analysis
- 2.1.3. Growth Opportunity Analysis
- 2.1.4. Segmental Share Analysis
- 2.1.5. Geographical Share Analysis
- 2.2. Market Analysis and Facts
- 2.3. Supply-Demand Analysis
- 2.4. Competitive Benchmarking
- 2.5. Go-to- Market Strategy
- 2.5.1. Customer/ End-use Industry Assessment
- 2.5.2. Growth Opportunity Data, 2026-2035
- 2.5.2.1. Regional Data
- 2.5.2.2. Country Data
- 2.5.2.3. Segmental Data
- 2.5.3. Identification of Potential Market Spaces
- 2.5.4. GAP Analysis
- 2.5.5. Potential Attractive Price Points
- 2.5.6. Prevailing Market Risks & Challenges
- 2.5.7. Preferred Sales & Marketing Strategies
- 2.5.8. Key Recommendations and Analysis
- 2.5.9. A Way Forward
- 2.1. Global Renewable Energy Market Outlook
- 3. Industry Data and Premium Insights
- 3.1. Global Energy & Power Industry Overview, 2025
- 3.1.1. Energy & Power Industry Ecosystem Analysis
- 3.1.2. Key Trends for Energy & Power Industry
- 3.1.3. Regional Distribution for Energy & Power Industry
- 3.2. Supplier Customer Data
- 3.3. Technology Roadmap and Developments
- 3.4. Trade Analysis
- 3.1. Global Energy & Power Industry Overview, 2025
- 4. Market Overview
- 4.1. Market Dynamics
- 4.1.1. Drivers
- 4.1.1.1. Strong government policies supporting clean energy transition and carbon reduction targets
- 4.1.1.2. Rapid decline in cost of solar, wind, and energy storage technologies
- 4.1.1.3. Rising global electricity demand driven by electrification of transport and industry
- 4.1.2. Restraints
- 4.1.2.1. High initial investment and infrastructure development costs
- 4.1.2.2. Intermittency issues and grid integration challenges with renewable power sources
- 4.1.1. Drivers
- 4.2. Key Trend Analysis
- 4.3. Regulatory Framework
- 4.3.1. Key Regulations, Norms, and Subsidies, by Key Countries
- 4.3.2. Tariffs and Standards
- 4.3.3. Impact Analysis of Regulations on the Market
- 4.4. Value Chain Analysis/ Ecosystem Analysis
- 4.5. Porter’s Five Forces Analysis
- 4.6. PESTEL Analysis
- 4.7. Global Renewable Energy Market Demand
- 4.7.1. Historical Market Size – Value (US$ Bn), 2020-2024
- 4.7.2. Current and Future Market Size - Value (US$ Bn), 2026–2035
- 4.7.2.1. Y-o-Y Growth Trends
- 4.7.2.2. Absolute $ Opportunity Assessment
- 4.1. Market Dynamics
- 5. Competition Landscape
- 5.1. Competition structure
- 5.1.1. Fragmented v/s consolidated
- 5.2. Company Share Analysis, 2025
- 5.2.1. Global Company Market Share
- 5.2.2. By Region
- 5.2.2.1. North America
- 5.2.2.2. Europe
- 5.2.2.3. Asia Pacific
- 5.2.2.4. Middle East
- 5.2.2.5. Africa
- 5.2.2.6. South America
- 5.3. Product Comparison Matrix
- 5.3.1. Specifications
- 5.3.2. Market Positioning
- 5.3.3. Pricing
- 5.1. Competition structure
- 6. Global Renewable Energy Market Analysis, by Energy Source
- 6.1. Key Segment Analysis
- 6.2. Renewable Energy Market Size Value (US$ Bn), Analysis, and Forecasts, by Energy Source, 2021-2035
- 6.2.1. Solar Photovoltaic (PV)
- 6.2.2. Solar Thermal
- 6.2.3. Wind Energy
- 6.2.3.1. Onshore
- 6.2.3.2. Offshore
- 6.2.4. Hydroelectric Power
- 6.2.4.1. Run-of-River Hydropower
- 6.2.4.2. Reservoir-Based Hydropower
- 6.2.4.3. Others
- 6.2.5. Geothermal Energy
- 6.2.6. Biomass & Biofuel
- 6.2.7. Tidal & Wave Energy
- 6.2.8. Hydrogen & Fuel Cells
- 7. Global Renewable Energy Market Analysis, by Component/Equipment Type
- 7.1. Key Segment Analysis
- 7.2. Renewable Energy Market Size Value (US$ Bn), Analysis, and Forecasts, by Component/Equipment Type, 2021-2035
- 7.2.1. Generation Equipment
- 7.2.2. Balance of System (BoS)
- 7.2.3. Energy Storage Systems
- 7.2.3.1. Battery Energy Storage Systems (BESS)
- 7.2.3.2. Thermal Storage
- 7.2.3.3. Pumped Hydro Storage
- 7.2.3.4. Compressed Air Energy Storage
- 7.2.3.5. Standalone
- 7.2.4. Inverters & Power Electronics
- 7.2.5. Monitoring & Control Systems
- 7.2.6. Grid Connection Equipment
- 7.2.7. Transmission & Distribution Components
- 7.2.8. Other Components
- 8. Global Renewable Energy Market Analysis, Installation Type
- 8.1. Key Segment Analysis
- 8.2. Renewable Energy Market Size Value (US$ Bn), Analysis, and Forecasts, by Installation Type, 2021-2035
- 8.2.1. Rooftop Installation
- 8.2.2. Ground-Mount
- 8.2.3. Floating
- 8.2.4. Vehicular Integration
- 8.2.5. Building-Integrated
- 8.2.6. Others
- 9. Global Renewable Energy Market Analysis, by Grid Connection Type
- 9.1. Key Segment Analysis
- 9.2. Renewable Energy Market Size Value (US$ Bn), Analysis, and Forecasts, by Grid Connection Type, 2021-2035
- 9.2.1. Grid-Connected Systems
- 9.2.2. Off-Grid Systems
- 9.2.3. Virtual Power Plant (VPP)
- 9.2.4. Hybrid Systems
- 10. Global Renewable Energy Market Analysis, by End-User Type
- 10.1. Key Segment Analysis
- 10.2. Renewable Energy Market Size Value (US$ Bn), Analysis, and Forecasts, by End-User Type, 2021-2035
- 10.2.1. Residential Consumers
- 10.2.2. Commercial Enterprises
- 10.2.3. Industrial Manufacturers
- 10.2.4. Utility Companies/Grid Operators
- 10.2.5. Government/Public Institutions
- 10.2.6. Others
- 11. Global Renewable Energy Market Analysis, by Capacity Range
- 11.1. Key Segment Analysis
- 11.2. Renewable Energy Market Size Value (US$ Bn), Analysis, and Forecasts, by Capacity Range, 2021-2035
- 11.2.1. <1 MW
- 11.2.2. 1-5 MW
- 11.2.3. 5-50 MW
- 11.2.4. 50-250 MW
- 11.2.5. 250+ MW
- 12. Global Renewable Energy Market Analysis and Forecasts, by Region
- 12.1. Key Findings
- 12.2. Renewable Energy Market Size Value (US$ Bn), Analysis, and Forecasts, by Region, 2021-2035
- 12.2.1. North America
- 12.2.2. Europe
- 12.2.3. Asia Pacific
- 12.2.4. Middle East
- 12.2.5. Africa
- 12.2.6. South America
- 13. North America Renewable Energy Market Analysis
- 13.1. Key Segment Analysis
- 13.2. Regional Snapshot
- 13.3. North America Renewable Energy Market Size- Value (US$ Bn), Analysis, and Forecasts, 2021-2035
- 13.3.1. Material Type
- 13.3.2. Packaging Technology
- 13.3.3. Thickness Grade
- 13.3.4. Industry Verticals
- 13.3.5. Country
- 13.3.5.1. USA
- 13.3.5.2. Canada
- 13.3.5.3. Mexico
- 13.4. USA Renewable Energy Market
- 13.4.1. Country Segmental Analysis
- 13.4.2. Energy Source
- 13.4.3. Component/Equipment Type
- 13.4.4. Installation Type
- 13.4.5. Grid Connection Type
- 13.4.6. End-User Type
- 13.4.7. Capacity Range
- 13.5. Canada Renewable Energy Market
- 13.5.1. Country Segmental Analysis
- 13.5.2. Energy Source
- 13.5.3. Component/Equipment Type
- 13.5.4. Installation Type
- 13.5.5. Grid Connection Type
- 13.5.6. End-User Type
- 13.5.7. Capacity Range
- 13.6. Mexico Renewable Energy Market
- 13.6.1. Country Segmental Analysis
- 13.6.2. Energy Source
- 13.6.3. Component/Equipment Type
- 13.6.4. Installation Type
- 13.6.5. Grid Connection Type
- 13.6.6. End-User Type
- 13.6.7. Capacity Range
- 14. Europe Renewable Energy Market Analysis
- 14.1. Key Segment Analysis
- 14.2. Regional Snapshot
- 14.3. Europe Renewable Energy Market Size Value (US$ Bn), Analysis, and Forecasts, 2021-2035
- 14.3.1. Energy Source
- 14.3.2. Component/Equipment Type
- 14.3.3. Installation Type
- 14.3.4. Grid Connection Type
- 14.3.5. End-User Type
- 14.3.6. Capacity Range
- 14.3.7. Country
- 14.3.7.1. Germany
- 14.3.7.2. United Kingdom
- 14.3.7.3. France
- 14.3.7.4. Italy
- 14.3.7.5. Spain
- 14.3.7.6. Netherlands
- 14.3.7.7. Nordic Countries
- 14.3.7.8. Poland
- 14.3.7.9. Russia & CIS
- 14.3.7.10. Rest of Europe
- 14.4. Germany Renewable Energy Market
- 14.4.1. Country Segmental Analysis
- 14.4.2. Energy Source
- 14.4.3. Component/Equipment Type
- 14.4.4. Installation Type
- 14.4.5. Grid Connection Type
- 14.4.6. End-User Type
- 14.4.7. Capacity Range
- 14.5. United Kingdom Renewable Energy Market
- 14.5.1. Country Segmental Analysis
- 14.5.2. Energy Source
- 14.5.3. Component/Equipment Type
- 14.5.4. Installation Type
- 14.5.5. Grid Connection Type
- 14.5.6. End-User Type
- 14.5.7. Capacity Range
- 14.6. France Renewable Energy Market
- 14.6.1. Country Segmental Analysis
- 14.6.2. Energy Source
- 14.6.3. Component/Equipment Type
- 14.6.4. Installation Type
- 14.6.5. Grid Connection Type
- 14.6.6. End-User Type
- 14.6.7. Capacity Range
- 14.7. Italy Renewable Energy Market
- 14.7.1. Country Segmental Analysis
- 14.7.2. Energy Source
- 14.7.3. Component/Equipment Type
- 14.7.4. Installation Type
- 14.7.5. Grid Connection Type
- 14.7.6. End-User Type
- 14.7.7. Capacity Range
- 14.8. Spain Renewable Energy Market
- 14.8.1. Country Segmental Analysis
- 14.8.2. Energy Source
- 14.8.3. Component/Equipment Type
- 14.8.4. Installation Type
- 14.8.5. Grid Connection Type
- 14.8.6. End-User Type
- 14.8.7. Capacity Range
- 14.9. Netherlands Renewable Energy Market
- 14.9.1. Country Segmental Analysis
- 14.9.2. Energy Source
- 14.9.3. Component/Equipment Type
- 14.9.4. Installation Type
- 14.9.5. Grid Connection Type
- 14.9.6. End-User Type
- 14.9.7. Capacity Range
- 14.10. Nordic Countries Renewable Energy Market
- 14.10.1. Country Segmental Analysis
- 14.10.2. Energy Source
- 14.10.3. Component/Equipment Type
- 14.10.4. Installation Type
- 14.10.5. Grid Connection Type
- 14.10.6. End-User Type
- 14.10.7. Capacity Range
- 14.11. Poland Renewable Energy Market
- 14.11.1. Country Segmental Analysis
- 14.11.2. Energy Source
- 14.11.3. Component/Equipment Type
- 14.11.4. Installation Type
- 14.11.5. Grid Connection Type
- 14.11.6. End-User Type
- 14.11.7. Capacity Range
- 14.12. Russia & CIS Renewable Energy Market
- 14.12.1. Country Segmental Analysis
- 14.12.2. Energy Source
- 14.12.3. Component/Equipment Type
- 14.12.4. Installation Type
- 14.12.5. Grid Connection Type
- 14.12.6. End-User Type
- 14.12.7. Capacity Range
- 14.13. Rest of Europe Renewable Energy Market
- 14.13.1. Country Segmental Analysis
- 14.13.2. Energy Source
- 14.13.3. Component/Equipment Type
- 14.13.4. Installation Type
- 14.13.5. Grid Connection Type
- 14.13.6. End-User Type
- 14.13.7. Capacity Range
- 15. Asia Pacific Renewable Energy Market Analysis
- 15.1. Key Segment Analysis
- 15.2. Regional Snapshot
- 15.3. Asia Pacific Renewable Energy Market Size Value (US$ Bn), Analysis, and Forecasts, 2021-2035
- 15.3.1. Energy Source
- 15.3.2. Component/Equipment Type
- 15.3.3. Installation Type
- 15.3.4. Grid Connection Type
- 15.3.5. End-User Type
- 15.3.6. Capacity Range
- 15.3.7. Country
- 15.3.7.1. China
- 15.3.7.2. India
- 15.3.7.3. Japan
- 15.3.7.4. South Korea
- 15.3.7.5. Australia and New Zealand
- 15.3.7.6. Indonesia
- 15.3.7.7. Malaysia
- 15.3.7.8. Thailand
- 15.3.7.9. Vietnam
- 15.3.7.10. Rest of Asia Pacific
- 15.4. China Renewable Energy Market
- 15.4.1. Country Segmental Analysis
- 15.4.2. Energy Source
- 15.4.3. Component/Equipment Type
- 15.4.4. Installation Type
- 15.4.5. Grid Connection Type
- 15.4.6. End-User Type
- 15.4.7. Capacity Range
- 15.5. India Renewable Energy Market
- 15.5.1. Country Segmental Analysis
- 15.5.2. Energy Source
- 15.5.3. Component/Equipment Type
- 15.5.4. Installation Type
- 15.5.5. Grid Connection Type
- 15.5.6. End-User Type
- 15.5.7. Capacity Range
- 15.6. Japan Renewable Energy Market
- 15.6.1. Country Segmental Analysis
- 15.6.2. Energy Source
- 15.6.3. Component/Equipment Type
- 15.6.4. Installation Type
- 15.6.5. Grid Connection Type
- 15.6.6. End-User Type
- 15.6.7. Capacity Range
- 15.7. South Korea Renewable Energy Market
- 15.7.1. Country Segmental Analysis
- 15.7.2. Energy Source
- 15.7.3. Component/Equipment Type
- 15.7.4. Installation Type
- 15.7.5. Grid Connection Type
- 15.7.6. End-User Type
- 15.7.7. Capacity Range
- 15.8. Australia and New Zealand Renewable Energy Market
- 15.8.1. Country Segmental Analysis
- 15.8.2. Energy Source
- 15.8.3. Component/Equipment Type
- 15.8.4. Installation Type
- 15.8.5. Grid Connection Type
- 15.8.6. End-User Type
- 15.8.7. Capacity Range
- 15.9. Indonesia Renewable Energy Market
- 15.9.1. Country Segmental Analysis
- 15.9.2. Energy Source
- 15.9.3. Component/Equipment Type
- 15.9.4. Installation Type
- 15.9.5. Grid Connection Type
- 15.9.6. End-User Type
- 15.9.7. Capacity Range
- 15.10. Malaysia Renewable Energy Market
- 15.10.1. Country Segmental Analysis
- 15.10.2. Energy Source
- 15.10.3. Component/Equipment Type
- 15.10.4. Installation Type
- 15.10.5. Grid Connection Type
- 15.10.6. End-User Type
- 15.10.7. Capacity Range
- 15.11. Thailand Renewable Energy Market
- 15.11.1. Country Segmental Analysis
- 15.11.2. Energy Source
- 15.11.3. Component/Equipment Type
- 15.11.4. Installation Type
- 15.11.5. Grid Connection Type
- 15.11.6. End-User Type
- 15.11.7. Capacity Range
- 15.12. Vietnam Renewable Energy Market
- 15.12.1. Country Segmental Analysis
- 15.12.2. Energy Source
- 15.12.3. Component/Equipment Type
- 15.12.4. Installation Type
- 15.12.5. Grid Connection Type
- 15.12.6. End-User Type
- 15.12.7. Capacity Range
- 15.13. Rest of Asia Pacific Renewable Energy Market
- 15.13.1. Country Segmental Analysis
- 15.13.2. Energy Source
- 15.13.3. Component/Equipment Type
- 15.13.4. Installation Type
- 15.13.5. Grid Connection Type
- 15.13.6. End-User Type
- 15.13.7. Capacity Range
- 16. Middle East Renewable Energy Market Analysis
- 16.1. Key Segment Analysis
- 16.2. Regional Snapshot
- 16.3. Middle East Renewable Energy Market Size Value (US$ Bn), Analysis, and Forecasts, 2021-2035
- 16.3.1. Energy Source
- 16.3.2. Component/Equipment Type
- 16.3.3. Installation Type
- 16.3.4. Grid Connection Type
- 16.3.5. End-User Type
- 16.3.6. Capacity Range
- 16.3.7. Country
- 16.3.7.1. Turkey
- 16.3.7.2. UAE
- 16.3.7.3. Saudi Arabia
- 16.3.7.4. Israel
- 16.3.7.5. Rest of Middle East
- 16.4. Turkey Renewable Energy Market
- 16.4.1. Country Segmental Analysis
- 16.4.2. Energy Source
- 16.4.3. Component/Equipment Type
- 16.4.4. Installation Type
- 16.4.5. Grid Connection Type
- 16.4.6. End-User Type
- 16.4.7. Capacity Range
- 16.5. UAE Renewable Energy Market
- 16.5.1. Country Segmental Analysis
- 16.5.2. Energy Source
- 16.5.3. Component/Equipment Type
- 16.5.4. Installation Type
- 16.5.5. Grid Connection Type
- 16.5.6. End-User Type
- 16.5.7. Capacity Range
- 16.6. Saudi Arabia Renewable Energy Market
- 16.6.1. Country Segmental Analysis
- 16.6.2. Energy Source
- 16.6.3. Component/Equipment Type
- 16.6.4. Installation Type
- 16.6.5. Grid Connection Type
- 16.6.6. End-User Type
- 16.6.7. Capacity Range
- 16.7. Israel Renewable Energy Market
- 16.7.1. Country Segmental Analysis
- 16.7.2. Energy Source
- 16.7.3. Component/Equipment Type
- 16.7.4. Installation Type
- 16.7.5. Grid Connection Type
- 16.7.6. End-User Type
- 16.7.7. Capacity Range
- 16.8. Rest of Middle East Renewable Energy Market
- 16.8.1. Country Segmental Analysis
- 16.8.2. Energy Source
- 16.8.3. Component/Equipment Type
- 16.8.4. Installation Type
- 16.8.5. Grid Connection Type
- 16.8.6. End-User Type
- 16.8.7. Capacity Range
- 17. Africa Renewable Energy Market Analysis
- 17.1. Key Segment Analysis
- 17.2. Regional Snapshot
- 17.3. Africa Renewable Energy Market Size Value (US$ Bn), Analysis, and Forecasts, 2021-2035
- 17.3.1. Energy Source
- 17.3.2. Component/Equipment Type
- 17.3.3. Installation Type
- 17.3.4. Grid Connection Type
- 17.3.5. End-User Type
- 17.3.6. Capacity Range
- 17.3.7. Country
- 17.3.7.1. South Africa
- 17.3.7.2. Egypt
- 17.3.7.3. Nigeria
- 17.3.7.4. Algeria
- 17.3.7.5. Rest of Africa
- 17.4. South Africa Renewable Energy Market
- 17.4.1. Country Segmental Analysis
- 17.4.2. Energy Source
- 17.4.3. Component/Equipment Type
- 17.4.4. Installation Type
- 17.4.5. Grid Connection Type
- 17.4.6. End-User Type
- 17.4.7. Capacity Range
- 17.5. Egypt Renewable Energy Market
- 17.5.1. Country Segmental Analysis
- 17.5.2. Energy Source
- 17.5.3. Component/Equipment Type
- 17.5.4. Installation Type
- 17.5.5. Grid Connection Type
- 17.5.6. End-User Type
- 17.5.7. Capacity Range
- 17.6. Nigeria Renewable Energy Market
- 17.6.1. Country Segmental Analysis
- 17.6.2. Energy Source
- 17.6.3. Component/Equipment Type
- 17.6.4. Installation Type
- 17.6.5. Grid Connection Type
- 17.6.6. End-User Type
- 17.6.7. Capacity Range
- 17.7. Algeria Renewable Energy Market
- 17.7.1. Country Segmental Analysis
- 17.7.2. Energy Source
- 17.7.3. Component/Equipment Type
- 17.7.4. Installation Type
- 17.7.5. Grid Connection Type
- 17.7.6. End-User Type
- 17.7.7. Capacity Range
- 17.8. Rest of Africa Renewable Energy Market
- 17.8.1. Country Segmental Analysis
- 17.8.2. Energy Source
- 17.8.3. Component/Equipment Type
- 17.8.4. Installation Type
- 17.8.5. Grid Connection Type
- 17.8.6. End-User Type
- 17.8.7. Capacity Range
- 18. South America Renewable Energy Market Analysis
- 18.1. Key Segment Analysis
- 18.2. Regional Snapshot
- 18.3. South America Renewable Energy Market Size Value (US$ Bn), Analysis, and Forecasts, 2021-2035
- 18.3.1. Energy Source
- 18.3.2. Component/Equipment Type
- 18.3.3. Installation Type
- 18.3.4. Grid Connection Type
- 18.3.5. End-User Type
- 18.3.6. Capacity Range
- 18.3.7. Country
- 18.3.7.1. Brazil
- 18.3.7.2. Argentina
- 18.3.7.3. Rest of South America
- 18.4. Brazil Renewable Energy Market
- 18.4.1. Country Segmental Analysis
- 18.4.2. Energy Source
- 18.4.3. Component/Equipment Type
- 18.4.4. Installation Type
- 18.4.5. Grid Connection Type
- 18.4.6. End-User Type
- 18.4.7. Capacity Range
- 18.5. Argentina Renewable Energy Market
- 18.5.1. Country Segmental Analysis
- 18.5.2. Energy Source
- 18.5.3. Component/Equipment Type
- 18.5.4. Installation Type
- 18.5.5. Grid Connection Type
- 18.5.6. End-User Type
- 18.5.7. Capacity Range
- 18.6. Rest of South America Renewable Energy Market
- 18.6.1. Country Segmental Analysis
- 18.6.2. Energy Source
- 18.6.3. Component/Equipment Type
- 18.6.4. Installation Type
- 18.6.5. Grid Connection Type
- 18.6.6. End-User Type
- 18.6.7. Capacity Range
- 19. Key Players/ Company Profile
- 19.1. Adani Green Energy Limited
- 19.1.1. Company Details/ Overview
- 19.1.2. Company Financials
- 19.1.3. Key Customers and Competitors
- 19.1.4. Business/ Industry Portfolio
- 19.1.5. Product Portfolio/ Specification Details
- 19.1.6. Pricing Data
- 19.1.7. Strategic Overview
- 19.1.8. Recent Developments
- 19.2. American Electric Power (AEP)
- 19.3. Brookfield Renewable
- 19.4. China Three Gorges Corporation
- 19.5. Dominion Energy
- 19.6. Duke Energy
- 19.7. Enel S.p.A.
- 19.8. FirstEnergy Corp
- 19.9. General Electric
- 19.10. Goldwind Science & Technology Co., Ltd.
- 19.11. Iberdrola
- 19.12. JinkoSolar Holding Co.
- 19.13. LONGi Green Energy Technology Co. Ltd.
- 19.14. NextEra Energy
- 19.15. Ørsted Group
- 19.16. RWE Group
- 19.17. Siemens Gamesa
- 19.18. Southern Company
- 19.19. SunPower Corporation
- 19.20. Vestas Wind Systems A/S
- 19.21. Other Key Players
- 19.1. Adani Green Energy Limited
Note* - This is just tentative list of players. While providing the report, we will cover more number of players based on their revenue and share for each geography
Research Design
Our research design integrates both demand-side and supply-side analysis through a balanced combination of primary and secondary research methodologies. By utilizing both bottom-up and top-down approaches alongside rigorous data triangulation methods, we deliver robust market intelligence that supports strategic decision-making.
MarketGenics' comprehensive research design framework ensures the delivery of accurate, reliable, and actionable market intelligence. Through the integration of multiple research approaches, rigorous validation processes, and expert analysis, we provide our clients with the insights needed to make informed strategic decisions and capitalize on market opportunities.

MarketGenics leverages a dedicated industry panel of experts and a comprehensive suite of paid databases to effectively collect, consolidate, and analyze market intelligence.
Our approach has consistently proven to be reliable and effective in generating accurate market insights, identifying key industry trends, and uncovering emerging business opportunities.
Through both primary and secondary research, we capture and analyze critical company-level data such as manufacturing footprints, including technical centers, R&D facilities, sales offices, and headquarters.
Our expert panel further enhances our ability to estimate market size for specific brands based on validated field-level intelligence.
Our data mining techniques incorporate both parametric and non-parametric methods, allowing for structured data collection, sorting, processing, and cleaning.
Demand projections are derived from large-scale data sets analyzed through proprietary algorithms, culminating in robust and reliable market sizing.
Research Approach
The bottom-up approach builds market estimates by starting with the smallest addressable market units and systematically aggregating them to create comprehensive market size projections.
This method begins with specific, granular data points and builds upward to create the complete market landscape.
Customer Analysis → Segmental Analysis → Geographical Analysis
The top-down approach starts with the broadest possible market data and systematically narrows it down through a series of filters and assumptions to arrive at specific market segments or opportunities.
This method begins with the big picture and works downward to increasingly specific market slices.
TAM → SAM → SOM


Research Methods
Desk / Secondary Research
While analysing the market, we extensively study secondary sources, directories, and databases to identify and collect information useful for this technical, market-oriented, and commercial report. Secondary sources that we utilize are not only the public sources, but it is a combination of Open Source, Associations, Paid Databases, MG Repository & Knowledgebase, and others.
- Company websites, annual reports, financial reports, broker reports, and investor presentations
- National government documents, statistical databases and reports
- News articles, press releases and web-casts specific to the companies operating in the market, Magazines, reports, and others
- We gather information from commercial data sources for deriving company specific data such as segmental revenue, share for geography, product revenue, and others
- Internal and external proprietary databases (industry-specific), relevant patent, and regulatory databases
- Governing Bodies, Government Organizations
- Relevant Authorities, Country-specific Associations for Industries
We also employ the model mapping approach to estimate the product level market data through the players' product portfolio
Primary Research
Primary research/ interviews is vital in analyzing the market. Most of the cases involves paid primary interviews. Primary sources include primary interviews through e-mail interactions, telephonic interviews, surveys as well as face-to-face interviews with the different stakeholders across the value chain including several industry experts.
| Type of Respondents | Number of Primaries |
|---|---|
| Tier 2/3 Suppliers | ~20 |
| Tier 1 Suppliers | ~25 |
| End-users | ~25 |
| Industry Expert/ Panel/ Consultant | ~30 |
| Total | ~100 |
MG Knowledgebase
• Repository of industry blog, newsletter and case studies
• Online platform covering detailed market reports, and company profiles
Forecasting Factors and Models
Forecasting Factors
- Historical Trends – Past market patterns, cycles, and major events that shaped how markets behave over time. Understanding past trends helps predict future behavior.
- Industry Factors – Specific characteristics of the industry like structure, regulations, and innovation cycles that affect market dynamics.
- Macroeconomic Factors – Economic conditions like GDP growth, inflation, and employment rates that affect how much money people have to spend.
- Demographic Factors – Population characteristics like age, income, and location that determine who can buy your product.
- Technology Factors – How quickly people adopt new technology and how much technology infrastructure exists.
- Regulatory Factors – Government rules, laws, and policies that can help or restrict market growth.
- Competitive Factors – Analyzing competition structure such as degree of competition and bargaining power of buyers and suppliers.
Forecasting Models / Techniques
Multiple Regression Analysis
- Identify and quantify factors that drive market changes
- Statistical modeling to establish relationships between market drivers and outcomes
Time Series Analysis – Seasonal Patterns
- Understand regular cyclical patterns in market demand
- Advanced statistical techniques to separate trend, seasonal, and irregular components
Time Series Analysis – Trend Analysis
- Identify underlying market growth patterns and momentum
- Statistical analysis of historical data to project future trends
Expert Opinion – Expert Interviews
- Gather deep industry insights and contextual understanding
- In-depth interviews with key industry stakeholders
Multi-Scenario Development
- Prepare for uncertainty by modeling different possible futures
- Creating optimistic, pessimistic, and most likely scenarios
Time Series Analysis – Moving Averages
- Sophisticated forecasting for complex time series data
- Auto-regressive integrated moving average models with seasonal components
Econometric Models
- Apply economic theory to market forecasting
- Sophisticated economic models that account for market interactions
Expert Opinion – Delphi Method
- Harness collective wisdom of industry experts
- Structured, multi-round expert consultation process
Monte Carlo Simulation
- Quantify uncertainty and probability distributions
- Thousands of simulations with varying input parameters
Research Analysis
Our research framework is built upon the fundamental principle of validating market intelligence from both demand and supply perspectives. This dual-sided approach ensures comprehensive market understanding and reduces the risk of single-source bias.
Demand-Side Analysis: We understand end-user/application behavior, preferences, and market needs along with the penetration of the product for specific application.
Supply-Side Analysis: We estimate overall market revenue, analyze the segmental share along with industry capacity, competitive landscape, and market structure.
Validation & Evaluation
Data triangulation is a validation technique that uses multiple methods, sources, or perspectives to examine the same research question, thereby increasing the credibility and reliability of research findings. In market research, triangulation serves as a quality assurance mechanism that helps identify and minimize bias, validate assumptions, and ensure accuracy in market estimates.
- Data Source Triangulation – Using multiple data sources to examine the same phenomenon
- Methodological Triangulation – Using multiple research methods to study the same research question
- Investigator Triangulation – Using multiple researchers or analysts to examine the same data
- Theoretical Triangulation – Using multiple theoretical perspectives to interpret the same data

Custom Market Research Services
We will customise the research for you, in case the report listed above does not meet your requirements.
Get 10% Free Customisation