Rough Terrain Crane Market Size, Share & Trends Analysis Report by Lifting Capacity (Up to 50 Tons, 50-100 Tons, 100-150 Tons, 150-200 Tons, Above 200 Tons), Boom Type, Drive Type, Fuel Type, Maximum Lifting Height, Axle Configuration, Outrigger Type, Cabin Type, End-use, Ownership Model, and Geography (North America, Europe, Asia Pacific, Middle East, Africa, and South America) – Global Industry Data, Trends, and Forecasts, 2026–2035
|
|
|
Segmental Data Insights |
|
|
Demand Trends |
|
|
Competitive Landscape |
|
|
Strategic Development |
|
|
Future Outlook & Opportunities |
|
Rough Terrain Crane Market Size, Share, and Growth
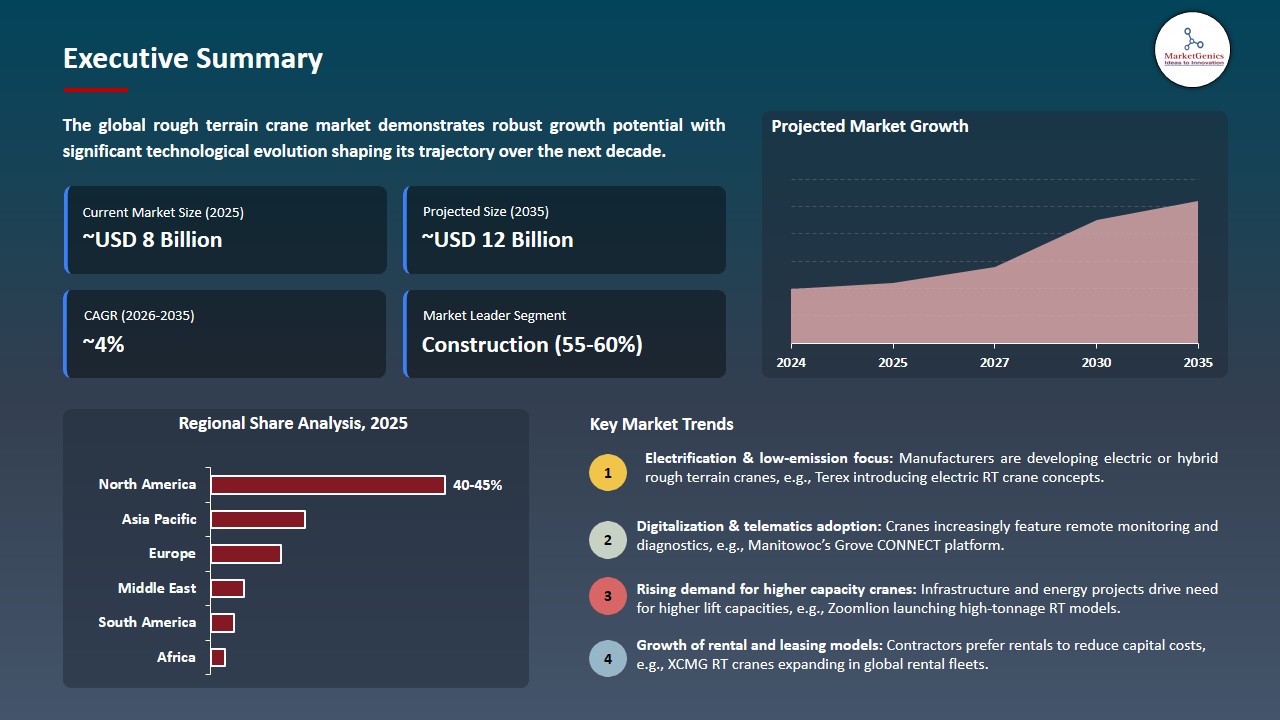
The global rough terrain crane market is exhibiting strong growth, with an estimated value of USD 8.1 billion in 2025 and USD 12.2 billion by 2035, achieving a CAGR of 4.2%, during the forecast period. The global rough terrain crane market is driven by rapid infrastructure development, industrial expansion, growing construction and energy projects, technological advancements in crane efficiency and safety, and rising adoption of versatile, all-terrain lifting solutions in challenging worksite environments.
"For Terex, this move aligns with our strategic focus on reducing cyclicality and accelerating the Company's growth," said Simon Meester, Terex President and Chief Executive Officer. "At the same time, we believe these Italian cranes businesses will strategically benefit from becoming part of Raimondi, a Milan-based lifting conglomerate that is a leader in the construction and heavy lifting sectors. We thank our cranes team members for their contributions to Terex and the industry, and we wish them great success in the years ahead."
The technological and digital connectivity are becoming a competitive center of growth within the rough terrain crane industry, with manufacturers building on to their value propositions of advanced telematics, real-time diagnostics, operator-assist systems, and remote fleet management tools to enhance lifting accuracy, improved job-site safety, less downtime, and total cost of ownership optimization in the name of contractors working in complex and remote locations. For instance, in April 2025, Manitowoc’s Grove GRT780 was launched with enhanced telematics in Grove CONNECT and enhanced operator interfaces. These innovations are hastening the process of embracing smarter cranes and driving the growth of the market by improving productivity and reducing the operating cost.
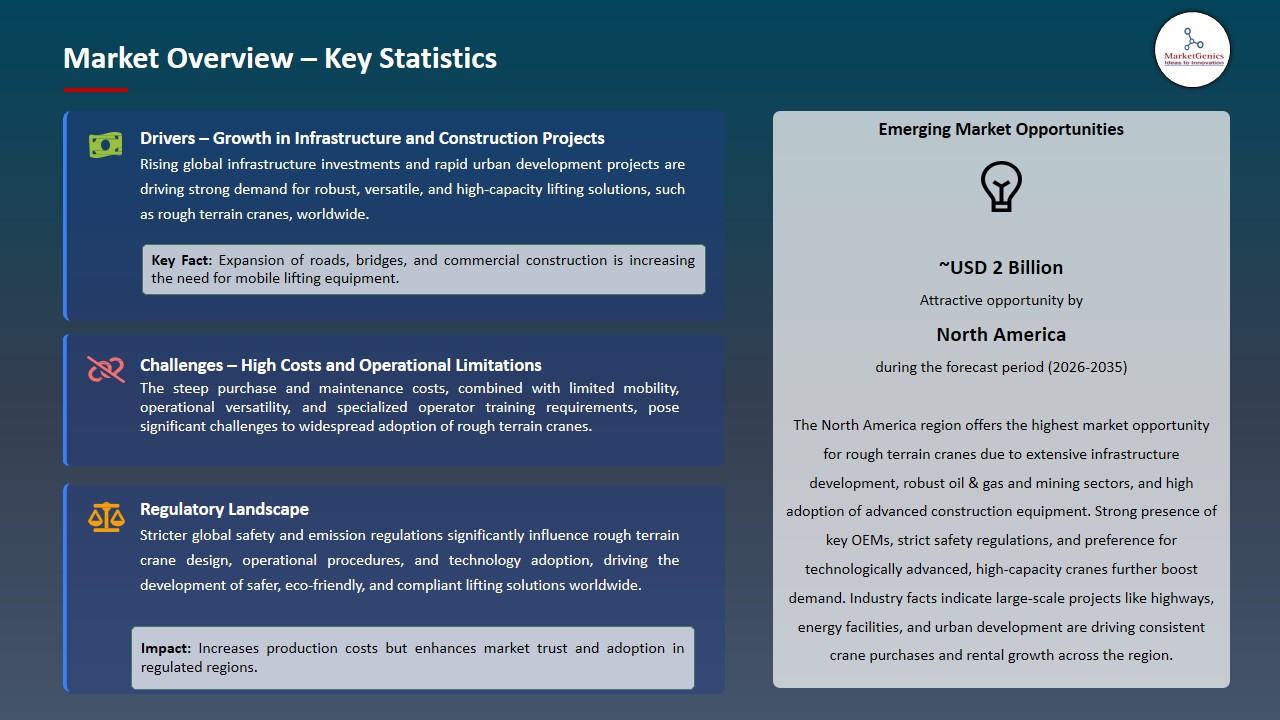
Additionally, the high rate of infrastructure development in the emerging and developed economies in highways, bridges, urban mass-transit systems, and energy projects is placing pressure on rough terrain cranes because such projects need multi-purpose lifting devices that can be depended on to work in tight spaces that may not be of smooth surfaces. For instance, in May 2025, Terex Rough Terrain Cranes was to distribute to Indonesia and release new TRT series models, such as TRT 80L and TRT 60 to respond to increasing regional construction demand as a result of the large-scale construction of infrastructure. This is increasing the value of rough terrain crane worldwide and driving rapid growth in the market by the deployment of more equipment in infrastructure-based projects.
Adjacent opportunities to the global rough terrain crane market include all-terrain cranes, mobile cranes, crawler cranes, telehandlers, and material handling equipment, as these segments share technological synergies, job-site applications, and customer bases. The use of innovations in these areas helps manufacturers to diversify and have cross-segment demand. The decision to expand to the adjacent markets boosts revenue as well as competitive positioning.
Rough Terrain Crane Market Dynamics and Trends
Driver: Heightened Demand for Sustainable and Zero‑Emission Rough Terrain Cranes
-
The manufacturers are being influenced toward product development that follows global sustainability requirements and as such the push is to have eco-friendly rough terrain cranes that minimize emissions and contribute to green building objectives. Increased urbanization, tougher environmental laws, and government subsidies on low-emission cranes are forcing construction firms to use cranes that fit the carbon-cutting requirements.
- The strategic change to decarbonized lifting solutions that do not affect performance and capacity. For instance, in October 2024, Tadano announced the eGR-1000XLL-1 EVOLT, a 100-ton rough terrain crane with an all-electric power supply, able to operate hours with zero-emission consequences and provide quieter operations that can be used in urban areas and are highly regulated.
- The expanded use of sustainable cranes is being observed within the market as additional OEMs invest in electric and hybrid technologies, especially in areas with high requirements on emission standards.
- Growing emphasis on environmental compliance and sustainability is catalyzing market adoption of green crane technologies and expanding opportunities in urban and regulated construction sectors.
Restraint: High Capital Investment and Ownership Costs Hindering Adoption
-
The substantial upfront capital outlay and continuous overall expenses of ownership associated with advanced rough terrain cranes continue to be a major market limitation, despite technological breakthroughs and expanding infrastructure development.
- High-end models with electrified powertrains, built-in telematics, and improved safety systems are associated with a large financial investment that may postpone the buying decision or make companies, especially small-and-middle contractors, prefer the options of renting equipment or obtaining used equipment.
- This financial burden may limit the fast expansion of the fleet in cost-sensitive areas, which will limit the market growth within a short period and the implementation of next-generation crane technologies.
- High acquisition and operating expenses can negatively influence market penetration by low-end consumers, influence procurement practices and slow down demand expansion in low-income economies and the price-elastic industries.
Opportunity: Expansion Through Electrification and Hybrid Power Technologies
-
The increase in demand of electrified and hybrid rough terrain crane is a considerable market potential because construction companies tend to address more the sustainability, efficiency of operations, and cost optimization in the long term. These hi-tech cranes can save fuel, maintenance needs, and also make it possible to meet the strict environmental standards and corporate ESG targets. For instance, Tadano’s launch of the fully electric eGR‑1000XLL‑1 exemplifies how OEMs are capitalizing on this trend by offering zero-emission cranes that maintain full lifting capacity and operational reliability.
- The introduction of electrified and hybrid technologies also creates new uses in urban infrastructure, indoor construction and noise-sensitive environments, where the existing diesel-powered cranes have limited operational capabilities. Offering green and high-performance solutions, the manufacturers can enhance differentiation and win the increased portion of eco-conscious contractors.
- The innovations of electrification and hybrids are contributing to rough terrain crane market growth, creating new customer groups, and leading to investment in the next-generation lifting equipment.
Key Trend: Integration of Telematics and AI‑Enabled Operational Intelligence
-
The rough terrain crane market is increasingly embracing advanced telematics and AI‑enabled operational intelligence to boost fleet efficiency, predictive maintenance, and safety. Developers are integrating connected systems whereby they remotely access real-time health information on the machines, usage reports, geofencing, alarms, and diagnostics, which assists the operators to optimize the use of the machines and minimize unexpected downtime.
- For instance, Terex that provides its T-Link Telematics Platform on rough terrain cranes, which gives its customers real-time performance data, remote fleet monitoring, maintenance alerts, crane status and location tracking to improve decision-making and service planning. The developments are providing value to fleet operators that have different assets in different regions by providing an opportunity to service them proactively, reporting specifically, and manage them with greater control.
- Telematics and AI are encouraging digitalization that promotes crane availability, reduces the lifecycle expenses, and improves competitive differentiation in the market.
Rough Terrain Crane Market Analysis and Segmental Data
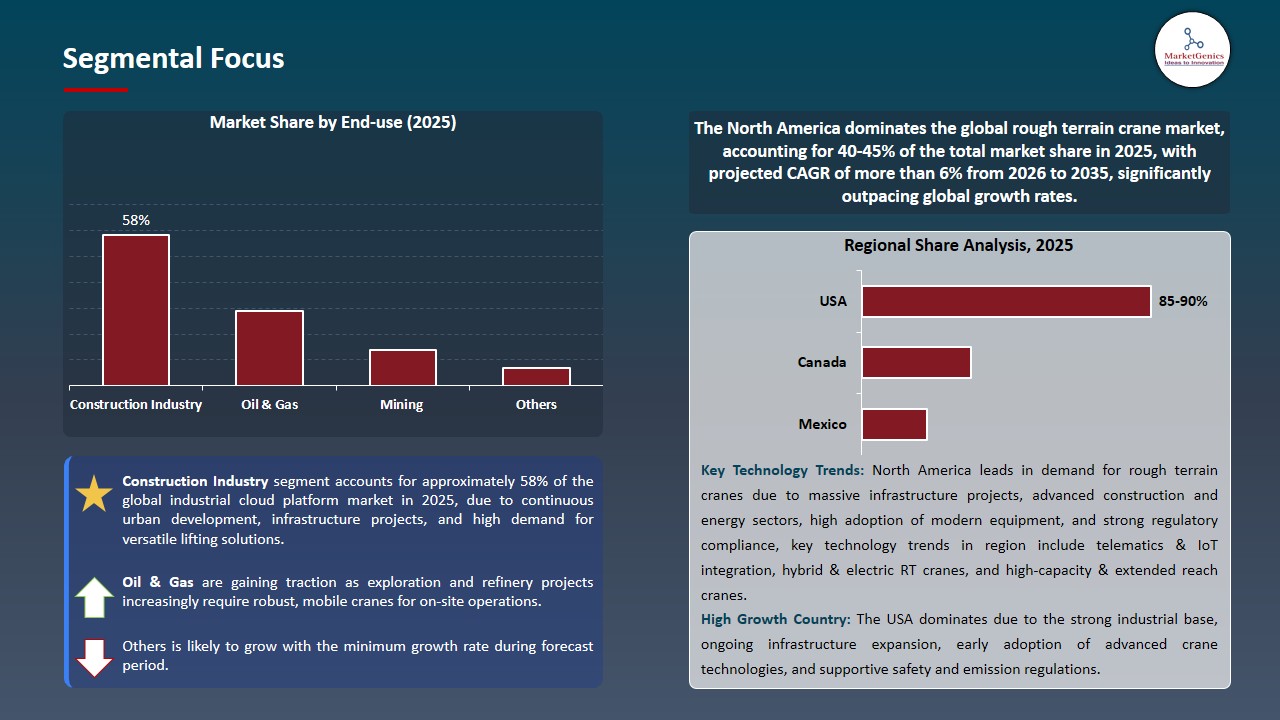
Construction Dominate Global Rough Terrain Crane Market
-
The construction segment dominates the global rough terrain crane market is driven by the wide application of the rough terrain cranes in the construction of the infrastructure (roads, bridges, commercial complexes and urban development) in both emerging and established economies. The crane rough terrain is particularly designed to meet the requirements of heavy lifting and also positioning of materials in rough or undeveloped ground and therefore, they are essential to construction sites with limited access or severe terrain conditions where the traditional crane needs a stable surface.
- Leading manufacturers have responded with construction‑focused product portfolios; for example, Manitowoc’s Grove rough terrain cranes are designed for “the toughest jobsite conditions,” offering extended boom reach, operator comfort features, and robust performance to meet heavy lifting needs on construction sites.
- The high proportion of construction is still the basis of the continued demand of rough terrain crane, which serves as a boost to the central position of the sector in terms of market growth and innovativeness.
North America Leads Global Rough Terrain Crane Market Demand
-
North America leads the rough terrain crane market is driven by the huge capital investments in the transport network, utilities and energy infrastructure in North America are driving the market towards rough terrain cranes with advanced features. For instance, Manitowoc showcased its new Grove GRT765 and GRT780 rough terrain crane models displayed at its Crane Days event in Shady Grove, Pennsylvania, that offered greater reach of the boom, productivity functionality, and integration of telematics to serve complex construction and industrial needs in the area.
- Additionally, sustainability requirements and technological adoption further bolster growth in the North American market. For instance, Tadano launched the eGR-1000XLL-1, the first fully electric rough terrain crane in the U.S. and Canada, which offers zero-emission operation and equipped with advanced monitoring systems, which comply with regional emissions regulations and customer demands of greener equipment.
- This regional management is enhancing OEM emphasis on customized product development, faster technology integration, and competitive positioning in the global markets.
Rough Terrain Crane Market Ecosystem
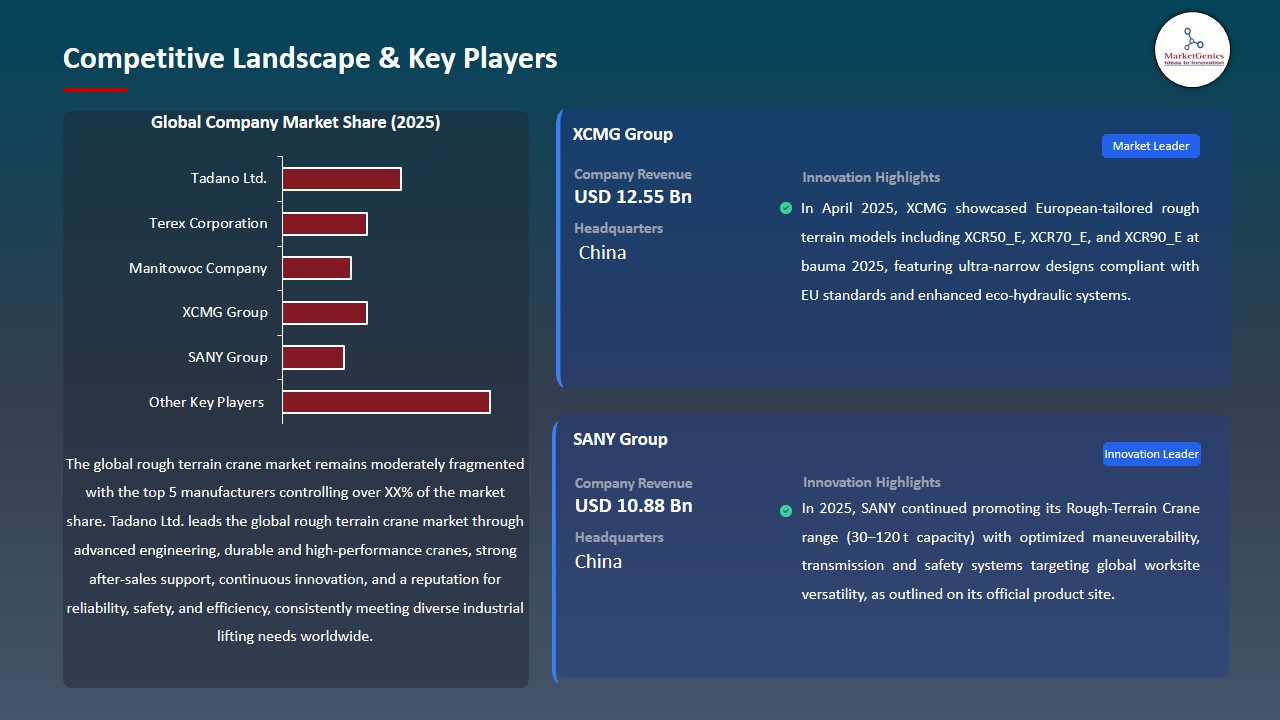
The global rough terrain crane market is moderately fragmented, with leading players such as Tadano Ltd., Terex Corporation, Manitowoc (Grove), XCMG Group, and SANY Group dominating through scale, distribution networks all over the world, and the latest lifting technologies, which improve performance and safety.
These companies increasingly focus on specialized solutions. For example, electrified rough terrain cranes by Tadano and the Grove CONNECT telematics systems that bring innovation to automation, real-time diagnostics, and sustainability to meet the needs of different worksites by Manitowoc.
Government bodies, infrastructure institutions, and R&D organizations are also catalyzing technology development; notably, funding under national AI and robotics missions supports research in AI, IoT, and autonomous systems that enhance construction safety and operational efficiency.
Key manufacturers prioritize product diversification and integrated solutions, offering hybrid/electric cranes, telematics-enabled fleet management, and predictive maintenance technologies to increase productivity, reduce emissions, and lower total cost of ownership.
Recent Development and Strategic Overview:
-
In November 2025, Terex finalized the divestiture of its Tower and Rough Terrain Crane businesses to Raimondi Cranes SpA, ending its direct manufacturing operations in this segment. This move reflects a strategic realignment, allowing Terex to focus on core growth areas while supporting industry consolidation and long-term market efficiency.
- In September 2025, XCMG Group officially introduced the XCA60_EV, recognized as the industry’s first hybrid all-terrain crane, at Vertikal Days UK. The company also announced plans to launch the XCR50_E rough-terrain crane for European markets, featuring an ultra-narrow design and optimized low-emission performance.
Report Scope
|
Detail |
|
|
Market Size in 2025 |
USD 8.1 Bn |
|
Market Forecast Value in 2035 |
USD 12.2 Bn |
|
Growth Rate (CAGR) |
4.2% |
|
Forecast Period |
2026 – 2035 |
|
Historical Data Available for |
2021 – 2024 |
|
Market Size Units |
US$ Billion for Value Thousand Units for Volume |
|
Report Format |
Electronic (PDF) + Excel |
|
North America |
Europe |
Asia Pacific |
Middle East |
Africa |
South America |
|
|
|
|
|
|
|
Companies Covered |
|||||
|
|
|
|
|
|
Rough Terrain Crane Market Segmentation and Highlights
|
Segment |
Sub-segment |
|
Rough Terrain Crane Market, By Lifting Capacity |
|
|
Rough Terrain Crane Market, By Boom Type |
|
|
Rough Terrain Crane Market, By Drive Type |
|
|
Rough Terrain Crane Market, By Fuel Type |
|
|
Rough Terrain Crane Market, By Maximum Lifting Height |
|
|
Rough Terrain Crane Market, By Axle Configuration |
|
|
Rough Terrain Crane Market, By Outrigger Type |
|
|
Rough Terrain Crane Market, By Cabin Type |
|
|
Rough Terrain Crane Market, By End-use |
|
|
Rough Terrain Crane Market, By Ownership Model |
|
Frequently Asked Questions
Table of Contents
- 1. Research Methodology and Assumptions
- 1.1. Definitions
- 1.2. Research Design and Approach
- 1.3. Data Collection Methods
- 1.4. Base Estimates and Calculations
- 1.5. Forecasting Models
- 1.5.1. Key Forecast Factors & Impact Analysis
- 1.6. Secondary Research
- 1.6.1. Open Sources
- 1.6.2. Paid Databases
- 1.6.3. Associations
- 1.7. Primary Research
- 1.7.1. Primary Sources
- 1.7.2. Primary Interviews with Stakeholders across Ecosystem
- 2. Executive Summary
- 2.1. Global Rough Terrain Crane Market Outlook
- 2.1.1. Rough Terrain Crane Market Size (Volume - Thousand Units and Value - US$ Bn), and Forecasts, 2021-2035
- 2.1.2. Compounded Annual Growth Rate Analysis
- 2.1.3. Growth Opportunity Analysis
- 2.1.4. Segmental Share Analysis
- 2.1.5. Geographical Share Analysis
- 2.2. Market Analysis and Facts
- 2.3. Supply-Demand Analysis
- 2.4. Competitive Benchmarking
- 2.5. Go-to- Market Strategy
- 2.5.1. Customer/ End-use Industry Assessment
- 2.5.2. Growth Opportunity Data, 2026-2035
- 2.5.2.1. Regional Data
- 2.5.2.2. Country Data
- 2.5.2.3. Segmental Data
- 2.5.3. Identification of Potential Market Spaces
- 2.5.4. GAP Analysis
- 2.5.5. Potential Attractive Price Points
- 2.5.6. Prevailing Market Risks & Challenges
- 2.5.7. Preferred Sales & Marketing Strategies
- 2.5.8. Key Recommendations and Analysis
- 2.5.9. A Way Forward
- 2.1. Global Rough Terrain Crane Market Outlook
- 3. Industry Data and Premium Insights
- 3.1. Global Industrial Machinery Industry Overview, 2025
- 3.1.1. Industrial Machinery Ecosystem Analysis
- 3.1.2. Key Trends for Industrial Machinery Industry
- 3.1.3. Regional Distribution for Industrial Machinery Industry
- 3.2. Supplier Customer Data
- 3.3. Technology Roadmap and Developments
- 3.4. Trade Analysis
- 3.4.1. Import & Export Analysis, 2025
- 3.4.2. Top Importing Countries
- 3.4.3. Top Exporting Countries
- 3.5. Trump Tariff Impact Analysis
- 3.5.1. Manufacturer
- 3.5.1.1. Based on the component & Raw material
- 3.5.2. Supply Chain
- 3.5.3. End Consumer
- 3.5.1. Manufacturer
- 3.6. Raw Material Analysis
- 3.1. Global Industrial Machinery Industry Overview, 2025
- 4. Market Overview
- 4.1. Market Dynamics
- 4.1.1. Drivers
- 4.1.1.1. Growth in global infrastructure and construction projects
- 4.1.1.2. Rising demand from mining, oil & gas, and energy sectors
- 4.1.1.3. Technological advancements improving safety, efficiency, and load capacity
- 4.1.2. Restraints
- 4.1.2.1. High initial purchase and maintenance costs
- 4.1.2.2. Availability of alternative lifting equipment and rental options
- 4.1.1. Drivers
- 4.2. Key Trend Analysis
- 4.3. Regulatory Framework
- 4.3.1. Key Regulations, Norms, and Subsidies, by Key Countries
- 4.3.2. Tariffs and Standards
- 4.3.3. Impact Analysis of Regulations on the Market
- 4.4. Value Chain Analysis
- 4.4.1. Component Suppliers
- 4.4.2. Manufacturing & Assembly
- 4.4.3. Distribution & Logistics
- 4.4.4. End Users / Applications
- 4.5. Cost Structure Analysis
- 4.5.1. Parameter’s Share for Cost Associated
- 4.5.2. COGP vs COGS
- 4.5.3. Profit Margin Analysis
- 4.6. Pricing Analysis
- 4.6.1. Regional Pricing Analysis
- 4.6.2. Segmental Pricing Trends
- 4.6.3. Factors Influencing Pricing
- 4.7. Porter’s Five Forces Analysis
- 4.8. PESTEL Analysis
- 4.9. Global Rough Terrain Crane Market Demand
- 4.9.1. Historical Market Size – in Volume (Thousand Units) and Value (US$ Bn), 2020-2024
- 4.9.2. Current and Future Market Size – in Volume (Thousand Units) and Value (US$ Bn), 2026–2035
- 4.9.2.1. Y-o-Y Growth Trends
- 4.9.2.2. Absolute $ Opportunity Assessment
- 4.1. Market Dynamics
- 5. Competition Landscape
- 5.1. Competition structure
- 5.1.1. Fragmented v/s consolidated
- 5.2. Company Share Analysis, 2025
- 5.2.1. Global Company Market Share
- 5.2.2. By Region
- 5.2.2.1. North America
- 5.2.2.2. Europe
- 5.2.2.3. Asia Pacific
- 5.2.2.4. Middle East
- 5.2.2.5. Africa
- 5.2.2.6. South America
- 5.3. Product Comparison Matrix
- 5.3.1. Specifications
- 5.3.2. Market Positioning
- 5.3.3. Pricing
- 5.1. Competition structure
- 6. Global Rough Terrain Crane Market Analysis, by Lifting Capacity
- 6.1. Key Segment Analysis
- 6.2. Rough Terrain Crane Market Size (Volume - Thousand Units and Value - US$ Bn), Analysis, and Forecasts, Lifting Capacity, 2021-2035
- 6.2.1. Up to 50 Tons
- 6.2.2. 50-100 Tons
- 6.2.3. 100-150 Tons
- 6.2.4. 150-200 Tons
- 6.2.5. Above 200 Tons
- 7. Global Rough Terrain Crane Market Analysis, by Boom Type
- 7.1. Key Segment Analysis
- 7.2. Rough Terrain Crane Market Size (Volume - Thousand Units and Value - US$ Bn), Analysis, and Forecasts, by Boom Type, 2021-2035
- 7.2.1. Telescopic Boom
- 7.2.2. Lattice Boom
- 7.2.3. Articulating Boom
- 7.2.4. Hybrid Boom
- 8. Global Rough Terrain Crane Market Analysis, by Drive Type
- 8.1. Key Segment Analysis
- 8.2. Rough Terrain Crane Market Size (Volume - Thousand Units and Value - US$ Bn), Analysis, and Forecasts, by Drive Type, 2021-2035
- 8.2.1. 4x4 Drive
- 8.2.2. 6x6 Drive
- 8.2.3. 8x8 Drive
- 8.2.4. Other Drive Configurations
- 9. Global Rough Terrain Crane Market Analysis, by Fuel Type
- 9.1. Key Segment Analysis
- 9.2. Rough Terrain Crane Market Size (Volume - Thousand Units and Value - US$ Bn), Analysis, and Forecasts, by Fuel Type, 2021-2035
- 9.2.1. Diesel
- 9.2.2. Electric
- 9.2.3. Hybrid
- 9.2.4. Alternative Fuels
- 10. Global Rough Terrain Crane Market Analysis, by Maximum Lifting Height
- 10.1. Key Segment Analysis
- 10.2. Rough Terrain Crane Market Size (Volume - Thousand Units and Value - US$ Bn), Analysis, and Forecasts, by Maximum Lifting Height, 2021-2035
- 10.2.1. Up to 20 meters
- 10.2.2. 20-40 meters
- 10.2.3. 40-60 meters
- 10.2.4. 60-80 meters
- 10.2.5. Above 80 meters
- 11. Global Rough Terrain Crane Market Analysis, by Axle Configuration
- 11.1. Key Segment Analysis
- 11.2. Rough Terrain Crane Market Size (Volume - Thousand Units and Value - US$ Bn), Analysis, and Forecasts, by Axle Configuration, 2021-2035
- 11.2.1. Two Axle
- 11.2.2. Three Axle
- 11.2.3. Four Axle
- 11.2.4. Multi-Axle (Above Four)
- 12. Global Rough Terrain Crane Market Analysis, by Outrigger Type
- 12.1. Key Segment Analysis
- 12.2. Rough Terrain Crane Market Size (Volume - Thousand Units and Value - US$ Bn), Analysis, and Forecasts, by Outrigger Type, 2021-2035
- 12.2.1. H-Pattern Outriggers
- 12.2.2. X-Pattern Outriggers
- 12.2.3. A-Frame Outriggers
- 12.2.4. Variable Position Outriggers
- 13. Global Rough Terrain Crane Market Analysis, by Cabin Type
- 13.1. Key Segment Analysis
- 13.2. Rough Terrain Crane Market Size (Volume - Thousand Units and Value - US$ Bn), Analysis, and Forecasts, by Cabin Type, 2021-2035
- 13.2.1. Fixed Cabin
- 13.2.2. Tilting Cabin
- 13.2.3. Elevating Cabin
- 13.2.4. Rotating Cabin
- 14. Global Rough Terrain Crane Market Analysis, by End-use
- 14.1. Key Segment Analysis
- 14.2. Rough Terrain Crane Market Size (Volume - Thousand Units and Value - US$ Bn), Analysis, and Forecasts, by End-use, 2021-2035
- 14.2.1. Construction Industry
- 14.2.2. Oil & Gas
- 14.2.3. Mining
- 14.2.4. Power & Energy Sector
- 14.2.5. Industrial Manufacturing
- 14.2.6. Ports & Maritime
- 14.2.7. Transportation & Logistics
- 14.2.8. Renewable Energy Projects
- 14.2.9. Telecommunications
- 14.2.10. Defense & Military
- 14.2.11. Disaster Management & Emergency Services
- 14.2.12. Others
- 15. Global Rough Terrain Crane Market Analysis, by Ownership Model
- 15.1. Key Segment Analysis
- 15.2. Rough Terrain Crane Market Size (Volume - Thousand Units and Value - US$ Bn), Analysis, and Forecasts, by Ownership Model, 2021-2035
- 15.2.1. Purchase/Direct Sale
- 15.2.2. Rental/Leasing
- 15.2.3. Contract Hiring
- 16. Global Rough Terrain Crane Market Analysis, by Region
- 16.1. Key Findings
- 16.2. Rough Terrain Crane Market Size (Value - US$ Mn), Analysis, and Forecasts, by Region, 2021-2035
- 16.2.1. North America
- 16.2.2. Europe
- 16.2.3. Asia Pacific
- 16.2.4. Middle East
- 16.2.5. Africa
- 16.2.6. South America
- 17. North America Rough Terrain Crane Market Analysis
- 17.1. Key Segment Analysis
- 17.2. Regional Snapshot
- 17.3. North America Rough Terrain Crane Market Size (Volume - Thousand Units and Value - US$ Bn), Analysis, and Forecasts, 2021-2035
- 17.3.1. Lifting Capacity
- 17.3.2. Boom Type
- 17.3.3. Drive Type
- 17.3.4. Fuel Type
- 17.3.5. Maximum Lifting Height
- 17.3.6. Axle Configuration
- 17.3.7. Outrigger Type
- 17.3.8. Cabin Type
- 17.3.9. End-use
- 17.3.10. Ownership Model
- 17.3.11. Country
- 17.3.11.1. USA
- 17.3.11.2. Canada
- 17.3.11.3. Mexico
- 17.4. USA Rough Terrain Crane Market
- 17.4.1. Country Segmental Analysis
- 17.4.2. Lifting Capacity
- 17.4.3. Boom Type
- 17.4.4. Drive Type
- 17.4.5. Fuel Type
- 17.4.6. Maximum Lifting Height
- 17.4.7. Axle Configuration
- 17.4.8. Outrigger Type
- 17.4.9. Cabin Type
- 17.4.10. End-use
- 17.4.11. Ownership Model
- 17.5. Canada Rough Terrain Crane Market
- 17.5.1. Country Segmental Analysis
- 17.5.2. Lifting Capacity
- 17.5.3. Boom Type
- 17.5.4. Drive Type
- 17.5.5. Fuel Type
- 17.5.6. Maximum Lifting Height
- 17.5.7. Axle Configuration
- 17.5.8. Outrigger Type
- 17.5.9. Cabin Type
- 17.5.10. End-use
- 17.5.11. Ownership Model
- 17.6. Mexico Rough Terrain Crane Market
- 17.6.1. Country Segmental Analysis
- 17.6.2. Lifting Capacity
- 17.6.3. Boom Type
- 17.6.4. Drive Type
- 17.6.5. Fuel Type
- 17.6.6. Maximum Lifting Height
- 17.6.7. Axle Configuration
- 17.6.8. Outrigger Type
- 17.6.9. Cabin Type
- 17.6.10. End-use
- 17.6.11. Ownership Model
- 18. Europe Rough Terrain Crane Market Analysis
- 18.1. Key Segment Analysis
- 18.2. Regional Snapshot
- 18.3. Europe Rough Terrain Crane Market Size (Volume - Thousand Units and Value - US$ Bn), Analysis, and Forecasts, 2021-2035
- 18.3.1. Lifting Capacity
- 18.3.2. Boom Type
- 18.3.3. Drive Type
- 18.3.4. Fuel Type
- 18.3.5. Maximum Lifting Height
- 18.3.6. Axle Configuration
- 18.3.7. Outrigger Type
- 18.3.8. Cabin Type
- 18.3.9. End-use
- 18.3.10. Ownership Model
- 18.3.11. Country
- 18.3.11.1. Germany
- 18.3.11.2. United Kingdom
- 18.3.11.3. France
- 18.3.11.4. Italy
- 18.3.11.5. Spain
- 18.3.11.6. Netherlands
- 18.3.11.7. Nordic Countries
- 18.3.11.8. Poland
- 18.3.11.9. Russia & CIS
- 18.3.11.10. Rest of Europe
- 18.4. Germany Rough Terrain Crane Market
- 18.4.1. Country Segmental Analysis
- 18.4.2. Lifting Capacity
- 18.4.3. Boom Type
- 18.4.4. Drive Type
- 18.4.5. Fuel Type
- 18.4.6. Maximum Lifting Height
- 18.4.7. Axle Configuration
- 18.4.8. Outrigger Type
- 18.4.9. Cabin Type
- 18.4.10. End-use
- 18.4.11. Ownership Model
- 18.5. United Kingdom Rough Terrain Crane Market
- 18.5.1. Country Segmental Analysis
- 18.5.2. Lifting Capacity
- 18.5.3. Boom Type
- 18.5.4. Drive Type
- 18.5.5. Fuel Type
- 18.5.6. Maximum Lifting Height
- 18.5.7. Axle Configuration
- 18.5.8. Outrigger Type
- 18.5.9. Cabin Type
- 18.5.10. End-use
- 18.5.11. Ownership Model
- 18.6. France Rough Terrain Crane Market
- 18.6.1. Country Segmental Analysis
- 18.6.2. Lifting Capacity
- 18.6.3. Boom Type
- 18.6.4. Drive Type
- 18.6.5. Fuel Type
- 18.6.6. Maximum Lifting Height
- 18.6.7. Axle Configuration
- 18.6.8. Outrigger Type
- 18.6.9. Cabin Type
- 18.6.10. End-use
- 18.6.11. Ownership Model
- 18.7. Italy Rough Terrain Crane Market
- 18.7.1. Country Segmental Analysis
- 18.7.2. Lifting Capacity
- 18.7.3. Boom Type
- 18.7.4. Drive Type
- 18.7.5. Fuel Type
- 18.7.6. Maximum Lifting Height
- 18.7.7. Axle Configuration
- 18.7.8. Outrigger Type
- 18.7.9. Cabin Type
- 18.7.10. End-use
- 18.7.11. Ownership Model
- 18.8. Spain Rough Terrain Crane Market
- 18.8.1. Country Segmental Analysis
- 18.8.2. Lifting Capacity
- 18.8.3. Boom Type
- 18.8.4. Drive Type
- 18.8.5. Fuel Type
- 18.8.6. Maximum Lifting Height
- 18.8.7. Axle Configuration
- 18.8.8. Outrigger Type
- 18.8.9. Cabin Type
- 18.8.10. End-use
- 18.8.11. Ownership Model
- 18.9. Netherlands Rough Terrain Crane Market
- 18.9.1. Country Segmental Analysis
- 18.9.2. Lifting Capacity
- 18.9.3. Boom Type
- 18.9.4. Drive Type
- 18.9.5. Fuel Type
- 18.9.6. Maximum Lifting Height
- 18.9.7. Axle Configuration
- 18.9.8. Outrigger Type
- 18.9.9. Cabin Type
- 18.9.10. End-use
- 18.9.11. Ownership Model
- 18.10. Nordic Countries Rough Terrain Crane Market
- 18.10.1. Country Segmental Analysis
- 18.10.2. Lifting Capacity
- 18.10.3. Boom Type
- 18.10.4. Drive Type
- 18.10.5. Fuel Type
- 18.10.6. Maximum Lifting Height
- 18.10.7. Axle Configuration
- 18.10.8. Outrigger Type
- 18.10.9. Cabin Type
- 18.10.10. End-use
- 18.10.11. Ownership Model
- 18.11. Poland Rough Terrain Crane Market
- 18.11.1. Country Segmental Analysis
- 18.11.2. Lifting Capacity
- 18.11.3. Boom Type
- 18.11.4. Drive Type
- 18.11.5. Fuel Type
- 18.11.6. Maximum Lifting Height
- 18.11.7. Axle Configuration
- 18.11.8. Outrigger Type
- 18.11.9. Cabin Type
- 18.11.10. End-use
- 18.11.11. Ownership Model
- 18.12. Russia & CIS Rough Terrain Crane Market
- 18.12.1. Country Segmental Analysis
- 18.12.2. Lifting Capacity
- 18.12.3. Boom Type
- 18.12.4. Drive Type
- 18.12.5. Fuel Type
- 18.12.6. Maximum Lifting Height
- 18.12.7. Axle Configuration
- 18.12.8. Outrigger Type
- 18.12.9. Cabin Type
- 18.12.10. End-use
- 18.12.11. Ownership Model
- 18.13. Rest of Europe Rough Terrain Crane Market
- 18.13.1. Country Segmental Analysis
- 18.13.2. Lifting Capacity
- 18.13.3. Boom Type
- 18.13.4. Drive Type
- 18.13.5. Fuel Type
- 18.13.6. Maximum Lifting Height
- 18.13.7. Axle Configuration
- 18.13.8. Outrigger Type
- 18.13.9. Cabin Type
- 18.13.10. End-use
- 18.13.11. Ownership Model
- 19. Asia Pacific Rough Terrain Crane Market Analysis
- 19.1. Key Segment Analysis
- 19.2. Regional Snapshot
- 19.3. Asia Pacific Rough Terrain Crane Market Size (Volume - Thousand Units and Value - US$ Bn), Analysis, and Forecasts, 2021-2035
- 19.3.1. Lifting Capacity
- 19.3.2. Boom Type
- 19.3.3. Drive Type
- 19.3.4. Fuel Type
- 19.3.5. Maximum Lifting Height
- 19.3.6. Axle Configuration
- 19.3.7. Outrigger Type
- 19.3.8. Cabin Type
- 19.3.9. End-use
- 19.3.10. Ownership Model
- 19.3.11. Country
- 19.3.11.1. China
- 19.3.11.2. India
- 19.3.11.3. Japan
- 19.3.11.4. South Korea
- 19.3.11.5. Australia and New Zealand
- 19.3.11.6. Indonesia
- 19.3.11.7. Malaysia
- 19.3.11.8. Thailand
- 19.3.11.9. Vietnam
- 19.3.11.10. Rest of Asia Pacific
- 19.4. China Rough Terrain Crane Market
- 19.4.1. Country Segmental Analysis
- 19.4.2. Lifting Capacity
- 19.4.3. Boom Type
- 19.4.4. Drive Type
- 19.4.5. Fuel Type
- 19.4.6. Maximum Lifting Height
- 19.4.7. Axle Configuration
- 19.4.8. Outrigger Type
- 19.4.9. Cabin Type
- 19.4.10. End-use
- 19.4.11. Ownership Model
- 19.5. India Rough Terrain Crane Market
- 19.5.1. Country Segmental Analysis
- 19.5.2. Lifting Capacity
- 19.5.3. Boom Type
- 19.5.4. Drive Type
- 19.5.5. Fuel Type
- 19.5.6. Maximum Lifting Height
- 19.5.7. Axle Configuration
- 19.5.8. Outrigger Type
- 19.5.9. Cabin Type
- 19.5.10. End-use
- 19.5.11. Ownership Model
- 19.6. Japan Rough Terrain Crane Market
- 19.6.1. Country Segmental Analysis
- 19.6.2. Lifting Capacity
- 19.6.3. Boom Type
- 19.6.4. Drive Type
- 19.6.5. Fuel Type
- 19.6.6. Maximum Lifting Height
- 19.6.7. Axle Configuration
- 19.6.8. Outrigger Type
- 19.6.9. Cabin Type
- 19.6.10. End-use
- 19.6.11. Ownership Model
- 19.7. South Korea Rough Terrain Crane Market
- 19.7.1. Country Segmental Analysis
- 19.7.2. Lifting Capacity
- 19.7.3. Boom Type
- 19.7.4. Drive Type
- 19.7.5. Fuel Type
- 19.7.6. Maximum Lifting Height
- 19.7.7. Axle Configuration
- 19.7.8. Outrigger Type
- 19.7.9. Cabin Type
- 19.7.10. End-use
- 19.7.11. Ownership Model
- 19.8. Australia and New Zealand Rough Terrain Crane Market
- 19.8.1. Country Segmental Analysis
- 19.8.2. Lifting Capacity
- 19.8.3. Boom Type
- 19.8.4. Drive Type
- 19.8.5. Fuel Type
- 19.8.6. Maximum Lifting Height
- 19.8.7. Axle Configuration
- 19.8.8. Outrigger Type
- 19.8.9. Cabin Type
- 19.8.10. End-use
- 19.8.11. Ownership Model
- 19.9. Indonesia Rough Terrain Crane Market
- 19.9.1. Country Segmental Analysis
- 19.9.2. Lifting Capacity
- 19.9.3. Boom Type
- 19.9.4. Drive Type
- 19.9.5. Fuel Type
- 19.9.6. Maximum Lifting Height
- 19.9.7. Axle Configuration
- 19.9.8. Outrigger Type
- 19.9.9. Cabin Type
- 19.9.10. End-use
- 19.9.11. Ownership Model
- 19.10. Malaysia Rough Terrain Crane Market
- 19.10.1. Country Segmental Analysis
- 19.10.2. Lifting Capacity
- 19.10.3. Boom Type
- 19.10.4. Drive Type
- 19.10.5. Fuel Type
- 19.10.6. Maximum Lifting Height
- 19.10.7. Axle Configuration
- 19.10.8. Outrigger Type
- 19.10.9. Cabin Type
- 19.10.10. End-use
- 19.10.11. Ownership Model
- 19.11. Thailand Rough Terrain Crane Market
- 19.11.1. Country Segmental Analysis
- 19.11.2. Lifting Capacity
- 19.11.3. Boom Type
- 19.11.4. Drive Type
- 19.11.5. Fuel Type
- 19.11.6. Maximum Lifting Height
- 19.11.7. Axle Configuration
- 19.11.8. Outrigger Type
- 19.11.9. Cabin Type
- 19.11.10. End-use
- 19.11.11. Ownership Model
- 19.12. Vietnam Rough Terrain Crane Market
- 19.12.1. Country Segmental Analysis
- 19.12.2. Lifting Capacity
- 19.12.3. Boom Type
- 19.12.4. Drive Type
- 19.12.5. Fuel Type
- 19.12.6. Maximum Lifting Height
- 19.12.7. Axle Configuration
- 19.12.8. Outrigger Type
- 19.12.9. Cabin Type
- 19.12.10. End-use
- 19.12.11. Ownership Model
- 19.13. Rest of Asia Pacific Rough Terrain Crane Market
- 19.13.1. Country Segmental Analysis
- 19.13.2. Lifting Capacity
- 19.13.3. Boom Type
- 19.13.4. Drive Type
- 19.13.5. Fuel Type
- 19.13.6. Maximum Lifting Height
- 19.13.7. Axle Configuration
- 19.13.8. Outrigger Type
- 19.13.9. Cabin Type
- 19.13.10. End-use
- 19.13.11. Ownership Model
- 20. Middle East Rough Terrain Crane Market Analysis
- 20.1. Key Segment Analysis
- 20.2. Regional Snapshot
- 20.3. Middle East Rough Terrain Crane Market Size (Volume - Thousand Units and Value - US$ Bn), Analysis, and Forecasts, 2021-2035
- 20.3.1. Lifting Capacity
- 20.3.2. Boom Type
- 20.3.3. Drive Type
- 20.3.4. Fuel Type
- 20.3.5. Maximum Lifting Height
- 20.3.6. Axle Configuration
- 20.3.7. Outrigger Type
- 20.3.8. Cabin Type
- 20.3.9. End-use
- 20.3.10. Ownership Model
- 20.3.11. Country
- 20.3.11.1. Turkey
- 20.3.11.2. UAE
- 20.3.11.3. Saudi Arabia
- 20.3.11.4. Israel
- 20.3.11.5. Rest of Middle East
- 20.4. Turkey Rough Terrain Crane Market
- 20.4.1. Country Segmental Analysis
- 20.4.2. Lifting Capacity
- 20.4.3. Boom Type
- 20.4.4. Drive Type
- 20.4.5. Fuel Type
- 20.4.6. Maximum Lifting Height
- 20.4.7. Axle Configuration
- 20.4.8. Outrigger Type
- 20.4.9. Cabin Type
- 20.4.10. End-use
- 20.4.11. Ownership Model
- 20.5. UAE Rough Terrain Crane Market
- 20.5.1. Country Segmental Analysis
- 20.5.2. Lifting Capacity
- 20.5.3. Boom Type
- 20.5.4. Drive Type
- 20.5.5. Fuel Type
- 20.5.6. Maximum Lifting Height
- 20.5.7. Axle Configuration
- 20.5.8. Outrigger Type
- 20.5.9. Cabin Type
- 20.5.10. End-use
- 20.5.11. Ownership Model
- 20.6. Saudi Arabia Rough Terrain Crane Market
- 20.6.1. Country Segmental Analysis
- 20.6.2. Lifting Capacity
- 20.6.3. Boom Type
- 20.6.4. Drive Type
- 20.6.5. Fuel Type
- 20.6.6. Maximum Lifting Height
- 20.6.7. Axle Configuration
- 20.6.8. Outrigger Type
- 20.6.9. Cabin Type
- 20.6.10. End-use
- 20.6.11. Ownership Model
- 20.7. Israel Rough Terrain Crane Market
- 20.7.1. Country Segmental Analysis
- 20.7.2. Lifting Capacity
- 20.7.3. Boom Type
- 20.7.4. Drive Type
- 20.7.5. Fuel Type
- 20.7.6. Maximum Lifting Height
- 20.7.7. Axle Configuration
- 20.7.8. Outrigger Type
- 20.7.9. Cabin Type
- 20.7.10. End-use
- 20.7.11. Ownership Model
- 20.8. Rest of Middle East Rough Terrain Crane Market
- 20.8.1. Country Segmental Analysis
- 20.8.2. Lifting Capacity
- 20.8.3. Boom Type
- 20.8.4. Drive Type
- 20.8.5. Fuel Type
- 20.8.6. Maximum Lifting Height
- 20.8.7. Axle Configuration
- 20.8.8. Outrigger Type
- 20.8.9. Cabin Type
- 20.8.10. End-use
- 20.8.11. Ownership Model
- 21. Africa Rough Terrain Crane Market Analysis
- 21.1. Key Segment Analysis
- 21.2. Regional Snapshot
- 21.3. Africa Rough Terrain Crane Market Size (Volume - Thousand Units and Value - US$ Bn), Analysis, and Forecasts, 2021-2035
- 21.3.1. Lifting Capacity
- 21.3.2. Boom Type
- 21.3.3. Drive Type
- 21.3.4. Fuel Type
- 21.3.5. Maximum Lifting Height
- 21.3.6. Axle Configuration
- 21.3.7. Outrigger Type
- 21.3.8. Cabin Type
- 21.3.9. End-use
- 21.3.10. Ownership Model
- 21.3.11. Country
- 21.3.11.1. South Africa
- 21.3.11.2. Egypt
- 21.3.11.3. Nigeria
- 21.3.11.4. Algeria
- 21.3.11.5. Rest of Africa
- 21.4. South Africa Rough Terrain Crane Market
- 21.4.1. Country Segmental Analysis
- 21.4.2. Lifting Capacity
- 21.4.3. Boom Type
- 21.4.4. Drive Type
- 21.4.5. Fuel Type
- 21.4.6. Maximum Lifting Height
- 21.4.7. Axle Configuration
- 21.4.8. Outrigger Type
- 21.4.9. Cabin Type
- 21.4.10. End-use
- 21.4.11. Ownership Model
- 21.5. Egypt Rough Terrain Crane Market
- 21.5.1. Country Segmental Analysis
- 21.5.2. Lifting Capacity
- 21.5.3. Boom Type
- 21.5.4. Drive Type
- 21.5.5. Fuel Type
- 21.5.6. Maximum Lifting Height
- 21.5.7. Axle Configuration
- 21.5.8. Outrigger Type
- 21.5.9. Cabin Type
- 21.5.10. End-use
- 21.5.11. Ownership Model
- 21.6. Nigeria Rough Terrain Crane Market
- 21.6.1. Country Segmental Analysis
- 21.6.2. Lifting Capacity
- 21.6.3. Boom Type
- 21.6.4. Drive Type
- 21.6.5. Fuel Type
- 21.6.6. Maximum Lifting Height
- 21.6.7. Axle Configuration
- 21.6.8. Outrigger Type
- 21.6.9. Cabin Type
- 21.6.10. End-use
- 21.6.11. Ownership Model
- 21.7. Algeria Rough Terrain Crane Market
- 21.7.1. Country Segmental Analysis
- 21.7.2. Lifting Capacity
- 21.7.3. Boom Type
- 21.7.4. Drive Type
- 21.7.5. Fuel Type
- 21.7.6. Maximum Lifting Height
- 21.7.7. Axle Configuration
- 21.7.8. Outrigger Type
- 21.7.9. Cabin Type
- 21.7.10. End-use
- 21.7.11. Ownership Model
- 21.8. Rest of Africa Rough Terrain Crane Market
- 21.8.1. Country Segmental Analysis
- 21.8.2. Lifting Capacity
- 21.8.3. Boom Type
- 21.8.4. Drive Type
- 21.8.5. Fuel Type
- 21.8.6. Maximum Lifting Height
- 21.8.7. Axle Configuration
- 21.8.8. Outrigger Type
- 21.8.9. Cabin Type
- 21.8.10. End-use
- 21.8.11. Ownership Model
- 22. South America Rough Terrain Crane Market Analysis
- 22.1. Key Segment Analysis
- 22.2. Regional Snapshot
- 22.3. South America Rough Terrain Crane Market Size (Volume - Thousand Units and Value - US$ Bn), Analysis, and Forecasts, 2021-2035
- 22.3.1. Lifting Capacity
- 22.3.2. Boom Type
- 22.3.3. Drive Type
- 22.3.4. Fuel Type
- 22.3.5. Maximum Lifting Height
- 22.3.6. Axle Configuration
- 22.3.7. Outrigger Type
- 22.3.8. Cabin Type
- 22.3.9. End-use
- 22.3.10. Ownership Model
- 22.3.11. Country
- 22.3.11.1. Brazil
- 22.3.11.2. Argentina
- 22.3.11.3. Rest of South America
- 22.4. Brazil Rough Terrain Crane Market
- 22.4.1. Country Segmental Analysis
- 22.4.2. Lifting Capacity
- 22.4.3. Boom Type
- 22.4.4. Drive Type
- 22.4.5. Fuel Type
- 22.4.6. Maximum Lifting Height
- 22.4.7. Axle Configuration
- 22.4.8. Outrigger Type
- 22.4.9. Cabin Type
- 22.4.10. End-use
- 22.4.11. Ownership Model
- 22.5. Argentina Rough Terrain Crane Market
- 22.5.1. Country Segmental Analysis
- 22.5.2. Lifting Capacity
- 22.5.3. Boom Type
- 22.5.4. Drive Type
- 22.5.5. Fuel Type
- 22.5.6. Maximum Lifting Height
- 22.5.7. Axle Configuration
- 22.5.8. Outrigger Type
- 22.5.9. Cabin Type
- 22.5.10. End-use
- 22.5.11. Ownership Model
- 22.6. Rest of South America Rough Terrain Crane Market
- 22.6.1. Country Segmental Analysis
- 22.6.2. Lifting Capacity
- 22.6.3. Boom Type
- 22.6.4. Drive Type
- 22.6.5. Fuel Type
- 22.6.6. Maximum Lifting Height
- 22.6.7. Axle Configuration
- 22.6.8. Outrigger Type
- 22.6.9. Cabin Type
- 22.6.10. End-use
- 22.6.11. Ownership Model
- 23. Key Players/ Company Profile
- 23.1. Altec Inc.
- 23.1.1. Company Details/ Overview
- 23.1.2. Company Financials
- 23.1.3. Key Customers and Competitors
- 23.1.4. Business/ Industry Portfolio
- 23.1.5. Product Portfolio/ Specification Details
- 23.1.6. Pricing Data
- 23.1.7. Strategic Overview
- 23.1.8. Recent Developments
- 23.2. Böcker Maschinenwerke
- 23.3. Elliott Equipment Company
- 23.4. Foton Lovol International Heavy Industry
- 23.5. Furukawa Unic Corporation
- 23.6. Jekko SRL
- 23.7. Kato Works Co. Ltd.
- 23.8. Kobelco Construction Machinery
- 23.9. Liebherr Group
- 23.10. Link-Belt Cranes
- 23.11. Manitex International
- 23.12. Manitowoc Company
- 23.13. Palfinger AG
- 23.14. Sany Group
- 23.15. Sinoboom Intelligent Equipment
- 23.16. Sumitomo Heavy Industries
- 23.17. Tadano Ltd.
- 23.18. Terex Corporation
- 23.19. Weihua Group
- 23.20. Wolffkran
- 23.21. XCMG Group
- 23.22. Yantai Haishan Construction Machinery
- 23.23. Zoomlion Heavy Industry Science & Technology
- 23.24. Other Key Players
- 23.1. Altec Inc.
Note* - This is just tentative list of players. While providing the report, we will cover more number of players based on their revenue and share for each geography
Research Design
Our research design integrates both demand-side and supply-side analysis through a balanced combination of primary and secondary research methodologies. By utilizing both bottom-up and top-down approaches alongside rigorous data triangulation methods, we deliver robust market intelligence that supports strategic decision-making.
MarketGenics' comprehensive research design framework ensures the delivery of accurate, reliable, and actionable market intelligence. Through the integration of multiple research approaches, rigorous validation processes, and expert analysis, we provide our clients with the insights needed to make informed strategic decisions and capitalize on market opportunities.

MarketGenics leverages a dedicated industry panel of experts and a comprehensive suite of paid databases to effectively collect, consolidate, and analyze market intelligence.
Our approach has consistently proven to be reliable and effective in generating accurate market insights, identifying key industry trends, and uncovering emerging business opportunities.
Through both primary and secondary research, we capture and analyze critical company-level data such as manufacturing footprints, including technical centers, R&D facilities, sales offices, and headquarters.
Our expert panel further enhances our ability to estimate market size for specific brands based on validated field-level intelligence.
Our data mining techniques incorporate both parametric and non-parametric methods, allowing for structured data collection, sorting, processing, and cleaning.
Demand projections are derived from large-scale data sets analyzed through proprietary algorithms, culminating in robust and reliable market sizing.
Research Approach
The bottom-up approach builds market estimates by starting with the smallest addressable market units and systematically aggregating them to create comprehensive market size projections.
This method begins with specific, granular data points and builds upward to create the complete market landscape.
Customer Analysis → Segmental Analysis → Geographical Analysis
The top-down approach starts with the broadest possible market data and systematically narrows it down through a series of filters and assumptions to arrive at specific market segments or opportunities.
This method begins with the big picture and works downward to increasingly specific market slices.
TAM → SAM → SOM


Research Methods
Desk / Secondary Research
While analysing the market, we extensively study secondary sources, directories, and databases to identify and collect information useful for this technical, market-oriented, and commercial report. Secondary sources that we utilize are not only the public sources, but it is a combination of Open Source, Associations, Paid Databases, MG Repository & Knowledgebase, and others.
- Company websites, annual reports, financial reports, broker reports, and investor presentations
- National government documents, statistical databases and reports
- News articles, press releases and web-casts specific to the companies operating in the market, Magazines, reports, and others
- We gather information from commercial data sources for deriving company specific data such as segmental revenue, share for geography, product revenue, and others
- Internal and external proprietary databases (industry-specific), relevant patent, and regulatory databases
- Governing Bodies, Government Organizations
- Relevant Authorities, Country-specific Associations for Industries
We also employ the model mapping approach to estimate the product level market data through the players' product portfolio
Primary Research
Primary research/ interviews is vital in analyzing the market. Most of the cases involves paid primary interviews. Primary sources include primary interviews through e-mail interactions, telephonic interviews, surveys as well as face-to-face interviews with the different stakeholders across the value chain including several industry experts.
| Type of Respondents | Number of Primaries |
|---|---|
| Tier 2/3 Suppliers | ~20 |
| Tier 1 Suppliers | ~25 |
| End-users | ~25 |
| Industry Expert/ Panel/ Consultant | ~30 |
| Total | ~100 |
MG Knowledgebase
• Repository of industry blog, newsletter and case studies
• Online platform covering detailed market reports, and company profiles
Forecasting Factors and Models
Forecasting Factors
- Historical Trends – Past market patterns, cycles, and major events that shaped how markets behave over time. Understanding past trends helps predict future behavior.
- Industry Factors – Specific characteristics of the industry like structure, regulations, and innovation cycles that affect market dynamics.
- Macroeconomic Factors – Economic conditions like GDP growth, inflation, and employment rates that affect how much money people have to spend.
- Demographic Factors – Population characteristics like age, income, and location that determine who can buy your product.
- Technology Factors – How quickly people adopt new technology and how much technology infrastructure exists.
- Regulatory Factors – Government rules, laws, and policies that can help or restrict market growth.
- Competitive Factors – Analyzing competition structure such as degree of competition and bargaining power of buyers and suppliers.
Forecasting Models / Techniques
Multiple Regression Analysis
- Identify and quantify factors that drive market changes
- Statistical modeling to establish relationships between market drivers and outcomes
Time Series Analysis – Seasonal Patterns
- Understand regular cyclical patterns in market demand
- Advanced statistical techniques to separate trend, seasonal, and irregular components
Time Series Analysis – Trend Analysis
- Identify underlying market growth patterns and momentum
- Statistical analysis of historical data to project future trends
Expert Opinion – Expert Interviews
- Gather deep industry insights and contextual understanding
- In-depth interviews with key industry stakeholders
Multi-Scenario Development
- Prepare for uncertainty by modeling different possible futures
- Creating optimistic, pessimistic, and most likely scenarios
Time Series Analysis – Moving Averages
- Sophisticated forecasting for complex time series data
- Auto-regressive integrated moving average models with seasonal components
Econometric Models
- Apply economic theory to market forecasting
- Sophisticated economic models that account for market interactions
Expert Opinion – Delphi Method
- Harness collective wisdom of industry experts
- Structured, multi-round expert consultation process
Monte Carlo Simulation
- Quantify uncertainty and probability distributions
- Thousands of simulations with varying input parameters
Research Analysis
Our research framework is built upon the fundamental principle of validating market intelligence from both demand and supply perspectives. This dual-sided approach ensures comprehensive market understanding and reduces the risk of single-source bias.
Demand-Side Analysis: We understand end-user/application behavior, preferences, and market needs along with the penetration of the product for specific application.
Supply-Side Analysis: We estimate overall market revenue, analyze the segmental share along with industry capacity, competitive landscape, and market structure.
Validation & Evaluation
Data triangulation is a validation technique that uses multiple methods, sources, or perspectives to examine the same research question, thereby increasing the credibility and reliability of research findings. In market research, triangulation serves as a quality assurance mechanism that helps identify and minimize bias, validate assumptions, and ensure accuracy in market estimates.
- Data Source Triangulation – Using multiple data sources to examine the same phenomenon
- Methodological Triangulation – Using multiple research methods to study the same research question
- Investigator Triangulation – Using multiple researchers or analysts to examine the same data
- Theoretical Triangulation – Using multiple theoretical perspectives to interpret the same data

Custom Market Research Services
We will customise the research for you, in case the report listed above does not meet your requirements.
Get 10% Free Customisation