Smart Grid Market Size, Share & Trends Analysis Report by Component Type (Hardware Components, Software Solutions, Services), Technology Type, Solution Type, Operational Domain, End-users and Geography (North America, Europe, Asia Pacific, Middle East, Africa, and South America) – Global Industry Data, Trends, and Forecasts, 2026–2035
|
|
|
Segmental Data Insights |
|
|
Demand Trends |
|
|
Competitive Landscape |
|
|
Strategic Development |
|
|
Future Outlook & Opportunities |
|
Smart-Grid-Market Size, Share, and Growth
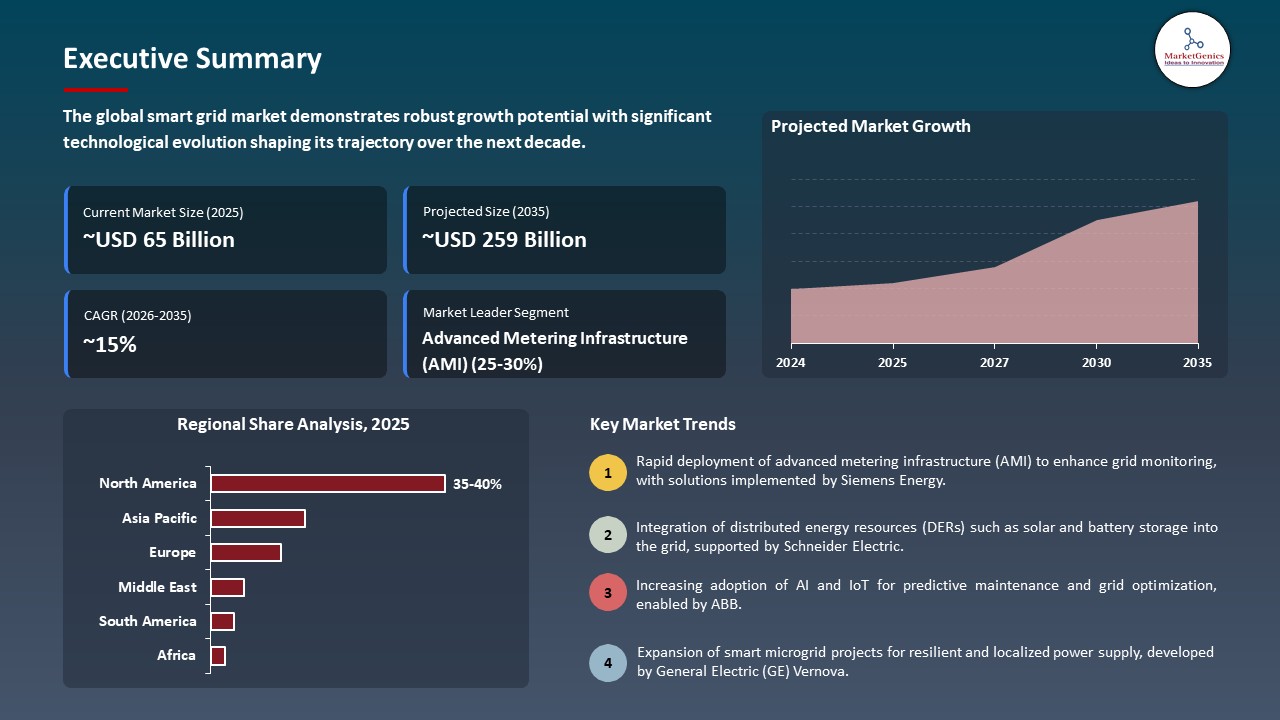
The global smart grid market is witnessing strong growth, valued at USD 65.2 billion in 2025 and projected to reach USD 259.2 billion by 2035, expanding at a CAGR of 14.8% during the forecast period. Asia Pacific is the fastest-growing region for the smart grid market due to rapid urbanization, expanding renewable energy integration, and government initiatives promoting grid modernization and digital infrastructure upgrades.
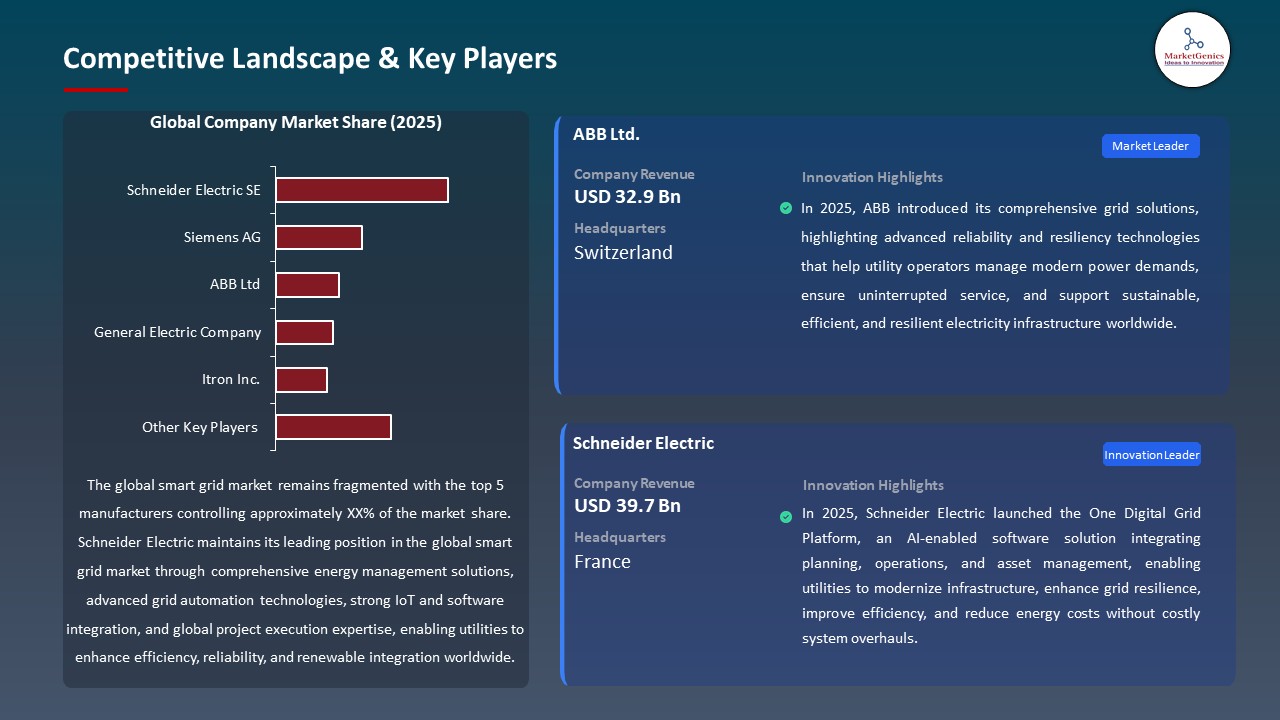
Frédéric Godemel, Executive Vice President of Energy Management at Schneider Electric, said, " Electricity powers progress, and today’s world demands more than just supply — it demands resilience, reliability and sustainability, With the One Digital Grid Platform, we’re empowering utilities to harness the full potential of technology, transforming aging infrastructure into intelligent, future-ready networks. This is how we build a grid that not only keeps the lights on but drives decarbonization and delivers affordable energy for all."
The increasing energy efficiency, grid reliability and integration of renewable energy sources drive the global smart grid market. Real-time monitoring systems and advanced metering infrastructure (AMI) help utilities optimize the distribution of electricity, minimize outages, and improve load management, with increasing digitalization resulting in the implementation of AI-enabled predictive maintenance and demand forecasting.
In 2025, Siemens introduced its Digital Grid Suite, which is a suite of AI-based grid analytics and automation to a utility, providing greater efficiency and resilience to the operation. On the same note, Schneider Electric implemented EcoStruxure grid 2.0 in various Asian utilities in 2025, and enhanced real-time energy optimization and integration of renewable sources. Also, expanding government requirements on carbon emission and investment in smart transmission and distribution systems increases the rate of adoption in markets. Technology providers and utility companies also collaborate, which also offers scalable and secure smart grid solutions.
Adjacent opportunities to the smart grid market include advanced energy storage solutions, electric vehicle charging infrastructure, microgrid development, demand response systems, and IoT-enabled home energy management. These sectors complement grid modernization efforts, enabling optimized energy use, enhanced reliability, and seamless integration of renewables.
 Smart Grid Market Dynamics and Trends
Driver: Deployment of Advanced Digital Grid Technologies Enhancing Network Efficiency and Resilience
-
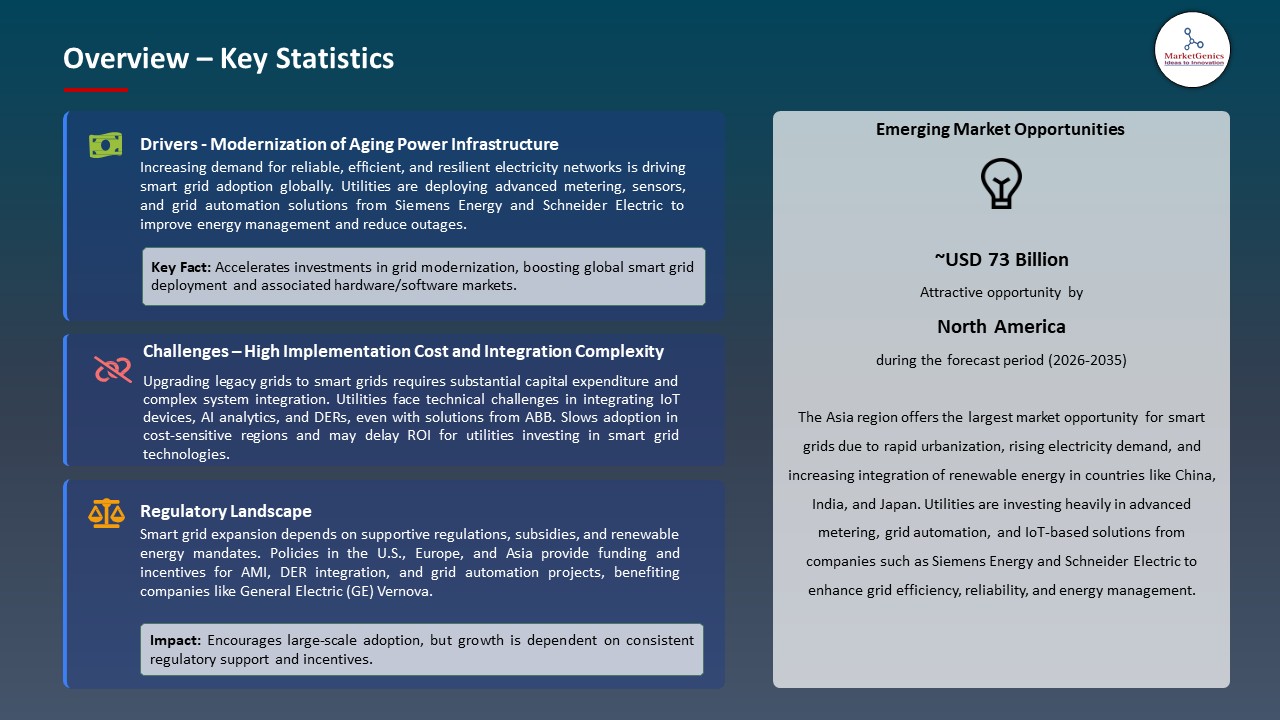
The smart grid market has been significantly contributed by the adoption of sophisticated digital grid technologies that allow a utility to monitor, control, and optimize electricity networks on a real time basis. These systems enhance reliability, minimize downtimes and increases fault detection as well as effectively incorporating the renewable energy.
- Digital solutions, including virtualized protection, grid automation and advanced control platforms, enable operators to consolidate several devices, reduce operational costs and also increase network security. It enhances the efficiency of the entire grid, promotes modernization and makes smart grids more widespread in the world.
- Schneider Electric SE introduced its One Digital Grid Platform in November 2025, an AI-based solution that modernizes the work of the utility, optimizes the grid, predicts outages, and improves communication with the customers, which contributes to resilience and allows supporting renewable integration.
- High digital grid technologies enhance resilience of the network and promote efficiency, facilitating smart grid modernization all over the world.
Restraint: Regulatory and Interoperability Complexities Slowing Smart Grid Integration
-
Regulatory frameworks and interoperability standards remain a huge challenge to the implementation of smart grid technologies in a rapid fashion. The utilities and technology companies should also overcome complicated, region-specific compliance needs and make sure that new systems can easily integrate with the existing systems that are usually old, designed and specifications of different vendors.
- The complexities may also slow down project schedules, raise the cost of implementation and curb innovation, especially in areas where there are fragmented regulations or different-looking technical standards. Interoperability between devices, communication protocols and software platforms can only be achieved by means of a lot of testing, coordination and following up with the emerging guidelines in the industry.
- Other utilities can delay or reduce the scope of investments in smart grids, slackening the growth of the market in general. It is important to overcome regulatory and interoperability barriers so that scalable, efficient and fully integrated smart energy networks can be achieved across the globe.
- The adoption is inhibited and slows modernization of smart grids due to regulatory and technical barriers across the world.
Opportunity: AI‑Powered Operational Resilience Through Strategic Acquisitions and Software Integration
-
The smart grid market has massive opportunities through integrating AI-powered solutions via strategic acquisitions and software platforms. Advanced analytics, predictive maintenance, and real-time monitoring can help utilities to make their operations more resilient and maximize network performance.
- Using AI in conjunction with the current grid infrastructure, companies are able to enhance fault detection, automated decision-making, and distributed energy resources integration. This will enable the utilities to react in real-time to changing demand levels, weather conditions and cyber threats, and, due to its high speed, digital transformation.
- In 2025, Itron Inc. declared that it has actually acquired Urbint, Inc., an AI-based predictive resilience software company, to allow utilities to predict risks to infrastructure, deploy workforce optimally, and enhance operational resiliency in smart grid networks.
- Smart grids unlock efficiency, reliability, and scalability by applying AI-based operational improvements.
Key Trend: Smart Infrastructure Partnerships Power Autonomous and AI‑Driven Grid Solutions
-
The rise in the popularity of infrastructure partnerships has led to the increasing popularity of autonomous and AI-based grid solutions that can help utilities to make modern operations, optimize energy flows, and improve real-time decision-making.
- Collaborative partnerships between technology providers, software developers and utility operators combine AI, IoT and sophisticated analytics, enabling grids to be self-healing, anticipate outages and optimally use distributed energy resources. These collaborations speed up innovation, enhance the resilience of operations, and sustain and adaptable, flexible and future-proof smart grid networks on the global scale.
- In November 2025, IFS and Siemens AG entered into a strategic alliance to bring autonomous grid solutions on the basis of AI. The partnership combines the experience of Siemens in grid planning and smart infrastructure with the Industrial AI software of IFS in asset management, field service and AI-driven scheduling.
- Smart grid partnerships driven by AI contribute to faster operational speed, resilience, and globalization to sustainable energy networks.
 Smart Grid Market Analysis and Segmental Data
Advanced Metering Infrastructure (AMI) Dominate Global Smart Grid Market
-
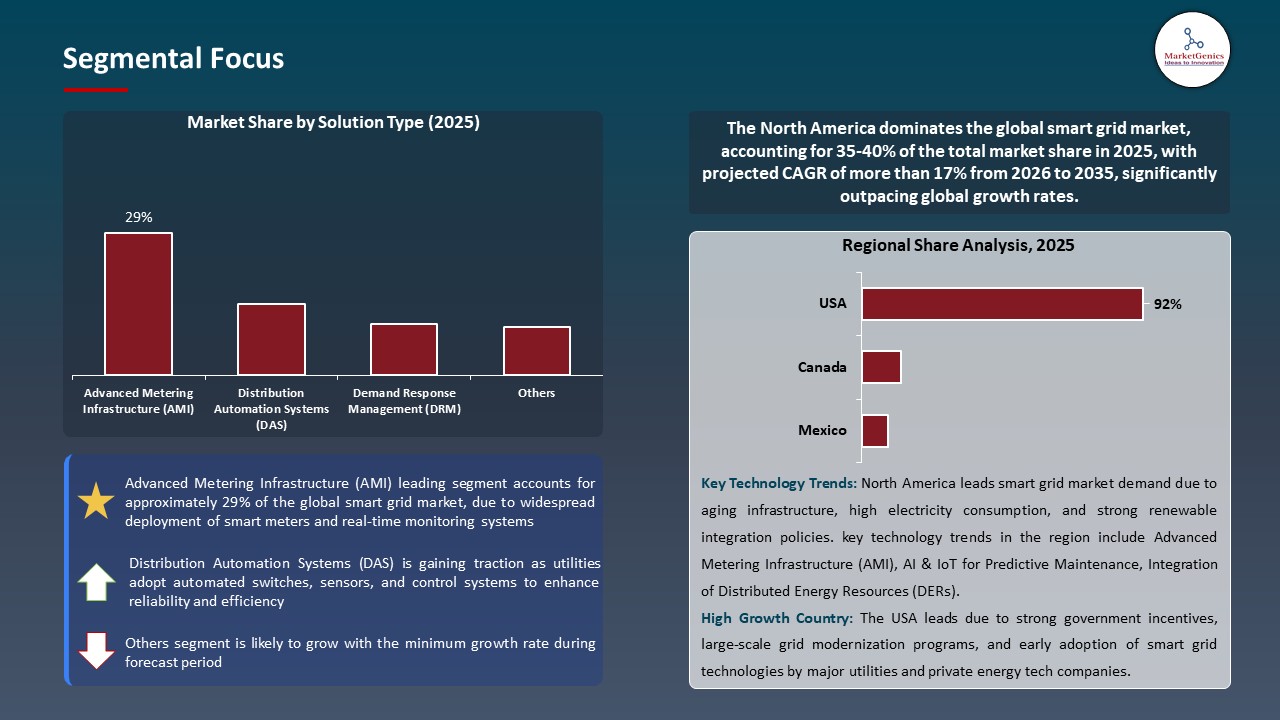
The more developed segment of the smart grid is the advanced metering infrastructure (AMI) segment because of the capability to offer real-time monitoring, two-way communication, and automated data collection of electricity, gas, and water utilities. The AMI systems allow proper billing, better energy management and increased reliability of the grid making it a necessity to modernize the utility operations.
- The combination of smart meters and communication networks and analytics platforms can enable utilities to recognize outages soon and manage loads effectively and introduce dynamic pricing models. Consumers also have the ability provided by AMI to gain deeper capabilities in the usage insights, fostering energy saving and the involvement of demand response. With the growing attention of utilities and governments to digital transformation and decarbonization, the adoption of AMI is gaining momentum and establishing itself as the underlying technology of smart grid efficiency and modernization in the global context.
- The extensive use of AMI is rapidly improving grid efficiency, reliability, and consumer energy management around the world.
North America Leads Global Smart Grid Market Demand
-
North America leads the global Smart Grid market due to strong investments in modernizing aging electrical infrastructure, the increasing integration of renewable energy sources, and supportive government policies that promote energy efficiency and reliability. Utilities across the region are adopting advanced metering infrastructure (AMI), grid automation, and AI-driven energy management systems to enhance operational performance and meet growing electricity demand.
- The availability of large technology vendors, strong research and development, and large-scale implementation of IoT-enabled devices are some of the factors that make its adoption quick. Also, an escalating interest in grid resiliency, cyber-attacks, and real-time energy monitoring have increased the rate of smart grid adoption. Regulatory frameworks and incentive schemes of North America also contribute to the fact that the utilities invest in the development of the advanced technologies, which supports the fact that the region becomes the world-leader.
- The smart grid leadership of North America enhances grids resilience, efficiency and renewable energy integration in the region.
Smart Grid Market Ecosystem
The global smart grid market is fragmented, with leading players including Schneider Electric SE, Siemens AG, ABB Ltd, General Electric Company, and Itron Inc. These firms utilize vertically integrated energy management solutions, proprietary grid automation technologies, advanced sensors, and huge networks of deployments around the world. They lead the market by investing in smart meters and real-time grid analytics, IoT-enabled devices, and AI-driven energy management platforms. Their competitors are also weakened by strategic partnerships with utilities, technology companies, and state programs.
The smart grid value chain includes raw materials of sensors and meters, manufacture of power electronics, integration of the system, software and analytics implementation, and after sales services like maintenance, update of firmware, and optimization. The stages guarantee grid reliability, energy efficiency, real-time follow-ups as well as secure communications in industrial, commercial, and residential uses.
The barriers to entry are high because of high R&D needs, proprietary technology, and regulatory compliance. Differentiation, adoption and globalization are driven by innovation in IoT enabled automation, predictive maintenance and AI based energy management.
 Recent Development and Strategic Overview:
-
In March 2025, Tata Power-DDL partnered with FSR Global to advance smart grid innovation in India, focusing on policy research, clean energy technology development, and capacity building. The collaboration aims to promote sustainable energy solutions, enhance industry knowledge, and establish best practices for modernizing India’s power sector.
- In November 2025, IFS and Siemens AG formed a strategic partnership to deliver AI-driven, autonomous grid solutions. The collaboration integrates Siemens’ expertise in grid planning and smart infrastructure with IFS’s Industrial AI software for asset management, field service, and AI-powered scheduling.
Report Scope
|
Detail |
|
|
Market Size in 2025 |
USD 65.2 Bn |
|
Market Forecast Value in 2035 |
USD 259.2 Bn |
|
Growth Rate (CAGR) |
14.8% |
|
Forecast Period |
2026 – 2035 |
|
Historical Data Available for |
2021 – 2024 |
|
Market Size Units |
US$ Billion for Value Units for Volume |
|
Report Format |
Electronic (PDF) + Excel |
|
North America |
Europe |
Asia Pacific |
Middle East |
Africa |
South America |
|
|
|
|
|
|
|
Companies Covered |
|||||
|
|
|
|
|
|
Smart Grid Market Segmentation and Highlights
|
Segment |
Sub-segment |
|
Smart Grid Market, By Component Type |
|
|
Smart Grid Market, By Memory Technology Type |
|
|
Smart Grid Market, By Solution Type |
|
|
Smart Grid Market, By Operational Domain |
|
|
Smart Grid Market, By End-users |
|
Frequently Asked Questions
Table of Contents
- 1. Research Methodology and Assumptions
- 1.1. Definitions
- 1.2. Research Design and Approach
- 1.3. Data Collection Methods
- 1.4. Base Estimates and Calculations
- 1.5. Forecasting Models
- 1.5.1. Key Forecast Factors & Impact Analysis
- 1.6. Secondary Research
- 1.6.1. Open Sources
- 1.6.2. Paid Databases
- 1.6.3. Associations
- 1.7. Primary Research
- 1.7.1. Primary Sources
- 1.7.2. Primary Interviews with Stakeholders across Ecosystem
- 2. Executive Summary
- 2.1. Global Smart Grid Market Outlook
- 2.1.1. Smart Grid Market Size (Volume (Units) and Value (US$ Bn)), and Forecasts, 2021-2035
- 2.1.2. Compounded Annual Growth Rate Analysis
- 2.1.3. Growth Opportunity Analysis
- 2.1.4. Segmental Share Analysis
- 2.1.5. Geographical Share Analysis
- 2.2. Market Analysis and Facts
- 2.3. Supply-Demand Analysis
- 2.4. Competitive Benchmarking
- 2.5. Go-to- Market Strategy
- 2.5.1. Customer/ End-use Industry Assessment
- 2.5.2. Growth Opportunity Data, 2026-2035
- 2.5.2.1. Regional Data
- 2.5.2.2. Country Data
- 2.5.2.3. Segmental Data
- 2.5.3. Identification of Potential Market Spaces
- 2.5.4. GAP Analysis
- 2.5.5. Potential Attractive Price Points
- 2.5.6. Prevailing Market Risks & Challenges
- 2.5.7. Preferred Sales & Marketing Strategies
- 2.5.8. Key Recommendations and Analysis
- 2.5.9. A Way Forward
- 2.1. Global Smart Grid Market Outlook
- 3. Industry Data and Premium Insights
- 3.1. Global Energy & Power Industry Overview, 2025
- 3.1.1. Energy & Power Ecosystem Analysis
- 3.1.2. Key Trends for Energy & Power Industry
- 3.1.3. Regional Distribution for Energy & Power Industry
- 3.2. Supplier Customer Data
- 3.3. Technology Roadmap and Developments
- 3.4. Trade Analysis
- 3.4.1. Import & Export Analysis, 2025
- 3.4.2. Top Importing Countries
- 3.4.3. Top Exporting Countries
- 3.5. Trump Tariff Impact Analysis
- 3.5.1. Manufacturer
- 3.5.1.1. Based on the component & Raw material
- 3.5.2. Supply Chain
- 3.5.3. End Consumer
- 3.5.1. Manufacturer
- 3.6. Raw Material Analysis
- 3.1. Global Energy & Power Industry Overview, 2025
- 4. Market Overview
- 4.1. Market Dynamics
- 4.1.1. Drivers
- 4.1.1.1. Integration of advanced digital grid technologies for efficiency and reliability
- 4.1.1.2. Increasing adoption of renewable energy and distributed energy resources
- 4.1.1.3. Growing investments in AI and IoT-enabled smart grid solutions
- 4.1.2. Restraints
- 4.1.2.1. High implementation costs and infrastructure complexity
- 4.1.2.2. Regulatory and interoperability challenges across regions
- 4.1.1. Drivers
- 4.2. Key Trend Analysis
- 4.3. Regulatory Framework
- 4.3.1. Key Regulations, Norms, and Subsidies, by Key Countries
- 4.3.2. Tariffs and Standards
- 4.3.3. Impact Analysis of Regulations on the Market
- 4.4. Ecosystem Analysis
- 4.5. Cost Structure Analysis
- 4.5.1. Parameter’s Share for Cost Associated
- 4.5.2. COGP vs COGS
- 4.5.3. Profit Margin Analysis
- 4.6. Pricing Analysis
- 4.6.1. Regional Pricing Analysis
- 4.6.2. Segmental Pricing Trends
- 4.6.3. Factors Influencing Pricing
- 4.7. Porter’s Five Forces Analysis
- 4.8. PESTEL Analysis
- 4.9. Global Smart Grid Market Demand
- 4.9.1. Historical Market Size – (Volume (Units) and Value (US$ Bn)), 2020-2024
- 4.9.2. Current and Future Market Size – (Volume (Units) and Value (US$ Bn)), 2026–2035
- 4.9.2.1. Y-o-Y Growth Trends
- 4.9.2.2. Absolute $ Opportunity Assessment
- 4.1. Market Dynamics
- 5. Competition Landscape
- 5.1. Competition structure
- 5.1.1. Fragmented v/s consolidated
- 5.2. Company Share Analysis, 2025
- 5.2.1. Global Company Market Share
- 5.2.2. By Region
- 5.2.2.1. North America
- 5.2.2.2. Europe
- 5.2.2.3. Asia Pacific
- 5.2.2.4. Middle East
- 5.2.2.5. Africa
- 5.2.2.6. South America
- 5.3. Product Comparison Matrix
- 5.3.1. Specifications
- 5.3.2. Market Positioning
- 5.3.3. Pricing
- 5.1. Competition structure
- 6. Global Smart Grid Market Analysis, by Component Type
- 6.1. Key Segment Analysis
- 6.2. Smart Grid Market Size (Volume (Units) and Value (US$ Bn)), Analysis, and Forecasts, by Component Type, 2021-2035
- 6.2.1. Hardware Components
- 6.2.1.1. Smart Meters
- 6.2.1.2. Distribution Automation Devices
- 6.2.1.3. Substation Automation Equipment
- 6.2.1.4. Communication Infrastructure
- 6.2.1.5. Sensors and IoT Devices
- 6.2.1.6. Others
- 6.2.2. Software Solutions
- 6.2.2.1. Energy Management Systems (EMS)
- 6.2.2.2. Advanced Metering Infrastructure (AMI)
- 6.2.2.3. Distribution Management Systems (DMS)
- 6.2.2.4. Outage Management Systems (OMS)
- 6.2.2.5. Grid Analytics & Monitoring Software
- 6.2.2.6. Others
- 6.2.3. Services
- 6.2.3.1. Integration & Implementation
- 6.2.3.2. Consulting & Advisory
- 6.2.3.3. Operations & Maintenance
- 6.2.3.4. Training & Support
- 6.2.3.5. Others
- 6.2.1. Hardware Components
- 7. Global Smart Grid Market Analysis, by Technology Type
- 7.1. Key Segment Analysis
- 7.2. Smart Grid Market Size (Volume (Units) and Value (US$ Bn)), Analysis, and Forecasts, by Technology Type, 2021-2035
- 7.2.1. Communication Technologies
- 7.2.1.1. Power Line Communication (PLC)
- 7.2.1.2. Wireless (WiFi, LTE, 5G)
- 7.2.1.3. Fiber Optics
- 7.2.1.4. Mesh Networks
- 7.2.1.5. Cellular Networks
- 7.2.1.6. Others
- 7.2.2. Control & Automation Technologies
- 7.2.2.1. SCADA (Supervisory Control and Data Acquisition)
- 7.2.2.2. IED (Intelligent Electronic Devices)
- 7.2.2.3. PMU (Phasor Measurement Units)
- 7.2.2.4. Relay & Protection Systems
- 7.2.2.5. Others
- 7.2.3. Data Analytics & AI Technologies
- 7.2.3.1. Machine Learning
- 7.2.3.2. Artificial Intelligence
- 7.2.3.3. Big Data Analytics
- 7.2.3.4. IoT Platforms
- 7.2.3.5. Others
- 7.2.1. Communication Technologies
- 8. Global Smart Grid Market Analysis, by Solution Type
- 8.1. Key Segment Analysis
- 8.2. Smart Grid Market Size (Volume (Units) and Value (US$ Bn)), Analysis, and Forecasts, by Solution Type, 2021-2035
- 8.2.1. Advanced Metering Infrastructure (AMI)
- 8.2.2. Distribution Automation Systems (DAS)
- 8.2.3. Demand Response Management (DRM)
- 8.2.4. Energy Storage Integration
- 8.2.5. Renewable Energy Integration
- 8.2.6. Microgrid Management
- 8.2.7. Home/Building Energy Management Systems (HEMS/BEMS)
- 8.2.8. Grid Modernization Platforms
- 8.2.9. Other Solutions
- 9. Global Smart Grid Market Analysis, by Operational Domain
- 9.1. Key Segment Analysis
- 9.2. Smart Grid Market Size (Volume (Units) and Value (US$ Bn)), Analysis, and Forecasts, by Operational Domain, 2021-2035
- 9.2.1. Generation
- 9.2.2. Transmission
- 9.2.3. Distribution
- 9.2.4. Energy Storage
- 10. Global Smart Grid Market Analysis, by Power Consumption
- 10.1. Key Segment Analysis
- 10.2. Smart Grid Market Size (Volume (Units) and Value (US$ Bn)), Analysis, and Forecasts, by Power Consumption, 2021-2035
- 10.2.1. Up to 5W
- 10.2.2. 5w - 20W
- 10.2.3. 20W - 50W
- 10.2.4. Above 50W
- 11. Global Smart Grid Market Analysis, by End-users
- 11.1. Key Segment Analysis
- 11.2. Smart Grid Market Size (Volume (Units) and Value (US$ Bn)), Analysis, and Forecasts, by End-users, 2021-2035
- 11.2.1. Utilities (Public & Private)
- 11.2.2. Commercial Consumers
- 11.2.3. Industrial Manufacturing Plants
- 11.2.4. Residential Communities & Housing Complexes
- 11.2.5. Renewable Energy Producers
- 11.2.6. Electric Vehicle Charging Networks
- 11.2.7. Other End-users
- 12. Global Smart Grid Market Analysis and Forecasts, by Region
- 12.1. Key Findings
- 12.2. Smart Grid Market Size (Volume (Units) and Value (US$ Bn)), Analysis, and Forecasts, by Region, 2021-2035
- 12.2.1. North America
- 12.2.2. Europe
- 12.2.3. Asia Pacific
- 12.2.4. Middle East
- 12.2.5. Africa
- 12.2.6. South America
- 13. North America Smart Grid Market Analysis
- 13.1. Key Segment Analysis
- 13.2. Regional Snapshot
- 13.3. North America Smart Grid Market Size (Volume (Units) and Value (US$ Bn)), Analysis, and Forecasts, 2021-2035
- 13.3.1. Component Type
- 13.3.2. Technology Type
- 13.3.3. Solution Type
- 13.3.4. Operational Domain
- 13.3.5. End-users
- 13.3.6. Country
- 13.3.6.1. USA
- 13.3.6.2. Canada
- 13.3.6.3. Mexico
- 13.4. USA Smart Grid Market
- 13.4.1. Country Segmental Analysis
- 13.4.2. Component Type
- 13.4.3. Technology Type
- 13.4.4. Solution Type
- 13.4.5. Operational Domain
- 13.4.6. End-users
- 13.5. Canada Smart Grid Market
- 13.5.1. Country Segmental Analysis
- 13.5.2. Component Type
- 13.5.3. Technology Type
- 13.5.4. Solution Type
- 13.5.5. Operational Domain
- 13.5.6. End-users
- 13.6. Mexico Smart Grid Market
- 13.6.1. Country Segmental Analysis
- 13.6.2. Component Type
- 13.6.3. Technology Type
- 13.6.4. Solution Type
- 13.6.5. Operational Domain
- 13.6.6. End-users
- 14. Europe Smart Grid Market Analysis
- 14.1. Key Segment Analysis
- 14.2. Regional Snapshot
- 14.3. Europe Smart Grid Market Size (Volume (Units) and Value (US$ Bn)), Analysis, and Forecasts, 2021-2035
- 14.3.1. Component Type
- 14.3.2. Technology Type
- 14.3.3. Solution Type
- 14.3.4. Operational Domain
- 14.3.5. End-users
- 14.3.6. Country
- 14.3.6.1. Germany
- 14.3.6.2. United Kingdom
- 14.3.6.3. France
- 14.3.6.4. Italy
- 14.3.6.5. Spain
- 14.3.6.6. Netherlands
- 14.3.6.7. Nordic Countries
- 14.3.6.8. Poland
- 14.3.6.9. Russia & CIS
- 14.3.6.10. Rest of Europe
- 14.4. Germany Smart Grid Market
- 14.4.1. Country Segmental Analysis
- 14.4.2. Component Type
- 14.4.3. Technology Type
- 14.4.4. Solution Type
- 14.4.5. Operational Domain
- 14.4.6. End-users
- 14.5. United Kingdom Smart Grid Market
- 14.5.1. Country Segmental Analysis
- 14.5.2. Component Type
- 14.5.3. Technology Type
- 14.5.4. Solution Type
- 14.5.5. Operational Domain
- 14.5.6. End-users
- 14.6. France Smart Grid Market
- 14.6.1. Country Segmental Analysis
- 14.6.2. Component Type
- 14.6.3. Technology Type
- 14.6.4. Solution Type
- 14.6.5. Operational Domain
- 14.6.6. End-users
- 14.7. Italy Smart Grid Market
- 14.7.1. Country Segmental Analysis
- 14.7.2. Component Type
- 14.7.3. Technology Type
- 14.7.4. Solution Type
- 14.7.5. Operational Domain
- 14.7.6. End-users
- 14.8. Spain Smart Grid Market
- 14.8.1. Country Segmental Analysis
- 14.8.2. Component Type
- 14.8.3. Technology Type
- 14.8.4. Solution Type
- 14.8.5. Operational Domain
- 14.8.6. End-users
- 14.9. Netherlands Smart Grid Market
- 14.9.1. Country Segmental Analysis
- 14.9.2. Component Type
- 14.9.3. Technology Type
- 14.9.4. Solution Type
- 14.9.5. Operational Domain
- 14.9.6. End-users
- 14.10. Nordic Countries Smart Grid Market
- 14.10.1. Country Segmental Analysis
- 14.10.2. Component Type
- 14.10.3. Technology Type
- 14.10.4. Solution Type
- 14.10.5. Operational Domain
- 14.10.6. End-users
- 14.11. Poland Smart Grid Market
- 14.11.1. Country Segmental Analysis
- 14.11.2. Component Type
- 14.11.3. Technology Type
- 14.11.4. Solution Type
- 14.11.5. Operational Domain
- 14.11.6. End-users
- 14.12. Russia & CIS Smart Grid Market
- 14.12.1. Country Segmental Analysis
- 14.12.2. Component Type
- 14.12.3. Technology Type
- 14.12.4. Solution Type
- 14.12.5. Operational Domain
- 14.12.6. End-users
- 14.13. Rest of Europe Smart Grid Market
- 14.13.1. Country Segmental Analysis
- 14.13.2. Component Type
- 14.13.3. Technology Type
- 14.13.4. Solution Type
- 14.13.5. Operational Domain
- 14.13.6. End-users
- 15. Asia Pacific Smart Grid Market Analysis
- 15.1. Key Segment Analysis
- 15.2. Regional Snapshot
- 15.3. Asia Pacific Smart Grid Market Size (Volume (Units) and Value (US$ Bn)), Analysis, and Forecasts, 2021-2035
- 15.3.1. Component Type
- 15.3.2. Technology Type
- 15.3.3. Solution Type
- 15.3.4. Operational Domain
- 15.3.5. End-users
- 15.3.6. Country
- 15.3.6.1. China
- 15.3.6.2. India
- 15.3.6.3. Japan
- 15.3.6.4. South Korea
- 15.3.6.5. Australia and New Zealand
- 15.3.6.6. Indonesia
- 15.3.6.7. Malaysia
- 15.3.6.8. Thailand
- 15.3.6.9. Vietnam
- 15.3.6.10. Rest of Asia Pacific
- 15.4. China Smart Grid Market
- 15.4.1. Country Segmental Analysis
- 15.4.2. Component Type
- 15.4.3. Technology Type
- 15.4.4. Solution Type
- 15.4.5. Operational Domain
- 15.4.6. End-users
- 15.5. India Smart Grid Market
- 15.5.1. Country Segmental Analysis
- 15.5.2. Component Type
- 15.5.3. Technology Type
- 15.5.4. Solution Type
- 15.5.5. Operational Domain
- 15.5.6. End-users
- 15.6. Japan Smart Grid Market
- 15.6.1. Country Segmental Analysis
- 15.6.2. Component Type
- 15.6.3. Technology Type
- 15.6.4. Solution Type
- 15.6.5. Operational Domain
- 15.6.6. End-users
- 15.7. South Korea Smart Grid Market
- 15.7.1. Country Segmental Analysis
- 15.7.2. Component Type
- 15.7.3. Technology Type
- 15.7.4. Solution Type
- 15.7.5. Operational Domain
- 15.7.6. End-users
- 15.8. Australia and New Zealand Smart Grid Market
- 15.8.1. Country Segmental Analysis
- 15.8.2. Component Type
- 15.8.3. Technology Type
- 15.8.4. Solution Type
- 15.8.5. Operational Domain
- 15.8.6. End-users
- 15.9. Indonesia Smart Grid Market
- 15.9.1. Country Segmental Analysis
- 15.9.2. Component Type
- 15.9.3. Technology Type
- 15.9.4. Solution Type
- 15.9.5. Operational Domain
- 15.9.6. End-users
- 15.10. Malaysia Smart Grid Market
- 15.10.1. Country Segmental Analysis
- 15.10.2. Component Type
- 15.10.3. Technology Type
- 15.10.4. Solution Type
- 15.10.5. Operational Domain
- 15.10.6. End-users
- 15.11. Thailand Smart Grid Market
- 15.11.1. Country Segmental Analysis
- 15.11.2. Component Type
- 15.11.3. Technology Type
- 15.11.4. Solution Type
- 15.11.5. Operational Domain
- 15.11.6. End-users
- 15.12. Vietnam Smart Grid Market
- 15.12.1. Country Segmental Analysis
- 15.12.2. Component Type
- 15.12.3. Technology Type
- 15.12.4. Solution Type
- 15.12.5. Operational Domain
- 15.12.6. End-users
- 15.13. Rest of Asia Pacific Smart Grid Market
- 15.13.1. Country Segmental Analysis
- 15.13.2. Component Type
- 15.13.3. Technology Type
- 15.13.4. Solution Type
- 15.13.5. Operational Domain
- 15.13.6. End-users
- 16. Middle East Smart Grid Market Analysis
- 16.1. Key Segment Analysis
- 16.2. Regional Snapshot
- 16.3. Middle East Smart Grid Market Size (Volume (Units) and Value (US$ Bn)), Analysis, and Forecasts, 2021-2035
- 16.3.1. Component Type
- 16.3.2. Technology Type
- 16.3.3. Solution Type
- 16.3.4. Operational Domain
- 16.3.5. End-users
- 16.3.6. Country
- 16.3.6.1. Turkey
- 16.3.6.2. UAE
- 16.3.6.3. Saudi Arabia
- 16.3.6.4. Israel
- 16.3.6.5. Rest of Middle East
- 16.4. Turkey Smart Grid Market
- 16.4.1. Country Segmental Analysis
- 16.4.2. Component Type
- 16.4.3. Technology Type
- 16.4.4. Solution Type
- 16.4.5. Operational Domain
- 16.4.6. End-users
- 16.5. UAE Smart Grid Market
- 16.5.1. Country Segmental Analysis
- 16.5.2. Component Type
- 16.5.3. Technology Type
- 16.5.4. Solution Type
- 16.5.5. Operational Domain
- 16.5.6. End-users
- 16.6. Saudi Arabia Smart Grid Market
- 16.6.1. Country Segmental Analysis
- 16.6.2. Component Type
- 16.6.3. Technology Type
- 16.6.4. Solution Type
- 16.6.5. Operational Domain
- 16.6.6. End-users
- 16.7. Israel Smart Grid Market
- 16.7.1. Country Segmental Analysis
- 16.7.2. Component Type
- 16.7.3. Technology Type
- 16.7.4. Solution Type
- 16.7.5. Operational Domain
- 16.7.6. End-users
- 16.8. Rest of Middle East Smart Grid Market
- 16.8.1. Country Segmental Analysis
- 16.8.2. Component Type
- 16.8.3. Technology Type
- 16.8.4. Solution Type
- 16.8.5. Operational Domain
- 16.8.6. End-users
- 17. Africa Smart Grid Market Analysis
- 17.1. Key Segment Analysis
- 17.2. Regional Snapshot
- 17.3. Africa Smart Grid Market Size (Volume (Units) and Value (US$ Bn)), Analysis, and Forecasts, 2021-2035
- 17.3.1. Component Type
- 17.3.2. Technology Type
- 17.3.3. Solution Type
- 17.3.4. Operational Domain
- 17.3.5. End-users
- 17.3.6. Country
- 17.3.6.1. South Africa
- 17.3.6.2. Egypt
- 17.3.6.3. Nigeria
- 17.3.6.4. Algeria
- 17.3.6.5. Rest of Africa
- 17.4. South Africa Smart Grid Market
- 17.4.1. Country Segmental Analysis
- 17.4.2. Component Type
- 17.4.3. Technology Type
- 17.4.4. Solution Type
- 17.4.5. Operational Domain
- 17.4.6. End-users
- 17.5. Egypt Smart Grid Market
- 17.5.1. Country Segmental Analysis
- 17.5.2. Component Type
- 17.5.3. Technology Type
- 17.5.4. Solution Type
- 17.5.5. Operational Domain
- 17.5.6. End-users
- 17.6. Nigeria Smart Grid Market
- 17.6.1. Country Segmental Analysis
- 17.6.2. Component Type
- 17.6.3. Technology Type
- 17.6.4. Solution Type
- 17.6.5. Operational Domain
- 17.6.6. End-users
- 17.7. Algeria Smart Grid Market
- 17.7.1. Country Segmental Analysis
- 17.7.2. Component Type
- 17.7.3. Technology Type
- 17.7.4. Solution Type
- 17.7.5. Operational Domain
- 17.7.6. End-users
- 17.8. Rest of Africa Smart Grid Market
- 17.8.1. Country Segmental Analysis
- 17.8.2. Component Type
- 17.8.3. Technology Type
- 17.8.4. Solution Type
- 17.8.5. Operational Domain
- 17.8.6. End-users
- 18. South America Smart Grid Market Analysis
- 18.1. Key Segment Analysis
- 18.2. Regional Snapshot
- 18.3. South America Smart Grid Market Size (Volume (Units) and Value (US$ Bn)), Analysis, and Forecasts, 2021-2035
- 18.3.1. Component Type
- 18.3.2. Technology Type
- 18.3.3. Solution Type
- 18.3.4. Operational Domain
- 18.3.5. End-users
- 18.3.6. Country
- 18.3.6.1. Brazil
- 18.3.6.2. Argentina
- 18.3.6.3. Rest of South America
- 18.4. Brazil Smart Grid Market
- 18.4.1. Country Segmental Analysis
- 18.4.2. Component Type
- 18.4.3. Technology Type
- 18.4.4. Solution Type
- 18.4.5. Operational Domain
- 18.4.6. End-users
- 18.5. Argentina Smart Grid Market
- 18.5.1. Country Segmental Analysis
- 18.5.2. Component Type
- 18.5.3. Technology Type
- 18.5.4. Solution Type
- 18.5.5. Operational Domain
- 18.5.6. End-users
- 18.6. Rest of South America Smart Grid Market
- 18.6.1. Country Segmental Analysis
- 18.6.2. Component Type
- 18.6.3. Technology Type
- 18.6.4. Solution Type
- 18.6.5. Operational Domain
- 18.6.6. End-users
- 19. Key Players/ Company Profile
- 19.1. ABB Ltd
- 19.1.1. Company Details/ Overview
- 19.1.2. Company Financials
- 19.1.3. Key Customers and Competitors
- 19.1.4. Business/ Industry Portfolio
- 19.1.5. Product Portfolio/ Specification Details
- 19.1.6. Pricing Data
- 19.1.7. Strategic Overview
- 19.1.8. Recent Developments
- 19.2. Cisco Systems
- 19.3. Eaton Corporation
- 19.4. Elster Group
- 19.5. Emerson Electric
- 19.6. Esyasoft
- 19.7. General Electric Company
- 19.8. GridPoint Inc.
- 19.9. Hitachi Ltd.
- 19.10. Honeywell International
- 19.11. IBM Corporation
- 19.12. Itron Inc
- 19.13. Kamstrup A/S
- 19.14. Landis+Gyr
- 19.15. Microsoft Corporation
- 19.16. Oracle Corporation
- 19.17. S&C Electric Company
- 19.18. Schneider Electric SE
- 19.19. Siemens AG
- 19.20. Sunverge Energy
- 19.21. TMEIC Corporation
- 19.22. Other Key Players
- 19.1. ABB Ltd
Note* - This is just tentative list of players. While providing the report, we will cover more number of players based on their revenue and share for each geography
Research Design
Our research design integrates both demand-side and supply-side analysis through a balanced combination of primary and secondary research methodologies. By utilizing both bottom-up and top-down approaches alongside rigorous data triangulation methods, we deliver robust market intelligence that supports strategic decision-making.
MarketGenics' comprehensive research design framework ensures the delivery of accurate, reliable, and actionable market intelligence. Through the integration of multiple research approaches, rigorous validation processes, and expert analysis, we provide our clients with the insights needed to make informed strategic decisions and capitalize on market opportunities.

MarketGenics leverages a dedicated industry panel of experts and a comprehensive suite of paid databases to effectively collect, consolidate, and analyze market intelligence.
Our approach has consistently proven to be reliable and effective in generating accurate market insights, identifying key industry trends, and uncovering emerging business opportunities.
Through both primary and secondary research, we capture and analyze critical company-level data such as manufacturing footprints, including technical centers, R&D facilities, sales offices, and headquarters.
Our expert panel further enhances our ability to estimate market size for specific brands based on validated field-level intelligence.
Our data mining techniques incorporate both parametric and non-parametric methods, allowing for structured data collection, sorting, processing, and cleaning.
Demand projections are derived from large-scale data sets analyzed through proprietary algorithms, culminating in robust and reliable market sizing.
Research Approach
The bottom-up approach builds market estimates by starting with the smallest addressable market units and systematically aggregating them to create comprehensive market size projections.
This method begins with specific, granular data points and builds upward to create the complete market landscape.
Customer Analysis → Segmental Analysis → Geographical Analysis
The top-down approach starts with the broadest possible market data and systematically narrows it down through a series of filters and assumptions to arrive at specific market segments or opportunities.
This method begins with the big picture and works downward to increasingly specific market slices.
TAM → SAM → SOM


Research Methods
Desk / Secondary Research
While analysing the market, we extensively study secondary sources, directories, and databases to identify and collect information useful for this technical, market-oriented, and commercial report. Secondary sources that we utilize are not only the public sources, but it is a combination of Open Source, Associations, Paid Databases, MG Repository & Knowledgebase, and others.
- Company websites, annual reports, financial reports, broker reports, and investor presentations
- National government documents, statistical databases and reports
- News articles, press releases and web-casts specific to the companies operating in the market, Magazines, reports, and others
- We gather information from commercial data sources for deriving company specific data such as segmental revenue, share for geography, product revenue, and others
- Internal and external proprietary databases (industry-specific), relevant patent, and regulatory databases
- Governing Bodies, Government Organizations
- Relevant Authorities, Country-specific Associations for Industries
We also employ the model mapping approach to estimate the product level market data through the players' product portfolio
Primary Research
Primary research/ interviews is vital in analyzing the market. Most of the cases involves paid primary interviews. Primary sources include primary interviews through e-mail interactions, telephonic interviews, surveys as well as face-to-face interviews with the different stakeholders across the value chain including several industry experts.
| Type of Respondents | Number of Primaries |
|---|---|
| Tier 2/3 Suppliers | ~20 |
| Tier 1 Suppliers | ~25 |
| End-users | ~25 |
| Industry Expert/ Panel/ Consultant | ~30 |
| Total | ~100 |
MG Knowledgebase
• Repository of industry blog, newsletter and case studies
• Online platform covering detailed market reports, and company profiles
Forecasting Factors and Models
Forecasting Factors
- Historical Trends – Past market patterns, cycles, and major events that shaped how markets behave over time. Understanding past trends helps predict future behavior.
- Industry Factors – Specific characteristics of the industry like structure, regulations, and innovation cycles that affect market dynamics.
- Macroeconomic Factors – Economic conditions like GDP growth, inflation, and employment rates that affect how much money people have to spend.
- Demographic Factors – Population characteristics like age, income, and location that determine who can buy your product.
- Technology Factors – How quickly people adopt new technology and how much technology infrastructure exists.
- Regulatory Factors – Government rules, laws, and policies that can help or restrict market growth.
- Competitive Factors – Analyzing competition structure such as degree of competition and bargaining power of buyers and suppliers.
Forecasting Models / Techniques
Multiple Regression Analysis
- Identify and quantify factors that drive market changes
- Statistical modeling to establish relationships between market drivers and outcomes
Time Series Analysis – Seasonal Patterns
- Understand regular cyclical patterns in market demand
- Advanced statistical techniques to separate trend, seasonal, and irregular components
Time Series Analysis – Trend Analysis
- Identify underlying market growth patterns and momentum
- Statistical analysis of historical data to project future trends
Expert Opinion – Expert Interviews
- Gather deep industry insights and contextual understanding
- In-depth interviews with key industry stakeholders
Multi-Scenario Development
- Prepare for uncertainty by modeling different possible futures
- Creating optimistic, pessimistic, and most likely scenarios
Time Series Analysis – Moving Averages
- Sophisticated forecasting for complex time series data
- Auto-regressive integrated moving average models with seasonal components
Econometric Models
- Apply economic theory to market forecasting
- Sophisticated economic models that account for market interactions
Expert Opinion – Delphi Method
- Harness collective wisdom of industry experts
- Structured, multi-round expert consultation process
Monte Carlo Simulation
- Quantify uncertainty and probability distributions
- Thousands of simulations with varying input parameters
Research Analysis
Our research framework is built upon the fundamental principle of validating market intelligence from both demand and supply perspectives. This dual-sided approach ensures comprehensive market understanding and reduces the risk of single-source bias.
Demand-Side Analysis: We understand end-user/application behavior, preferences, and market needs along with the penetration of the product for specific application.
Supply-Side Analysis: We estimate overall market revenue, analyze the segmental share along with industry capacity, competitive landscape, and market structure.
Validation & Evaluation
Data triangulation is a validation technique that uses multiple methods, sources, or perspectives to examine the same research question, thereby increasing the credibility and reliability of research findings. In market research, triangulation serves as a quality assurance mechanism that helps identify and minimize bias, validate assumptions, and ensure accuracy in market estimates.
- Data Source Triangulation – Using multiple data sources to examine the same phenomenon
- Methodological Triangulation – Using multiple research methods to study the same research question
- Investigator Triangulation – Using multiple researchers or analysts to examine the same data
- Theoretical Triangulation – Using multiple theoretical perspectives to interpret the same data

Custom Market Research Services
We will customise the research for you, in case the report listed above does not meet your requirements.
Get 10% Free Customisation