Smart Hydraulic Systems Market Size, Share & Trends Analysis Report by Component (Hydraulic Pumps, Hydraulic Motors, Valves (Directional, Pressure, Flow Control), Sensors & Transducers, Actuators, Controllers & PLCs, Filters & Accumulators, Reservoirs & Cooling Units, Hydraulic Fluids, Others), Type, Technology, System Configuration, Functionality, Deployment Mode, Application, End User Industry and Geography (North America, Europe, Asia Pacific, Middle East, Africa, and South America) – Global Industry Data, Trends, and Forecasts, 2026–2035
|
Market Structure & Evolution |
|
|
Segmental Data Insights |
|
|
Demand Trends |
|
|
Competitive Landscape |
|
|
Strategic Development |
|
|
Future Outlook & Opportunities |
|
Smart Hydraulic Systems Market Size, Share, and Growth
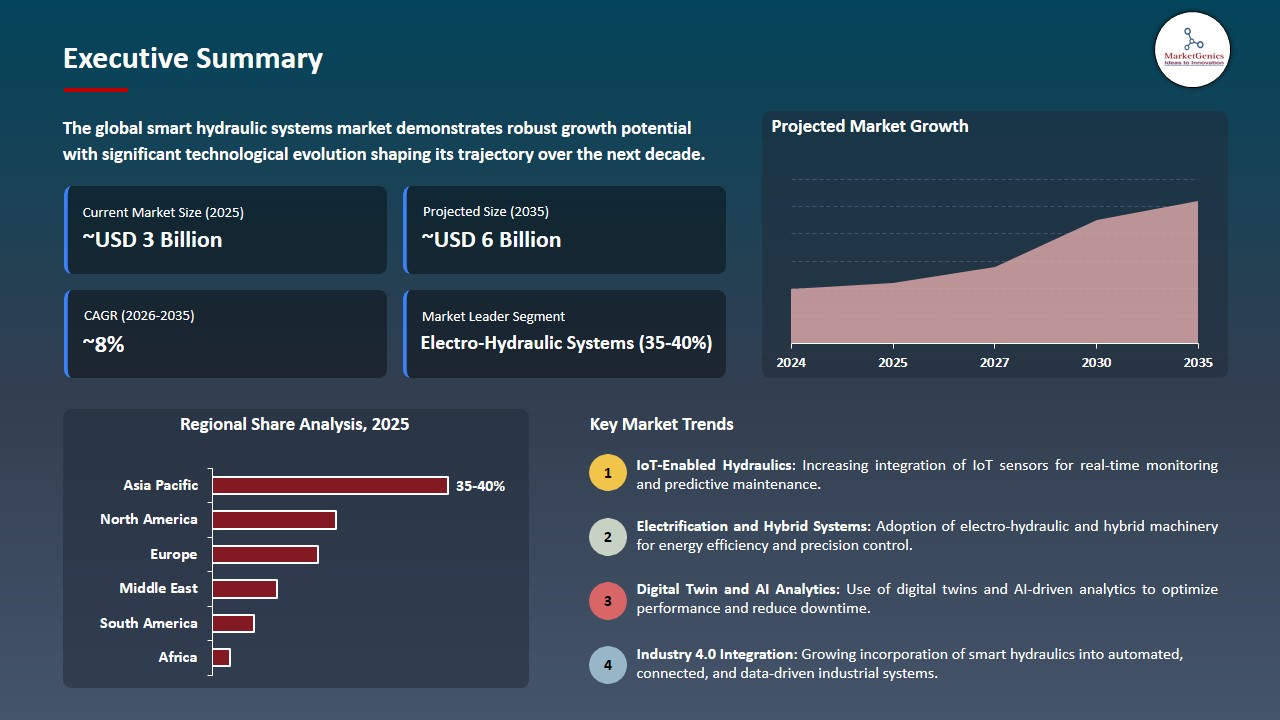
The global smart hydraulic systems market is experiencing robust growth, with its estimated value of USD 2.7 billion in the year 2025 and USD 5.7 billion by 2035, registering a CAGR of 7.8% during the forecast period. The global smart hydraulic systems market is currently experiencing rapid growth, primarily due to advanced electronically controlled hydraulic systems, which increase precision, efficiency and reliability.
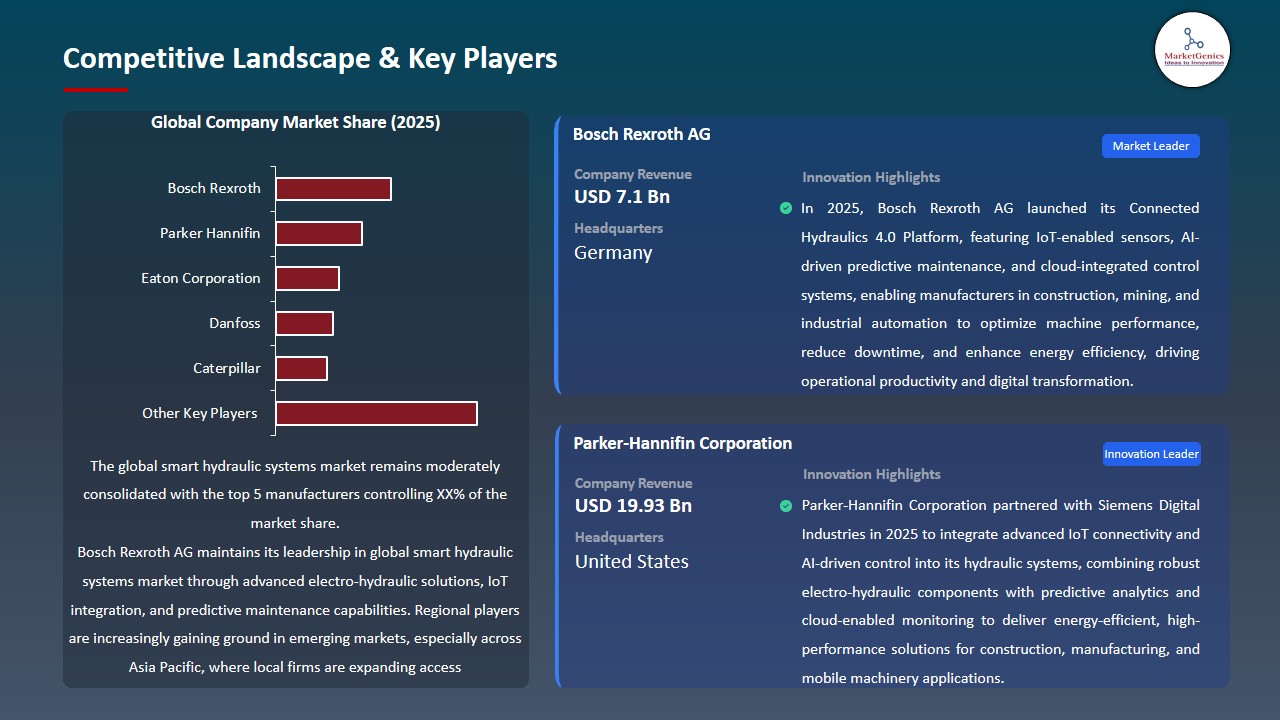
Guido Hettwer, Senior Vice President of Industrial Hydraulics Business Unit at Bosch Rexroth AG, said, Bosch Rexroth is lifting industrial hydraulics to the next level by incorporating digital and software driven control features that help save energy, increase productivity, and reduce emissions. Through the addition of electronics, connectivity, and intelligent software into hydraulic systems, manufacturers will be able to get smarter automation, real-time diagnostics, and improved machine performance.
To accelerate smart hydraulic systems adoption, in September 2025, Bosch Rexroth AG introduced both smart hydraulic pumps and smart hydraulic actuation systems as part of a new product line featuring integrated IoT sensing devices that enable real-time measurement of key performance metrics, including pressure, flow rate and temperature, for energy optimization and predictive maintenance.
The increased demand for high levels of automation in heavy equipment used in construction, mining and manufacturing industries is creating additional growth in the market. Digitally controlled electro-hydraulic system deployments by Eaton Corporation in early 2025 are also increasing productivity through reduced downtime and improved worker safety. Operators are being encouraged to invest in advanced intelligent hydraulic systems because of its stringent regulatory requirements related to safety, energy efficiency and environmental compliance.
Manufacturers will also use the opportunity to grow revenue as they expand their product lines by developing solutions that include sensor-integrated actuators, predictive maintenance software, digital twin modelling and IoT monitoring of all aspects of industrial equipment.
Smart Hydraulic Systems Market Dynamics and Trends
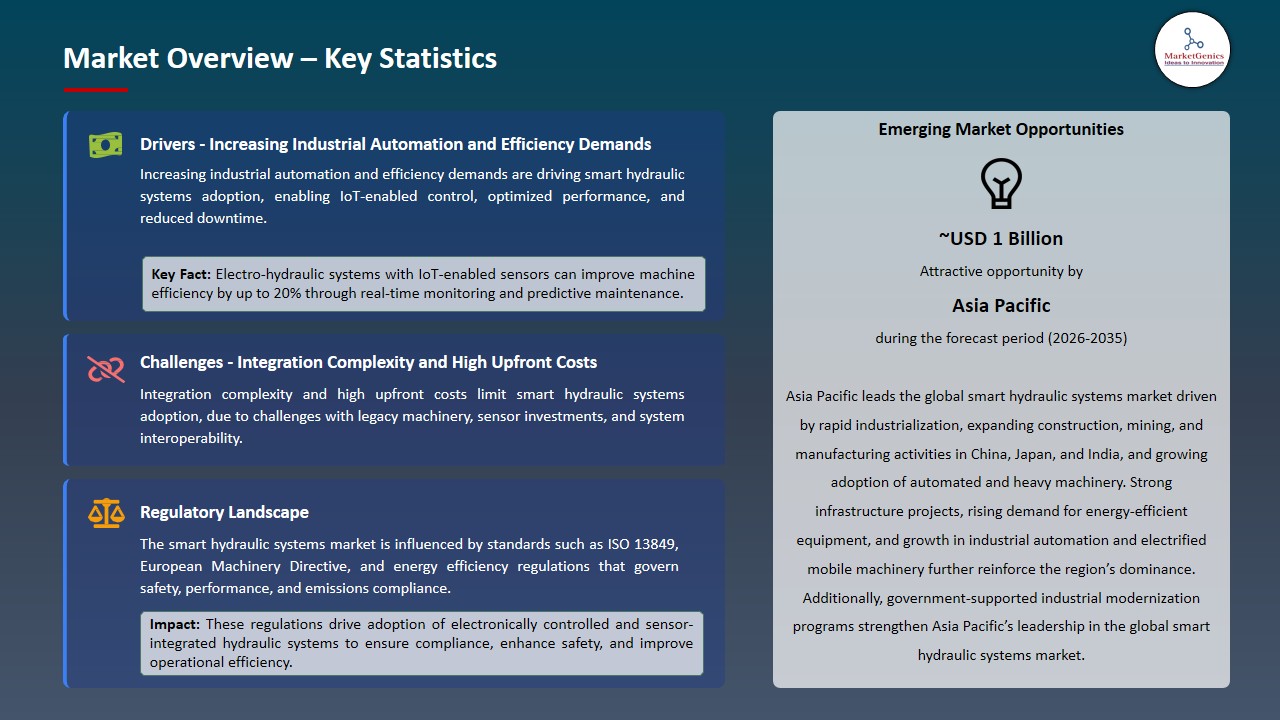
Driver: Increasing Industrial Automation and Efficiency Demands Driving Smart Hydraulic Systems Adoption
-
The expanding manufacturing, construction, and mining automation markets are creating demand for intelligent hydraulic systems capable of providing accurate control, decreasing energy use and utilizing predictive diagnostics. Major OEMs are using electronically controlled hydraulics integrated with IoT sensors as a way to meet the stringent performance and uptime requirements established by government agencies and end-users operating heavy equipment fleets.
- Industry safety and emissions regulations (e.g., European Machinery Directive; ISO 13849 Functional Safety Norms) are motivating manufacturers to develop intelligent hydraulic solutions that can provide compliance, real-time monitoring and fail-safe controls.
- Increased use of hydraulics in automation, robotics and electric mobile machines continues to drive capital investments into intelligent actuators and digital integration that improve system reliability, reduce operational expenses and facilitate the next generation of industrial operations. All these factors are likely to continue to escalate the growth of the smart hydraulic systems market.
Restraint: Integration Complexity and High Upfront Costs Limit Widespread Smart Hydraulics Adoption
-
While there are definite performance improvements from adopting smart hydraulic systems, end users are still faced with many challenges when trying to integrate these systems into their existing operations that include legacy equipment, control architectures and PLC/SCADA systems. Many existing fleets do not have the required connectivity interfaces for full digital monitoring and closed-loop control.
- Implementing sensor-rich hydraulic subsystems incurs large capital expenditures on instrumentation, control software and edge analytics platforms to enable digital monitoring and closed-loop control, making it cost prohibitive for small and medium sized enterprises with limited capacity to invest capital into upgrades.
- Balancing the requirements of increased system intelligence coupled with the risks associated with cyber security, lack of maintenance skills and interoperability continues to be a major barrier to faster adoption in traditional manufacturing industries. All these elements are expected to restrict the expansion of the smart hydraulic systems market.
Opportunity: Expansion in Emerging Regions and Electrification Initiatives
-
Asian, Latin American and African emerging economies are pouring considerable resources into building new infrastructure, developing construction facilities and mechanizing agriculture, which is providing new opportunities for the use of smart hydraulic components that offer improved efficiency, reduced total cost of ownership and increased uptime.
- With government incentives promoting the use of energy efficient, low emission equipment and utility programs supporting the electrification and automated use of their systems, there are more opportunities to use smart hydraulic solutions for electric-hydraulic hybrid machines and renewable energy applications.
- Collaborations between hydraulic component manufacturers, software application developers and local industrial Original Equipment Manufacturers (OEMs) are creating scalable support and service networks that can increase adoption rates for the smart hydraulic ecosystem and improve aftermarket intelligence. However, considering all these developments it is expected to create more opportunities in future for smart hydraulic systems market.
Key Trend: Digital Twin, Predictive Analytics, and AI‑Assisted Control Shaping the Smart Hydraulic Industry
-
By integrating digital twin models, cloud-based analytics, and machine learning, hydraulic system workflows can receive real-time performance simulations, predictive maintenance notifications, and adaptive control methods that help to increase the life of equipment while decreasing unplanned downtime.
- New condition monitoring methods using a fusion of vibration, pressure, and temperature sensors (along with using AI to generate the diagnostics) are making it possible for critical systems to detect faults better while reducing associated maintenance costs.
- The convergence of smarter hydraulics with Industry 4.0 technologies (including edge computing, cybersecurity standards, and data interoperability) is changing how OEMs and operators design, build, and use next-generation fluid power systems. All these elements are expected to influence significant trends in the smart hydraulic systems market.
Smart Hydraulic Systems Market Analysis and Segmental Data
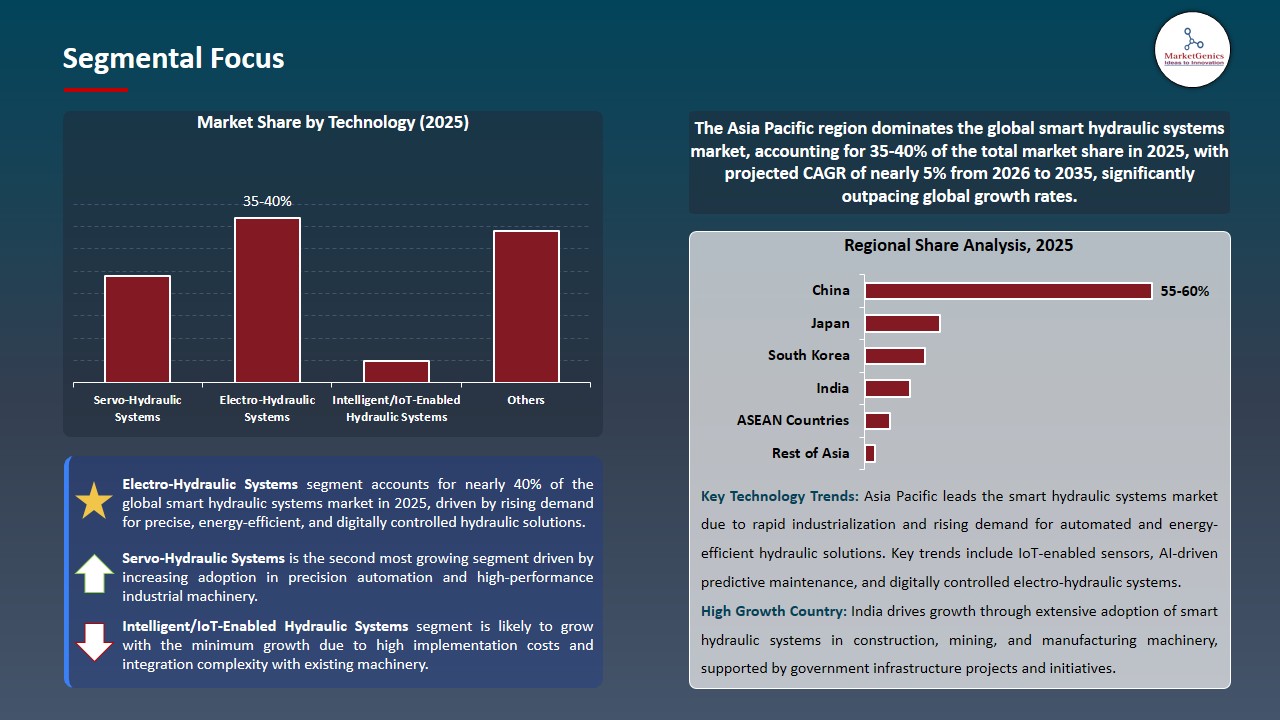
Electro-Hydraulic Systems Segment Dominates Global Smart Hydraulic Systems Market amid Rising Automation and Digitalization Trends
-
Owing to the need for higher levels of energy efficiency, real-time diagnostics, and decreased downtime because of embedded sensors and IoT connectivity, more manufacturers are focusing on the electro-hydraulic systems with regards to how these systems lead in market share than other fluid power options.
- The electro-hydraulic systems provide superior levels of control and performance when it comes to automated manufacturing and using mobile equipment and fit in with the requirements of Industry 4.0 for connected data driven operations (automation). There are numerous regulations that support manufacturers using electronically controlled hydraulic systems versus traditional hydraulic systems based on energy efficiency and emissions.
- This trend was highlighted at bauma 2025, where electro-hydraulic valves and controllers with on-board electronics were displayed by multiple OEMs to support safety, automation, and overall system optimization with construction equipment and agricultural equipment, thereby extending their dominance in the smart hydraulic systems market.
Asia Pacific Dominates Smart Hydraulic Systems Market amid Rapid Industrialization and Infrastructure Expansion
-
Rapidly industrializing countries that have made large-scale infrastructure investments along with increasing construction and mining activity all rely significantly on the use of hydraulic power solutions. Urban transport infrastructure development, smart factories, and modernization of industry are major investments made by both governments and private companies throughout China, India, Japan, and Southeast Asia.
- Since, there is an increasing need for hydraulic power in heavy equipment and automated equipment applications. Because, Asia Pacific is the largest hydraulic market in the world and will continue to hold that position because of growing manufacturing levels and increased use of IoT and digital hydraulic devices.
- Finally, as new large-scale infrastructure development projects and mechanization projects continue to be implemented throughout the region, there is a consistent need for dependable and efficient hydraulic systems, further solidifying Asia Pacific’s position in the hydraulic systems market.
Smart Hydraulic Systems Market Ecosystem
The smart hydraulic systems market is moderately consolidated. Tier 1 companies such as Bosch Rexroth AG or Parker Hannifin are distinguished by their global reach and technology investment, while Tier 2 and 3 companies provide niche products. Because, the overall level of concentration within the industry remains moderate.
Important points of value creation along the value chain include component manufacturing (i.e., Pumps, valves, and sensors) and system integration with digital controls that support predictive maintenance. An example is Hydreco Hydraulics demonstrating integrated smart hydraulic and sensor solutions at Bauma 2025 to illustrate how hydraulics and digital technology are working together for greater efficiency of operation through the use of smart hydraulic systems.
Recent Development and Strategic Overview:
-
In September 2025, Moog Inc., launched its Adaptive Hydraulic Intelligence (AHI) platform. The AHI platform combines edge analytics and machine learning into hydraulic actuators and valves, allowing real time adjustments to performance and anomaly detection without constant human interaction or supervision. The AHI platform provides faster reaction times, extended life of components, and improved operational uptime and reliability for both industrial automation and mobile equipment applications.
- In November 2025, Yuken Europe introduced the SmartHydro Connect ecosystem. Yuken's SmartHydro Connect pairs IoT-enabled hydraulic components with cloud-based diagnostic and predictive analysis capabilities, providing continuous health monitoring and automated maintenance recommendations for hydraulic systems.
Report Scope
|
Attribute |
Detail |
|
Market Size in 2025 |
USD 2.7 Bn |
|
Market Forecast Value in 2035 |
USD 5.7 Bn |
|
Growth Rate (CAGR) |
7.8% |
|
Forecast Period |
2026 – 2035 |
|
Historical Data Available for |
2021 – 2024 |
|
Market Size Units |
USD Bn for Value Thousand Units for Volume |
|
Report Format |
Electronic (PDF) + Excel |
|
Regions and Countries Covered |
|||||
|
North America |
Europe |
Asia Pacific |
Middle East |
Africa |
South America |
|
|
|
|
|
|
|
Companies Covered |
|||||
|
|
|
|
|
|
Smart Hydraulic Systems Market Segmentation and Highlights
|
Segment |
Sub-segment |
|
Smart Hydraulic Systems Market, By Component |
|
|
Smart Hydraulic Systems Market, By Type |
|
|
Smart Hydraulic Systems Market, By Technology |
|
|
Smart Hydraulic Systems Market, By System Configuration |
|
|
Smart Hydraulic Systems Market, By Functionality |
|
|
Smart Hydraulic Systems Market, By Deployment Mode |
|
|
Smart Hydraulic Systems Market, By Application |
|
|
Smart Hydraulic Systems Market, By End-User Industry |
|
Frequently Asked Questions
Table of Contents
- 1. Research Methodology and Assumptions
- 1.1. Definitions
- 1.2. Research Design and Approach
- 1.3. Data Collection Methods
- 1.4. Base Estimates and Calculations
- 1.5. Forecasting Models
- 1.5.1. Key Forecast Factors & Impact Analysis
- 1.6. Secondary Research
- 1.6.1. Open Sources
- 1.6.2. Paid Databases
- 1.6.3. Associations
- 1.7. Primary Research
- 1.7.1. Primary Sources
- 1.7.2. Primary Interviews with Stakeholders across Ecosystem
- 2. Executive Summary
- 2.1. Global Smart Hydraulic Systems Market Outlook
- 2.1.1. Smart Hydraulic Systems Market Size (Volume - Thousand Units & Value - US$ Bn), and Forecasts, 2021-2035
- 2.1.2. Compounded Annual Growth Rate Analysis
- 2.1.3. Growth Opportunity Analysis
- 2.1.4. Segmental Share Analysis
- 2.1.5. Geographical Share Analysis
- 2.2. Market Analysis and Facts
- 2.3. Supply-Demand Analysis
- 2.4. Competitive Benchmarking
- 2.5. Go-to- Market Strategy
- 2.5.1. Customer/ End-use Industry Assessment
- 2.5.2. Growth Opportunity Data, 2026-2035
- 2.5.2.1. Regional Data
- 2.5.2.2. Country Data
- 2.5.2.3. Segmental Data
- 2.5.3. Identification of Potential Market Spaces
- 2.5.4. GAP Analysis
- 2.5.5. Potential Attractive Price Points
- 2.5.6. Prevailing Market Risks & Challenges
- 2.5.7. Preferred Sales & Marketing Strategies
- 2.5.8. Key Recommendations and Analysis
- 2.5.9. A Way Forward
- 2.1. Global Smart Hydraulic Systems Market Outlook
- 3. Industry Data and Premium Insights
- 3.1. Global Industrial Machinery Industry Overview, 2025
- 3.1.1. Industrial Machinery Industry Analysis
- 3.1.2. Key Trends for Industrial Machinery Industry
- 3.1.3. Regional Distribution for Industrial Machinery Industry
- 3.2. Supplier Customer Data
- 3.3. Technology Roadmap and Developments
- 3.4. Trade Analysis
- 3.4.1. Import & Export Analysis, 2025
- 3.4.2. Top Importing Countries
- 3.4.3. Top Exporting Countries
- 3.5. Trump Tariff Impact Analysis
- 3.5.1. Manufacturer
- 3.5.1.1. Based on the component & Raw material
- 3.5.2. Supply Chain
- 3.5.3. End Consumer
- 3.5.1. Manufacturer
- 3.6. Raw Material Analysis
- 3.1. Global Industrial Machinery Industry Overview, 2025
- 4. Market Overview
- 4.1. Market Dynamics
- 4.1.1. Drivers
- 4.1.1.1. Rising adoption of industrial automation and precision machinery.
- 4.1.1.2. Integration of IoT and AI for predictive maintenance and real-time monitoring.
- 4.1.1.3. Growing demand for energy-efficient and digitally controlled hydraulic solutions.
- 4.1.2. Restraints
- 4.1.2.1. High upfront costs of smart hydraulic systems and components.
- 4.1.2.2. Complexity of integrating advanced hydraulics with legacy machinery.
- 4.1.1. Drivers
- 4.2. Key Trend Analysis
- 4.3. Regulatory Framework
- 4.3.1. Key Regulations, Norms, and Subsidies, by Key Countries
- 4.3.2. Tariffs and Standards
- 4.3.3. Impact Analysis of Regulations on the Market
- 4.4. Value Chain Analysis
- 4.4.1. Component Suppliers
- 4.4.2. System Integrators/ Technology Providers
- 4.4.3. Smart Hydraulic System Manufacturers
- 4.4.4. End Users
- 4.5. Cost Structure Analysis
- 4.5.1. Parameter’s Share for Cost Associated
- 4.5.2. COGP vs COGS
- 4.5.3. Profit Margin Analysis
- 4.6. Pricing Analysis
- 4.6.1. Regional Pricing Analysis
- 4.6.2. Segmental Pricing Trends
- 4.6.3. Factors Influencing Pricing
- 4.7. Porter’s Five Forces Analysis
- 4.8. PESTEL Analysis
- 4.9. Global Smart Hydraulic Systems Market Demand
- 4.9.1. Historical Market Size – Volume (Thousand Units) & Value (US$ Bn), 2020-2024
- 4.9.2. Current and Future Market Size – Volume (Thousand Units) & Value (US$ Bn), 2026–2035
- 4.9.2.1. Y-o-Y Growth Trends
- 4.9.2.2. Absolute $ Opportunity Assessment
- 4.1. Market Dynamics
- 5. Competition Landscape
- 5.1. Competition structure
- 5.1.1. Fragmented v/s consolidated
- 5.2. Company Share Analysis, 2025
- 5.2.1. Global Company Market Share
- 5.2.2. By Region
- 5.2.2.1. North America
- 5.2.2.2. Europe
- 5.2.2.3. Asia Pacific
- 5.2.2.4. Middle East
- 5.2.2.5. Africa
- 5.2.2.6. South America
- 5.3. Product Comparison Matrix
- 5.3.1. Specifications
- 5.3.2. Market Positioning
- 5.3.3. Pricing
- 5.1. Competition structure
- 6. Global Smart Hydraulic Systems Market Analysis, by Component
- 6.1. Key Segment Analysis
- 6.2. Smart Hydraulic Systems Market Size (Volume - Thousand Units & Value - US$ Bn), Analysis, and Forecasts, by Component, 2021-2035
- 6.2.1. Hydraulic Pumps
- 6.2.2. Hydraulic Motors
- 6.2.3. Valves (Directional, Pressure, Flow Control)
- 6.2.4. Sensors & Transducers
- 6.2.5. Actuators
- 6.2.6. Controllers & PLCs
- 6.2.7. Filters & Accumulators
- 6.2.8. Reservoirs & Cooling Units
- 6.2.9. Hydraulic Fluids
- 6.2.10. Others
- 7. Global Smart Hydraulic Systems Market Analysis, by Type
- 7.1. Key Segment Analysis
- 7.2. Smart Hydraulic Systems Market Size (Volume - Thousand Units & Value - US$ Bn), Analysis, and Forecasts, by Type, 2021-2035
- 7.2.1. Open Loop Systems
- 7.2.2. Closed Loop Systems
- 8. Global Smart Hydraulic Systems Market Analysis, by Technology
- 8.1. Key Segment Analysis
- 8.2. Smart Hydraulic Systems Market Size (Volume - Thousand Units & Value - US$ Bn), Analysis, and Forecasts, by Technology, 2021-2035
- 8.2.1. Electro-Hydraulic Systems
- 8.2.2. Servo-Hydraulic Systems
- 8.2.3. Proportional Hydraulic Systems
- 8.2.4. Intelligent/IoT-Enabled Hydraulic Systems
- 8.2.5. Others
- 9. Global Smart Hydraulic Systems Market Analysis, by System Configuration
- 9.1. Key Segment Analysis
- 9.2. Smart Hydraulic Systems Market Size (Volume - Thousand Units & Value - US$ Bn), Analysis, and Forecasts, by System Configuration, 2021-2035
- 9.2.1. Centralized Hydraulic Systems
- 9.2.2. Decentralized Hydraulic Systems
- 9.2.3. Integrated Hydraulic Systems
- 10. Global Smart Hydraulic Systems Market Analysis, by Functionality
- 10.1. Key Segment Analysis
- 10.2. Smart Hydraulic Systems Market Size (Volume - Thousand Units & Value - US$ Bn), Analysis, and Forecasts, by Functionality, 2021-2035
- 10.2.1. Position/Speed Control
- 10.2.2. Force/Torque Control
- 10.2.3. Pressure Regulation
- 10.2.4. Fluid Power Monitoring
- 10.2.5. Others
- 11. Global Smart Hydraulic Systems Market Analysis, by Deployment Mode
- 11.1. Key Segment Analysis
- 11.2. Smart Hydraulic Systems Market Size (Volume - Thousand Units & Value - US$ Bn), Analysis, and Forecasts, by Deployment Mode, 2021-2035
- 11.2.1. Standalone Systems
- 11.2.2. Integrated/Networked Systems
- 12. Global Smart Hydraulic Systems Market Analysis, by Application
- 12.1. Key Segment Analysis
- 12.2. Smart Hydraulic Systems Market Size (Volume - Thousand Units & Value - US$ Bn), Analysis, and Forecasts, by Application, 2021-2035
- 12.2.1. Material Handling
- 12.2.2. Construction Equipment
- 12.2.3. Industrial Machinery
- 12.2.4. Agriculture Equipment
- 12.2.5. Automotive Manufacturing
- 12.2.6. Aerospace & Defense
- 12.2.7. Marine & Offshore
- 12.2.8. Energy & Power Generation
- 12.2.9. Others
- 13. Global Smart Hydraulic Systems Market Analysis and Forecasts, by End‑User Industry
- 13.1. Key Findings
- 13.2. Smart Hydraulic Systems Market Size (Volume - Thousand Units & Value - US$ Bn), Analysis, and Forecasts, by End‑User Industry, 2021-2035
- 13.2.1. Manufacturing
- 13.2.2. Oil & Gas
- 13.2.3. Mining
- 13.2.4. Construction
- 13.2.5. Automotive
- 13.2.6. Aerospace
- 13.2.7. Marine
- 13.2.8. Renewable Energy
- 13.2.9. Others
- 14. Global Smart Hydraulic Systems Market Analysis and Forecasts, by Region
- 14.1. Key Findings
- 14.2. Smart Hydraulic Systems Market Size (Volume - Thousand Units & Value - US$ Bn), Analysis, and Forecasts, by Region, 2021-2035
- 14.2.1. North America
- 14.2.2. Europe
- 14.2.3. Asia Pacific
- 14.2.4. Middle East
- 14.2.5. Africa
- 14.2.6. South America
- 15. North America Smart Hydraulic Systems Market Analysis
- 15.1. Key Segment Analysis
- 15.2. Regional Snapshot
- 15.3. North America Smart Hydraulic Systems Market Size (Volume - Thousand Units & Value - US$ Bn), Analysis, and Forecasts, 2021-2035
- 15.3.1. Component
- 15.3.2. Type
- 15.3.3. Technology
- 15.3.4. System Configuration
- 15.3.5. Functionality
- 15.3.6. Deployment Mode
- 15.3.7. Application
- 15.3.8. End‑User Industry
- 15.3.9. Country
- 15.3.9.1. USA
- 15.3.9.2. Canada
- 15.3.9.3. Mexico
- 15.4. USA Smart Hydraulic Systems Market
- 15.4.1. Country Segmental Analysis
- 15.4.2. Component
- 15.4.3. Type
- 15.4.4. Technology
- 15.4.5. System Configuration
- 15.4.6. Functionality
- 15.4.7. Deployment Mode
- 15.4.8. Application
- 15.4.9. End‑User Industry
- 15.5. Canada Smart Hydraulic Systems Market
- 15.5.1. Country Segmental Analysis
- 15.5.2. Component
- 15.5.3. Type
- 15.5.4. Technology
- 15.5.5. System Configuration
- 15.5.6. Functionality
- 15.5.7. Deployment Mode
- 15.5.8. Application
- 15.5.9. End‑User Industry
- 15.6. Mexico Smart Hydraulic Systems Market
- 15.6.1. Country Segmental Analysis
- 15.6.2. Component
- 15.6.3. Type
- 15.6.4. Technology
- 15.6.5. System Configuration
- 15.6.6. Functionality
- 15.6.7. Deployment Mode
- 15.6.8. Application
- 15.6.9. End‑User Industry
- 16. Europe Smart Hydraulic Systems Market Analysis
- 16.1. Key Segment Analysis
- 16.2. Regional Snapshot
- 16.3. Europe Smart Hydraulic Systems Market Size (Volume - Thousand Units & Value - US$ Bn), Analysis, and Forecasts, 2021-2035
- 16.3.1. Component
- 16.3.2. Type
- 16.3.3. Technology
- 16.3.4. System Configuration
- 16.3.5. Functionality
- 16.3.6. Deployment Mode
- 16.3.7. Application
- 16.3.8. End‑User Industry
- 16.3.9. Country
- 16.3.9.1. Germany
- 16.3.9.2. United Kingdom
- 16.3.9.3. France
- 16.3.9.4. Italy
- 16.3.9.5. Spain
- 16.3.9.6. Netherlands
- 16.3.9.7. Nordic Countries
- 16.3.9.8. Poland
- 16.3.9.9. Russia & CIS
- 16.3.9.10. Rest of Europe
- 16.4. Germany Smart Hydraulic Systems Market
- 16.4.1. Country Segmental Analysis
- 16.4.2. Component
- 16.4.3. Type
- 16.4.4. Technology
- 16.4.5. System Configuration
- 16.4.6. Functionality
- 16.4.7. Deployment Mode
- 16.4.8. Application
- 16.4.9. End‑User Industry
- 16.5. United Kingdom Smart Hydraulic Systems Market
- 16.5.1. Country Segmental Analysis
- 16.5.2. Component
- 16.5.3. Type
- 16.5.4. Technology
- 16.5.5. System Configuration
- 16.5.6. Functionality
- 16.5.7. Deployment Mode
- 16.5.8. Application
- 16.5.9. End‑User Industry
- 16.6. France Smart Hydraulic Systems Market
- 16.6.1. Country Segmental Analysis
- 16.6.2. Component
- 16.6.3. Type
- 16.6.4. Technology
- 16.6.5. System Configuration
- 16.6.6. Functionality
- 16.6.7. Deployment Mode
- 16.6.8. Application
- 16.6.9. End‑User Industry
- 16.7. Italy Smart Hydraulic Systems Market
- 16.7.1. Country Segmental Analysis
- 16.7.2. Component
- 16.7.3. Type
- 16.7.4. Technology
- 16.7.5. System Configuration
- 16.7.6. Functionality
- 16.7.7. Deployment Mode
- 16.7.8. Application
- 16.7.9. End‑User Industry
- 16.8. Spain Smart Hydraulic Systems Market
- 16.8.1. Country Segmental Analysis
- 16.8.2. Component
- 16.8.3. Type
- 16.8.4. Technology
- 16.8.5. System Configuration
- 16.8.6. Functionality
- 16.8.7. Deployment Mode
- 16.8.8. Application
- 16.8.9. End‑User Industry
- 16.9. Netherlands Smart Hydraulic Systems Market
- 16.9.1. Country Segmental Analysis
- 16.9.2. Component
- 16.9.3. Type
- 16.9.4. Technology
- 16.9.5. System Configuration
- 16.9.6. Functionality
- 16.9.7. Deployment Mode
- 16.9.8. Application
- 16.9.9. End‑User Industry
- 16.10. Nordic Countries Smart Hydraulic Systems Market
- 16.10.1. Country Segmental Analysis
- 16.10.2. Component
- 16.10.3. Type
- 16.10.4. Technology
- 16.10.5. System Configuration
- 16.10.6. Functionality
- 16.10.7. Deployment Mode
- 16.10.8. Application
- 16.10.9. End‑User Industry
- 16.11. Poland Smart Hydraulic Systems Market
- 16.11.1. Country Segmental Analysis
- 16.11.2. Component
- 16.11.3. Type
- 16.11.4. Technology
- 16.11.5. System Configuration
- 16.11.6. Functionality
- 16.11.7. Deployment Mode
- 16.11.8. Application
- 16.11.9. End‑User Industry
- 16.12. Russia & CIS Smart Hydraulic Systems Market
- 16.12.1. Country Segmental Analysis
- 16.12.2. Component
- 16.12.3. Type
- 16.12.4. Technology
- 16.12.5. System Configuration
- 16.12.6. Functionality
- 16.12.7. Deployment Mode
- 16.12.8. Application
- 16.12.9. End‑User Industry
- 16.13. Rest of Europe Smart Hydraulic Systems Market
- 16.13.1. Country Segmental Analysis
- 16.13.2. Component
- 16.13.3. Type
- 16.13.4. Technology
- 16.13.5. System Configuration
- 16.13.6. Functionality
- 16.13.7. Deployment Mode
- 16.13.8. Application
- 16.13.9. End‑User Industry
- 17. Asia Pacific Smart Hydraulic Systems Market Analysis
- 17.1. Key Segment Analysis
- 17.2. Regional Snapshot
- 17.3. Asia Pacific Smart Hydraulic Systems Market Size (Volume - Thousand Units & Value - US$ Bn), Analysis, and Forecasts, 2021-2035
- 17.3.1. Component
- 17.3.2. Type
- 17.3.3. Technology
- 17.3.4. System Configuration
- 17.3.5. Functionality
- 17.3.6. Deployment Mode
- 17.3.7. Application
- 17.3.8. End‑User Industry
- 17.3.9. Country
- 17.3.9.1. China
- 17.3.9.2. India
- 17.3.9.3. Japan
- 17.3.9.4. South Korea
- 17.3.9.5. Australia and New Zealand
- 17.3.9.6. Indonesia
- 17.3.9.7. Malaysia
- 17.3.9.8. Thailand
- 17.3.9.9. Vietnam
- 17.3.9.10. Rest of Asia Pacific
- 17.4. China Smart Hydraulic Systems Market
- 17.4.1. Country Segmental Analysis
- 17.4.2. Component
- 17.4.3. Type
- 17.4.4. Technology
- 17.4.5. System Configuration
- 17.4.6. Functionality
- 17.4.7. Deployment Mode
- 17.4.8. Application
- 17.4.9. End‑User Industry
- 17.5. India Smart Hydraulic Systems Market
- 17.5.1. Country Segmental Analysis
- 17.5.2. Component
- 17.5.3. Type
- 17.5.4. Technology
- 17.5.5. System Configuration
- 17.5.6. Functionality
- 17.5.7. Deployment Mode
- 17.5.8. Application
- 17.5.9. End‑User Industry
- 17.6. Japan Smart Hydraulic Systems Market
- 17.6.1. Country Segmental Analysis
- 17.6.2. Component
- 17.6.3. Type
- 17.6.4. Technology
- 17.6.5. System Configuration
- 17.6.6. Functionality
- 17.6.7. Deployment Mode
- 17.6.8. Application
- 17.6.9. End‑User Industry
- 17.7. South Korea Smart Hydraulic Systems Market
- 17.7.1. Country Segmental Analysis
- 17.7.2. Component
- 17.7.3. Type
- 17.7.4. Technology
- 17.7.5. System Configuration
- 17.7.6. Functionality
- 17.7.7. Deployment Mode
- 17.7.8. Application
- 17.7.9. End‑User Industry
- 17.8. Australia and New Zealand Smart Hydraulic Systems Market
- 17.8.1. Country Segmental Analysis
- 17.8.2. Component
- 17.8.3. Type
- 17.8.4. Technology
- 17.8.5. System Configuration
- 17.8.6. Functionality
- 17.8.7. Deployment Mode
- 17.8.8. Application
- 17.8.9. End‑User Industry
- 17.9. Indonesia Smart Hydraulic Systems Market
- 17.9.1. Country Segmental Analysis
- 17.9.2. Component
- 17.9.3. Type
- 17.9.4. Technology
- 17.9.5. System Configuration
- 17.9.6. Functionality
- 17.9.7. Deployment Mode
- 17.9.8. Application
- 17.9.9. End‑User Industry
- 17.10. Malaysia Smart Hydraulic Systems Market
- 17.10.1. Country Segmental Analysis
- 17.10.2. Component
- 17.10.3. Type
- 17.10.4. Technology
- 17.10.5. System Configuration
- 17.10.6. Functionality
- 17.10.7. Deployment Mode
- 17.10.8. Application
- 17.10.9. End‑User Industry
- 17.11. Thailand Smart Hydraulic Systems Market
- 17.11.1. Country Segmental Analysis
- 17.11.2. Component
- 17.11.3. Type
- 17.11.4. Technology
- 17.11.5. System Configuration
- 17.11.6. Functionality
- 17.11.7. Deployment Mode
- 17.11.8. Application
- 17.11.9. End‑User Industry
- 17.12. Vietnam Smart Hydraulic Systems Market
- 17.12.1. Country Segmental Analysis
- 17.12.2. Component
- 17.12.3. Type
- 17.12.4. Technology
- 17.12.5. System Configuration
- 17.12.6. Functionality
- 17.12.7. Deployment Mode
- 17.12.8. Application
- 17.12.9. End‑User Industry
- 17.13. Rest of Asia Pacific Smart Hydraulic Systems Market
- 17.13.1. Country Segmental Analysis
- 17.13.2. Component
- 17.13.3. Type
- 17.13.4. Technology
- 17.13.5. System Configuration
- 17.13.6. Functionality
- 17.13.7. Deployment Mode
- 17.13.8. Application
- 17.13.9. End‑User Industry
- 18. Middle East Smart Hydraulic Systems Market Analysis
- 18.1. Key Segment Analysis
- 18.2. Regional Snapshot
- 18.3. Middle East Smart Hydraulic Systems Market Size (Volume - Thousand Units & Value - US$ Bn), Analysis, and Forecasts, 2021-2035
- 18.3.1. Component
- 18.3.2. Type
- 18.3.3. Technology
- 18.3.4. System Configuration
- 18.3.5. Functionality
- 18.3.6. Deployment Mode
- 18.3.7. Application
- 18.3.8. End‑User Industry
- 18.3.9. Country
- 18.3.9.1. Turkey
- 18.3.9.2. UAE
- 18.3.9.3. Saudi Arabia
- 18.3.9.4. Israel
- 18.3.9.5. Rest of Middle East
- 18.4. Turkey Smart Hydraulic Systems Market
- 18.4.1. Country Segmental Analysis
- 18.4.2. Component
- 18.4.3. Type
- 18.4.4. Technology
- 18.4.5. System Configuration
- 18.4.6. Functionality
- 18.4.7. Deployment Mode
- 18.4.8. Application
- 18.4.9. End‑User Industry
- 18.5. UAE Smart Hydraulic Systems Market
- 18.5.1. Country Segmental Analysis
- 18.5.2. Component
- 18.5.3. Type
- 18.5.4. Technology
- 18.5.5. System Configuration
- 18.5.6. Functionality
- 18.5.7. Deployment Mode
- 18.5.8. Application
- 18.5.9. End‑User Industry
- 18.6. Saudi Arabia Smart Hydraulic Systems Market
- 18.6.1. Country Segmental Analysis
- 18.6.2. Component
- 18.6.3. Type
- 18.6.4. Technology
- 18.6.5. System Configuration
- 18.6.6. Functionality
- 18.6.7. Deployment Mode
- 18.6.8. Application
- 18.6.9. End‑User Industry
- 18.7. Israel Smart Hydraulic Systems Market
- 18.7.1. Country Segmental Analysis
- 18.7.2. Component
- 18.7.3. Type
- 18.7.4. Technology
- 18.7.5. System Configuration
- 18.7.6. Functionality
- 18.7.7. Deployment Mode
- 18.7.8. Application
- 18.7.9. End‑User Industry
- 18.8. Rest of Middle East Smart Hydraulic Systems Market
- 18.8.1. Country Segmental Analysis
- 18.8.2. Component
- 18.8.3. Type
- 18.8.4. Technology
- 18.8.5. System Configuration
- 18.8.6. Functionality
- 18.8.7. Deployment Mode
- 18.8.8. Application
- 18.8.9. End‑User Industry
- 19. Africa Smart Hydraulic Systems Market Analysis
- 19.1. Key Segment Analysis
- 19.2. Regional Snapshot
- 19.3. Africa Smart Hydraulic Systems Market Size (Volume - Thousand Units & Value - US$ Bn), Analysis, and Forecasts, 2021-2035
- 19.3.1. Component
- 19.3.2. Type
- 19.3.3. Technology
- 19.3.4. System Configuration
- 19.3.5. Functionality
- 19.3.6. Deployment Mode
- 19.3.7. Application
- 19.3.8. End‑User Industry
- 19.3.9. Country
- 19.3.9.1. South Africa
- 19.3.9.2. Egypt
- 19.3.9.3. Nigeria
- 19.3.9.4. Algeria
- 19.3.9.5. Rest of Africa
- 19.4. South Africa Smart Hydraulic Systems Market
- 19.4.1. Country Segmental Analysis
- 19.4.2. Component
- 19.4.3. Type
- 19.4.4. Technology
- 19.4.5. System Configuration
- 19.4.6. Functionality
- 19.4.7. Deployment Mode
- 19.4.8. Application
- 19.4.9. End‑User Industry
- 19.5. Egypt Smart Hydraulic Systems Market
- 19.5.1. Country Segmental Analysis
- 19.5.2. Component
- 19.5.3. Type
- 19.5.4. Technology
- 19.5.5. System Configuration
- 19.5.6. Functionality
- 19.5.7. Deployment Mode
- 19.5.8. Application
- 19.5.9. End‑User Industry
- 19.6. Nigeria Smart Hydraulic Systems Market
- 19.6.1. Country Segmental Analysis
- 19.6.2. Component
- 19.6.3. Type
- 19.6.4. Technology
- 19.6.5. System Configuration
- 19.6.6. Functionality
- 19.6.7. Deployment Mode
- 19.6.8. Application
- 19.6.9. End‑User Industry
- 19.7. Algeria Smart Hydraulic Systems Market
- 19.7.1. Country Segmental Analysis
- 19.7.2. Component
- 19.7.3. Type
- 19.7.4. Technology
- 19.7.5. System Configuration
- 19.7.6. Functionality
- 19.7.7. Deployment Mode
- 19.7.8. Application
- 19.7.9. End‑User Industry
- 19.8. Rest of Africa Smart Hydraulic Systems Market
- 19.8.1. Country Segmental Analysis
- 19.8.2. Component
- 19.8.3. Type
- 19.8.4. Technology
- 19.8.5. System Configuration
- 19.8.6. Functionality
- 19.8.7. Deployment Mode
- 19.8.8. Application
- 19.8.9. End‑User Industry
- 20. South America Smart Hydraulic Systems Market Analysis
- 20.1. Key Segment Analysis
- 20.2. Regional Snapshot
- 20.3. South America Smart Hydraulic Systems Market Size (Volume - Thousand Units & Value - US$ Bn), Analysis, and Forecasts, 2021-2035
- 20.3.1. Component
- 20.3.2. Type
- 20.3.3. Technology
- 20.3.4. System Configuration
- 20.3.5. Functionality
- 20.3.6. Deployment Mode
- 20.3.7. Application
- 20.3.8. End‑User Industry
- 20.3.9. Country
- 20.3.9.1. Brazil
- 20.3.9.2. Argentina
- 20.3.9.3. Rest of South America
- 20.4. Brazil Smart Hydraulic Systems Market
- 20.4.1. Country Segmental Analysis
- 20.4.2. Component
- 20.4.3. Type
- 20.4.4. Technology
- 20.4.5. System Configuration
- 20.4.6. Functionality
- 20.4.7. Deployment Mode
- 20.4.8. Application
- 20.4.9. End‑User Industry
- 20.5. Argentina Smart Hydraulic Systems Market
- 20.5.1. Country Segmental Analysis
- 20.5.2. Component
- 20.5.3. Type
- 20.5.4. Technology
- 20.5.5. System Configuration
- 20.5.6. Functionality
- 20.5.7. Deployment Mode
- 20.5.8. Application
- 20.5.9. End‑User Industry
- 20.6. Rest of South America Smart Hydraulic Systems Market
- 20.6.1. Country Segmental Analysis
- 20.6.2. Component
- 20.6.3. Type
- 20.6.4. Technology
- 20.6.5. System Configuration
- 20.6.6. Functionality
- 20.6.7. Deployment Mode
- 20.6.8. Application
- 20.6.9. End‑User Industry
- 21. Key Players/ Company Profile
- 21.1. Advantech Co., Ltd.
- 21.1.1. Company Details/ Overview
- 21.1.2. Company Financials
- 21.1.3. Key Customers and Competitors
- 21.1.4. Business/ Industry Portfolio
- 21.1.5. Product Portfolio/ Specification Details
- 21.1.6. Pricing Data
- 21.1.7. Strategic Overview
- 21.1.8. Recent Developments
- 21.2. AU Optronics
- 21.3. Barco NV
- 21.4. BOE Technology Group
- 21.5. Chunghwa Picture Tubes (CPT)
- 21.6. HannStar Display Corporation
- 21.7. Hitachi Displays
- 21.8. Innolux Corporation
- 21.9. Kyocera Corporation
- 21.10. LG Display
- 21.11. Mitsubishi Electric
- 21.12. NEC Display Solutions
- 21.13. Panasonic Corporation
- 21.14. Philips Industrial Displays
- 21.15. Samsung Electronics
- 21.16. Seiko Epson Corporation
- 21.17. Sharp Corporation
- 21.18. Sony Corporation
- 21.19. Toshiba Corporation
- 21.20. Other Key Players
- 21.1. Advantech Co., Ltd.
Note* - This is just tentative list of players. While providing the report, we will cover more number of players based on their revenue and share for each geography
Research Design
Our research design integrates both demand-side and supply-side analysis through a balanced combination of primary and secondary research methodologies. By utilizing both bottom-up and top-down approaches alongside rigorous data triangulation methods, we deliver robust market intelligence that supports strategic decision-making.
MarketGenics' comprehensive research design framework ensures the delivery of accurate, reliable, and actionable market intelligence. Through the integration of multiple research approaches, rigorous validation processes, and expert analysis, we provide our clients with the insights needed to make informed strategic decisions and capitalize on market opportunities.

MarketGenics leverages a dedicated industry panel of experts and a comprehensive suite of paid databases to effectively collect, consolidate, and analyze market intelligence.
Our approach has consistently proven to be reliable and effective in generating accurate market insights, identifying key industry trends, and uncovering emerging business opportunities.
Through both primary and secondary research, we capture and analyze critical company-level data such as manufacturing footprints, including technical centers, R&D facilities, sales offices, and headquarters.
Our expert panel further enhances our ability to estimate market size for specific brands based on validated field-level intelligence.
Our data mining techniques incorporate both parametric and non-parametric methods, allowing for structured data collection, sorting, processing, and cleaning.
Demand projections are derived from large-scale data sets analyzed through proprietary algorithms, culminating in robust and reliable market sizing.
Research Approach
The bottom-up approach builds market estimates by starting with the smallest addressable market units and systematically aggregating them to create comprehensive market size projections.
This method begins with specific, granular data points and builds upward to create the complete market landscape.
Customer Analysis → Segmental Analysis → Geographical Analysis
The top-down approach starts with the broadest possible market data and systematically narrows it down through a series of filters and assumptions to arrive at specific market segments or opportunities.
This method begins with the big picture and works downward to increasingly specific market slices.
TAM → SAM → SOM


Research Methods
Desk / Secondary Research
While analysing the market, we extensively study secondary sources, directories, and databases to identify and collect information useful for this technical, market-oriented, and commercial report. Secondary sources that we utilize are not only the public sources, but it is a combination of Open Source, Associations, Paid Databases, MG Repository & Knowledgebase, and others.
- Company websites, annual reports, financial reports, broker reports, and investor presentations
- National government documents, statistical databases and reports
- News articles, press releases and web-casts specific to the companies operating in the market, Magazines, reports, and others
- We gather information from commercial data sources for deriving company specific data such as segmental revenue, share for geography, product revenue, and others
- Internal and external proprietary databases (industry-specific), relevant patent, and regulatory databases
- Governing Bodies, Government Organizations
- Relevant Authorities, Country-specific Associations for Industries
We also employ the model mapping approach to estimate the product level market data through the players' product portfolio
Primary Research
Primary research/ interviews is vital in analyzing the market. Most of the cases involves paid primary interviews. Primary sources include primary interviews through e-mail interactions, telephonic interviews, surveys as well as face-to-face interviews with the different stakeholders across the value chain including several industry experts.
| Type of Respondents | Number of Primaries |
|---|---|
| Tier 2/3 Suppliers | ~20 |
| Tier 1 Suppliers | ~25 |
| End-users | ~25 |
| Industry Expert/ Panel/ Consultant | ~30 |
| Total | ~100 |
MG Knowledgebase
• Repository of industry blog, newsletter and case studies
• Online platform covering detailed market reports, and company profiles
Forecasting Factors and Models
Forecasting Factors
- Historical Trends – Past market patterns, cycles, and major events that shaped how markets behave over time. Understanding past trends helps predict future behavior.
- Industry Factors – Specific characteristics of the industry like structure, regulations, and innovation cycles that affect market dynamics.
- Macroeconomic Factors – Economic conditions like GDP growth, inflation, and employment rates that affect how much money people have to spend.
- Demographic Factors – Population characteristics like age, income, and location that determine who can buy your product.
- Technology Factors – How quickly people adopt new technology and how much technology infrastructure exists.
- Regulatory Factors – Government rules, laws, and policies that can help or restrict market growth.
- Competitive Factors – Analyzing competition structure such as degree of competition and bargaining power of buyers and suppliers.
Forecasting Models / Techniques
Multiple Regression Analysis
- Identify and quantify factors that drive market changes
- Statistical modeling to establish relationships between market drivers and outcomes
Time Series Analysis – Seasonal Patterns
- Understand regular cyclical patterns in market demand
- Advanced statistical techniques to separate trend, seasonal, and irregular components
Time Series Analysis – Trend Analysis
- Identify underlying market growth patterns and momentum
- Statistical analysis of historical data to project future trends
Expert Opinion – Expert Interviews
- Gather deep industry insights and contextual understanding
- In-depth interviews with key industry stakeholders
Multi-Scenario Development
- Prepare for uncertainty by modeling different possible futures
- Creating optimistic, pessimistic, and most likely scenarios
Time Series Analysis – Moving Averages
- Sophisticated forecasting for complex time series data
- Auto-regressive integrated moving average models with seasonal components
Econometric Models
- Apply economic theory to market forecasting
- Sophisticated economic models that account for market interactions
Expert Opinion – Delphi Method
- Harness collective wisdom of industry experts
- Structured, multi-round expert consultation process
Monte Carlo Simulation
- Quantify uncertainty and probability distributions
- Thousands of simulations with varying input parameters
Research Analysis
Our research framework is built upon the fundamental principle of validating market intelligence from both demand and supply perspectives. This dual-sided approach ensures comprehensive market understanding and reduces the risk of single-source bias.
Demand-Side Analysis: We understand end-user/application behavior, preferences, and market needs along with the penetration of the product for specific application.
Supply-Side Analysis: We estimate overall market revenue, analyze the segmental share along with industry capacity, competitive landscape, and market structure.
Validation & Evaluation
Data triangulation is a validation technique that uses multiple methods, sources, or perspectives to examine the same research question, thereby increasing the credibility and reliability of research findings. In market research, triangulation serves as a quality assurance mechanism that helps identify and minimize bias, validate assumptions, and ensure accuracy in market estimates.
- Data Source Triangulation – Using multiple data sources to examine the same phenomenon
- Methodological Triangulation – Using multiple research methods to study the same research question
- Investigator Triangulation – Using multiple researchers or analysts to examine the same data
- Theoretical Triangulation – Using multiple theoretical perspectives to interpret the same data

Custom Market Research Services
We will customise the research for you, in case the report listed above does not meet your requirements.
Get 10% Free Customisation