Solar Inverter Market Size, Share & Trends Analysis Report by Inverter Type (String Inverters, Microinverters, Power Optimizers, Hybrid Inverters), Power Rating, Technology, Grid Connection, Installation Type, Mounting Location, Phase Type, End-Use Industry and Geography (North America, Europe, Asia Pacific, Middle East, Africa, and South America) – Global Industry Data, Trends, and Forecasts, 2026–2035
|
|
|
Segmental Data Insights |
|
|
Demand Trends |
|
|
Competitive Landscape |
|
|
Strategic Development |
|
|
Future Outlook & Opportunities |
|
Solar Inverter Market Size, Share, and Growth
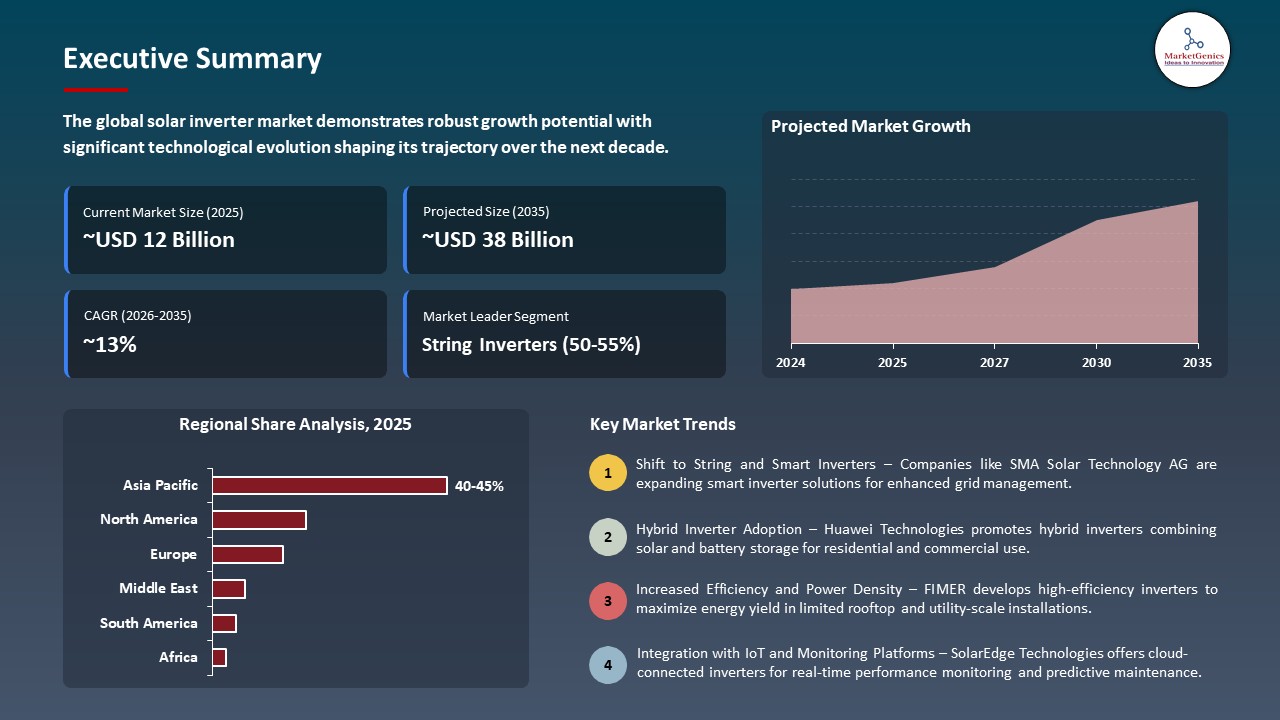
The global solar inverter market is witnessing strong growth, valued at USD 11.6 billion in 2025 and projected to reach USD 38.3 billion by 2035, expanding at a CAGR of 12.7% during the forecast period. North America is the fastest-growing region for the solar inverter market due to rapid solar capacity additions, supportive tax incentives, grid modernization programs, and increasing adoption of residential and utility-scale solar power systems.
Sanjay Puri, Country Manager, SolarEdge Technologies India, said, “The impressive response at the Expo strengthens our belief that India is at forefront of adopting sustainable energy. The SolarEdge new Home Hub Inverter is not just a technological innovation, it’s a move towards a cleaner, smarter, and more secure energy future. SolarEdge is dedicated to empowering homes and businesses to produce and control their own energy sustainably while contributing to a greener planet.”
The increasing number of solar power plants both in residential, commercial, and utility-scale businesses are highly pushing the demand of solar inverters since every photovoltaic system needs a powerful means of converting power to provide it to the power grid or the end-user. Hybrid and battery-ready invertors are being expanded to enhance the adoption of energy storage and enhance grid reliability, particularly in areas that experience power spikes.
Manufacturers are coming up with big capacity and smart inverters with a digital monitoring to serve the big solar projects. In 2025, Sunora established new grid-connected and hybrid inverters in commercial solar operations, which further established itself in the inverter market, and Solis released a 125kW hybrid inverter with AI-based energy management to facilitate high-efficiency solar systems to industrial and utility customers. Such developments indicate a growing investment in the sophisticated inverter technology to support the escalating solar capacity in the globe.
Battery energy storage systems, electric vehicle charging infrastructure, smart grid solutions, energy management software, and power electronics for renewable integration are key adjacent opportunities to the solar inverter market, as increasing solar installations require efficient storage, grid stability, and intelligent power conversion technologies to support reliable energy distribution.
 Solar Inverter Market Dynamics and Trends
Driver: Rising Utility-Scale Solar Projects Increasing Demand for High-Capacity String and Central Inverters Worldwide
-
Rapid growth of utility-scale solar power plants is creating a high demand of high capacity string and central inverters with additional large power loads, high efficiency and stable grid integration. Solar farms of large size also need inverter systems that are of a higher voltage and have improved thermal performance and digital monitoring to make sure that the conversion of energy and its uninterrupted performance is guaranteed.
- Increasing investments in large solar parks, grid connected renewable projects and high voltage photovoltaic systems are also shifting towards adoption of more advanced inverter technologies, which facilitate efficient transfer of power and reinforce the development of the solar inverter market in general.
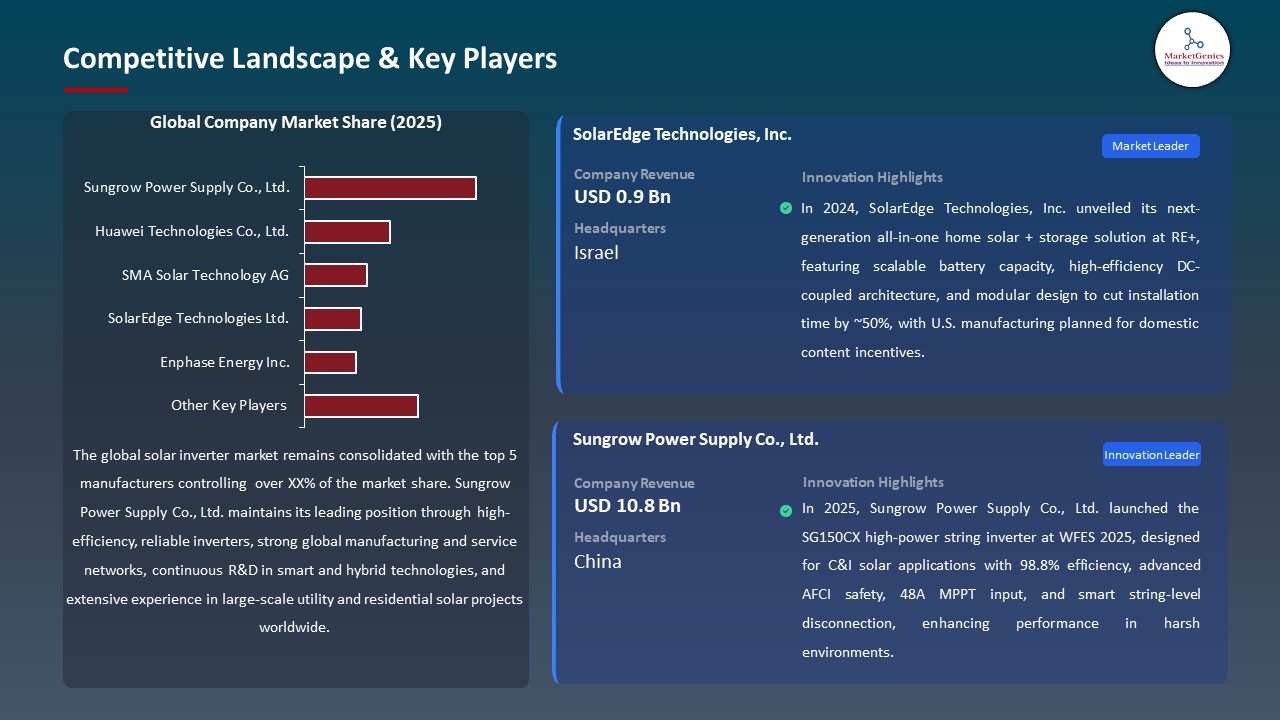
- The development of high capacity inverter solutions Sungrow Power Supply has unveiled a 4.8 MW modular inverter in September of 2025, used in utility-scale solar projects in the United States, aimed at enhancing efficiency, lowering system costs, and supporting large-scale PV installations, a response to increasing demand in the high-capacity inverter sector.
- The solar inverter market is expanding rapidly due to increasing utility-scale solar projects that demand high capacity inverters.
Restraint: Price Pressure and Inventory Fluctuations Creating Uncertainty for Solar Inverter Manufacturers
-
The solar inverter producers are under mounting pressure with price warfare, fluctuating installation demand and surplus inventory in the major solar markets. The vigorous fluctuation of government incentives, project setbacks, and imbalanced solar deployment cycles is complicating suppliers to achieve constant production rates to impact on profitability and long-term investment projections.
- Excess supply of the inverters in some areas, coupled with a drop in prices of equipment, is compelling the manufacturers to cut margins and still investing in new state-of-the-art equipment. These circumstances are bringing financial insecurity throughout the supply chain and halting the growth of manufacturing capacity even as long-term demand of solar power systems continues to grow.
- Pricing pressure and demand volatility are diminishing profitability and investment deceleration is holding down short-term solar inverter market expansion.
Opportunity: Expansion of Domestic Manufacturing Facilities Supporting Local Solar Equipment Supply Chains
-
Growth in localized production of solar inverters and manufacturing is generating high growth prospects since governments are encouraging local production to avoid overreliance on imports and enhance energy security. Local manufacturing operations can reduce delivery time, decrease logistics expenses and allow solar projects to be deployed more quickly in residential, commercial and utility-scale markets.
- Incentives to local production and increasing demand of renewable energy equipment Incentives to local production and increasing demand of renewable equipment in energy production is stimulating companies to set up new assembly facilities and lines of automated production, enhancing stability of supply chains and providing manufacturers to be able to quickly react to the rising world demands of solar installations.
- In 2025, Vsole Solar Energy established a 20,000-unit/month in-house inverter plant in Gujarat, India, promoting local production, supply chain agility, and fast deployment of solar projects.
- Growth in the production of domestic inverters is enhancing the supply-chain and enhancing the speed of roll out of solar projects around the world.
Key Trend: Increasing Launch of High-Efficiency Smart Inverters with Digital Monitoring and Grid Support Functions
-
The move in the solar inverter market is the adoption of high efficiency smart inverters that incorporate digital monitoring, remote diagnostics and enhanced grid-support capabilities. These inverters maximize conversion of energy, maximize the performance of the systems and also allow real time detection of faults and assure stable functioning of residential, commercial and utility scale solar installations.
- Manufacturers are also addressing grid-forming abilities, higher voltage tolerance, and weatherproof designs as well to facilitate integration of renewable. Intelligent inverter platforms are known to be experiencing continuous innovation as the developers strive to ensure maximum energy output, enhance ROI, and general increase in the use of solar power globally.
- Solar Edge Technologies also announced the release of a new Home Hub Inverter in India in 2025 that demonstrates the most innovative inverter technology, which is intended to manage the energy flow in residential buildings more wisely, efficiently, and safely, which is why the demand in this segment is high, and the development of clean energy systems becomes more widespread.
- High-efficiency smart inverters are being adopted and this is improving the operation of the systems and this allows the reliable management of energy and spearheads the increase in the solar inverter market globally.
 Solar Inverter Market Analysis and Segmental Data
String Inverters Dominate Global Solar Inverter Market
-
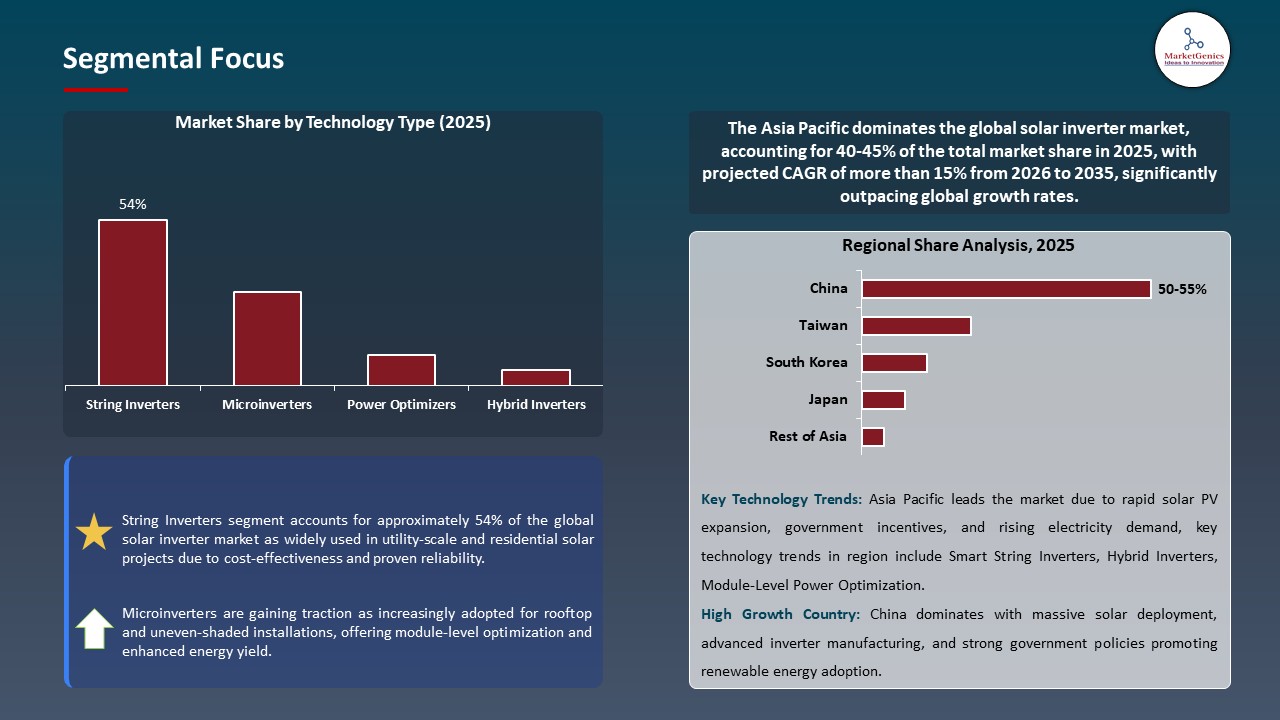
String inverters continue to dominate the global solar inverter market due to their flexibility, cost-effectiveness, and suitability for a wide range of residential, commercial, and small utility-scale solar installations. These inverters convert DC power from individual solar panels into AC power efficiently, enabling modular system expansion and easier maintenance. Their compact design and simple installation make them ideal for rooftops and distributed solar projects, driving widespread adoption across multiple regions.
- Other improvements in string inverter technology, including built-in monitoring, grid-support functions, and high voltage tolerance, are also solidifying their role in the market. String inverters have become a low cost, reliable, and scalable solution as the solar installations continue to multiply across the globe, which continues to make them the favorite tool in the small, and medium size photovoltaic system.
- The flexibility and high efficiency of string inverters remain the major factors that make them dominate the solar inverter market in the world.
Asia Pacific Leads Global Solar Inverter Market Demand
-
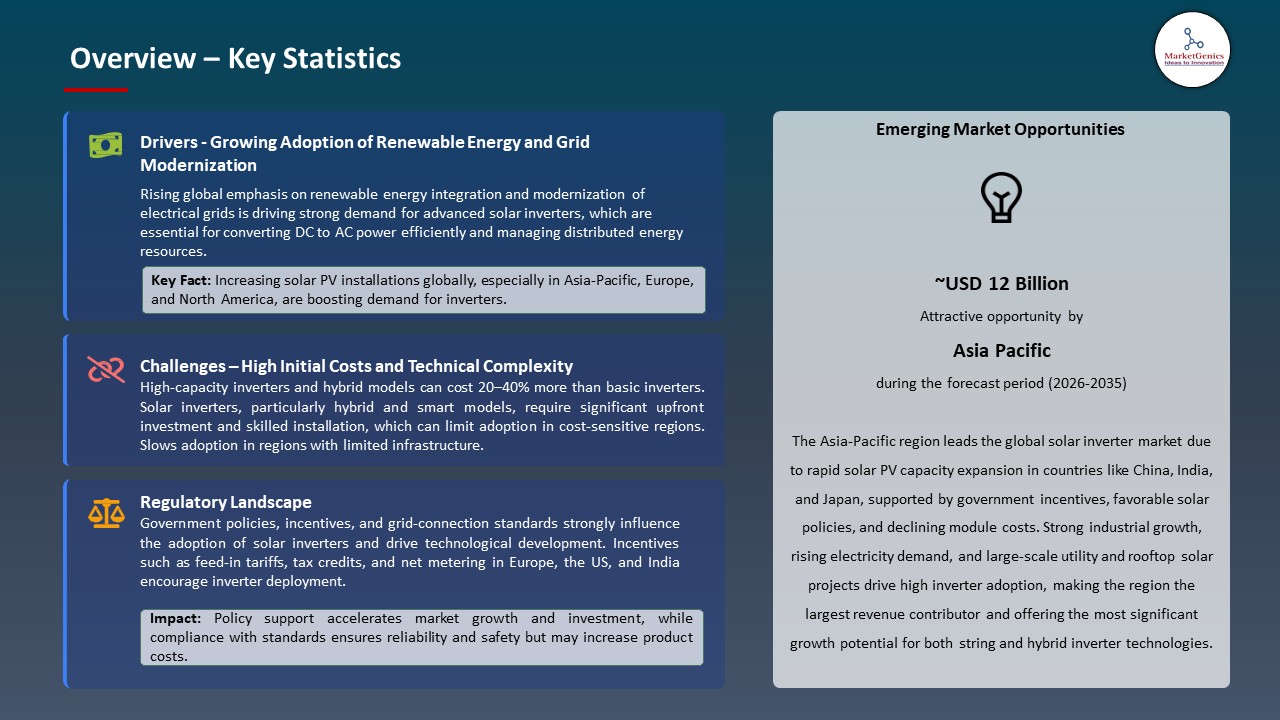
The Asia Pacific region leads the global solar inverter market due to rapid expansion of solar power capacity, supportive government policies, and growing investments in renewable energy infrastructure.
- Countries like China, India, Japan, and Australia are heavily implementing residential, commercial and utility scale solar projects to comply with increasing electricity demand, as well as sustainability goals. The high number of installations is creating a massive demand of both string and central inverters in the region.
- Favourable government incentives, local manufacturing programs, and the reduction in the prices of solar equipment are also increasing the uptake of the inverters. High-performance inverter systems with digital monitoring tools, grid support, and hybrid storage have been integrated and are now being implemented to improve the efficiency of energy and reliability of systems. High solar potential, policy favouring and technological innovation are together maintaining the dominance of Asia Pacific in the solar inverter market.
- Strong solar deployment and favorable policies have placed the Asia Pacific as the largest and fastest-growing solar inverter market in the world.
Solar Inverter Market Ecosystem
The global solar inverter market is consolidated, with key players including Sungrow Power Supply Co., Ltd., Huawei Technologies Co., Ltd., SMA Solar Technology AG, SolarEdge Technologies Ltd., and Enphase Energy Inc. These firms are capitalizing on diversified inverter technologies, modular and hybrid designs and large global production and distribution networks. Their market strength is enhanced by strategic partnership with solar developers, investments in large utility and commercial projects, continued research in high efficiency and smart inverter applications and creation of next generation systems to support grid, integrations of energy storage, and residential applications.
The value chain involves the sourcing of raw materials (semiconductors, PCBs and electronic components), manufacturing of the inverter, assembly of modules, software and energy management system integration, deployment and after sales services including performance monitoring, maintenance and warranty services. The stages are efficient, thermally controlled, safe and provide long term reliability in residential, commercial and utility-scale solar projects.
Entrepreneurial barriers are very high because of the complexity of technology, production is capital intensive and OEM-supplier relationships. Differentiation, scalability, and sustainable growth of the market are driven by continuous innovation in smart, high efficiency, and hybrid inverter platforms.
 Recent Development and Strategic Overview:
-
In September 2026, Polycab introduced its UT Series 350 kW three-phase string inverter in Tamil Nadu for utility-scale projects, featuring advanced efficiency, safety, and weather resilience. Leveraging over 1.5 GW of inverter supplies and a pan-India network of 3,800+ distributors, the launch strengthens large-scale solar deployment and operational performance across India.
- In December 2025, Waaree Energies set up two new inverter manufacturing lines in Gujarat via Waaree Power Pvt. Ltd., adding 3.05 GW annual capacity. This move strengthens its vertical integration strategy across solar modules, inverters, BESS, and green hydrogen, supporting India’s growing rooftop and utility-scale solar markets.
Report Scope
|
Detail |
|
|
Market Size in 2025 |
USD 11.6 Bn |
|
Market Forecast Value in 2035 |
USD 38.3 Bn |
|
Growth Rate (CAGR) |
12.7% |
|
Forecast Period |
2026 – 2035 |
|
Historical Data Available for |
2021 – 2024 |
|
Market Size Units |
US$ Billion for Value Units for Volume |
|
Report Format |
Electronic (PDF) + Excel |
|
North America |
Europe |
Asia Pacific |
Middle East |
Africa |
South America |
|
|
|
|
|
|
|
Companies Covered |
|||||
|
|
|
|
|
|
Solar Inverter Market Segmentation and Highlights
|
Segment |
Sub-segment |
|
Solar Inverter Market, By Inverter Type |
|
|
Solar Inverter Market, By Power Rating |
|
|
Solar Inverter Market, By Technology |
|
|
Solar Inverter Market, By Grid Connection |
|
|
Solar Inverter Market, By Installation Type |
|
|
Solar Inverter Market, By Mounting Location |
|
|
Solar Inverter Market, By Phase Type |
|
|
Solar Inverter Market, By End-Use Industry |
|
Frequently Asked Questions
Table of Contents
- 1. Research Methodology and Assumptions
- 1.1. Definitions
- 1.2. Research Design and Approach
- 1.3. Data Collection Methods
- 1.4. Base Estimates and Calculations
- 1.5. Forecasting Models
- 1.5.1. Key Forecast Factors & Impact Analysis
- 1.6. Secondary Research
- 1.6.1. Open Sources
- 1.6.2. Paid Databases
- 1.6.3. Associations
- 1.7. Primary Research
- 1.7.1. Primary Sources
- 1.7.2. Primary Interviews with Stakeholders across Ecosystem
- 2. Executive Summary
- 2.1. Global Solar Inverter Market Outlook
- 2.1.1. Solar Inverter Market Size (Volume (Units) and Value (US$ Bn)), and Forecasts, 2021-2035
- 2.1.2. Compounded Annual Growth Rate Analysis
- 2.1.3. Growth Opportunity Analysis
- 2.1.4. Segmental Share Analysis
- 2.1.5. Geographical Share Analysis
- 2.2. Market Analysis and Facts
- 2.3. Supply-Demand Analysis
- 2.4. Competitive Benchmarking
- 2.5. Go-to- Market Strategy
- 2.5.1. Customer/ End-use Industry Assessment
- 2.5.2. Growth Opportunity Data, 2026-2035
- 2.5.2.1. Regional Data
- 2.5.2.2. Country Data
- 2.5.2.3. Segmental Data
- 2.5.3. Identification of Potential Market Spaces
- 2.5.4. GAP Analysis
- 2.5.5. Potential Attractive Price Points
- 2.5.6. Prevailing Market Risks & Challenges
- 2.5.7. Preferred Sales & Marketing Strategies
- 2.5.8. Key Recommendations and Analysis
- 2.5.9. A Way Forward
- 2.1. Global Solar Inverter Market Outlook
- 3. Industry Data and Premium Insights
- 3.1. Global Energy & Power Industry Overview, 2025
- 3.1.1. Energy & Power Industry Ecosystem Analysis
- 3.1.2. Key Trends for Energy & Power Industry
- 3.1.3. Regional Distribution for Energy & Power Industry
- 3.2. Supplier Customer Data
- 3.3. Technology Roadmap and Developments
- 3.4. Trade Analysis
- 3.4.1. Import & Export Analysis, 2025
- 3.4.2. Top Importing Countries
- 3.4.3. Top Exporting Countries
- 3.5. Trump Tariff Impact Analysis
- 3.5.1. Manufacturer
- 3.5.1.1. Based on the component & Raw material
- 3.5.2. Supply Chain
- 3.5.3. End Consumer
- 3.5.1. Manufacturer
- 3.6. Raw Material Analysis
- 3.1. Global Energy & Power Industry Overview, 2025
- 4. Market Overview
- 4.1. Market Dynamics
- 4.1.1. Drivers
- 4.1.1.1. Growing adoption of solar energy systems worldwide
- 4.1.1.2. Technological advancements in inverter efficiency and smart features
- 4.1.1.3. Supportive government policies and renewable energy incentives
- 4.1.2. Restraints
- 4.1.2.1. High initial investment and installation costs
- 4.1.2.2. Dependence on grid infrastructure and limited standardization
- 4.1.1. Drivers
- 4.2. Key Trend Analysis
- 4.3. Regulatory Framework
- 4.3.1. Key Regulations, Norms, and Subsidies, by Key Countries
- 4.3.2. Tariffs and Standards
- 4.3.3. Impact Analysis of Regulations on the Market
- 4.4. Value Chain Analysis
- 4.4.1. Raw Material Sourcing
- 4.4.2. Inverter Manufacturing
- 4.4.3. Distribution & Sales
- 4.4.4. Operation & Maintenance (O&M)
- 4.4.5. After-Sales Support & Recycling
- 4.5. Porter’s Five Forces Analysis
- 4.6. PESTEL Analysis
- 4.7. Global Solar Inverter Market Demand
- 4.7.1. Historical Market Size – (Volume (Units) and Value (US$ Bn)), 2020-2024
- 4.7.2. Current and Future Market Size – (Volume (Units) and Value (US$ Bn)), 2026–2035
- 4.7.2.1. Y-o-Y Growth Trends
- 4.7.2.2. Absolute $ Opportunity Assessment
- 4.1. Market Dynamics
- 5. Competition Landscape
- 5.1. Competition structure
- 5.1.1. Fragmented v/s consolidated
- 5.2. Company Share Analysis, 2025
- 5.2.1. Global Company Market Share
- 5.2.2. By Region
- 5.2.2.1. North America
- 5.2.2.2. Europe
- 5.2.2.3. Asia Pacific
- 5.2.2.4. Middle East
- 5.2.2.5. Africa
- 5.2.2.6. South America
- 5.3. Product Comparison Matrix
- 5.3.1. Specifications
- 5.3.2. Market Positioning
- 5.3.3. Pricing
- 5.1. Competition structure
- 6. Global Solar Inverter Market Analysis, by Inverter Type
- 6.1. Key Segment Analysis
- 6.2. Solar Inverter Market Size (Volume (Units) and Value (US$ Bn)), Analysis, and Forecasts, by Inverter Type, 2021-2035
- 6.2.1. String Inverters
- 6.2.2. Microinverters
- 6.2.3. Power Optimizers
- 6.2.4. Hybrid Inverters
- 7. Global Solar Inverter Market Analysis, by Power Rating
- 7.1. Key Segment Analysis
- 7.2. Solar Inverter Market Size (Volume (Units) and Value (US$ Bn)), Analysis, and Forecasts, by Power Rating, 2021-2035
- 7.2.1. Below 5 kW
- 7.2.2. 5-10 kW
- 7.2.3. 10-50 kW
- 7.2.4. 50-250 kW
- 7.2.5. Above 250 kW
- 8. Global Solar Inverter Market Analysis, Technology
- 8.1. Key Segment Analysis
- 8.2. Solar Inverter Market Size (Volume (Units) and Value (US$ Bn)), Analysis, and Forecasts, by Technology, 2021-2035
- 8.2.1. Pulse Width Modulation (PWM)
- 8.2.2. Maximum Power Point Tracking (MPPT)
- 8.2.3. Grid-Tied Technology
- 8.2.4. Standalone Technology
- 8.2.5. Battery-Integrated Technology
- 9. Global Solar Inverter Market Analysis, by Grid Connection
- 9.1. Key Segment Analysis
- 9.2. Solar Inverter Market Size (Volume (Units) and Value (US$ Bn)), Analysis, and Forecasts, by Grid Connection, 2021-2035
- 9.2.1. On-Grid
- 9.2.2. Off-Grid
- 9.2.3. Hybrid
- 10. Global Solar Inverter Market Analysis, by Installation Type
- 10.1. Key Segment Analysis
- 10.2. Solar Inverter Market Size (Volume (Units) and Value (US$ Bn)), Analysis, and Forecasts, by Installation Type, 2021-2035
- 10.2.1. Rooftop Installation
- 10.2.2. Ground-Mounted Installation
- 10.2.3. Floating/Water-Based Installation
- 10.2.4. Building-Integrated PV (BIPV)
- 11. Global Solar Inverter Market Analysis, by Mounting Location
- 11.1. Key Segment Analysis
- 11.2. Solar Inverter Market Size (Volume (Units) and Value (US$ Bn)), Analysis, and Forecasts, by Mounting Location, 2021-2035
- 11.2.1. String Level
- 11.2.2. Module Level
- 11.2.3. Utility Scale
- 11.2.4. Distributed Installation
- 12. Global Solar Inverter Market Analysis, by Phase Type
- 12.1. Key Segment Analysis
- 12.2. Solar Inverter Market Size (Volume (Units) and Value (US$ Bn)), Analysis, and Forecasts, by Phase Type, 2021-2035
- 12.2.1. Single-phase
- 12.2.2. Three-phase
- 13. Global Solar Inverter Market Analysis and Forecasts, by End-Use Industry
- 13.1. Key Findings
- 13.2. Solar Inverter Market Size (Volume (Units) and Value (US$ Bn)), Analysis, and Forecasts, by End-Use Industry, 2021-2035
- 13.2.1. Residential Sector
- 13.2.2. Commercial Sector
- 13.2.3. Industrial Sector
- 13.2.4. Utility/Large-Scale Power Generation
- 13.2.5. Agricultural Applications
- 13.2.6. Telecommunications
- 13.2.7. Healthcare/Medical Facilities
- 13.2.8. Educational Institutions
- 13.2.9. Government/Public Infrastructure
- 13.2.10. Hospitality Sector
- 13.2.11. Other End-users
- 14. Global Solar Inverter Market Analysis and Forecasts, by Region
- 14.1. Key Findings
- 14.2. Solar Inverter Market Size (Volume (Units) and Value (US$ Bn)), Analysis, and Forecasts, by Region, 2021-2035
- 14.2.1. North America
- 14.2.2. Europe
- 14.2.3. Asia Pacific
- 14.2.4. Middle East
- 14.2.5. Africa
- 14.2.6. South America
- 15. North America Solar Inverter Market Analysis
- 15.1. Key Segment Analysis
- 15.2. Regional Snapshot
- 15.3. North America Solar Inverter Market Size (Volume (Units) and Value (US$ Bn)), Analysis, and Forecasts, 2021-2035
- 15.3.1. Inverter Type
- 15.3.2. Power Rating
- 15.3.3. Technology
- 15.3.4. Grid Connection
- 15.3.5. Installation Type
- 15.3.6. Mounting Location
- 15.3.7. Phase Type
- 15.3.8. End-Use Industry
- 15.3.9. Country
- 15.3.9.1. USA
- 15.3.9.2. Canada
- 15.3.9.3. Mexico
- 15.4. USA Solar Inverter Market
- 15.4.1. Country Segmental Analysis
- 15.4.2. Inverter Type
- 15.4.3. Power Rating
- 15.4.4. Technology
- 15.4.5. Grid Connection
- 15.4.6. Installation Type
- 15.4.7. Mounting Location
- 15.4.8. Phase Type
- 15.4.9. End-Use Industry
- 15.5. Canada Solar Inverter Market
- 15.5.1. Country Segmental Analysis
- 15.5.2. Inverter Type
- 15.5.3. Power Rating
- 15.5.4. Technology
- 15.5.5. Grid Connection
- 15.5.6. Installation Type
- 15.5.7. Mounting Location
- 15.5.8. Phase Type
- 15.5.9. End-Use Industry
- 15.6. Mexico Solar Inverter Market
- 15.6.1. Country Segmental Analysis
- 15.6.2. Inverter Type
- 15.6.3. Power Rating
- 15.6.4. Technology
- 15.6.5. Grid Connection
- 15.6.6. Installation Type
- 15.6.7. Mounting Location
- 15.6.8. Phase Type
- 15.6.9. End-Use Industry
- 16. Europe Solar Inverter Market Analysis
- 16.1. Key Segment Analysis
- 16.2. Regional Snapshot
- 16.3. Europe Solar Inverter Market Size (Volume (Units) and Value (US$ Bn)), Analysis, and Forecasts, 2021-2035
- 16.3.1. Inverter Type
- 16.3.2. Power Rating
- 16.3.3. Technology
- 16.3.4. Grid Connection
- 16.3.5. Installation Type
- 16.3.6. Mounting Location
- 16.3.7. Phase Type
- 16.3.8. End-Use Industry
- 16.3.9. Country
- 16.3.9.1. Germany
- 16.3.9.2. United Kingdom
- 16.3.9.3. France
- 16.3.9.4. Italy
- 16.3.9.5. Spain
- 16.3.9.6. Netherlands
- 16.3.9.7. Nordic Countries
- 16.3.9.8. Poland
- 16.3.9.9. Russia & CIS
- 16.3.9.10. Rest of Europe
- 16.4. Germany Solar Inverter Market
- 16.4.1. Country Segmental Analysis
- 16.4.2. Inverter Type
- 16.4.3. Power Rating
- 16.4.4. Technology
- 16.4.5. Grid Connection
- 16.4.6. Installation Type
- 16.4.7. Mounting Location
- 16.4.8. Phase Type
- 16.4.9. End-Use Industry
- 16.5. United Kingdom Solar Inverter Market
- 16.5.1. Country Segmental Analysis
- 16.5.2. Inverter Type
- 16.5.3. Power Rating
- 16.5.4. Technology
- 16.5.5. Grid Connection
- 16.5.6. Installation Type
- 16.5.7. Mounting Location
- 16.5.8. Phase Type
- 16.5.9. End-Use Industry
- 16.6. France Solar Inverter Market
- 16.6.1. Country Segmental Analysis
- 16.6.2. Inverter Type
- 16.6.3. Power Rating
- 16.6.4. Technology
- 16.6.5. Grid Connection
- 16.6.6. Installation Type
- 16.6.7. Mounting Location
- 16.6.8. Phase Type
- 16.6.9. End-Use Industry
- 16.7. Italy Solar Inverter Market
- 16.7.1. Country Segmental Analysis
- 16.7.2. Inverter Type
- 16.7.3. Power Rating
- 16.7.4. Technology
- 16.7.5. Grid Connection
- 16.7.6. Installation Type
- 16.7.7. Mounting Location
- 16.7.8. Phase Type
- 16.7.9. End-Use Industry
- 16.8. Spain Solar Inverter Market
- 16.8.1. Country Segmental Analysis
- 16.8.2. Inverter Type
- 16.8.3. Power Rating
- 16.8.4. Technology
- 16.8.5. Grid Connection
- 16.8.6. Installation Type
- 16.8.7. Mounting Location
- 16.8.8. Phase Type
- 16.8.9. End-Use Industry
- 16.9. Netherlands Solar Inverter Market
- 16.9.1. Country Segmental Analysis
- 16.9.2. Inverter Type
- 16.9.3. Power Rating
- 16.9.4. Technology
- 16.9.5. Grid Connection
- 16.9.6. Installation Type
- 16.9.7. Mounting Location
- 16.9.8. Phase Type
- 16.9.9. End-Use Industry
- 16.10. Nordic Countries Solar Inverter Market
- 16.10.1. Country Segmental Analysis
- 16.10.2. Inverter Type
- 16.10.3. Power Rating
- 16.10.4. Technology
- 16.10.5. Grid Connection
- 16.10.6. Installation Type
- 16.10.7. Mounting Location
- 16.10.8. Phase Type
- 16.10.9. End-Use Industry
- 16.11. Poland Solar Inverter Market
- 16.11.1. Country Segmental Analysis
- 16.11.2. Inverter Type
- 16.11.3. Power Rating
- 16.11.4. Technology
- 16.11.5. Grid Connection
- 16.11.6. Installation Type
- 16.11.7. Mounting Location
- 16.11.8. Phase Type
- 16.11.9. End-Use Industry
- 16.12. Russia & CIS Solar Inverter Market
- 16.12.1. Country Segmental Analysis
- 16.12.2. Inverter Type
- 16.12.3. Power Rating
- 16.12.4. Technology
- 16.12.5. Grid Connection
- 16.12.6. Installation Type
- 16.12.7. Mounting Location
- 16.12.8. Phase Type
- 16.12.9. End-Use Industry
- 16.13. Rest of Europe Solar Inverter Market
- 16.13.1. Country Segmental Analysis
- 16.13.2. Inverter Type
- 16.13.3. Power Rating
- 16.13.4. Technology
- 16.13.5. Grid Connection
- 16.13.6. Installation Type
- 16.13.7. Mounting Location
- 16.13.8. Phase Type
- 16.13.9. End-Use Industry
- 17. Asia Pacific Solar Inverter Market Analysis
- 17.1. Key Segment Analysis
- 17.2. Regional Snapshot
- 17.3. Asia Pacific Solar Inverter Market Size (Volume (Units) and Value (US$ Bn)), Analysis, and Forecasts, 2021-2035
- 17.3.1. Inverter Type
- 17.3.2. Power Rating
- 17.3.3. Technology
- 17.3.4. Grid Connection
- 17.3.5. Installation Type
- 17.3.6. Mounting Location
- 17.3.7. Phase Type
- 17.3.8. End-Use Industry
- 17.3.9. Country
- 17.3.9.1. China
- 17.3.9.2. India
- 17.3.9.3. Japan
- 17.3.9.4. South Korea
- 17.3.9.5. Australia and New Zealand
- 17.3.9.6. Indonesia
- 17.3.9.7. Malaysia
- 17.3.9.8. Thailand
- 17.3.9.9. Vietnam
- 17.3.9.10. Rest of Asia Pacific
- 17.4. China Solar Inverter Market
- 17.4.1. Country Segmental Analysis
- 17.4.2. Inverter Type
- 17.4.3. Power Rating
- 17.4.4. Technology
- 17.4.5. Grid Connection
- 17.4.6. Installation Type
- 17.4.7. Mounting Location
- 17.4.8. Phase Type
- 17.4.9. End-Use Industry
- 17.5. India Solar Inverter Market
- 17.5.1. Country Segmental Analysis
- 17.5.2. Inverter Type
- 17.5.3. Power Rating
- 17.5.4. Technology
- 17.5.5. Grid Connection
- 17.5.6. Installation Type
- 17.5.7. Mounting Location
- 17.5.8. Phase Type
- 17.5.9. End-Use Industry
- 17.6. Japan Solar Inverter Market
- 17.6.1. Country Segmental Analysis
- 17.6.2. Inverter Type
- 17.6.3. Power Rating
- 17.6.4. Technology
- 17.6.5. Grid Connection
- 17.6.6. Installation Type
- 17.6.7. Mounting Location
- 17.6.8. Phase Type
- 17.6.9. End-Use Industry
- 17.7. South Korea Solar Inverter Market
- 17.7.1. Country Segmental Analysis
- 17.7.2. Inverter Type
- 17.7.3. Power Rating
- 17.7.4. Technology
- 17.7.5. Grid Connection
- 17.7.6. Installation Type
- 17.7.7. Mounting Location
- 17.7.8. Phase Type
- 17.7.9. End-Use Industry
- 17.8. Australia and New Zealand Solar Inverter Market
- 17.8.1. Country Segmental Analysis
- 17.8.2. Inverter Type
- 17.8.3. Power Rating
- 17.8.4. Technology
- 17.8.5. Grid Connection
- 17.8.6. Installation Type
- 17.8.7. Mounting Location
- 17.8.8. Phase Type
- 17.8.9. End-Use Industry
- 17.9. Indonesia Solar Inverter Market
- 17.9.1. Country Segmental Analysis
- 17.9.2. Inverter Type
- 17.9.3. Power Rating
- 17.9.4. Technology
- 17.9.5. Grid Connection
- 17.9.6. Installation Type
- 17.9.7. Mounting Location
- 17.9.8. Phase Type
- 17.9.9. End-Use Industry
- 17.10. Malaysia Solar Inverter Market
- 17.10.1. Country Segmental Analysis
- 17.10.2. Inverter Type
- 17.10.3. Power Rating
- 17.10.4. Technology
- 17.10.5. Grid Connection
- 17.10.6. Installation Type
- 17.10.7. Mounting Location
- 17.10.8. Phase Type
- 17.10.9. End-Use Industry
- 17.11. Thailand Solar Inverter Market
- 17.11.1. Country Segmental Analysis
- 17.11.2. Inverter Type
- 17.11.3. Power Rating
- 17.11.4. Technology
- 17.11.5. Grid Connection
- 17.11.6. Installation Type
- 17.11.7. Mounting Location
- 17.11.8. Phase Type
- 17.11.9. End-Use Industry
- 17.12. Vietnam Solar Inverter Market
- 17.12.1. Country Segmental Analysis
- 17.12.2. Inverter Type
- 17.12.3. Power Rating
- 17.12.4. Technology
- 17.12.5. Grid Connection
- 17.12.6. Installation Type
- 17.12.7. Mounting Location
- 17.12.8. Phase Type
- 17.12.9. End-Use Industry
- 17.13. Rest of Asia Pacific Solar Inverter Market
- 17.13.1. Country Segmental Analysis
- 17.13.2. Inverter Type
- 17.13.3. Power Rating
- 17.13.4. Technology
- 17.13.5. Grid Connection
- 17.13.6. Installation Type
- 17.13.7. Mounting Location
- 17.13.8. Phase Type
- 17.13.9. End-Use Industry
- 18. Middle East Solar Inverter Market Analysis
- 18.1. Key Segment Analysis
- 18.2. Regional Snapshot
- 18.3. Middle East Solar Inverter Market Size (Volume (Units) and Value (US$ Bn)), Analysis, and Forecasts, 2021-2035
- 18.3.1. Inverter Type
- 18.3.2. Power Rating
- 18.3.3. Technology
- 18.3.4. Grid Connection
- 18.3.5. Installation Type
- 18.3.6. Mounting Location
- 18.3.7. Phase Type
- 18.3.8. End-Use Industry
- 18.3.9. Country
- 18.3.9.1. Turkey
- 18.3.9.2. UAE
- 18.3.9.3. Saudi Arabia
- 18.3.9.4. Israel
- 18.3.9.5. Rest of Middle East
- 18.4. Turkey Solar Inverter Market
- 18.4.1. Country Segmental Analysis
- 18.4.2. Inverter Type
- 18.4.3. Power Rating
- 18.4.4. Technology
- 18.4.5. Grid Connection
- 18.4.6. Installation Type
- 18.4.7. Mounting Location
- 18.4.8. Phase Type
- 18.4.9. End-Use Industry
- 18.5. UAE Solar Inverter Market
- 18.5.1. Country Segmental Analysis
- 18.5.2. Inverter Type
- 18.5.3. Power Rating
- 18.5.4. Technology
- 18.5.5. Grid Connection
- 18.5.6. Installation Type
- 18.5.7. Mounting Location
- 18.5.8. Phase Type
- 18.5.9. End-Use Industry
- 18.6. Saudi Arabia Solar Inverter Market
- 18.6.1. Country Segmental Analysis
- 18.6.2. Inverter Type
- 18.6.3. Power Rating
- 18.6.4. Technology
- 18.6.5. Grid Connection
- 18.6.6. Installation Type
- 18.6.7. Mounting Location
- 18.6.8. Phase Type
- 18.6.9. End-Use Industry
- 18.7. Israel Solar Inverter Market
- 18.7.1. Country Segmental Analysis
- 18.7.2. Inverter Type
- 18.7.3. Power Rating
- 18.7.4. Technology
- 18.7.5. Grid Connection
- 18.7.6. Installation Type
- 18.7.7. Mounting Location
- 18.7.8. Phase Type
- 18.7.9. End-Use Industry
- 18.8. Rest of Middle East Solar Inverter Market
- 18.8.1. Country Segmental Analysis
- 18.8.2. Inverter Type
- 18.8.3. Power Rating
- 18.8.4. Technology
- 18.8.5. Grid Connection
- 18.8.6. Installation Type
- 18.8.7. Mounting Location
- 18.8.8. Phase Type
- 18.8.9. End-Use Industry
- 19. Africa Solar Inverter Market Analysis
- 19.1. Key Segment Analysis
- 19.2. Regional Snapshot
- 19.3. Africa Solar Inverter Market Size (Volume (Units) and Value (US$ Bn)), Analysis, and Forecasts, 2021-2035
- 19.3.1. Inverter Type
- 19.3.2. Power Rating
- 19.3.3. Technology
- 19.3.4. Grid Connection
- 19.3.5. Installation Type
- 19.3.6. Mounting Location
- 19.3.7. Phase Type
- 19.3.8. End-Use Industry
- 19.3.9. Country
- 19.3.9.1. South Africa
- 19.3.9.2. Egypt
- 19.3.9.3. Nigeria
- 19.3.9.4. Algeria
- 19.3.9.5. Rest of Africa
- 19.4. South Africa Solar Inverter Market
- 19.4.1. Country Segmental Analysis
- 19.4.2. Inverter Type
- 19.4.3. Power Rating
- 19.4.4. Technology
- 19.4.5. Grid Connection
- 19.4.6. Installation Type
- 19.4.7. Mounting Location
- 19.4.8. Phase Type
- 19.4.9. End-Use Industry
- 19.5. Egypt Solar Inverter Market
- 19.5.1. Country Segmental Analysis
- 19.5.2. Inverter Type
- 19.5.3. Power Rating
- 19.5.4. Technology
- 19.5.5. Grid Connection
- 19.5.6. Installation Type
- 19.5.7. Mounting Location
- 19.5.8. Phase Type
- 19.5.9. End-Use Industry
- 19.6. Nigeria Solar Inverter Market
- 19.6.1. Country Segmental Analysis
- 19.6.2. Inverter Type
- 19.6.3. Power Rating
- 19.6.4. Technology
- 19.6.5. Grid Connection
- 19.6.6. Installation Type
- 19.6.7. Mounting Location
- 19.6.8. Phase Type
- 19.6.9. End-Use Industry
- 19.7. Algeria Solar Inverter Market
- 19.7.1. Country Segmental Analysis
- 19.7.2. Inverter Type
- 19.7.3. Power Rating
- 19.7.4. Technology
- 19.7.5. Grid Connection
- 19.7.6. Installation Type
- 19.7.7. Mounting Location
- 19.7.8. Phase Type
- 19.7.9. End-Use Industry
- 19.8. Rest of Africa Solar Inverter Market
- 19.8.1. Country Segmental Analysis
- 19.8.2. Inverter Type
- 19.8.3. Power Rating
- 19.8.4. Technology
- 19.8.5. Grid Connection
- 19.8.6. Installation Type
- 19.8.7. Mounting Location
- 19.8.8. Phase Type
- 19.8.9. End-Use Industry
- 20. South America Solar Inverter Market Analysis
- 20.1. Key Segment Analysis
- 20.2. Regional Snapshot
- 20.3. South America Solar Inverter Market Size (Volume (Units) and Value (US$ Bn)), Analysis, and Forecasts, 2021-2035
- 20.3.1. Inverter Type
- 20.3.2. Power Rating
- 20.3.3. Technology
- 20.3.4. Grid Connection
- 20.3.5. Installation Type
- 20.3.6. Mounting Location
- 20.3.7. Phase Type
- 20.3.8. End-Use Industry
- 20.3.9. Country
- 20.3.9.1. Brazil
- 20.3.9.2. Argentina
- 20.3.9.3. Rest of South America
- 20.4. Brazil Solar Inverter Market
- 20.4.1. Country Segmental Analysis
- 20.4.2. Inverter Type
- 20.4.3. Power Rating
- 20.4.4. Technology
- 20.4.5. Grid Connection
- 20.4.6. Installation Type
- 20.4.7. Mounting Location
- 20.4.8. Phase Type
- 20.4.9. End-Use Industry
- 20.5. Argentina Solar Inverter Market
- 20.5.1. Country Segmental Analysis
- 20.5.2. Inverter Type
- 20.5.3. Power Rating
- 20.5.4. Technology
- 20.5.5. Grid Connection
- 20.5.6. Installation Type
- 20.5.7. Mounting Location
- 20.5.8. Phase Type
- 20.5.9. End-Use Industry
- 20.6. Rest of South America Solar Inverter Market
- 20.6.1. Country Segmental Analysis
- 20.6.2. Inverter Type
- 20.6.3. Power Rating
- 20.6.4. Technology
- 20.6.5. Grid Connection
- 20.6.6. Installation Type
- 20.6.7. Mounting Location
- 20.6.8. Phase Type
- 20.6.9. End-Use Industry
- 21. Key Players/ Company Profile
- 21.1. ABB Ltd.
- 21.1.1. Company Details/ Overview
- 21.1.2. Company Financials
- 21.1.3. Key Customers and Competitors
- 21.1.4. Business/ Industry Portfolio
- 21.1.5. Product Portfolio/ Specification Details
- 21.1.6. Pricing Data
- 21.1.7. Strategic Overview
- 21.1.8. Recent Developments
- 21.2. Canadian Solar Inc.
- 21.3. Delta Electronics Inc.
- 21.4. Enphase Energy Inc.
- 21.5. First Solar Inc.
- 21.6. Fronius International GmbH
- 21.7. Goodwe Technologies Co., Ltd.
- 21.8. Growatt New Energy Technology Co., Ltd.
- 21.9. Huawei Technologies Co., Ltd.
- 21.10. JinkoSolar Holding Co., Ltd.
- 21.11. Kaco New Energy GmbH
- 21.12. Psm Solutions India Pvt. Ltd.
- 21.13. Schneider Electric SE
- 21.14. Siemens AG
- 21.15. SMA Solar Technology AG
- 21.16. Solaredge Technologies Ltd.
- 21.17. Sungrow Power Supply Co., Ltd.
- 21.18. SunPower Corporation
- 21.19. TRES Electronica
- 21.20. Zilkha Biomass
- 21.21. Other Key Players
- 21.1. ABB Ltd.
Note* - This is just tentative list of players. While providing the report, we will cover more number of players based on their revenue and share for each geography
Research Design
Our research design integrates both demand-side and supply-side analysis through a balanced combination of primary and secondary research methodologies. By utilizing both bottom-up and top-down approaches alongside rigorous data triangulation methods, we deliver robust market intelligence that supports strategic decision-making.
MarketGenics' comprehensive research design framework ensures the delivery of accurate, reliable, and actionable market intelligence. Through the integration of multiple research approaches, rigorous validation processes, and expert analysis, we provide our clients with the insights needed to make informed strategic decisions and capitalize on market opportunities.

MarketGenics leverages a dedicated industry panel of experts and a comprehensive suite of paid databases to effectively collect, consolidate, and analyze market intelligence.
Our approach has consistently proven to be reliable and effective in generating accurate market insights, identifying key industry trends, and uncovering emerging business opportunities.
Through both primary and secondary research, we capture and analyze critical company-level data such as manufacturing footprints, including technical centers, R&D facilities, sales offices, and headquarters.
Our expert panel further enhances our ability to estimate market size for specific brands based on validated field-level intelligence.
Our data mining techniques incorporate both parametric and non-parametric methods, allowing for structured data collection, sorting, processing, and cleaning.
Demand projections are derived from large-scale data sets analyzed through proprietary algorithms, culminating in robust and reliable market sizing.
Research Approach
The bottom-up approach builds market estimates by starting with the smallest addressable market units and systematically aggregating them to create comprehensive market size projections.
This method begins with specific, granular data points and builds upward to create the complete market landscape.
Customer Analysis → Segmental Analysis → Geographical Analysis
The top-down approach starts with the broadest possible market data and systematically narrows it down through a series of filters and assumptions to arrive at specific market segments or opportunities.
This method begins with the big picture and works downward to increasingly specific market slices.
TAM → SAM → SOM


Research Methods
Desk / Secondary Research
While analysing the market, we extensively study secondary sources, directories, and databases to identify and collect information useful for this technical, market-oriented, and commercial report. Secondary sources that we utilize are not only the public sources, but it is a combination of Open Source, Associations, Paid Databases, MG Repository & Knowledgebase, and others.
- Company websites, annual reports, financial reports, broker reports, and investor presentations
- National government documents, statistical databases and reports
- News articles, press releases and web-casts specific to the companies operating in the market, Magazines, reports, and others
- We gather information from commercial data sources for deriving company specific data such as segmental revenue, share for geography, product revenue, and others
- Internal and external proprietary databases (industry-specific), relevant patent, and regulatory databases
- Governing Bodies, Government Organizations
- Relevant Authorities, Country-specific Associations for Industries
We also employ the model mapping approach to estimate the product level market data through the players' product portfolio
Primary Research
Primary research/ interviews is vital in analyzing the market. Most of the cases involves paid primary interviews. Primary sources include primary interviews through e-mail interactions, telephonic interviews, surveys as well as face-to-face interviews with the different stakeholders across the value chain including several industry experts.
| Type of Respondents | Number of Primaries |
|---|---|
| Tier 2/3 Suppliers | ~20 |
| Tier 1 Suppliers | ~25 |
| End-users | ~25 |
| Industry Expert/ Panel/ Consultant | ~30 |
| Total | ~100 |
MG Knowledgebase
• Repository of industry blog, newsletter and case studies
• Online platform covering detailed market reports, and company profiles
Forecasting Factors and Models
Forecasting Factors
- Historical Trends – Past market patterns, cycles, and major events that shaped how markets behave over time. Understanding past trends helps predict future behavior.
- Industry Factors – Specific characteristics of the industry like structure, regulations, and innovation cycles that affect market dynamics.
- Macroeconomic Factors – Economic conditions like GDP growth, inflation, and employment rates that affect how much money people have to spend.
- Demographic Factors – Population characteristics like age, income, and location that determine who can buy your product.
- Technology Factors – How quickly people adopt new technology and how much technology infrastructure exists.
- Regulatory Factors – Government rules, laws, and policies that can help or restrict market growth.
- Competitive Factors – Analyzing competition structure such as degree of competition and bargaining power of buyers and suppliers.
Forecasting Models / Techniques
Multiple Regression Analysis
- Identify and quantify factors that drive market changes
- Statistical modeling to establish relationships between market drivers and outcomes
Time Series Analysis – Seasonal Patterns
- Understand regular cyclical patterns in market demand
- Advanced statistical techniques to separate trend, seasonal, and irregular components
Time Series Analysis – Trend Analysis
- Identify underlying market growth patterns and momentum
- Statistical analysis of historical data to project future trends
Expert Opinion – Expert Interviews
- Gather deep industry insights and contextual understanding
- In-depth interviews with key industry stakeholders
Multi-Scenario Development
- Prepare for uncertainty by modeling different possible futures
- Creating optimistic, pessimistic, and most likely scenarios
Time Series Analysis – Moving Averages
- Sophisticated forecasting for complex time series data
- Auto-regressive integrated moving average models with seasonal components
Econometric Models
- Apply economic theory to market forecasting
- Sophisticated economic models that account for market interactions
Expert Opinion – Delphi Method
- Harness collective wisdom of industry experts
- Structured, multi-round expert consultation process
Monte Carlo Simulation
- Quantify uncertainty and probability distributions
- Thousands of simulations with varying input parameters
Research Analysis
Our research framework is built upon the fundamental principle of validating market intelligence from both demand and supply perspectives. This dual-sided approach ensures comprehensive market understanding and reduces the risk of single-source bias.
Demand-Side Analysis: We understand end-user/application behavior, preferences, and market needs along with the penetration of the product for specific application.
Supply-Side Analysis: We estimate overall market revenue, analyze the segmental share along with industry capacity, competitive landscape, and market structure.
Validation & Evaluation
Data triangulation is a validation technique that uses multiple methods, sources, or perspectives to examine the same research question, thereby increasing the credibility and reliability of research findings. In market research, triangulation serves as a quality assurance mechanism that helps identify and minimize bias, validate assumptions, and ensure accuracy in market estimates.
- Data Source Triangulation – Using multiple data sources to examine the same phenomenon
- Methodological Triangulation – Using multiple research methods to study the same research question
- Investigator Triangulation – Using multiple researchers or analysts to examine the same data
- Theoretical Triangulation – Using multiple theoretical perspectives to interpret the same data

Custom Market Research Services
We will customise the research for you, in case the report listed above does not meet your requirements.
Get 10% Free Customisation