Teleradiology Services Market Size, Share & Trends Analysis Report by Modality Type (X-Ray Teleradiology, CT Scan Teleradiology, MRI Teleradiology, Ultrasound Teleradiology, Nuclear Medicine Teleradiology, Mammography Teleradiology, PET Scan Teleradiology, Fluoroscopy Teleradiology, Others), Service Type, Deployment Model, Component, Image Storage Capacity, Integration Level, End-users, and Geography (North America, Europe, Asia Pacific, Middle East, Africa, and South America) – Global Industry Data, Trends, and Forecasts, 2026–2035
|
|
|
Segmental Data Insights |
|
|
Demand Trends |
|
|
Competitive Landscape |
|
|
Strategic Development |
|
|
Future Outlook & Opportunities |
|
Teleradiology Services Market Size, Share, and Growth
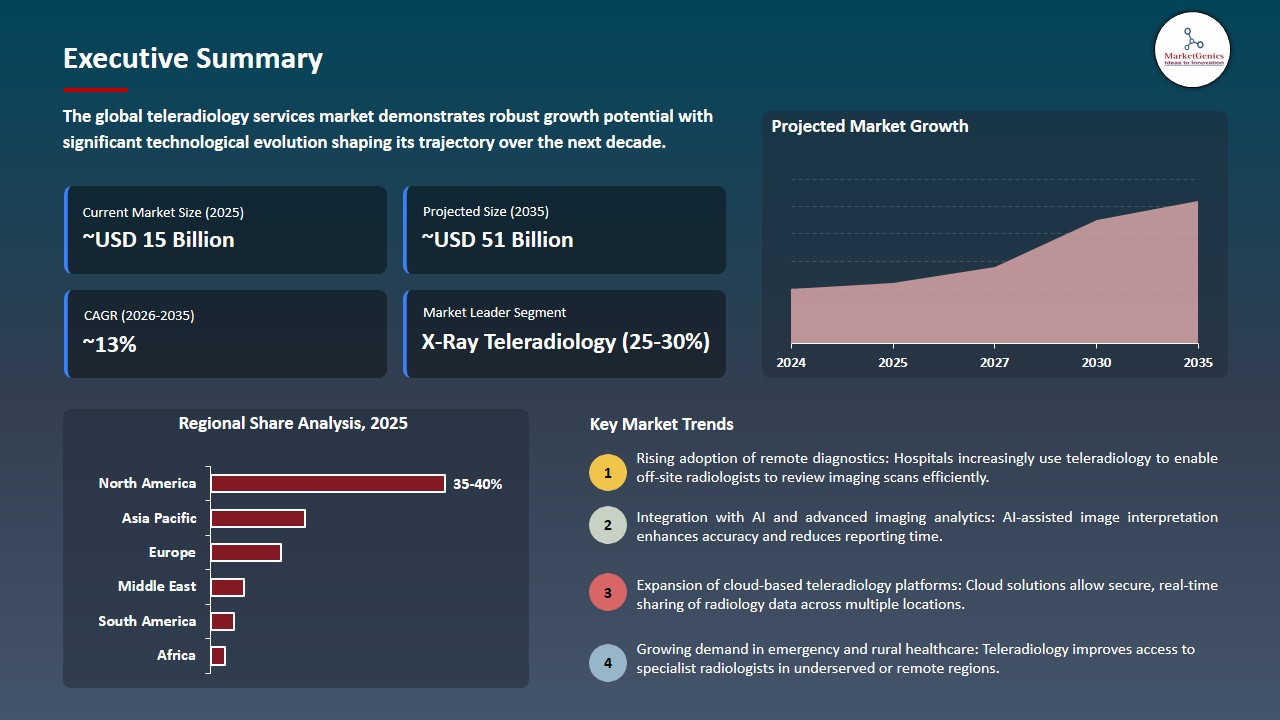
The global teleradiology services market is witnessing strong growth, valued at USD 14.6 billion in 2025 and projected to reach USD 50.9 billion by 2035, expanding at a CAGR of 13.3% during the forecast period. Asia Pacific is the fastest-growing region in the teleradiology services market due to rapid healthcare digitization, rising diagnostic imaging demand, shortages of radiologists in rural areas, improving internet connectivity, and increasing adoption of telemedicine and cloud-based healthcare solutions.
Leandra Hutchinson, President, Direct Radiology, said, “We are proud of what we have built at Direct Radiology and excited about our new partnership with ONRAD, Together we look forward to leading the future of teleradiology: driving industry-leading AI and innovation, and increasing access to radiology services, all with the mission of enhancing patient outcomes”.
The global shortage of trained radiologists, especially in rural and underserved regions, is a key driver of the teleradiology services market. Hospitals increasingly rely on remote interpretation to manage rising imaging volumes, ensure 24/7 and emergency coverage, reduce clinician burnout, and maintain fast turnaround times without the cost of full-time onsite staffing.
The integration of AI and machine learning presents a significant opportunity for the teleradiology services market by enabling automated image triage, anomaly detection, and workflow prioritization. AI-driven tools improve reporting accuracy, reduce turnaround times, and enhance radiologist productivity, allowing providers to manage high imaging volumes efficiently while delivering faster, higher-quality diagnostic services.
Adjacent opportunities in the teleradiology services market include expansion into subspecialty interpretations such as oncology, neurology, and musculoskeletal imaging, integration of AI-enabled decision support and workflow automation, and growth in cross-border and rural imaging services. Additional opportunities arise from cloud-based PACS adoption, mobile reporting solutions, partnerships with diagnostic centers, and value-added services such as second opinions, quality audits, and radiologist training support.
Teleradiology Services Market Dynamics and Trends
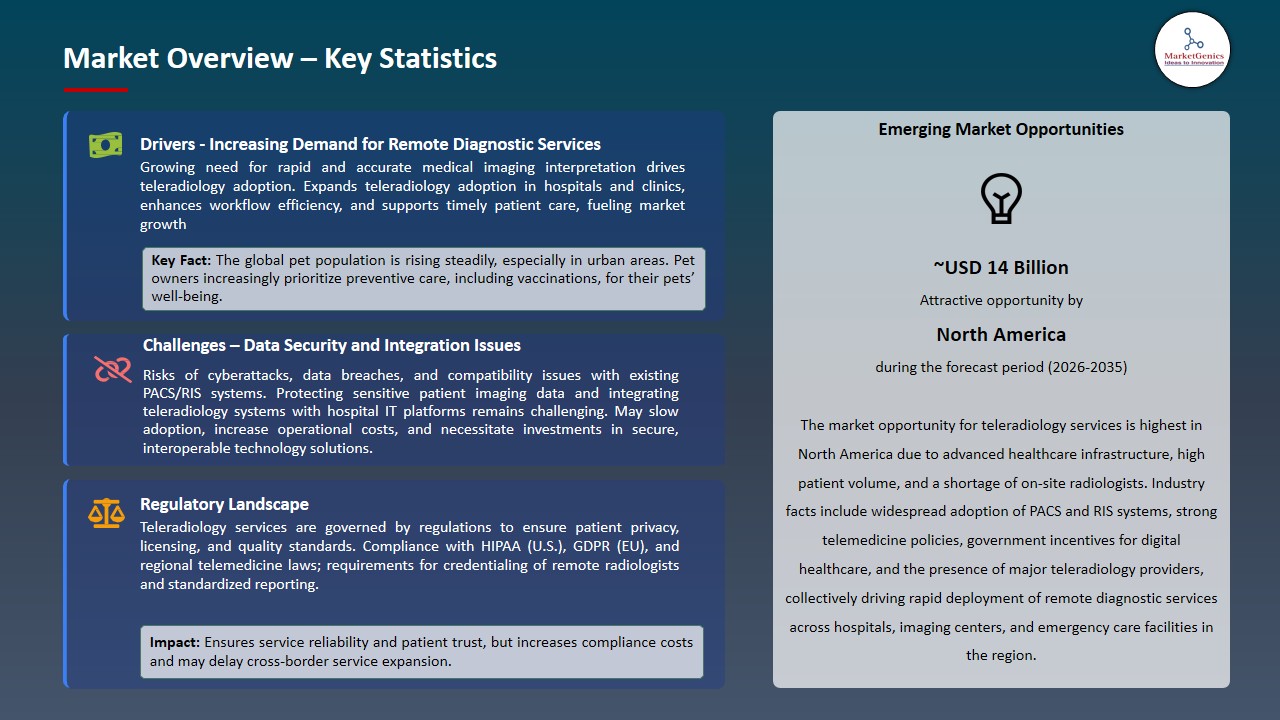
Driver: Increasing Demand for Diagnostic Imaging & Remote Services
-
The rising prevalence of chronic diseases such as cancer, cardiovascular conditions, and neurological disorders is significantly increasing the volume of diagnostic imaging procedures worldwide, driving demand for teleradiology services.
- Advanced imaging plays a critical role in early diagnosis, disease monitoring, and treatment planning, creating sustained pressure on radiology departments. Teleradiology enables healthcare providers to manage growing workloads by offering rapid report turnaround, access to subspecialty expertise, and continuous coverage across time zones.
- Additionally, the expansion of telehealth and digital healthcare infrastructure supports seamless remote image interpretation, helping hospitals improve efficiency, reduce diagnostic delays, and enhance patient outcomes, thereby accelerating adoption of teleradiology services globally.
- In 2025, VSee Health deployed its AI-powered teleradiology platform across 18 hospitals within six months, with full rollout to 35 hospitals by year-end, processing over 100,000 radiology reads.
- These developments underscore how rising imaging demand and technological advancements are accelerating the global adoption of teleradiology services.
Restraint: Data Privacy, Security & Regulatory Compliance
-
A major restraint for the teleradiology services market is the challenge of ensuring data privacy and security when transmitting sensitive medical images and patient information across networks. Remote reporting inherently involves sharing large volumes of imaging data between hospitals, imaging centers, and teleradiology providers, which increases exposure to cybersecurity threats such as data breaches, ransomware attacks, and unauthorized access.
- Protecting this data requires substantial investments in encryption, secure cloud storage, and robust IT infrastructure, which can increase operational costs for service providers.
- Additionally, teleradiology providers must comply with stringent regulatory frameworks, including HIPAA in the U.S., GDPR in Europe, and other regional healthcare data regulations. Meeting these compliance requirements adds administrative complexity, particularly for providers operating across multiple countries or regions, as they must navigate varying standards for patient consent, data storage, and cross-border transmission.
- Failure to adhere to these regulations can result in legal penalties, reputational damage, and loss of client trust, limiting market growth despite rising demand.
Opportunity: Cloud-Based & 5G-Enabled Platforms
-
The adoption of cloud-based architectures and 5G-enabled networks presents a significant opportunity in the teleradiology services market. Cloud platforms enable secure, centralized storage and real-time access to imaging data, allowing radiologists to interpret studies from any location while ensuring seamless integration with hospital information systems and PACS.
- The deployment of 5G networks enhances high-speed, low-latency transmission of large imaging files, supporting rapid turnaround and real-time collaboration among specialists. This combination of cloud and next-generation connectivity allows teleradiology providers to scale services efficiently, expand coverage to remote and underserved regions, and implement AI-assisted workflows
- In May 2025, Konica Minolta Healthcare Americas, in partnership with NewVue, launched Exa Teleradiology, a cloud-native, AI-powered workflow solution designed for distributed reading environments. The platform features an intelligent worklist, Radiologist Cockpit, zero-footprint viewer, and advanced visualization tools, enabling faster image interpretation, seamless remote collaboration, and improved operational efficiency.
- This solution addresses radiologist burnout, staffing shortages, and high imaging volumes, highlighting opportunities for scalable, technology-driven growth in the teleradiology services market.
Key Trend: Digital Pathology and Workflow Digitization
-
A key trend in the teleradiology services market is the adoption of digital pathology and workflow digitization, driven by the need for faster, more efficient diagnostic processes. Healthcare providers are increasingly implementing cloud-based PACS, integrated imaging platforms, and AI-enabled workflow tools to streamline case management, reduce turnaround times, and improve diagnostic accuracy.
- Digital workflows allow radiologists to access, interpret, and report images remotely, facilitating 24/7 coverage and subspecialty consultations across locations. Additionally, integration with other imaging modalities, including digital pathology, enhances multi-disciplinary collaboration and operational efficiency.
- In December 2025, INFINITT North America integrated the FDA-cleared Hamamatsu NanoZoomer S360MD Slide Scanner into its Digital Pathology Solution, enabling hospitals and labs to adopt fully digital workflows while leveraging existing slide archives and hardware.
- This trend supports scalable service delivery, reduces administrative bottlenecks, and positions teleradiology providers to meet the growing demand for timely and high-quality imaging services globally.
Teleradiology-Services-Market Analysis and Segmental Data
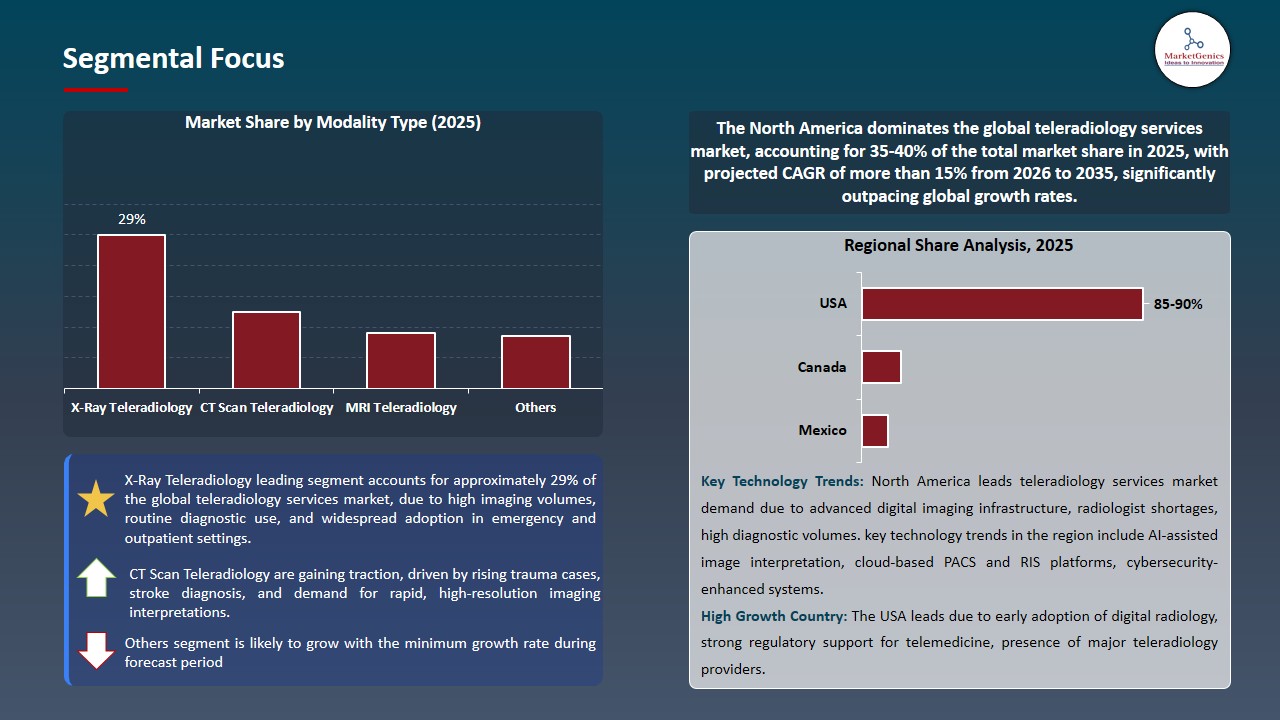
X-Ray Teleradiology Dominate Global Teleradiology Services Market
-
X-ray teleradiology dominates the global teleradiology services market as X-ray imaging remains the most widely used and frequently performed diagnostic modality across hospitals, emergency departments, outpatient clinics, and trauma centers. High utilization for chest, musculoskeletal, orthopedic, and trauma assessments generates consistently large study volumes, making X-ray the primary workload driver for teleradiology providers worldwide.
- The segment’s leadership is reinforced by the speed, cost-effectiveness, and digital compatibility of X-ray imaging. X-ray studies are quickly acquired, require lower bandwidth for transmission, and enable rapid turnaround times, which is critical for emergency and after-hours reporting. These advantages make X-ray teleradiology particularly valuable for rural and underserved facilities facing radiologist shortages.
- Additionally, advancements in digital radiography and AI-assisted image triage are improving diagnostic efficiency and accuracy for high-volume X-ray workflows.
- Growing demand for 24/7 emergency coverage and scalable remote reporting continues to support the dominance of the X-ray teleradiology segment in the global market.
North America Leads Global Teleradiology Services Market Demand
-
North America leads global teleradiology services market demand due to its advanced healthcare infrastructure, high diagnostic imaging volumes, and early adoption of digital health technologies. The region benefits from a well-established network of hospitals, imaging centers, and emergency care facilities that increasingly rely on teleradiology to ensure rapid, round-the-clock radiology coverage, particularly for emergency and after-hours reporting.
- Teleradiology helps bridge this gap by enabling remote interpretation, improving turnaround times, and reducing physician workload. Strong reimbursement frameworks, favorable telehealth policies, and widespread use of PACS and cloud-based imaging systems further support market expansion.
- Additionally, high healthcare spending, strong focus on quality and compliance, and early integration of AI-assisted imaging tools enhance service efficiency and diagnostic accuracy.
- The presence of leading teleradiology providers, coupled with strict regulatory standards that reinforce trust and clinical reliability, continues to position North America as the dominant revenue-generating region in the global teleradiology services market.
Teleradiology-Services-Market Ecosystem
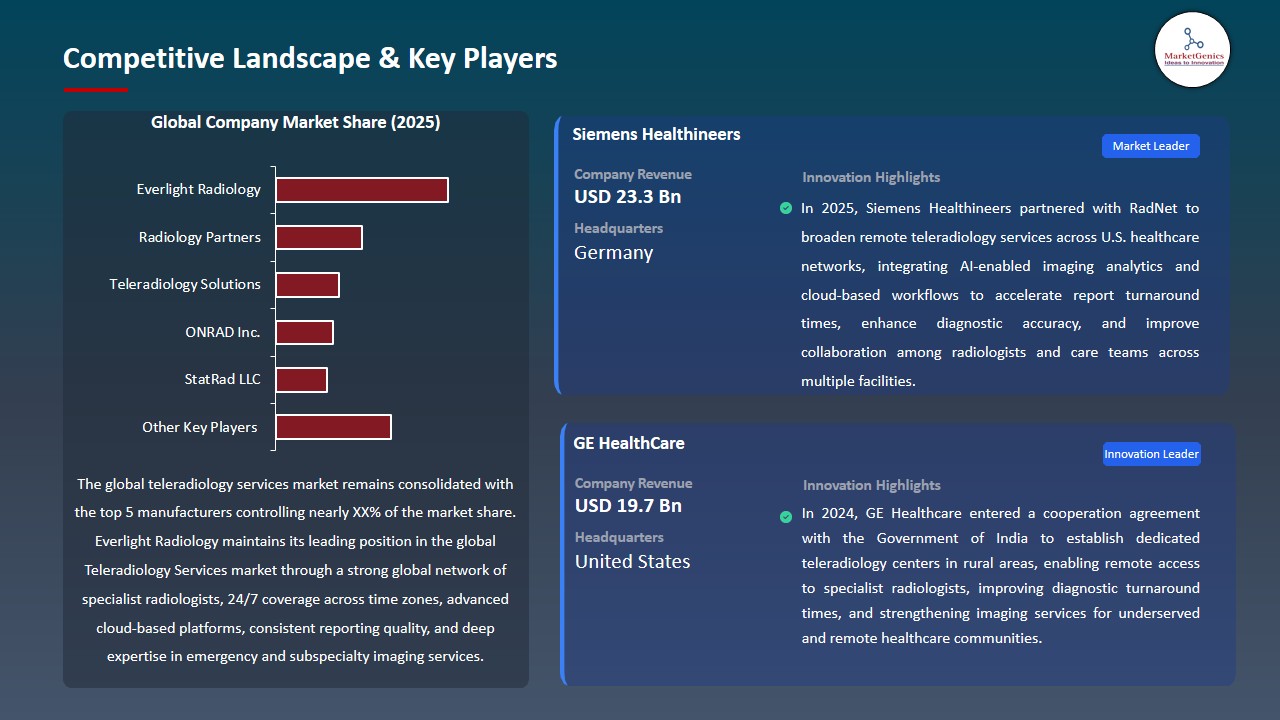
The global teleradiology services market is fragmented, with leading players including Everlight Radiology, Radiology Partners, Teleradiology Solutions, ONRAD Inc., and StatRad LLC. These companies hold strong competitive positions through extensive networks of board-certified radiologists, broad subspecialty coverage (neurology, musculoskeletal, oncology, emergency radiology), advanced cloud-based PACS/RIS platforms, and the ability to deliver rapid, 24/7 diagnostic reporting. Their strengths are further reinforced by established relationships with hospitals and imaging centers, global service delivery models, clinical quality assurance frameworks, and compliance with stringent data security and regulatory standards.
The teleradiology services market value chain comprises image acquisition at hospitals and diagnostic centers, secure image transmission via PACS and cloud infrastructure, workflow management and case allocation, remote image interpretation by certified radiologists, quality review and peer validation, report delivery to referring physicians, and integration with hospital information systems. Post-service activities such as clinical consultations, turnaround time optimization, continuous quality monitoring, and customer support play a critical role in sustaining long-term contracts and service differentiation.
High entry barriers persist due to complex regulatory and licensing requirements across regions, the need for accredited and experienced radiologists, significant investments in secure IT infrastructure, and established trust relationships between providers and healthcare institutions. Ongoing innovations including AI-assisted image triage, subspecialty reporting expansion, cloud-native platforms, and cross-border service optimization are driving efficiency, accuracy, and scalability, thereby supporting sustained adoption and competitive differentiation in the global teleradiology services market.
Recent Development and Strategic Overview:
-
In January 2025, ONRAD Inc. acquired Direct Radiology from Royal Philips, creating the largest independent teleradiology provider in the U.S. The combined entity now serves 550+ healthcare facilities nationwide, supported by 160+ board-certified radiologists delivering over 7,000 studies daily.
- In October 2025, Everlight Radiology was appointed to the National Teleradiology Panel by Te Whatu Ora – Health New Zealand, enabling the delivery of 24/7 teleradiology reporting services to public hospitals nationwide. This partnership supports backlog reduction, after-hours and emergency imaging coverage, and alleviates radiologist workload through Everlight’s “follow-the-sun” reporting model.
Report Scope
|
Detail |
|
|
Market Size in 2025 |
USD 14.6 Bn |
|
Market Forecast Value in 2035 |
USD 50.9 Bn |
|
Growth Rate (CAGR) |
13.3% |
|
Forecast Period |
2026 – 2035 |
|
Historical Data Available for |
2021 – 2024 |
|
Market Size Units |
US$ Billion for Value |
|
Report Format |
Electronic (PDF) + Excel |
|
North America |
Europe |
Asia Pacific |
Middle East |
Africa |
South America |
|
|
|
|
|
|
|
Companies Covered |
|||||
|
|
|
|
|
|
Teleradiology-Services-Market Segmentation and Highlights
|
Segment |
Sub-segment |
|
Teleradiology Services Market, By Modality Type |
|
|
Teleradiology Services Market, By Service Type |
|
|
Teleradiology Services Market, By Deployment Model |
|
|
Teleradiology Services Market, By Component |
|
|
Teleradiology Services Market, By Image Storage Capacity |
|
|
Teleradiology Services Market, By Integration Level |
|
|
Teleradiology Services Market, By End-users |
|
Frequently Asked Questions
Table of Contents
- 1. Research Methodology and Assumptions
- 1.1. Definitions
- 1.2. Research Design and Approach
- 1.3. Data Collection Methods
- 1.4. Base Estimates and Calculations
- 1.5. Forecasting Models
- 1.5.1. Key Forecast Factors & Impact Analysis
- 1.6. Secondary Research
- 1.6.1. Open Sources
- 1.6.2. Paid Databases
- 1.6.3. Associations
- 1.7. Primary Research
- 1.7.1. Primary Sources
- 1.7.2. Primary Interviews with Stakeholders across Ecosystem
- 2. Executive Summary
- 2.1. Global Teleradiology Services Market Outlook
- 2.1.1. Teleradiology Services Market Size Value (US$ Bn), and Forecasts, 2021-2035
- 2.1.2. Compounded Annual Growth Rate Analysis
- 2.1.3. Growth Opportunity Analysis
- 2.1.4. Segmental Share Analysis
- 2.1.5. Geographical Share Analysis
- 2.2. Market Analysis and Facts
- 2.3. Supply-Demand Analysis
- 2.4. Competitive Benchmarking
- 2.5. Go-to- Market Strategy
- 2.5.1. Customer/ End-use Industry Assessment
- 2.5.2. Growth Opportunity Data, 2026-2035
- 2.5.2.1. Regional Data
- 2.5.2.2. Country Data
- 2.5.2.3. Segmental Data
- 2.5.3. Identification of Potential Market Spaces
- 2.5.4. GAP Analysis
- 2.5.5. Potential Attractive Price Points
- 2.5.6. Prevailing Market Risks & Challenges
- 2.5.7. Preferred Sales & Marketing Strategies
- 2.5.8. Key Recommendations and Analysis
- 2.5.9. A Way Forward
- 2.1. Global Teleradiology Services Market Outlook
- 3. Industry Data and Premium Insights
- 3.1. Global Healthcare & Pharmaceutical Industry Overview, 2025
- 3.1.1. Healthcare & Pharmaceutical Industry Ecosystem Analysis
- 3.1.2. Key Trends for Healthcare & Pharmaceutical Industry
- 3.1.3. Regional Distribution for Healthcare & Pharmaceutical Industry
- 3.2. Supplier Customer Data
- 3.3. Technology Roadmap and Developments
- 3.4. Trade Analysis
- 3.4.1. Import & Export Analysis, 2025
- 3.4.2. Top Importing Countries
- 3.4.3. Top Exporting Countries
- 3.5. Trump Tariff Impact Analysis
- 3.5.1. Manufacturer
- 3.5.1.1. Based on the component & Raw material
- 3.5.2. Supply Chain
- 3.5.3. End Consumer
- 3.5.1. Manufacturer
- 3.6. Raw Material Analysis
- 3.1. Global Healthcare & Pharmaceutical Industry Overview, 2025
- 4. Market Overview
- 4.1. Market Dynamics
- 4.1.1. Drivers
- 4.1.1.1. Growing shortage of on-site radiologists across hospitals and diagnostic centers
- 4.1.1.2. Rising demand for 24/7 remote diagnostic and emergency imaging services
- 4.1.1.3. Increasing adoption of cloud-based PACS, AI-assisted imaging, and telehealth technologies
- 4.1.2. Restraints
- 4.1.2.1. Data security, privacy, and cybersecurity concerns related to patient imaging data
- 4.1.2.2. Regulatory and licensing complexities for cross-border and inter-state teleradiology services
- 4.1.1. Drivers
- 4.2. Key Trend Analysis
- 4.3. Regulatory Framework
- 4.3.1. Key Regulations, Norms, and Subsidies, by Key Countries
- 4.3.2. Tariffs and Standards
- 4.3.3. Impact Analysis of Regulations on the Market
- 4.4. Ecosystem Analysis
- 4.5. Porter’s Five Forces Analysis
- 4.6. PESTEL Analysis
- 4.7. Global Teleradiology Services Market Demand
- 4.7.1. Historical Market Size – Value (US$ Bn), 2020-2024
- 4.7.2. Current and Future Market Size – Value (US$ Bn), 2026–2035
- 4.7.2.1. Y-o-Y Growth Trends
- 4.7.2.2. Absolute $ Opportunity Assessment
- 4.1. Market Dynamics
- 5. Competition Landscape
- 5.1. Competition structure
- 5.1.1. Fragmented v/s consolidated
- 5.2. Company Share Analysis, 2025
- 5.2.1. Global Company Market Share
- 5.2.2. By Region
- 5.2.2.1. North America
- 5.2.2.2. Europe
- 5.2.2.3. Asia Pacific
- 5.2.2.4. Middle East
- 5.2.2.5. Africa
- 5.2.2.6. South America
- 5.3. Product Comparison Matrix
- 5.3.1. Specifications
- 5.3.2. Market Positioning
- 5.3.3. Pricing
- 5.1. Competition structure
- 6. Global Teleradiology Services Market Analysis, by Modality Type
- 6.1. Key Segment Analysis
- 6.2. Teleradiology Services Market Size Value (US$ Bn), Analysis, and Forecasts, by Modality Type, 2021-2035
- 6.2.1. X-Ray Teleradiology
- 6.2.2. CT Scan Teleradiology
- 6.2.3. MRI Teleradiology
- 6.2.4. Ultrasound Teleradiology
- 6.2.5. Nuclear Medicine Teleradiology
- 6.2.6. Mammography Teleradiology
- 6.2.7. PET Scan Teleradiology
- 6.2.8. Fluoroscopy Teleradiology
- 6.2.9. Others
- 7. Global Teleradiology Services Market Analysis, by Service Type
- 7.1. Key Segment Analysis
- 7.2. Teleradiology Services Market Size Value (US$ Bn), Analysis, and Forecasts, by Service Type, 2021-2035
- 7.2.1. After-Hours Coverage (Night Hawk Services)
- 7.2.2. Preliminary Reads (Wet Reads)
- 7.2.3. Final Reads
- 7.2.4. Subspecialty Consultation Services
- 7.2.5. Second Opinion Services
- 7.2.6. Emergency/STAT Reads
- 7.2.7. Routine Reporting Services
- 8. Global Teleradiology Services Market Analysis, by Deployment Model
- 8.1. Key Segment Analysis
- 8.2. Teleradiology Services Market Size Value (US$ Bn), Analysis, and Forecasts, by Deployment Model, 2021-2035
- 8.2.1. Software-as-a-Service (SaaS)
- 8.2.2. Platform-as-a-Service (PaaS)
- 8.2.3. Infrastructure-as-a-Service (IaaS)
- 8.2.4. Managed Services
- 9. Global Teleradiology Services Market Analysis, by Component
- 9.1. Key Segment Analysis
- 9.2. Teleradiology Services Market Size Value (US$ Bn), Analysis, and Forecasts, by Component, 2021-2035
- 9.2.1. Software
- 9.2.1.1. PACS (Picture Archiving and Communication System)
- 9.2.1.2. RIS (Radiology Information System)
- 9.2.1.3. Reporting Software
- 9.2.1.4. Integration Software
- 9.2.1.5. Others
- 9.2.2. Hardware
- 9.2.2.1. Servers
- 9.2.2.2. Workstations
- 9.2.2.3. Storage Devices
- 9.2.2.4. Network Infrastructure
- 9.2.2.5. Others
- 9.2.3. Services
- 9.2.3.1. Consulting Services
- 9.2.3.2. Implementation Services
- 9.2.3.3. Training Services
- 9.2.3.4. Maintenance & Support Services
- 9.2.1. Software
- 10. Global Teleradiology Services Market Analysis, by Image Storage Capacity
- 10.1. Key Segment Analysis
- 10.2. Teleradiology Services Market Size Value (US$ Bn), Analysis, and Forecasts, by Image Storage Capacity, 2021-2035
- 10.2.1. Less than 500 GB
- 10.2.2. 500 GB to 2 TB
- 10.2.3. 2 TB to 10 TB
- 10.2.4. Above 10 TB
- 11. Global Teleradiology Services Market Analysis, by Integration Level
- 11.1. Key Segment Analysis
- 11.2. Teleradiology Services Market Size Value (US$ Bn), Analysis, and Forecasts, by Integration Level, 2021-2035
- 11.2.1. Fully Integrated with PACS
- 11.2.2. Integrated with RIS
- 11.2.3. Integrated with EHR/EMR Systems
- 11.2.4. Integrated with Hospital Information Systems (HIS)
- 11.2.5. Standalone Systems
- 12. Global Teleradiology Services Market Analysis, by End-users
- 12.1. Key Segment Analysis
- 12.2. Teleradiology Services Market Size Value (US$ Bn), Analysis, and Forecasts, by End-users, 2021-2035
- 12.2.1. Hospitals
- 12.2.1.1. Emergency Diagnosis
- 12.2.1.2. Trauma Care
- 12.2.1.3. Surgical Planning
- 12.2.1.4. Post-Operative Monitoring
- 12.2.1.5. Others
- 12.2.2. Diagnostic Imaging Centers
- 12.2.2.1. Routine Screening
- 12.2.2.2. Preventive Care
- 12.2.2.3. Diagnostic Imaging
- 12.2.2.4. Others
- 12.2.3. Ambulatory Surgical Centers
- 12.2.4. Clinics
- 12.2.5. Nursing Homes & Long-Term Care Facilities
- 12.2.6. Military & Defense Healthcare
- 12.2.7. Insurance Companies
- 12.2.8. Telehealth Providers
- 12.2.9. Mobile Health Units
- 12.2.10. Other End-users
- 12.2.1. Hospitals
- 13. Global Teleradiology Services Market Analysis and Forecasts, by Region
- 13.1. Key Findings
- 13.2. Teleradiology Services Market Size Value (US$ Bn), Analysis, and Forecasts, by Region, 2021-2035
- 13.2.1. North America
- 13.2.2. Europe
- 13.2.3. Asia Pacific
- 13.2.4. Middle East
- 13.2.5. Africa
- 13.2.6. South America
- 14. North America Teleradiology Services Market Analysis
- 14.1. Key Segment Analysis
- 14.2. Regional Snapshot
- 14.3. North America Teleradiology Services Market Size Value (US$ Bn), Analysis, and Forecasts, 2021-2035
- 14.3.1. Animal Type
- 14.3.2. Vaccine Type
- 14.3.3. Disease Indication
- 14.3.4. Route of Administration
- 14.3.5. Product Form
- 14.3.6. Valency
- 14.3.7. Age Group
- 14.3.8. Distribution Channel
- 14.3.9. Prescription Type
- 14.3.10. Country
- 14.3.10.1. USA
- 14.3.10.2. Canada
- 14.3.10.3. Mexico
- 14.4. USA Teleradiology Services Market
- 14.4.1. Country Segmental Analysis
- 14.4.2. Modality Type
- 14.4.3. Service Type
- 14.4.4. Deployment Model
- 14.4.5. Component
- 14.4.6. Image Storage Capacity
- 14.4.7. Integration Level
- 14.4.8. End-users
- 14.5. Canada Teleradiology Services Market
- 14.5.1. Country Segmental Analysis
- 14.5.2. Modality Type
- 14.5.3. Service Type
- 14.5.4. Deployment Model
- 14.5.5. Component
- 14.5.6. Image Storage Capacity
- 14.5.7. Integration Level
- 14.5.8. End-users
- 14.6. Mexico Teleradiology Services Market
- 14.6.1. Country Segmental Analysis
- 14.6.2. Modality Type
- 14.6.3. Service Type
- 14.6.4. Deployment Model
- 14.6.5. Component
- 14.6.6. Image Storage Capacity
- 14.6.7. Integration Level
- 14.6.8. End-users
- 15. Europe Teleradiology Services Market Analysis
- 15.1. Key Segment Analysis
- 15.2. Regional Snapshot
- 15.3. Europe Teleradiology Services Market Size Value (US$ Bn), Analysis, and Forecasts, 2021-2035
- 15.3.1. Modality Type
- 15.3.2. Service Type
- 15.3.3. Deployment Model
- 15.3.4. Component
- 15.3.5. Image Storage Capacity
- 15.3.6. Integration Level
- 15.3.7. End-users
- 15.3.8. Country
- 15.3.8.1. Germany
- 15.3.8.2. United Kingdom
- 15.3.8.3. France
- 15.3.8.4. Italy
- 15.3.8.5. Spain
- 15.3.8.6. Netherlands
- 15.3.8.7. Nordic Countries
- 15.3.8.8. Poland
- 15.3.8.9. Russia & CIS
- 15.3.8.10. Rest of Europe
- 15.4. Germany Teleradiology Services Market
- 15.4.1. Country Segmental Analysis
- 15.4.2. Modality Type
- 15.4.3. Service Type
- 15.4.4. Deployment Model
- 15.4.5. Component
- 15.4.6. Image Storage Capacity
- 15.4.7. Integration Level
- 15.4.8. End-users
- 15.5. United Kingdom Teleradiology Services Market
- 15.5.1. Country Segmental Analysis
- 15.5.2. Modality Type
- 15.5.3. Service Type
- 15.5.4. Deployment Model
- 15.5.5. Component
- 15.5.6. Image Storage Capacity
- 15.5.7. Integration Level
- 15.5.8. End-users
- 15.6. France Teleradiology Services Market
- 15.6.1. Country Segmental Analysis
- 15.6.2. Modality Type
- 15.6.3. Service Type
- 15.6.4. Deployment Model
- 15.6.5. Component
- 15.6.6. Image Storage Capacity
- 15.6.7. Integration Level
- 15.6.8. End-users
- 15.7. Italy Teleradiology Services Market
- 15.7.1. Country Segmental Analysis
- 15.7.2. Modality Type
- 15.7.3. Service Type
- 15.7.4. Deployment Model
- 15.7.5. Component
- 15.7.6. Image Storage Capacity
- 15.7.7. Integration Level
- 15.7.8. End-users
- 15.8. Spain Teleradiology Services Market
- 15.8.1. Country Segmental Analysis
- 15.8.2. Modality Type
- 15.8.3. Service Type
- 15.8.4. Deployment Model
- 15.8.5. Component
- 15.8.6. Image Storage Capacity
- 15.8.7. Integration Level
- 15.8.8. End-users
- 15.9. Netherlands Teleradiology Services Market
- 15.9.1. Country Segmental Analysis
- 15.9.2. Modality Type
- 15.9.3. Service Type
- 15.9.4. Deployment Model
- 15.9.5. Component
- 15.9.6. Image Storage Capacity
- 15.9.7. Integration Level
- 15.9.8. End-users
- 15.10. Nordic Countries Teleradiology Services Market
- 15.10.1. Country Segmental Analysis
- 15.10.2. Modality Type
- 15.10.3. Service Type
- 15.10.4. Deployment Model
- 15.10.5. Component
- 15.10.6. Image Storage Capacity
- 15.10.7. Integration Level
- 15.10.8. End-users
- 15.11. Poland Teleradiology Services Market
- 15.11.1. Country Segmental Analysis
- 15.11.2. Modality Type
- 15.11.3. Service Type
- 15.11.4. Deployment Model
- 15.11.5. Component
- 15.11.6. Image Storage Capacity
- 15.11.7. Integration Level
- 15.11.8. End-users
- 15.12. Russia & CIS Teleradiology Services Market
- 15.12.1. Country Segmental Analysis
- 15.12.2. Modality Type
- 15.12.3. Service Type
- 15.12.4. Deployment Model
- 15.12.5. Component
- 15.12.6. Image Storage Capacity
- 15.12.7. Integration Level
- 15.12.8. End-users
- 15.13. Rest of Europe Teleradiology Services Market
- 15.13.1. Country Segmental Analysis
- 15.13.2. Modality Type
- 15.13.3. Service Type
- 15.13.4. Deployment Model
- 15.13.5. Component
- 15.13.6. Image Storage Capacity
- 15.13.7. Integration Level
- 15.13.8. End-users
- 16. Asia Pacific Teleradiology Services Market Analysis
- 16.1. Key Segment Analysis
- 16.2. Regional Snapshot
- 16.3. Asia Pacific Teleradiology Services Market Size Value (US$ Bn), Analysis, and Forecasts, 2021-2035
- 16.3.1. Modality Type
- 16.3.2. Service Type
- 16.3.3. Deployment Model
- 16.3.4. Component
- 16.3.5. Image Storage Capacity
- 16.3.6. Integration Level
- 16.3.7. End-users
- 16.3.8. Country
- 16.3.8.1. China
- 16.3.8.2. India
- 16.3.8.3. Japan
- 16.3.8.4. South Korea
- 16.3.8.5. Australia and New Zealand
- 16.3.8.6. Indonesia
- 16.3.8.7. Malaysia
- 16.3.8.8. Thailand
- 16.3.8.9. Vietnam
- 16.3.8.10. Rest of Asia Pacific
- 16.4. China Teleradiology Services Market
- 16.4.1. Country Segmental Analysis
- 16.4.2. Modality Type
- 16.4.3. Service Type
- 16.4.4. Deployment Model
- 16.4.5. Component
- 16.4.6. Image Storage Capacity
- 16.4.7. Integration Level
- 16.4.8. End-users
- 16.5. India Teleradiology Services Market
- 16.5.1. Country Segmental Analysis
- 16.5.2. Modality Type
- 16.5.3. Service Type
- 16.5.4. Deployment Model
- 16.5.5. Component
- 16.5.6. Image Storage Capacity
- 16.5.7. Integration Level
- 16.5.8. End-users
- 16.6. Japan Teleradiology Services Market
- 16.6.1. Country Segmental Analysis
- 16.6.2. Modality Type
- 16.6.3. Service Type
- 16.6.4. Deployment Model
- 16.6.5. Component
- 16.6.6. Image Storage Capacity
- 16.6.7. Integration Level
- 16.6.8. End-users
- 16.7. South Korea Teleradiology Services Market
- 16.7.1. Country Segmental Analysis
- 16.7.2. Modality Type
- 16.7.3. Service Type
- 16.7.4. Deployment Model
- 16.7.5. Component
- 16.7.6. Image Storage Capacity
- 16.7.7. Integration Level
- 16.7.8. End-users
- 16.8. Australia and New Zealand Teleradiology Services Market
- 16.8.1. Country Segmental Analysis
- 16.8.2. Modality Type
- 16.8.3. Service Type
- 16.8.4. Deployment Model
- 16.8.5. Component
- 16.8.6. Image Storage Capacity
- 16.8.7. Integration Level
- 16.8.8. End-users
- 16.9. Indonesia Teleradiology Services Market
- 16.9.1. Country Segmental Analysis
- 16.9.2. Modality Type
- 16.9.3. Service Type
- 16.9.4. Deployment Model
- 16.9.5. Component
- 16.9.6. Image Storage Capacity
- 16.9.7. Integration Level
- 16.9.8. End-users
- 16.10. Malaysia Teleradiology Services Market
- 16.10.1. Country Segmental Analysis
- 16.10.2. Modality Type
- 16.10.3. Service Type
- 16.10.4. Deployment Model
- 16.10.5. Component
- 16.10.6. Image Storage Capacity
- 16.10.7. Integration Level
- 16.10.8. End-users
- 16.11. Thailand Teleradiology Services Market
- 16.11.1. Country Segmental Analysis
- 16.11.2. Modality Type
- 16.11.3. Service Type
- 16.11.4. Deployment Model
- 16.11.5. Component
- 16.11.6. Image Storage Capacity
- 16.11.7. Integration Level
- 16.11.8. End-users
- 16.12. Vietnam Teleradiology Services Market
- 16.12.1. Country Segmental Analysis
- 16.12.2. Modality Type
- 16.12.3. Service Type
- 16.12.4. Deployment Model
- 16.12.5. Component
- 16.12.6. Image Storage Capacity
- 16.12.7. Integration Level
- 16.12.8. End-users
- 16.13. Rest of Asia Pacific Teleradiology Services Market
- 16.13.1. Country Segmental Analysis
- 16.13.2. Modality Type
- 16.13.3. Service Type
- 16.13.4. Deployment Model
- 16.13.5. Component
- 16.13.6. Image Storage Capacity
- 16.13.7. Integration Level
- 16.13.8. End-users
- 17. Middle East Teleradiology Services Market Analysis
- 17.1. Key Segment Analysis
- 17.2. Regional Snapshot
- 17.3. Middle East Teleradiology Services Market Size Value (US$ Bn), Analysis, and Forecasts, 2021-2035
- 17.3.1. Modality Type
- 17.3.2. Service Type
- 17.3.3. Deployment Model
- 17.3.4. Component
- 17.3.5. Image Storage Capacity
- 17.3.6. Integration Level
- 17.3.7. End-users
- 17.3.8. Country
- 17.3.8.1. Turkey
- 17.3.8.2. UAE
- 17.3.8.3. Saudi Arabia
- 17.3.8.4. Israel
- 17.3.8.5. Rest of Middle East
- 17.4. Turkey Teleradiology Services Market
- 17.4.1. Country Segmental Analysis
- 17.4.2. Modality Type
- 17.4.3. Service Type
- 17.4.4. Deployment Model
- 17.4.5. Component
- 17.4.6. Image Storage Capacity
- 17.4.7. Integration Level
- 17.4.8. End-users
- 17.5. UAE Teleradiology Services Market
- 17.5.1. Country Segmental Analysis
- 17.5.2. Modality Type
- 17.5.3. Service Type
- 17.5.4. Deployment Model
- 17.5.5. Component
- 17.5.6. Image Storage Capacity
- 17.5.7. Integration Level
- 17.5.8. End-users
- 17.6. Saudi Arabia Teleradiology Services Market
- 17.6.1. Country Segmental Analysis
- 17.6.2. Modality Type
- 17.6.3. Service Type
- 17.6.4. Deployment Model
- 17.6.5. Component
- 17.6.6. Image Storage Capacity
- 17.6.7. Integration Level
- 17.6.8. End-users
- 17.7. Israel Teleradiology Services Market
- 17.7.1. Country Segmental Analysis
- 17.7.2. Modality Type
- 17.7.3. Service Type
- 17.7.4. Deployment Model
- 17.7.5. Component
- 17.7.6. Image Storage Capacity
- 17.7.7. Integration Level
- 17.7.8. End-users
- 17.8. Rest of Middle East Teleradiology Services Market
- 17.8.1. Country Segmental Analysis
- 17.8.2. Modality Type
- 17.8.3. Service Type
- 17.8.4. Deployment Model
- 17.8.5. Component
- 17.8.6. Image Storage Capacity
- 17.8.7. Integration Level
- 17.8.8. End-users
- 18. Africa Teleradiology Services Market Analysis
- 18.1. Key Segment Analysis
- 18.2. Regional Snapshot
- 18.3. Africa Teleradiology Services Market Size Value (US$ Bn), Analysis, and Forecasts, 2021-2035
- 18.3.1. Modality Type
- 18.3.2. Service Type
- 18.3.3. Deployment Model
- 18.3.4. Component
- 18.3.5. Image Storage Capacity
- 18.3.6. Integration Level
- 18.3.7. End-users
- 18.3.8. Country
- 18.3.8.1. South Africa
- 18.3.8.2. Egypt
- 18.3.8.3. Nigeria
- 18.3.8.4. Algeria
- 18.3.8.5. Rest of Africa
- 18.4. South Africa Teleradiology Services Market
- 18.4.1. Country Segmental Analysis
- 18.4.2. Modality Type
- 18.4.3. Service Type
- 18.4.4. Deployment Model
- 18.4.5. Component
- 18.4.6. Image Storage Capacity
- 18.4.7. Integration Level
- 18.4.8. End-users
- 18.5. Egypt Teleradiology Services Market
- 18.5.1. Country Segmental Analysis
- 18.5.2. Modality Type
- 18.5.3. Service Type
- 18.5.4. Deployment Model
- 18.5.5. Component
- 18.5.6. Image Storage Capacity
- 18.5.7. Integration Level
- 18.5.8. End-users
- 18.6. Nigeria Teleradiology Services Market
- 18.6.1. Country Segmental Analysis
- 18.6.2. Modality Type
- 18.6.3. Service Type
- 18.6.4. Deployment Model
- 18.6.5. Component
- 18.6.6. Image Storage Capacity
- 18.6.7. Integration Level
- 18.6.8. End-users
- 18.7. Algeria Teleradiology Services Market
- 18.7.1. Country Segmental Analysis
- 18.7.2. Modality Type
- 18.7.3. Service Type
- 18.7.4. Deployment Model
- 18.7.5. Component
- 18.7.6. Image Storage Capacity
- 18.7.7. Integration Level
- 18.7.8. End-users
- 18.8. Rest of Africa Teleradiology Services Market
- 18.8.1. Country Segmental Analysis
- 18.8.2. Modality Type
- 18.8.3. Service Type
- 18.8.4. Deployment Model
- 18.8.5. Component
- 18.8.6. Image Storage Capacity
- 18.8.7. Integration Level
- 18.8.8. End-users
- 19. South America Teleradiology Services Market Analysis
- 19.1. Key Segment Analysis
- 19.2. Regional Snapshot
- 19.3. South America Teleradiology Services Market Size Value (US$ Bn), Analysis, and Forecasts, 2021-2035
- 19.3.1. Modality Type
- 19.3.2. Service Type
- 19.3.3. Deployment Model
- 19.3.4. Component
- 19.3.5. Image Storage Capacity
- 19.3.6. Integration Level
- 19.3.7. End-users
- 19.3.8. Country
- 19.3.8.1. Brazil
- 19.3.8.2. Argentina
- 19.3.8.3. Rest of South America
- 19.4. Brazil Teleradiology Services Market
- 19.4.1. Country Segmental Analysis
- 19.4.2. Modality Type
- 19.4.3. Service Type
- 19.4.4. Deployment Model
- 19.4.5. Component
- 19.4.6. Image Storage Capacity
- 19.4.7. Integration Level
- 19.4.8. End-users
- 19.5. Argentina Teleradiology Services Market
- 19.5.1. Country Segmental Analysis
- 19.5.2. Modality Type
- 19.5.3. Service Type
- 19.5.4. Deployment Model
- 19.5.5. Component
- 19.5.6. Image Storage Capacity
- 19.5.7. Integration Level
- 19.5.8. End-users
- 19.6. Rest of South America Teleradiology Services Market
- 19.6.1. Country Segmental Analysis
- 19.6.2. Modality Type
- 19.6.3. Service Type
- 19.6.4. Deployment Model
- 19.6.5. Component
- 19.6.6. Image Storage Capacity
- 19.6.7. Integration Level
- 19.6.8. End-users
- 20. Key Players/ Company Profile
- 20.1. 4ways Healthcare
- 20.1.1. Company Details/ Overview
- 20.1.2. Company Financials
- 20.1.3. Key Customers and Competitors
- 20.1.4. Business/ Industry Portfolio
- 20.1.5. Product Portfolio/ Specification Details
- 20.1.6. Pricing Data
- 20.1.7. Strategic Overview
- 20.1.8. Recent Developments
- 20.2. Agfa-Gevaert Group
- 20.3. Argus Radiology
- 20.4. Canon Medical Systems Corporation
- 20.5. Carestream Health
- 20.6. Everlight Radiology
- 20.7. Fujifilm Holdings Corporation
- 20.8. GE Healthcare
- 20.9. Global Diagnostics
- 20.10. Koninklijke Philips N.V.
- 20.11. Medica Group
- 20.12. MEDNAX Services (vRad)
- 20.13. ONRAD Inc.
- 20.14. Radiology Partners
- 20.15. RamSoft Inc.
- 20.16. Sectra AB
- 20.17. Siemens Healthineers AG
- 20.18. StatRad LLC
- 20.19. TeleDiagnosys
- 20.20. Teleradiology Solutions
- 20.21. Other Key Players
- 20.1. 4ways Healthcare
Note* - This is just tentative list of players. While providing the report, we will cover more number of players based on their revenue and share for each geography
Research Design
Our research design integrates both demand-side and supply-side analysis through a balanced combination of primary and secondary research methodologies. By utilizing both bottom-up and top-down approaches alongside rigorous data triangulation methods, we deliver robust market intelligence that supports strategic decision-making.
MarketGenics' comprehensive research design framework ensures the delivery of accurate, reliable, and actionable market intelligence. Through the integration of multiple research approaches, rigorous validation processes, and expert analysis, we provide our clients with the insights needed to make informed strategic decisions and capitalize on market opportunities.

MarketGenics leverages a dedicated industry panel of experts and a comprehensive suite of paid databases to effectively collect, consolidate, and analyze market intelligence.
Our approach has consistently proven to be reliable and effective in generating accurate market insights, identifying key industry trends, and uncovering emerging business opportunities.
Through both primary and secondary research, we capture and analyze critical company-level data such as manufacturing footprints, including technical centers, R&D facilities, sales offices, and headquarters.
Our expert panel further enhances our ability to estimate market size for specific brands based on validated field-level intelligence.
Our data mining techniques incorporate both parametric and non-parametric methods, allowing for structured data collection, sorting, processing, and cleaning.
Demand projections are derived from large-scale data sets analyzed through proprietary algorithms, culminating in robust and reliable market sizing.
Research Approach
The bottom-up approach builds market estimates by starting with the smallest addressable market units and systematically aggregating them to create comprehensive market size projections.
This method begins with specific, granular data points and builds upward to create the complete market landscape.
Customer Analysis → Segmental Analysis → Geographical Analysis
The top-down approach starts with the broadest possible market data and systematically narrows it down through a series of filters and assumptions to arrive at specific market segments or opportunities.
This method begins with the big picture and works downward to increasingly specific market slices.
TAM → SAM → SOM


Research Methods
Desk / Secondary Research
While analysing the market, we extensively study secondary sources, directories, and databases to identify and collect information useful for this technical, market-oriented, and commercial report. Secondary sources that we utilize are not only the public sources, but it is a combination of Open Source, Associations, Paid Databases, MG Repository & Knowledgebase, and others.
- Company websites, annual reports, financial reports, broker reports, and investor presentations
- National government documents, statistical databases and reports
- News articles, press releases and web-casts specific to the companies operating in the market, Magazines, reports, and others
- We gather information from commercial data sources for deriving company specific data such as segmental revenue, share for geography, product revenue, and others
- Internal and external proprietary databases (industry-specific), relevant patent, and regulatory databases
- Governing Bodies, Government Organizations
- Relevant Authorities, Country-specific Associations for Industries
We also employ the model mapping approach to estimate the product level market data through the players' product portfolio
Primary Research
Primary research/ interviews is vital in analyzing the market. Most of the cases involves paid primary interviews. Primary sources include primary interviews through e-mail interactions, telephonic interviews, surveys as well as face-to-face interviews with the different stakeholders across the value chain including several industry experts.
| Type of Respondents | Number of Primaries |
|---|---|
| Tier 2/3 Suppliers | ~20 |
| Tier 1 Suppliers | ~25 |
| End-users | ~25 |
| Industry Expert/ Panel/ Consultant | ~30 |
| Total | ~100 |
MG Knowledgebase
• Repository of industry blog, newsletter and case studies
• Online platform covering detailed market reports, and company profiles
Forecasting Factors and Models
Forecasting Factors
- Historical Trends – Past market patterns, cycles, and major events that shaped how markets behave over time. Understanding past trends helps predict future behavior.
- Industry Factors – Specific characteristics of the industry like structure, regulations, and innovation cycles that affect market dynamics.
- Macroeconomic Factors – Economic conditions like GDP growth, inflation, and employment rates that affect how much money people have to spend.
- Demographic Factors – Population characteristics like age, income, and location that determine who can buy your product.
- Technology Factors – How quickly people adopt new technology and how much technology infrastructure exists.
- Regulatory Factors – Government rules, laws, and policies that can help or restrict market growth.
- Competitive Factors – Analyzing competition structure such as degree of competition and bargaining power of buyers and suppliers.
Forecasting Models / Techniques
Multiple Regression Analysis
- Identify and quantify factors that drive market changes
- Statistical modeling to establish relationships between market drivers and outcomes
Time Series Analysis – Seasonal Patterns
- Understand regular cyclical patterns in market demand
- Advanced statistical techniques to separate trend, seasonal, and irregular components
Time Series Analysis – Trend Analysis
- Identify underlying market growth patterns and momentum
- Statistical analysis of historical data to project future trends
Expert Opinion – Expert Interviews
- Gather deep industry insights and contextual understanding
- In-depth interviews with key industry stakeholders
Multi-Scenario Development
- Prepare for uncertainty by modeling different possible futures
- Creating optimistic, pessimistic, and most likely scenarios
Time Series Analysis – Moving Averages
- Sophisticated forecasting for complex time series data
- Auto-regressive integrated moving average models with seasonal components
Econometric Models
- Apply economic theory to market forecasting
- Sophisticated economic models that account for market interactions
Expert Opinion – Delphi Method
- Harness collective wisdom of industry experts
- Structured, multi-round expert consultation process
Monte Carlo Simulation
- Quantify uncertainty and probability distributions
- Thousands of simulations with varying input parameters
Research Analysis
Our research framework is built upon the fundamental principle of validating market intelligence from both demand and supply perspectives. This dual-sided approach ensures comprehensive market understanding and reduces the risk of single-source bias.
Demand-Side Analysis: We understand end-user/application behavior, preferences, and market needs along with the penetration of the product for specific application.
Supply-Side Analysis: We estimate overall market revenue, analyze the segmental share along with industry capacity, competitive landscape, and market structure.
Validation & Evaluation
Data triangulation is a validation technique that uses multiple methods, sources, or perspectives to examine the same research question, thereby increasing the credibility and reliability of research findings. In market research, triangulation serves as a quality assurance mechanism that helps identify and minimize bias, validate assumptions, and ensure accuracy in market estimates.
- Data Source Triangulation – Using multiple data sources to examine the same phenomenon
- Methodological Triangulation – Using multiple research methods to study the same research question
- Investigator Triangulation – Using multiple researchers or analysts to examine the same data
- Theoretical Triangulation – Using multiple theoretical perspectives to interpret the same data

Custom Market Research Services
We will customise the research for you, in case the report listed above does not meet your requirements.
Get 10% Free Customisation