Virtual Power Plant Market Size, Share & Trends Analysis Report by Solution Type (Distributed Energy Resource Management (DERM), Energy Management Systems (EMS), Demand Response Management, Microgrid Management, Smart Grid Integration, Battery Management Systems, Load Forecasting Solutions, Others), Component, Control Architecture, Asset Type, Grid Type, Communication Technology, End-Users, and Geography (North America, Europe, Asia Pacific, Middle East, Africa, and South America) – Global Industry Data, Trends, and Forecasts, 2026–2035
|
|
|
Segmental Data Insights |
|
|
Demand Trends |
|
|
Competitive Landscape |
|
|
Strategic Development |
|
|
Future Outlook & Opportunities |
|
Virtual Power Plant Market Size, Share, and Growth
The global virtual power plant market is witnessing strong growth, valued at USD 5.8 billion in 2025 and projected to reach USD 44.5 billion by 2035, expanding at a CAGR of 22.6% during the forecast period. North America is the fastest-growing Virtual Power Plant market due to increasing grid modernization initiatives, high renewable energy integration, and strong adoption of advanced energy management and demand-response technologies.
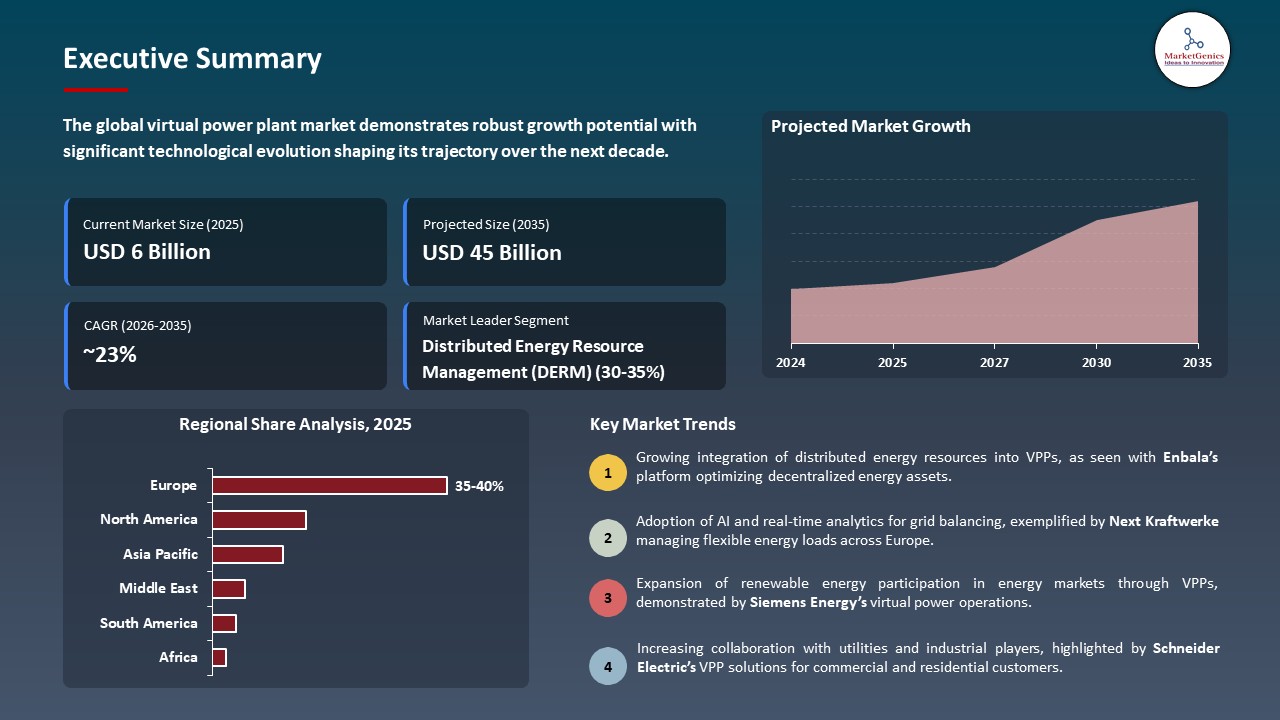
Emmett Romine, vice president, Customer Energy and Transportation Solutions at Xcel Energy, said, “Our Renewable Battery Connect program creates a new VPP in Colorado and we’re proud to work with Itron and Tesla, who have proven to be trusted industry partners and align with our goals to strengthen the energy grid while maintaining reliability and advancing renewable energy. This collaboration will deliver renewable, solar energy when our customers need it most”
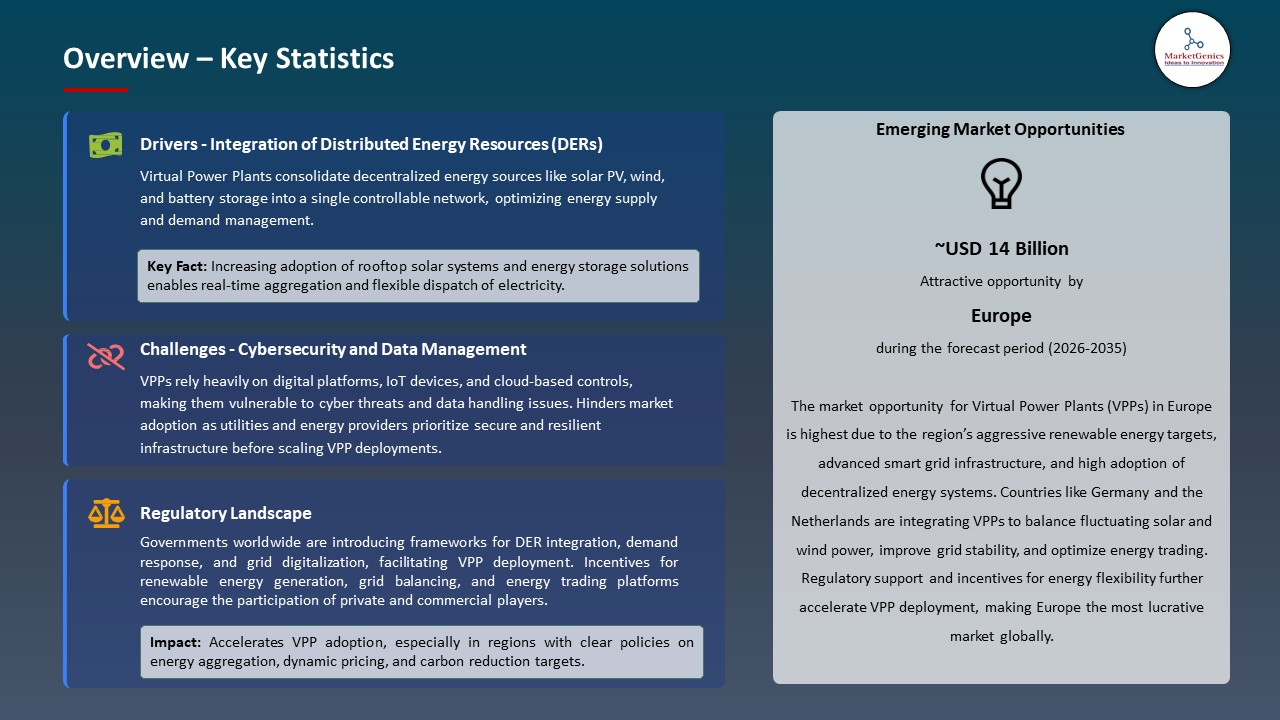
The expanding penetration of distributed energy resources, growing grid instability and the rising demands of flexible and intelligent power management are driving a high rate of adoption of Virtual Power Plants in utility, commercial and residential fields. To balance the supply and demand, utilities are aggressively implementing VPP platforms to combine solar, battery storage, electric vehicles, and demand-response assets and help in integrating renewables.
In March 2025, Itron, Tesla, and Xcel Energy installed a high-tech virtual power plant in Colorado with distributed energy resource management software with residential batteries to stabilize the grid during peak demand. The world is becoming increasingly accessible to scalable VPP via growing investments in smart grid infrastructure, AI-based forecasting and energy storage technologies. The growing Virtual Power Plant adoption is motivated by the rising integration of renewable and virtual grid management, which is rapidly growing in large scale in the global market.
Adjacent market opportunities for virtual power plants include expansion into energy storage systems, electric vehicle charging infrastructure, smart grid analytics, demand response platforms, and distributed renewable energy management. These markets complement VPP deployment by enabling asset aggregation, real-time optimization, and flexible power control across residential, commercial, and utility-scale energy networks.
 Virtual Power Plant Market Dynamics and Trends
Driver: Rising Electricity Demand from Data Centers Forcing Utilities to Adopt Flexible Power Solutions
-
The use of electricity in data centers, cloud computing and digital infrastructure is becoming more popular and requires utilities to implement flexible and scalable power management solutions, which makes Virtual Power Plants more relevant. Large changes in loads due to large-density computing systems necessitate real-time balancing, which is not always efficiently offered by traditional generation systems.
- Virtual Power Plants allow the utilities to combine distributed energy resources including batteries, solar, and demand-response resources to help them control peak demand without the need to construct new power plants. This can be used to stabilize a grid, where the capital investment and time to deploy is minimized.
- In 2025, Siemens introduced Gridscale X Flexibility Manager, which gives utilities the ability to leverage distributed energy resources, balance the growing data-center power demand, and expand capacity up to 20 percent without the need to add new infrastructure to support Virtual Power Plant-based flexible grid operations.
- Increasing data-driven power requirement is driving the adoption of virtual power plant as an economical grid balancing answer.
Restraint: Complex Interoperability Requirements Across Multiple Distributed Energy Devices and Communication Protocols
-
The complexity of interoperability requirements for various distributed energy resources, hardware platforms, and communication protocols limits the deployment of Virtual Power Plant because integrating systems into the system is not always straightforward. VPP platforms also need to synchronize solar inverters, battery storage, EV chargers, smart meters, and demand-response devices which can be based on various standards, and they need sophisticated software and safe information trade to get real-time control.
- Moreover, utility providers need to ensure cybersecurity, grid compliance, and consistent communication among thousands of interconnected assets, which adds to the implementation time and operational expenses. Inconsistency in technical standards and interoperability between vendors may delay the project implementation, especially in large-scale or multi-utility setting. The challenges pose a reluctance to operators intending to make large deployments.
- Interoperability complexity increases deployment, implementation cost and time delays market expansion in the short term of the virtual power plant market.
Opportunity: Growing Utility Investments in Grid Flexibility Solutions to Avoid New Power Infrastructure
-
The virtual power plant market has great potential, because utilities are increasingly investing in grid flexibility solutions to handle the increasing electricity demand without requiring new generation or transmission infrastructure. Using distributed energy sources that may include batteries, solar and flexible loads the VPPs enable the operators to balance the supply with the demand at any point in time whilst minimizing capital expenditure.
- This solution assists utilities to delay expensive grid upgrades, speed up integration of renewable energy and keep reliability and thus VPP platforms are a viable alternative to traditional capacity expansion.
- In the year 2025, Sunrun expanded its distributed power plants to more than 106,000 households which provided 416 MW of flexible capacity to U.S. grids allowing utilities to satisfy peak demand and avoid new power infrastructure with aggregated solar-plus-battery Virtual Power Plant systems.
- The increase in the interest in flexible grid management is expanding the overall prospects of the long-term growth of Virtual Power Plant deployment.
Key Trend: Integration of Residential Battery Networks into Utility-Scale Virtual Power Plant Ecosystems
-
The virtual power plant market is being influenced more by residential battery networks being integrated into the utility scale energy management platforms that allow thousands of small energy assets to work together as one flexible power source. Digital platforms can be used to add together connected home batteries, rooftop solar and electric vehicles to provide power during peak demand and stabilize grid operations.
- The benefit of this trend is that utilities can gain access to fast-response capacity without having to construct new plants and consumers can receive incentives and enhanced energy reliability by enrolling in distributed energy schemes.
- Tesla has over time extended its virtual power plant initiatives by clustering together thousands of residential Powerwall batteries into utility-tied networks, allowing stored home solar energy to be dispatched in instances of peak demand to stabilize the grid and offer flexible on-demand load capacity.
- Virtual Power Plant scalability is also increasing and distributed energy is being turned into utility-grade capacity because of the expansion of residential asset aggregation.
 Virtual Power Plant Market Analysis and Segmental Data
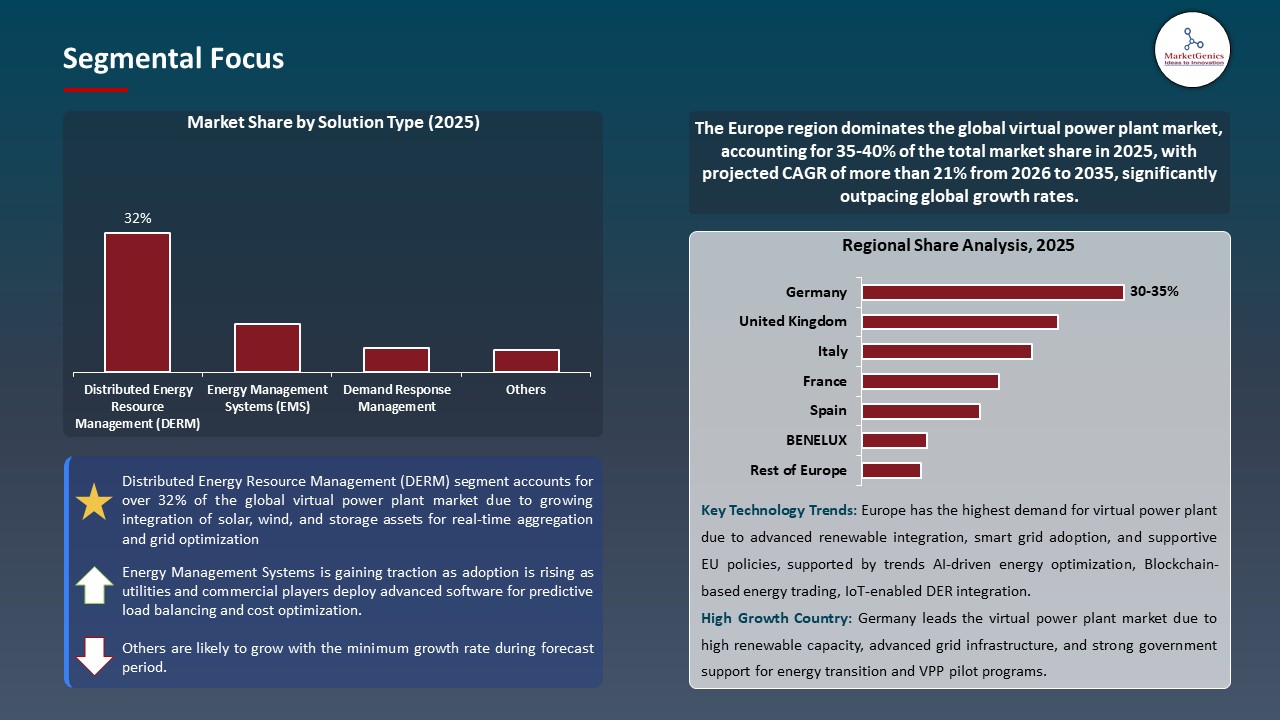
Distributed Energy Resource Management (DERM) Dominate Global Virtual Power Plant Market
-
Distributed Energy Resource Management (DERM) dominates the global virtual power plant market due to its critical role in coordinating and optimizing large numbers of distributed energy assets through a single digital platform. DERM systems allow utilities and operators to monitor, control, and dispatch solar panels, battery storage, electric vehicles, and flexible loads in real time to enable a stable and efficient performance of a grid.
- Expanding infiltration of renewable energy and de-centralized generation has amplified the requirement of sophisticated software that can anticipate demand, handle intermittency, and ensure grid reliability. Derivatives exchanges also facilitate automatic decision-making, better energy trading, and expediency in achieving peak load demands and are therefore critical in large scale VPP application.
- DERM platform domination enhances the scalability of virtual power plant because it allows efficient management of intricate distributed energy networks.
Europe Leads Global Virtual Power Plant Market Demand
-
Europe leads the global virtual power plant market demand due to strong renewable energy penetration, advanced grid infrastructure, and supportive regulatory frameworks promoting decentralized energy management.
- Nations in the region are quickly adopting wind, solar, and energy storage facilities, which means that there are more and more digital platforms needed that can organize distributed energy sources and ensure grid stability. Virtual Power plants are extensively implemented to manage supply and demand and help in a shift towards low-carbon power systems.
- Government policies that promote smart grids, demand-response as well as cross-border energy trading, have increased the implementation of VPP solutions in commercial, residential, and utility markets. The steep price of electricity and the necessity to have energy security has an additional push towards the investment in the flexible, software-driven grid management technologies.
- The presence of robust policy backing and integration of renewable energy sources in Europe has once again propelled the mass-scale implementation of Virtual Power Plants to boost local market dominance.
Virtual Power Plant Market Ecosystem
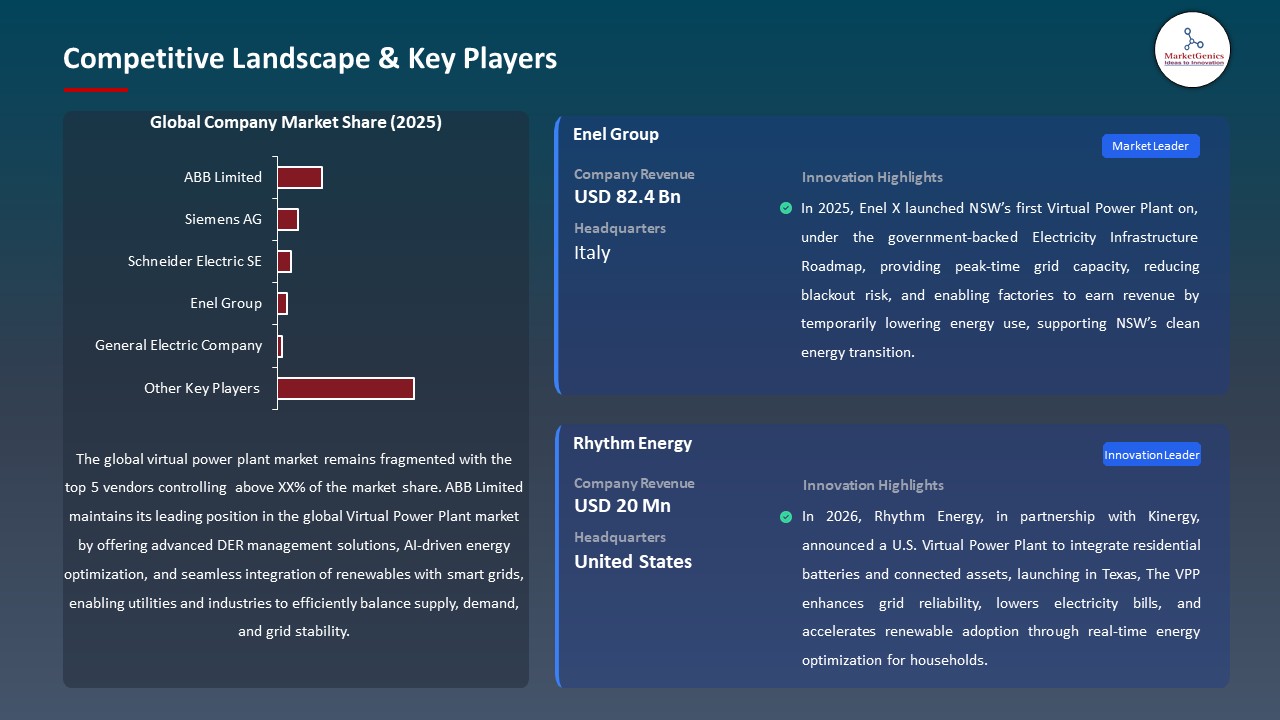
The global virtual power plant market is led by key players including ABB Ltd, Siemens AG, Schneider Electric SE, Enel Group, and General Electric Company. The competition among these companies lies in their high grid automation systems, distributed energy management application systems and integrated power control systems which are backed by effective international utility relations. They have a competitive edge with investments in digital grid technology, cloud-based energy solutions, and battery storage systems, and long-term partnerships with utilities, regulators, and renewable energy developers to deploy large-scale virtual power plants.
The market value chain comprises of distributed energy resource production, power electronics production, software platform production, system integration, communication network deployment and grid operation services. Other phases like real time monitoring, predictive analytics, cybersecurity and maintenance services enable consistent coordination of the solar, wind, storage and flexible loads in residential and commercial as well as utility uses to enhance grid efficiency, reliability and energy optimization.
High entry barriers exist due to the need for advanced software capability, grid compliance requirements, large capital investment, and strong utility relationships. Continuous innovation in AI-driven energy management, demand-response automation, cloud-based control platforms, and interoperability standards drives differentiation, enabling scalable deployment and sustained global growth of virtual power plant solutions.
 Recent Development and Strategic Overview:
- In June 2025, Enel X deployed a government-backed virtual power plant in New South Wales to provide peak-time grid capacity using demand-response from industrial energy users instead of new generation infrastructure. The project operates under a Long-Term Energy Service Agreement, enabling flexible load reduction from major commercial partners to stabilize the grid, prevent blackouts, and support renewable energy integration while lowering system costs.
- In June 2025, Hitachi Energy delivered a digital settlement and optimization solution for Zhejiang Energy Group’s virtual power plant in China, enabling accurate billing, automated trading, and full participation in electricity market transactions. The platform integrates distributed resources into grid operations using intelligent algorithms, improving supply-demand balance, enhancing flexibility, and supporting large-scale renewable energy integration through advanced energy management software.
Report Scope
|
Detail |
|
|
Market Size in 2025 |
USD 5.8 Bn |
|
Market Forecast Value in 2035 |
USD 44.5 Bn |
|
Growth Rate (CAGR) |
22.6% |
|
Forecast Period |
2026 – 2035 |
|
Historical Data Available for |
2021 – 2024 |
|
Market Size Units |
US$ Billion for Value Units for Volume |
|
Report Format |
Electronic (PDF) + Excel |
|
North America |
Europe |
Asia Pacific |
Middle East |
Africa |
South America |
|
|
|
|
|
|
|
Companies Covered |
|||||
|
|
|
|
|
|
Virtual Power Plant Market Segmentation and Highlights
|
Segment |
Sub-segment |
|
Virtual Power Plant Market, By Solution Type |
|
|
Virtual Power Plant Market, By Component |
|
|
Virtual Power Plant Market, By Control Architecture |
|
|
Virtual Power Plant Market, By Asset Type |
|
|
Virtual Power Plant Market, By Grid Type |
|
|
Virtual Power Plant Market, By Communication Technology |
|
|
Virtual Power Plant Market, By End-users |
|
Frequently Asked Questions
Table of Contents
- 1. Research Methodology and Assumptions
- 1.1. Definitions
- 1.2. Research Design and Approach
- 1.3. Data Collection Methods
- 1.4. Base Estimates and Calculations
- 1.5. Forecasting Models
- 1.5.1. Key Forecast Factors & Impact Analysis
- 1.6. Secondary Research
- 1.6.1. Open Sources
- 1.6.2. Paid Databases
- 1.6.3. Associations
- 1.7. Primary Research
- 1.7.1. Primary Sources
- 1.7.2. Primary Interviews with Stakeholders across Ecosystem
- 2. Executive Summary
- 2.1. Global Virtual Power Plant Market Outlook
- 2.1.1. Virtual Power Plant Market Size (Volume (Units) and Value (US$ Bn)), and Forecasts, 2021-2035
- 2.1.2. Compounded Annual Growth Rate Analysis
- 2.1.3. Growth Opportunity Analysis
- 2.1.4. Segmental Share Analysis
- 2.1.5. Geographical Share Analysis
- 2.2. Market Analysis and Facts
- 2.3. Supply-Demand Analysis
- 2.4. Competitive Benchmarking
- 2.5. Go-to- Market Strategy
- 2.5.1. Customer/ End-use Industry Assessment
- 2.5.2. Growth Opportunity Data, 2026-2035
- 2.5.2.1. Regional Data
- 2.5.2.2. Country Data
- 2.5.2.3. Segmental Data
- 2.5.3. Identification of Potential Market Spaces
- 2.5.4. GAP Analysis
- 2.5.5. Potential Attractive Price Points
- 2.5.6. Prevailing Market Risks & Challenges
- 2.5.7. Preferred Sales & Marketing Strategies
- 2.5.8. Key Recommendations and Analysis
- 2.5.9. A Way Forward
- 2.1. Global Virtual Power Plant Market Outlook
- 3. Industry Data and Premium Insights
- 3.1. Global Energy & Power Industry Overview, 2025
- 3.1.1. Energy & Power Industry Ecosystem Analysis
- 3.1.2. Key Trends for Energy & Power Industry
- 3.1.3. Regional Distribution for Energy & Power Industry
- 3.2. Supplier Customer Data
- 3.3. Technology Roadmap and Developments
- 3.4. Trade Analysis
- 3.4.1. Import & Export Analysis, 2025
- 3.4.2. Top Importing Countries
- 3.4.3. Top Exporting Countries
- 3.5. Trump Tariff Impact Analysis
- 3.5.1. Manufacturer
- 3.5.1.1. Based on the component & Raw material
- 3.5.2. Supply Chain
- 3.5.3. End Consumer
- 3.5.1. Manufacturer
- 3.6. Raw Material Analysis
- 3.1. Global Energy & Power Industry Overview, 2025
- 4. Market Overview
- 4.1. Market Dynamics
- 4.1.1. Drivers
- 4.1.1.1. Increasing integration of renewable energy sources into power grids.
- 4.1.1.2. Rising demand for grid flexibility and peak load management.
- 4.1.1.3. Adoption of advanced IoT, AI, and energy management technologies
- 4.1.2. Restraints
- 4.1.2.1. High initial investment and infrastructure costs.
- 4.1.2.2. Regulatory and interoperability challenges across multiple energy markets.
- 4.1.1. Drivers
- 4.2. Key Trend Analysis
- 4.3. Regulatory Framework
- 4.3.1. Key Regulations, Norms, and Subsidies, by Key Countries
- 4.3.2. Tariffs and Standards
- 4.3.3. Impact Analysis of Regulations on the Market
- 4.4. Ecosystem Analysis
- 4.5. Cost Structure Analysis
- 4.5.1. Parameter’s Share for Cost Associated
- 4.5.2. COGP vs COGS
- 4.5.3. Profit Margin Analysis
- 4.6. Pricing Analysis
- 4.6.1. Regional Pricing Analysis
- 4.6.2. Segmental Pricing Trends
- 4.6.3. Factors Influencing Pricing
- 4.7. Porter’s Five Forces Analysis
- 4.8. PESTEL Analysis
- 4.9. Global Virtual Power Plant Market Demand
- 4.9.1. Historical Market Size – (Volume (Units) and Value (US$ Bn)), 2020-2024
- 4.9.2. Current and Future Market Size – (Volume (Units) and Value (US$ Bn)), 2026–2035
- 4.9.2.1. Y-o-Y Growth Trends
- 4.9.2.2. Absolute $ Opportunity Assessment
- 4.1. Market Dynamics
- 5. Competition Landscape
- 5.1. Competition structure
- 5.1.1. Fragmented v/s consolidated
- 5.2. Company Share Analysis, 2025
- 5.2.1. Global Company Market Share
- 5.2.2. By Region
- 5.2.2.1. North America
- 5.2.2.2. Europe
- 5.2.2.3. Asia Pacific
- 5.2.2.4. Middle East
- 5.2.2.5. Africa
- 5.2.2.6. South America
- 5.3. Product Comparison Matrix
- 5.3.1. Specifications
- 5.3.2. Market Positioning
- 5.3.3. Pricing
- 5.1. Competition structure
- 6. Global Virtual Power Plant Market Analysis, by Solution Type
- 6.1. Key Segment Analysis
- 6.2. Virtual Power Plant Market Size (Volume (Units) and Value (US$ Bn)), Analysis, and Forecasts, by Solution Type, 2021-2035
- 6.2.1. Distributed Energy Resource Management (DERM)
- 6.2.2. Energy Management Systems (EMS)
- 6.2.3. Demand Response Management
- 6.2.4. Microgrid Management
- 6.2.5. Smart Grid Integration
- 6.2.6. Battery Management Systems
- 6.2.7. Load Forecasting Solutions
- 6.2.8. Others
- 7. Global Virtual Power Plant Market Analysis, by Component
- 7.1. Key Segment Analysis
- 7.2. Virtual Power Plant Market Size (Volume (Units) and Value (US$ Bn)), Analysis, and Forecasts, by Component, 2021-2035
- 7.2.1. Hardware
- 7.2.2. Solar PV Systems
- 7.2.2.1. Wind Turbines
- 7.2.2.2. Battery Storage Systems
- 7.2.2.3. Smart Meters
- 7.2.2.4. Controllers/Gateways
- 7.2.2.5. Others
- 7.2.3. Software
- 7.2.3.1. Cloud-based Platforms
- 7.2.3.2. Analytics Software
- 7.2.3.3. Monitoring & Control Software
- 7.2.3.4. AI/ML-based Optimization Tools
- 7.2.3.5. Others
- 7.2.4. Services
- 7.2.4.1. System Integration
- 7.2.4.2. Consulting Services
- 7.2.4.3. Operation & Maintenance
- 7.2.4.4. Training & Support
- 7.2.4.5. Others
- 8. Global Virtual Power Plant Market Analysis, by Control Architecture
- 8.1. Key Segment Analysis
- 8.2. Virtual Power Plant Market Size (Volume (Units) and Value (US$ Bn)), Analysis, and Forecasts, by Control Architecture, 2021-2035
- 8.2.1. Centralized Control
- 8.2.2. Decentralized Control
- 8.2.3. Distributed Control
- 8.2.4. Peer-to-Peer (P2P) Control
- 9. Global Virtual Power Plant Market Analysis, by Asset Type
- 9.1. Key Segment Analysis
- 9.2. Virtual Power Plant Market Size (Volume (Units) and Value (US$ Bn)), Analysis, and Forecasts, by Asset Type, 2021-2035
- 9.2.1. Renewable Energy Sources
- 9.2.1.1. Solar PV
- 9.2.1.2. Wind Energy
- 9.2.1.3. Hydroelectric
- 9.2.1.4. Geothermal
- 9.2.1.5. Others
- 9.2.2. Non-Renewable Sources
- 9.2.2.1. Natural Gas
- 9.2.2.2. Diesel Generators
- 9.2.2.3. Others
- 9.2.2.4. Energy Storage
- 9.2.2.5. Battery Energy Storage Systems (BESS)
- 9.2.2.6. Thermal Storage
- 9.2.2.7. Mechanical Storage
- 9.2.2.8. Others
- 9.2.3. Demand-side Resources
- 9.2.3.1. HVAC Systems
- 9.2.3.2. EV Charging Stations
- 9.2.3.3. Industrial Loads
- 9.2.3.4. Others
- 9.2.1. Renewable Energy Sources
- 10. Global Virtual Power Plant Market Analysis, by Grid Type
- 10.1. Key Segment Analysis
- 10.2. Virtual Power Plant Market Size (Volume (Units) and Value (US$ Bn)), Analysis, and Forecasts, by Grid Type, 2021-2035
- 10.2.1. AC Microgrids
- 10.2.2. DC Microgrids
- 10.2.3. Hybrid Microgrids
- 11. Global Virtual Power Plant Market Analysis, by Communication Technology
- 11.1. Key Segment Analysis
- 11.2. Virtual Power Plant Market Size (Volume (Units) and Value (US$ Bn)), Analysis, and Forecasts, by Communication Technology, 2021-2035
- 11.2.1. Wi-Fi
- 11.2.2. Cellular (4G/5G)
- 11.2.3. Powerline Communication (PLC)
- 11.2.4. LoRaWAN
- 11.2.5. Mesh Networks
- 11.2.6. Fiber Optics
- 11.2.7. Others
- 12. Global Virtual Power Plant Market Analysis, by End-users
- 12.1. Key Segment Analysis
- 12.2. Virtual Power Plant Market Size (Volume (Units) and Value (US$ Bn)), Analysis, and Forecasts, by End-users, 2021-2035
- 12.2.1. Residential
- 12.2.2. Commercial
- 12.2.3. Industrial
- 12.2.4. Utility/Grid Operator
- 12.2.5. Microgrid/Campus Operations
- 12.2.6. Agricultural
- 12.2.7. Transportation/EV Infrastructure
- 12.2.8. Water & Wastewater Management
- 12.2.9. Others
- 13. Global Virtual Power Plant Market Analysis and Forecasts, by Region
- 13.1. Key Findings
- 13.2. Virtual Power Plant Market Size (Volume (Units) and Value (US$ Bn)), Analysis, and Forecasts, by Region, 2021-2035
- 13.2.1. North America
- 13.2.2. Europe
- 13.2.3. Asia Pacific
- 13.2.4. Middle East
- 13.2.5. Africa
- 13.2.6. South America
- 14. North America Virtual Power Plant Market Analysis
- 14.1. Key Segment Analysis
- 14.2. Regional Snapshot
- 14.3. North America Virtual Power Plant Market Size (Volume (Units) and Value (US$ Bn)), Analysis, and Forecasts, 2021-2035
- 14.3.1. Solution Type
- 14.3.2. Component
- 14.3.3. Control Architecture
- 14.3.4. Asset Type
- 14.3.5. Grid Type
- 14.3.6. Communication Technology
- 14.3.7. End-Users
- 14.3.8. Country
- 14.3.8.1. USA
- 14.3.8.2. Canada
- 14.3.8.3. Mexico
- 14.4. USA Virtual Power Plant Market
- 14.4.1. Country Segmental Analysis
- 14.4.2. Solution Type
- 14.4.3. Component
- 14.4.4. Control Architecture
- 14.4.5. Asset Type
- 14.4.6. Grid Type
- 14.4.7. Communication Technology
- 14.4.8. End-Users
- 14.5. Canada Virtual Power Plant Market
- 14.5.1. Country Segmental Analysis
- 14.5.2. Solution Type
- 14.5.3. Component
- 14.5.4. Control Architecture
- 14.5.5. Asset Type
- 14.5.6. Grid Type
- 14.5.7. Communication Technology
- 14.5.8. End-Users
- 14.6. Mexico Virtual Power Plant Market
- 14.6.1. Country Segmental Analysis
- 14.6.2. Solution Type
- 14.6.3. Component
- 14.6.4. Control Architecture
- 14.6.5. Asset Type
- 14.6.6. Grid Type
- 14.6.7. Communication Technology
- 14.6.8. End-Users
- 15. Europe Virtual Power Plant Market Analysis
- 15.1. Key Segment Analysis
- 15.2. Regional Snapshot
- 15.3. Europe Virtual Power Plant Market Size (Volume (Units) and Value (US$ Bn)), Analysis, and Forecasts, 2021-2035
- 15.3.1. Solution Type
- 15.3.2. Component
- 15.3.3. Control Architecture
- 15.3.4. Asset Type
- 15.3.5. Grid Type
- 15.3.6. Communication Technology
- 15.3.7. End-Users
- 15.3.8. Country
- 15.3.8.1. Germany
- 15.3.8.2. United Kingdom
- 15.3.8.3. France
- 15.3.8.4. Italy
- 15.3.8.5. Spain
- 15.3.8.6. Netherlands
- 15.3.8.7. Nordic Countries
- 15.3.8.8. Poland
- 15.3.8.9. Russia & CIS
- 15.3.8.10. Rest of Europe
- 15.4. Germany Virtual Power Plant Market
- 15.4.1. Country Segmental Analysis
- 15.4.2. Solution Type
- 15.4.3. Component
- 15.4.4. Control Architecture
- 15.4.5. Asset Type
- 15.4.6. Grid Type
- 15.4.7. Communication Technology
- 15.4.8. End-Users
- 15.5. United Kingdom Virtual Power Plant Market
- 15.5.1. Country Segmental Analysis
- 15.5.2. Solution Type
- 15.5.3. Component
- 15.5.4. Control Architecture
- 15.5.5. Asset Type
- 15.5.6. Grid Type
- 15.5.7. Communication Technology
- 15.5.8. End-Users
- 15.6. France Virtual Power Plant Market
- 15.6.1. Country Segmental Analysis
- 15.6.2. Solution Type
- 15.6.3. Component
- 15.6.4. Control Architecture
- 15.6.5. Asset Type
- 15.6.6. Grid Type
- 15.6.7. Communication Technology
- 15.6.8. End-Users
- 15.7. Italy Virtual Power Plant Market
- 15.7.1. Country Segmental Analysis
- 15.7.2. Solution Type
- 15.7.3. Component
- 15.7.4. Control Architecture
- 15.7.5. Asset Type
- 15.7.6. Grid Type
- 15.7.7. Communication Technology
- 15.7.8. End-Users
- 15.8. Spain Virtual Power Plant Market
- 15.8.1. Country Segmental Analysis
- 15.8.2. Solution Type
- 15.8.3. Component
- 15.8.4. Control Architecture
- 15.8.5. Asset Type
- 15.8.6. Grid Type
- 15.8.7. Communication Technology
- 15.8.8. End-Users
- 15.9. Netherlands Virtual Power Plant Market
- 15.9.1. Country Segmental Analysis
- 15.9.2. Solution Type
- 15.9.3. Component
- 15.9.4. Control Architecture
- 15.9.5. Asset Type
- 15.9.6. Grid Type
- 15.9.7. Communication Technology
- 15.9.8. End-Users
- 15.10. Nordic Countries Virtual Power Plant Market
- 15.10.1. Country Segmental Analysis
- 15.10.2. Solution Type
- 15.10.3. Component
- 15.10.4. Control Architecture
- 15.10.5. Asset Type
- 15.10.6. Grid Type
- 15.10.7. Communication Technology
- 15.10.8. End-Users
- 15.11. Poland Virtual Power Plant Market
- 15.11.1. Country Segmental Analysis
- 15.11.2. Solution Type
- 15.11.3. Component
- 15.11.4. Control Architecture
- 15.11.5. Asset Type
- 15.11.6. Grid Type
- 15.11.7. Communication Technology
- 15.11.8. End-Users
- 15.12. Russia & CIS Virtual Power Plant Market
- 15.12.1. Country Segmental Analysis
- 15.12.2. Solution Type
- 15.12.3. Component
- 15.12.4. Control Architecture
- 15.12.5. Asset Type
- 15.12.6. Grid Type
- 15.12.7. Communication Technology
- 15.12.8. End-Users
- 15.13. Rest of Europe Virtual Power Plant Market
- 15.13.1. Country Segmental Analysis
- 15.13.2. Solution Type
- 15.13.3. Component
- 15.13.4. Control Architecture
- 15.13.5. Asset Type
- 15.13.6. Grid Type
- 15.13.7. Communication Technology
- 15.13.8. End-Users
- 16. Asia Pacific Virtual Power Plant Market Analysis
- 16.1. Key Segment Analysis
- 16.2. Regional Snapshot
- 16.3. Asia Pacific Virtual Power Plant Market Size (Volume (Units) and Value (US$ Bn)), Analysis, and Forecasts, 2021-2035
- 16.3.1. Solution Type
- 16.3.2. Component
- 16.3.3. Control Architecture
- 16.3.4. Asset Type
- 16.3.5. Grid Type
- 16.3.6. Communication Technology
- 16.3.7. End-Users
- 16.3.8. Country
- 16.3.8.1. China
- 16.3.8.2. India
- 16.3.8.3. Japan
- 16.3.8.4. South Korea
- 16.3.8.5. Australia and New Zealand
- 16.3.8.6. Indonesia
- 16.3.8.7. Malaysia
- 16.3.8.8. Thailand
- 16.3.8.9. Vietnam
- 16.3.8.10. Rest of Asia Pacific
- 16.4. China Virtual Power Plant Market
- 16.4.1. Country Segmental Analysis
- 16.4.2. Solution Type
- 16.4.3. Component
- 16.4.4. Control Architecture
- 16.4.5. Asset Type
- 16.4.6. Grid Type
- 16.4.7. Communication Technology
- 16.4.8. End-Users
- 16.5. India Virtual Power Plant Market
- 16.5.1. Country Segmental Analysis
- 16.5.2. Solution Type
- 16.5.3. Component
- 16.5.4. Control Architecture
- 16.5.5. Asset Type
- 16.5.6. Grid Type
- 16.5.7. Communication Technology
- 16.5.8. End-Users
- 16.6. Japan Virtual Power Plant Market
- 16.6.1. Country Segmental Analysis
- 16.6.2. Solution Type
- 16.6.3. Component
- 16.6.4. Control Architecture
- 16.6.5. Asset Type
- 16.6.6. Grid Type
- 16.6.7. Communication Technology
- 16.6.8. End-Users
- 16.7. South Korea Virtual Power Plant Market
- 16.7.1. Country Segmental Analysis
- 16.7.2. Solution Type
- 16.7.3. Component
- 16.7.4. Control Architecture
- 16.7.5. Asset Type
- 16.7.6. Grid Type
- 16.7.7. Communication Technology
- 16.7.8. End-Users
- 16.8. Australia and New Zealand Virtual Power Plant Market
- 16.8.1. Country Segmental Analysis
- 16.8.2. Solution Type
- 16.8.3. Component
- 16.8.4. Control Architecture
- 16.8.5. Asset Type
- 16.8.6. Grid Type
- 16.8.7. Communication Technology
- 16.8.8. End-Users
- 16.9. Indonesia Virtual Power Plant Market
- 16.9.1. Country Segmental Analysis
- 16.9.2. Solution Type
- 16.9.3. Component
- 16.9.4. Control Architecture
- 16.9.5. Asset Type
- 16.9.6. Grid Type
- 16.9.7. Communication Technology
- 16.9.8. End-Users
- 16.10. Malaysia Virtual Power Plant Market
- 16.10.1. Country Segmental Analysis
- 16.10.2. Solution Type
- 16.10.3. Component
- 16.10.4. Control Architecture
- 16.10.5. Asset Type
- 16.10.6. Grid Type
- 16.10.7. Communication Technology
- 16.10.8. End-Users
- 16.11. Thailand Virtual Power Plant Market
- 16.11.1. Country Segmental Analysis
- 16.11.2. Solution Type
- 16.11.3. Component
- 16.11.4. Control Architecture
- 16.11.5. Asset Type
- 16.11.6. Grid Type
- 16.11.7. Communication Technology
- 16.11.8. End-Users
- 16.12. Vietnam Virtual Power Plant Market
- 16.12.1. Country Segmental Analysis
- 16.12.2. Solution Type
- 16.12.3. Component
- 16.12.4. Control Architecture
- 16.12.5. Asset Type
- 16.12.6. Grid Type
- 16.12.7. Communication Technology
- 16.12.8. End-Users
- 16.13. Rest of Asia Pacific Virtual Power Plant Market
- 16.13.1. Country Segmental Analysis
- 16.13.2. Solution Type
- 16.13.3. Component
- 16.13.4. Control Architecture
- 16.13.5. Asset Type
- 16.13.6. Grid Type
- 16.13.7. Communication Technology
- 16.13.8. End-Users
- 17. Middle East Virtual Power Plant Market Analysis
- 17.1. Key Segment Analysis
- 17.2. Regional Snapshot
- 17.3. Middle East Virtual Power Plant Market Size (Volume (Units) and Value (US$ Bn)), Analysis, and Forecasts, 2021-2035
- 17.3.1. Solution Type
- 17.3.2. Component
- 17.3.3. Control Architecture
- 17.3.4. Asset Type
- 17.3.5. Grid Type
- 17.3.6. Communication Technology
- 17.3.7. End-Users
- 17.3.8. Country
- 17.3.8.1. Turkey
- 17.3.8.2. UAE
- 17.3.8.3. Saudi Arabia
- 17.3.8.4. Israel
- 17.3.8.5. Rest of Middle East
- 17.4. Turkey Virtual Power Plant Market
- 17.4.1. Country Segmental Analysis
- 17.4.2. Solution Type
- 17.4.3. Component
- 17.4.4. Control Architecture
- 17.4.5. Asset Type
- 17.4.6. Grid Type
- 17.4.7. Communication Technology
- 17.4.8. End-Users
- 17.5. UAE Virtual Power Plant Market
- 17.5.1. Country Segmental Analysis
- 17.5.2. Solution Type
- 17.5.3. Component
- 17.5.4. Control Architecture
- 17.5.5. Asset Type
- 17.5.6. Grid Type
- 17.5.7. Communication Technology
- 17.5.8. End-Users
- 17.6. Saudi Arabia Virtual Power Plant Market
- 17.6.1. Country Segmental Analysis
- 17.6.2. Solution Type
- 17.6.3. Component
- 17.6.4. Control Architecture
- 17.6.5. Asset Type
- 17.6.6. Grid Type
- 17.6.7. Communication Technology
- 17.6.8. End-Users
- 17.7. Israel Virtual Power Plant Market
- 17.7.1. Country Segmental Analysis
- 17.7.2. Solution Type
- 17.7.3. Component
- 17.7.4. Control Architecture
- 17.7.5. Asset Type
- 17.7.6. Grid Type
- 17.7.7. Communication Technology
- 17.7.8. End-Users
- 17.8. Rest of Middle East Virtual Power Plant Market
- 17.8.1. Country Segmental Analysis
- 17.8.2. Solution Type
- 17.8.3. Component
- 17.8.4. Control Architecture
- 17.8.5. Asset Type
- 17.8.6. Grid Type
- 17.8.7. Communication Technology
- 17.8.8. End-Users
- 18. Africa Virtual Power Plant Market Analysis
- 18.1. Key Segment Analysis
- 18.2. Regional Snapshot
- 18.3. Africa Virtual Power Plant Market Size (Volume (Units) and Value (US$ Bn)), Analysis, and Forecasts, 2021-2035
- 18.3.1. Solution Type
- 18.3.2. Component
- 18.3.3. Control Architecture
- 18.3.4. Asset Type
- 18.3.5. Grid Type
- 18.3.6. Communication Technology
- 18.3.7. End-Users
- 18.3.8. Country
- 18.3.8.1. South Africa
- 18.3.8.2. Egypt
- 18.3.8.3. Nigeria
- 18.3.8.4. Algeria
- 18.3.8.5. Rest of Africa
- 18.4. South Africa Virtual Power Plant Market
- 18.4.1. Country Segmental Analysis
- 18.4.2. Solution Type
- 18.4.3. Component
- 18.4.4. Control Architecture
- 18.4.5. Asset Type
- 18.4.6. Grid Type
- 18.4.7. Communication Technology
- 18.4.8. End-Users
- 18.5. Egypt Virtual Power Plant Market
- 18.5.1. Country Segmental Analysis
- 18.5.2. Solution Type
- 18.5.3. Component
- 18.5.4. Control Architecture
- 18.5.5. Asset Type
- 18.5.6. Grid Type
- 18.5.7. Communication Technology
- 18.5.8. End-Users
- 18.6. Nigeria Virtual Power Plant Market
- 18.6.1. Country Segmental Analysis
- 18.6.2. Solution Type
- 18.6.3. Component
- 18.6.4. Control Architecture
- 18.6.5. Asset Type
- 18.6.6. Grid Type
- 18.6.7. Communication Technology
- 18.6.8. End-Users
- 18.7. Algeria Virtual Power Plant Market
- 18.7.1. Country Segmental Analysis
- 18.7.2. Solution Type
- 18.7.3. Component
- 18.7.4. Control Architecture
- 18.7.5. Asset Type
- 18.7.6. Grid Type
- 18.7.7. Communication Technology
- 18.7.8. End-Users
- 18.8. Rest of Africa Virtual Power Plant Market
- 18.8.1. Country Segmental Analysis
- 18.8.2. Solution Type
- 18.8.3. Component
- 18.8.4. Control Architecture
- 18.8.5. Asset Type
- 18.8.6. Grid Type
- 18.8.7. Communication Technology
- 18.8.8. End-Users
- 19. South America Virtual Power Plant Market Analysis
- 19.1. Key Segment Analysis
- 19.2. Regional Snapshot
- 19.3. South America Virtual Power Plant Market Size (Volume (Units) and Value (US$ Bn)), Analysis, and Forecasts, 2021-2035
- 19.3.1. Solution Type
- 19.3.2. Component
- 19.3.3. Control Architecture
- 19.3.4. Asset Type
- 19.3.5. Grid Type
- 19.3.6. Communication Technology
- 19.3.7. End-Users
- 19.3.8. Country
- 19.3.8.1. Brazil
- 19.3.8.2. Argentina
- 19.3.8.3. Rest of South America
- 19.4. Brazil Virtual Power Plant Market
- 19.4.1. Country Segmental Analysis
- 19.4.2. Solution Type
- 19.4.3. Component
- 19.4.4. Control Architecture
- 19.4.5. Asset Type
- 19.4.6. Grid Type
- 19.4.7. Communication Technology
- 19.4.8. End-Users
- 19.5. Argentina Virtual Power Plant Market
- 19.5.1. Country Segmental Analysis
- 19.5.2. Solution Type
- 19.5.3. Component
- 19.5.4. Control Architecture
- 19.5.5. Asset Type
- 19.5.6. Grid Type
- 19.5.7. Communication Technology
- 19.5.8. End-Users
- 19.6. Rest of South America Virtual Power Plant Market
- 19.6.1. Country Segmental Analysis
- 19.6.2. Solution Type
- 19.6.3. Component
- 19.6.4. Control Architecture
- 19.6.5. Asset Type
- 19.6.6. Grid Type
- 19.6.7. Communication Technology
- 19.6.8. End-Users
- 20. Key Players/ Company Profile
- 20.1. ABB Limited
- 20.1.1. Company Details/ Overview
- 20.1.2. Company Financials
- 20.1.3. Key Customers and Competitors
- 20.1.4. Business/ Industry Portfolio
- 20.1.5. Product Portfolio/ Specification Details
- 20.1.6. Pricing Data
- 20.1.7. Strategic Overview
- 20.1.8. Recent Developments
- 20.2. American Electric Power
- 20.3. Atos SE
- 20.4. Duke Energy Corporation
- 20.5. Eaton Corporation
- 20.6. EDF Group
- 20.7. Enel Group
- 20.8. Fluence Energy
- 20.9. General Electric Company
- 20.10. Greensmith Energy
- 20.11. Hitachi, Ltd.
- 20.12. Honeywell International Inc.
- 20.13. NextEra Energy Resources
- 20.14. Ørsted A/S
- 20.15. Schneider Electric SE
- 20.16. Siemens AG
- 20.17. Southern Company
- 20.18. Stem, Inc.
- 20.19. Sunrun Inc.
- 20.20. Swell Energy
- 20.21. Other Key Players
- 20.1. ABB Limited
Note* - This is just tentative list of players. While providing the report, we will cover more number of players based on their revenue and share for each geography
Research Design
Our research design integrates both demand-side and supply-side analysis through a balanced combination of primary and secondary research methodologies. By utilizing both bottom-up and top-down approaches alongside rigorous data triangulation methods, we deliver robust market intelligence that supports strategic decision-making.
MarketGenics' comprehensive research design framework ensures the delivery of accurate, reliable, and actionable market intelligence. Through the integration of multiple research approaches, rigorous validation processes, and expert analysis, we provide our clients with the insights needed to make informed strategic decisions and capitalize on market opportunities.

MarketGenics leverages a dedicated industry panel of experts and a comprehensive suite of paid databases to effectively collect, consolidate, and analyze market intelligence.
Our approach has consistently proven to be reliable and effective in generating accurate market insights, identifying key industry trends, and uncovering emerging business opportunities.
Through both primary and secondary research, we capture and analyze critical company-level data such as manufacturing footprints, including technical centers, R&D facilities, sales offices, and headquarters.
Our expert panel further enhances our ability to estimate market size for specific brands based on validated field-level intelligence.
Our data mining techniques incorporate both parametric and non-parametric methods, allowing for structured data collection, sorting, processing, and cleaning.
Demand projections are derived from large-scale data sets analyzed through proprietary algorithms, culminating in robust and reliable market sizing.
Research Approach
The bottom-up approach builds market estimates by starting with the smallest addressable market units and systematically aggregating them to create comprehensive market size projections.
This method begins with specific, granular data points and builds upward to create the complete market landscape.
Customer Analysis → Segmental Analysis → Geographical Analysis
The top-down approach starts with the broadest possible market data and systematically narrows it down through a series of filters and assumptions to arrive at specific market segments or opportunities.
This method begins with the big picture and works downward to increasingly specific market slices.
TAM → SAM → SOM


Research Methods
Desk / Secondary Research
While analysing the market, we extensively study secondary sources, directories, and databases to identify and collect information useful for this technical, market-oriented, and commercial report. Secondary sources that we utilize are not only the public sources, but it is a combination of Open Source, Associations, Paid Databases, MG Repository & Knowledgebase, and others.
- Company websites, annual reports, financial reports, broker reports, and investor presentations
- National government documents, statistical databases and reports
- News articles, press releases and web-casts specific to the companies operating in the market, Magazines, reports, and others
- We gather information from commercial data sources for deriving company specific data such as segmental revenue, share for geography, product revenue, and others
- Internal and external proprietary databases (industry-specific), relevant patent, and regulatory databases
- Governing Bodies, Government Organizations
- Relevant Authorities, Country-specific Associations for Industries
We also employ the model mapping approach to estimate the product level market data through the players' product portfolio
Primary Research
Primary research/ interviews is vital in analyzing the market. Most of the cases involves paid primary interviews. Primary sources include primary interviews through e-mail interactions, telephonic interviews, surveys as well as face-to-face interviews with the different stakeholders across the value chain including several industry experts.
| Type of Respondents | Number of Primaries |
|---|---|
| Tier 2/3 Suppliers | ~20 |
| Tier 1 Suppliers | ~25 |
| End-users | ~25 |
| Industry Expert/ Panel/ Consultant | ~30 |
| Total | ~100 |
MG Knowledgebase
• Repository of industry blog, newsletter and case studies
• Online platform covering detailed market reports, and company profiles
Forecasting Factors and Models
Forecasting Factors
- Historical Trends – Past market patterns, cycles, and major events that shaped how markets behave over time. Understanding past trends helps predict future behavior.
- Industry Factors – Specific characteristics of the industry like structure, regulations, and innovation cycles that affect market dynamics.
- Macroeconomic Factors – Economic conditions like GDP growth, inflation, and employment rates that affect how much money people have to spend.
- Demographic Factors – Population characteristics like age, income, and location that determine who can buy your product.
- Technology Factors – How quickly people adopt new technology and how much technology infrastructure exists.
- Regulatory Factors – Government rules, laws, and policies that can help or restrict market growth.
- Competitive Factors – Analyzing competition structure such as degree of competition and bargaining power of buyers and suppliers.
Forecasting Models / Techniques
Multiple Regression Analysis
- Identify and quantify factors that drive market changes
- Statistical modeling to establish relationships between market drivers and outcomes
Time Series Analysis – Seasonal Patterns
- Understand regular cyclical patterns in market demand
- Advanced statistical techniques to separate trend, seasonal, and irregular components
Time Series Analysis – Trend Analysis
- Identify underlying market growth patterns and momentum
- Statistical analysis of historical data to project future trends
Expert Opinion – Expert Interviews
- Gather deep industry insights and contextual understanding
- In-depth interviews with key industry stakeholders
Multi-Scenario Development
- Prepare for uncertainty by modeling different possible futures
- Creating optimistic, pessimistic, and most likely scenarios
Time Series Analysis – Moving Averages
- Sophisticated forecasting for complex time series data
- Auto-regressive integrated moving average models with seasonal components
Econometric Models
- Apply economic theory to market forecasting
- Sophisticated economic models that account for market interactions
Expert Opinion – Delphi Method
- Harness collective wisdom of industry experts
- Structured, multi-round expert consultation process
Monte Carlo Simulation
- Quantify uncertainty and probability distributions
- Thousands of simulations with varying input parameters
Research Analysis
Our research framework is built upon the fundamental principle of validating market intelligence from both demand and supply perspectives. This dual-sided approach ensures comprehensive market understanding and reduces the risk of single-source bias.
Demand-Side Analysis: We understand end-user/application behavior, preferences, and market needs along with the penetration of the product for specific application.
Supply-Side Analysis: We estimate overall market revenue, analyze the segmental share along with industry capacity, competitive landscape, and market structure.
Validation & Evaluation
Data triangulation is a validation technique that uses multiple methods, sources, or perspectives to examine the same research question, thereby increasing the credibility and reliability of research findings. In market research, triangulation serves as a quality assurance mechanism that helps identify and minimize bias, validate assumptions, and ensure accuracy in market estimates.
- Data Source Triangulation – Using multiple data sources to examine the same phenomenon
- Methodological Triangulation – Using multiple research methods to study the same research question
- Investigator Triangulation – Using multiple researchers or analysts to examine the same data
- Theoretical Triangulation – Using multiple theoretical perspectives to interpret the same data

Custom Market Research Services
We will customise the research for you, in case the report listed above does not meet your requirements.
Get 10% Free Customisation