Water Testing Equipment Market Size, Share & Trends Analysis Report by Product Type (Online/Continuous Monitoring Systems, Water Testing Kits, Sensors and Probes, Automated Water Analyzers, Sampling Equipment, Consumables and Reagents), Technology, Test Parameter, Portability, End-User Type, Distribution Channel, and Geography (North America, Europe, Asia Pacific, Middle East, Africa, and South America) – Global Industry Data, Trends, and Forecasts, 2026–2035
|
|
|
Segmental Data Insights |
|
|
Demand Trends |
|
|
Competitive Landscape |
|
|
Strategic Development |
|
|
Future Outlook & Opportunities |
|
Water Testing Equipment Market Size, Share, and Growth
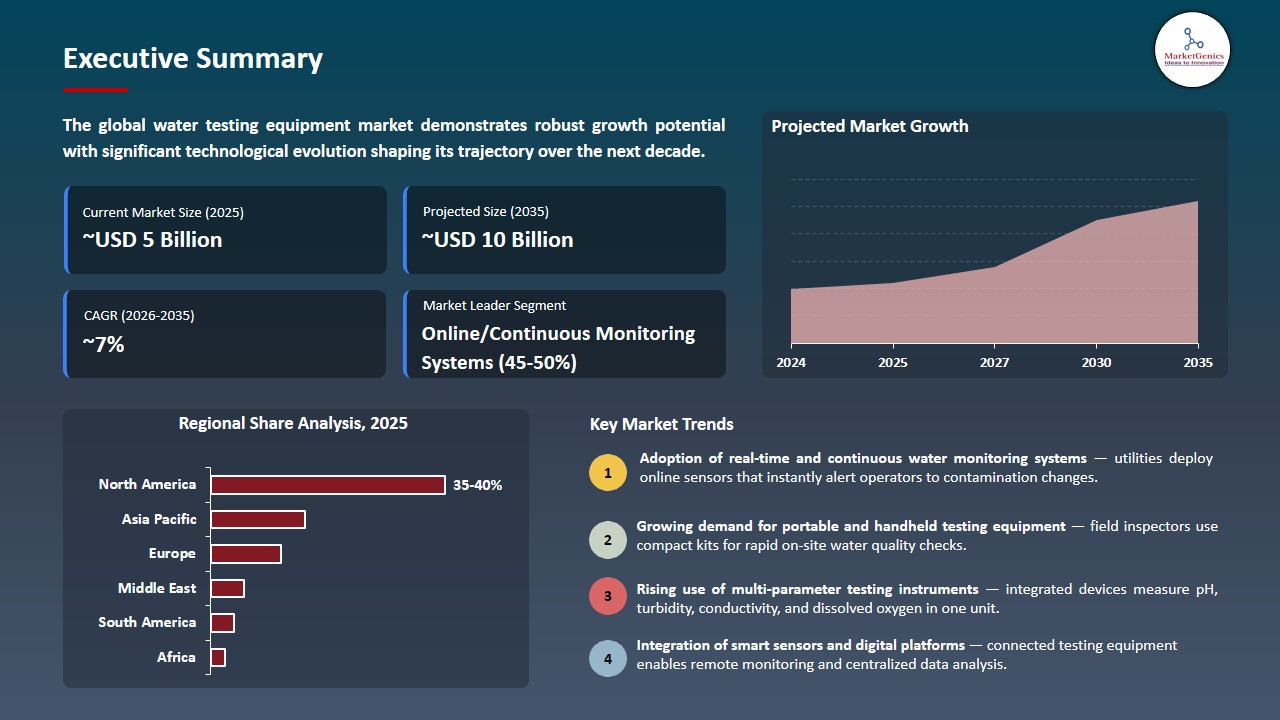
The global water testing equipment market is exhibiting strong growth, with an estimated value of USD 5.2 billion in 2025 and USD 10.4 billion by 2035, achieving a CAGR of 7.1%, during the forecast period. The global water testing equipment is driven by increasing water pollution, stringent environmental regulations, growing awareness of water quality, and rising industrial and municipal monitoring needs.
“We have created a common control platform making it easier for operators to manage treatment for municipal drinking water,” said Global Product Manager Benjamin Schoepfer. “This new digital technology allows for the interaction among multiple sites and has a single interface for future cloud-based solutions.”
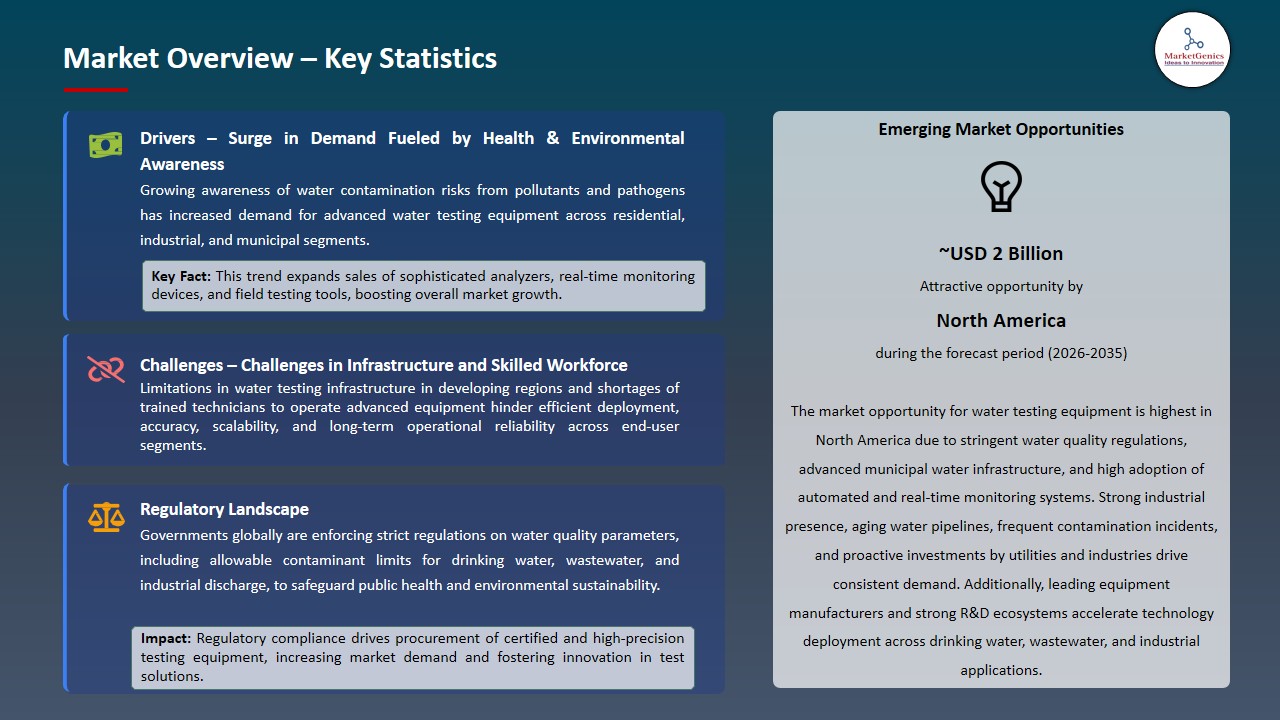
The growth of environmental and health-related laws on the global level is a major contributor to the demand of water-testing equipment since organizations are forced to install quality specialized analyzers to suit the changing regulations. For instance, Thermo Fisher Scientific’s comprehensive water analysis product portfolio to allow customers to easily determine the key parameters of drinking water, wastewater, and industrial discharge (including pH, conductivity, and contaminants) to meet the regulatory requirements. The adoption of advanced water testing solutions in the world is increasing at a rapid rate due to regulatory compliance.
Additionally, rising environmental and health awareness levels and the need to conduct accurate monitoring of the surrounding environment is creating demand in real-time and portable water testing equipment, which should allow industries and municipalities to understand the water quality at the location promptly and safely, facilitate timely decision-making, and help them to comply with safety and environmental regulations. For instance, in January 2025, Endress+Hauser partnered with Horiba to combine portable water-quality sensors with automated process platforms, thus providing an opportunity to perform on-site analytics in the quickest manner and with greater precision in water quality measurements by municipal and industrial users seeking faster, more precise water quality measurements. Implementation of real time and field deployable testing technologies is improving water safety monitoring and improving the speed of regulatory compliance in many parts of the world.
Adjacent opportunities to the global water testing equipment market include wastewater treatment monitoring, industrial process water analysis, environmental monitoring for rivers and lakes, portable field-testing kits, and smart IoT-enabled water quality sensors. The technological synergies and increased regulatory attention in these areas can allow manufacturers to diversify and gain cross-segment demand. The growing into the adjacent markets will improve the revenue streams and adoption of the developed water testing solutions.
Water Testing Equipment Market Dynamics and Trends
Driver: Government Funding for Water Infrastructure and Quality Monitoring Programs
-
The increased pace of government spending on water infrastructure and the water monitoring schemes is amplifying the prospects of the high-performance water testing equipment market. The increase in public health awareness and the need to ensure water systems are environmentally sustainable are driving public agencies to spend considerable money to upgrade and modernize aging water systems, increase the safety of potable water, and broaden continuous monitoring networks.
- For example, in March 2025, Hach has announced the extension of its Smart Water Networks solutions, combining digital monitoring technologies with the traditional analyzers to help the municipal water authorities with proactive water quality management strategies. These all-in-one solutions can be used to provide real-time data gathering, automatic alerts, and simplified reports so that they can comply with regulatory requirements and quick reaction to contamination incidents.
- Governments are also encouraging industry-government collaborations in the deployment of scalable analysis platforms in urban and rural utilities, due to increased public sector procurement of testing systems.
- Government support policies and funding are that way aiding the introduction of the modern testing technologies and increasing water security and public confidence.
Restraint: High Maintenance Costs and Skilled Technician Requirements Limiting Adoption
-
The water testing equipment market is restrained by high maintenance costs and the presence of highly skilled technicians to operate and maintain the complex analytical equipment despite the advanced technological advances that have occurred. The use of sophisticated technology like chromatography, spectrometry, and continuous online analyzers requires the constant calibration of the system, the replacement of the reagents and technical skill, which may overload the financial resources of the operators, particularly when used by small utilities and industrial plants.
- The training needs of lab staff and field technicians only add to this difficulty as the operators need to be skilled in the use of complex software interfaces, quality control measures, and regulatory reporting requirements. The compounding value of long-term service contracts, replacement of parts, and training of technicians may postpone the procurement process or change the demand to less expensive and less apt options.
- High maintenance and operation costs may limit the growth of the market within low end users with limited budgets, inhibiting the general adoption of advanced water testing solutions.
Opportunity: Rising Adoption of IoT‑Connected and Automated Water Testing Platforms
-
The increasing use of internet of things (IoT)-related and automated water testing systems are a major market share growth potential because the utilities, industrial users, and environmental agencies are interested in real-time data and remote monitoring capabilities. Automated analyzers and IoT sensors allow constant monitoring of the water quality without having to conduct regular manual sampling to monitor it, providing the system with greater efficiency and quicker reaction to any cases of contamination.
- For example, in 2025, Thermo Fisher Scientific launched a complete IoT water quality monitoring solution, which combines smart sensors with cloud-based analytics so that the stakeholders can see trends, identify anomalies, and reinstate optimal maintenance schedules. This innovation places manufacturers in a position to satisfy demand of organizations that focus on digital transformation and operational efficiency and, particularly, in smart city and industrial automation projects.
- Predictive maintenance, data analytics integration, and interoperability with larger facility management systems can also be done through IoT connectivity, and this represents a strong value proposition to technology-oriented buyers.
- IoT and automation adoption is expanding the market by enabling more efficient, scalable, and data‑rich water quality monitoring solutions.
Key Trend: Shift Toward Portable, Field‑Deployable Rapid Testing Solutions
-
The water testing equipment market is shifting towards portable, field-deployable solutions to meet user demands for faster and more flexible water quality evaluation instruments. Although traditionally accurate, traditional laboratory-based methods of analysis are tedious and time consuming and necessitate logistics of transporting samples, leading to more interest in handheld and portable analyzers that can test samples on-site.
- For instance, in February 2025, Endress+Hauser increased its portable water quality analyzer product range, which consisted of small-sized instruments with multi-parameter features and user-friendly interfaces which provide real-time analyses in remote and decentralized settings. These handheld products allow water professionals, field staff and environmental inspectors to conduct real-time evaluation of pH and turbidity, and dissolved oxygen, amongst other important parameters, without the limitation of the laboratory.
- The trend confirms the wider industry need of agility, shorter turnaround times, and flexibility of operations found in areas of small towns and cities water supply, industrial process monitoring, and emergency response.
- The move to small scale fast testing is increasing access, speeding up decision-making, making increased utilization of water quality solutions in varied field environments.
Water Testing Equipment Market Analysis and Segmental Data
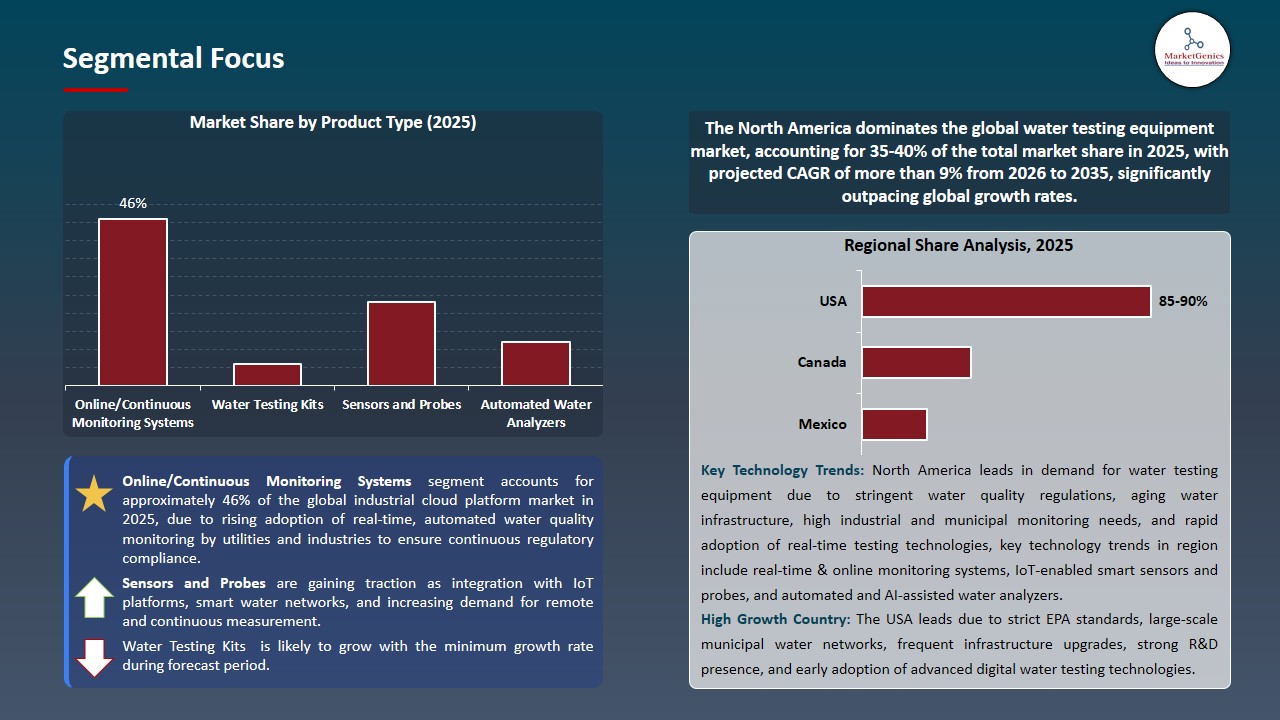
Online/Continuous Monitoring Systems Dominate Global Water Testing Equipment Market
-
The online/continuous monitoring systems segment dominates the global water testing equipment market, due to the necessity of real time information, regulation and optimization of the processes in municipal, industrial and environmental-based use. Monitoring of major parameters including chlorine, ammonia, turbidity, phosphate, and total organic carbon is continuous with these systems thus helping the interested parties to track the whole water cycle between intake and effluent without taking time to sample them manually.
- The main suppliers such as Hach provides a full line of online analyzers that are capable of 24/7 round-the-clock monitoring of water quality and provides highly accurate data, automated notifications, diagnostic and advanced data transfer services to be able to remotely monitor the quality of water.
- The high proliferation of round-the-clock surveillance systems is improving the efficiency and reliability of compliance, resulting in the massive adoption of automated, real-time water quality management systems.
North America Leads Global Water Testing Equipment Market Demand
-
North America leads the water testing equipment market can be attributed to solid regulatory systems, excellent infrastructure, and high levels of using the newer analytical systems. Strict environmental regulations and compliance control measures are forcing utilities, lab and industry plants in the United States and Canada to use advanced drinking water and wastewater as well as environmental monitoring water analysis tools.
- For example, Thermo Fisher Scientific provides an extensive range of water quality analyzers and sensors that meet such severe tasks, which helps maintain regulatory compliance and efficiency in operations of North American consumers.
- Moreover, the adoption rate of water testing equipment is increasing in North America as there is an added addition of sophisticated digital monitoring and related technologies. Online water quality analyzers in real-time, IoT-based sensors and automated data management solutions will enable utilities and other industrial users to monitor the water quality, improve operational efficiency and stay within the limits of high regulatory standards.
- Manufacturers like Hach offer progressive online and continuous water quality monitoring technology that offers real-time parameters of chlorine, turbidity and TOC in municipal and industrial use that suits to the changing monitoring demands and enhances the equipment implementation in the region.
- These drivers enhance the continued demand of advanced water testing solutions that will reinforce the dominance of the North American market.
Water Testing Equipment Market Ecosystem
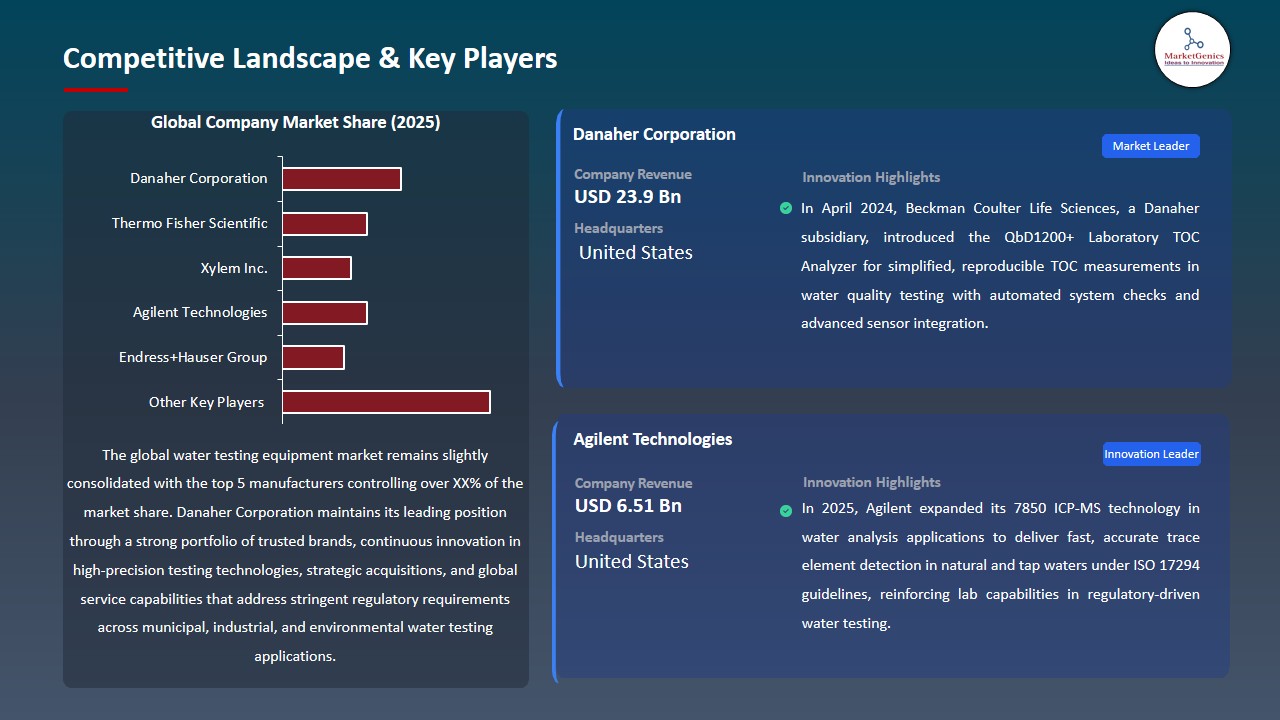
The global water testing equipment market is slightly consolidated, dominated by major players leveraging advanced technologies to maintain market leadership. Companies such as Danaher Corporation, Thermo Fisher Scientific, Xylem Inc., Agilent Technologies, and Endress+Hauser Group hold significant shares, deploying innovative solutions to address growing demands for accurate and efficient water quality monitoring. These leaders specialize in niche and specialized products, such as high-resolution ion chromatography systems, real-time online monitoring systems, and automated analytical systems, which allows in better detecting contaminants and streamlining operations in the municipal, industrial, and environmental sectors.
Government bodies, research institutions, and R&D organizations play a critical role in advancing market technologies. For instance, in August 2024, Xylem Inc., which launched the Rivo I Water Quality Monitoring System in August of 2024, combining real-time monitoring and digital treatment optimization, which can be viewed as an illustration of how institutional and corporate partnership can speed up the pace of innovation and enhance the management of water safety.
The major players are also focusing on the diversification of their products, expansion, and integrated solutions to improve productivity, sustainability, and operational efficiency. Thermo Fisher Scientific’s 2024 launch of the Dionex Inuvion Ion Chromatography System illustrates this trend, offering faster workflows and higher resolution for trace contaminant detection, resulting in more precise and efficient water quality analysis.
These innovations and strategic developments contribute to the growth of markets through better water safety, operational efficiency and regulatory compliance, making leading companies key facilitators of sustainable water management globally.
Recent Development and Strategic Overview:
-
In August 2024, Xylem Inc. introduced the Rivo I Water Quality Monitoring System, designed to help municipal utilities improve water quality management. The system offers real-time monitoring, data-driven insights, and integrated digital treatment optimization, allowing operators to ensure safe, efficient, and compliant water supply while reducing operational costs and enhancing decision-making.
- In April 2024, Thermo Fisher Scientific launched the Thermo Scientific Dionex Inuvion Ion Chromatography System, delivering enhanced resolution and faster analytical workflows to improve trace contaminant detection in environmental water samples, enabling more accurate and efficient water quality assessment for industrial and regulatory purposes.
Report Scope
|
Detail |
|
|
Market Size in 2025 |
USD 5.2 Bn |
|
Market Forecast Value in 2035 |
USD 10.4 Bn |
|
Growth Rate (CAGR) |
7.1% |
|
Forecast Period |
2026 – 2035 |
|
Historical Data Available for |
2021 – 2024 |
|
Market Size Units |
US$ Billion for Value Thousand Units for Volume |
|
Report Format |
Electronic (PDF) + Excel |
|
North America |
Europe |
Asia Pacific |
Middle East |
Africa |
South America |
|
|
|
|
|
|
|
Companies Covered |
|||||
|
|
|
|
|
|
Water Testing Equipment Market Segmentation and Highlights
|
Segment |
Sub-segment |
|
Water Testing Equipment Market, By Product Type |
|
|
Water Testing Equipment Market, By Technology |
|
|
Water Testing Equipment Market, By Test Parameter |
|
|
Water Testing Equipment Market, By Portability |
|
|
Water Testing Equipment Market, By End-User Type |
|
|
Water Testing Equipment Market, By Distribution Channel |
|
Frequently Asked Questions
Table of Contents
- 1. Research Methodology and Assumptions
- 1.1. Definitions
- 1.2. Research Design and Approach
- 1.3. Data Collection Methods
- 1.4. Base Estimates and Calculations
- 1.5. Forecasting Models
- 1.5.1. Key Forecast Factors & Impact Analysis
- 1.6. Secondary Research
- 1.6.1. Open Sources
- 1.6.2. Paid Databases
- 1.6.3. Associations
- 1.7. Primary Research
- 1.7.1. Primary Sources
- 1.7.2. Primary Interviews with Stakeholders across Ecosystem
- 2. Executive Summary
- 2.1. Global Water Testing Equipment Market Outlook
- 2.1.1. Water Testing Equipment Market Size (Volume - Thousand Units and Value - US$ Bn), and Forecasts, 2021-2035
- 2.1.2. Compounded Annual Growth Rate Analysis
- 2.1.3. Growth Opportunity Analysis
- 2.1.4. Segmental Share Analysis
- 2.1.5. Geographical Share Analysis
- 2.2. Market Analysis and Facts
- 2.3. Supply-Demand Analysis
- 2.4. Competitive Benchmarking
- 2.5. Go-to- Market Strategy
- 2.5.1. Customer/ End-use Industry Assessment
- 2.5.2. Growth Opportunity Data, 2026-2035
- 2.5.2.1. Regional Data
- 2.5.2.2. Country Data
- 2.5.2.3. Segmental Data
- 2.5.3. Identification of Potential Market Spaces
- 2.5.4. GAP Analysis
- 2.5.5. Potential Attractive Price Points
- 2.5.6. Prevailing Market Risks & Challenges
- 2.5.7. Preferred Sales & Marketing Strategies
- 2.5.8. Key Recommendations and Analysis
- 2.5.9. A Way Forward
- 2.1. Global Water Testing Equipment Market Outlook
- 3. Industry Data and Premium Insights
- 3.1. Global Industrial Machinery Industry Overview, 2025
- 3.1.1. Industrial Machinery Ecosystem Analysis
- 3.1.2. Key Trends for Industrial Machinery Industry
- 3.1.3. Regional Distribution for Industrial Machinery Industry
- 3.2. Supplier Customer Data
- 3.3. Technology Roadmap and Developments
- 3.4. Trade Analysis
- 3.4.1. Import & Export Analysis, 2025
- 3.4.2. Top Importing Countries
- 3.4.3. Top Exporting Countries
- 3.5. Trump Tariff Impact Analysis
- 3.5.1. Manufacturer
- 3.5.1.1. Based on the component & Raw material
- 3.5.2. Supply Chain
- 3.5.3. End Consumer
- 3.5.1. Manufacturer
- 3.6. Raw Material Analysis
- 3.1. Global Industrial Machinery Industry Overview, 2025
- 4. Market Overview
- 4.1. Market Dynamics
- 4.1.1. Drivers
- 4.1.1.1. Stringent water quality regulations and environmental compliance requirements
- 4.1.1.2. Rising concerns over water contamination and public health safety
- 4.1.1.3. Growing industrialization and urban water infrastructure development
- 4.1.2. Restraints
- 4.1.2.1. High cost of advanced water testing equipment and maintenance
- 4.1.2.2. Limited technical expertise and skilled personnel for equipment operation
- 4.1.1. Drivers
- 4.2. Key Trend Analysis
- 4.3. Regulatory Framework
- 4.3.1. Key Regulations, Norms, and Subsidies, by Key Countries
- 4.3.2. Tariffs and Standards
- 4.3.3. Impact Analysis of Regulations on the Market
- 4.4. Value Chain Analysis
- 4.4.1. Component Suppliers
- 4.4.2. Equipment Manufacturers
- 4.4.3. Distribution & Sales Channels
- 4.4.4. End users
- 4.5. Cost Structure Analysis
- 4.5.1. Parameter’s Share for Cost Associated
- 4.5.2. COGP vs COGS
- 4.5.3. Profit Margin Analysis
- 4.6. Pricing Analysis
- 4.6.1. Regional Pricing Analysis
- 4.6.2. Segmental Pricing Trends
- 4.6.3. Factors Influencing Pricing
- 4.7. Porter’s Five Forces Analysis
- 4.8. PESTEL Analysis
- 4.9. Global Water Testing Equipment Market Demand
- 4.9.1. Historical Market Size – in Volume (Thousand Units) and Value (US$ Bn), 2020-2024
- 4.9.2. Current and Future Market Size – in Volume (Thousand Units) and Value (US$ Bn), 2026–2035
- 4.9.2.1. Y-o-Y Growth Trends
- 4.9.2.2. Absolute $ Opportunity Assessment
- 4.1. Market Dynamics
- 5. Competition Landscape
- 5.1. Competition structure
- 5.1.1. Fragmented v/s consolidated
- 5.2. Company Share Analysis, 2025
- 5.2.1. Global Company Market Share
- 5.2.2. By Region
- 5.2.2.1. North America
- 5.2.2.2. Europe
- 5.2.2.3. Asia Pacific
- 5.2.2.4. Middle East
- 5.2.2.5. Africa
- 5.2.2.6. South America
- 5.3. Product Comparison Matrix
- 5.3.1. Specifications
- 5.3.2. Market Positioning
- 5.3.3. Pricing
- 5.1. Competition structure
- 6. Global Water Testing Equipment Market Analysis, by Product Type
- 6.1. Key Segment Analysis
- 6.2. Water Testing Equipment Market Size (Volume - Thousand Units and Value - US$ Bn), Analysis, and Forecasts, by Product Type, 2021-2035
- 6.2.1. Online/Continuous Monitoring Systems
- 6.2.2. Water Testing Kits
- 6.2.3. Sensors and Probes
- 6.2.4. Automated Water Analyzers
- 6.2.5. Sampling Equipment
- 6.2.6. Consumables and Reagents
- 7. Global Water Testing Equipment Market Analysis, by Technology
- 7.1. Key Segment Analysis
- 7.2. Water Testing Equipment Market Size (Volume - Thousand Units and Value - US$ Bn), Analysis, and Forecasts, by Technology, 2021-2035
- 7.2.1. Chromatography
- 7.2.1.1. Gas Chromatography (GC)
- 7.2.1.2. Liquid Chromatography (LC)
- 7.2.1.3. Ion Chromatography (IC)
- 7.2.2. Spectroscopy
- 7.2.2.1. UV-Visible Spectroscopy
- 7.2.2.2. Infrared Spectroscopy
- 7.2.2.3. Atomic Absorption Spectroscopy
- 7.2.3. Electrochemical Methods
- 7.2.3.1. Potentiometry
- 7.2.3.2. Conductometry
- 7.2.3.3. Voltammetry
- 7.2.4. Immunoassay
- 7.2.5. PCR (Polymerase Chain Reaction)
- 7.2.6. Turbidity Measurement
- 7.2.7. Colorimetry
- 7.2.8. Titration
- 7.2.9. Others
- 7.2.1. Chromatography
- 8. Global Water Testing Equipment Market Analysis, by Test Parameter
- 8.1. Key Segment Analysis
- 8.2. Water Testing Equipment Market Size (Volume - Thousand Units and Value - US$ Bn), Analysis, and Forecasts, by Test Parameter, 2021-2035
- 8.2.1. Physical Parameters
- 8.2.1.1. Temperature
- 8.2.1.2. Turbidity
- 8.2.1.3. Color
- 8.2.1.4. Odor
- 8.2.1.5. Total Suspended Solids (TSS)
- 8.2.1.6. Total Dissolved Solids (TDS)
- 8.2.1.7. Others
- 8.2.2. Chemical Parameters
- 8.2.2.1. pH
- 8.2.2.2. Dissolved Oxygen (DO)
- 8.2.2.3. Conductivity
- 8.2.2.4. Biochemical Oxygen Demand (BOD)
- 8.2.2.5. Chemical Oxygen Demand (COD)
- 8.2.2.6. Total Organic Carbon (TOC)
- 8.2.2.7. Hardness
- 8.2.2.8. Alkalinity
- 8.2.2.9. Chlorine (Free and Total)
- 8.2.2.10. Ammonia
- 8.2.2.11. Nitrate/Nitrite
- 8.2.2.12. Phosphate
- 8.2.2.13. Heavy Metals
- 8.2.2.14. Pesticides
- 8.2.2.15. Herbicides
- 8.2.2.16. Others
- 8.2.3. Microbiological Parameters
- 8.2.3.1. Total Coliform
- 8.2.3.2. E. coli
- 8.2.3.3. Legionella
- 8.2.3.4. Cryptosporidium
- 8.2.3.5. Giardia
- 8.2.3.6. Heterotrophic Plate Count
- 8.2.3.7. Others
- 8.2.1. Physical Parameters
- 9. Global Water Testing Equipment Market Analysis, by Portability
- 9.1. Key Segment Analysis
- 9.2. Water Testing Equipment Market Size (Volume - Thousand Units and Value - US$ Bn), Analysis, and Forecasts, by Portability, 2021-2035
- 9.2.1. Portable/Field Equipment
- 9.2.2. Laboratory/Stationary Equipment
- 9.2.3. Online/In-line Equipment
- 10. Global Water Testing Equipment Market Analysis, by End-User Type
- 10.1. Key Segment Analysis
- 10.2. Water Testing Equipment Market Size (Volume - Thousand Units and Value - US$ Bn), Analysis, and Forecasts, by End-User Type, 2021-2035
- 10.2.1. Laboratories
- 10.2.1.1. Government Laboratories
- 10.2.1.2. Private Laboratories
- 10.2.1.3. Research Laboratories
- 10.2.2. Industrial Facilities
- 10.2.3. Municipalities
- 10.2.4. Field Testing Teams
- 10.2.5. Educational Institutions
- 10.2.6. Environmental Agencies
- 10.2.1. Laboratories
- 11. Global Water Testing Equipment Market Analysis, by Distribution Channel
- 11.1. Key Segment Analysis
- 11.2. Water Testing Equipment Market Size (Volume - Thousand Units and Value - US$ Bn), Analysis, and Forecasts, by Distribution Channel, 2021-2035
- 11.2.1. Direct Sales
- 11.2.2. Distributors
- 11.2.3. Online Sales
- 12. Global Water Testing Equipment Market Analysis, by Region
- 12.1. Key Findings
- 12.2. Water Testing Equipment Market Size (Volume - Thousand Units and Value - US$ Bn), Analysis, and Forecasts, by Region, 2021-2035
- 12.2.1. North America
- 12.2.2. Europe
- 12.2.3. Asia Pacific
- 12.2.4. Middle East
- 12.2.5. Africa
- 12.2.6. South America
- 13. North America Water Testing Equipment Market Analysis
- 13.1. Key Segment Analysis
- 13.2. Regional Snapshot
- 13.3. North America Water Testing Equipment Market Size (Volume - Thousand Units and Value - US$ Bn), Analysis, and Forecasts, 2021-2035
- 13.3.1. Product Type
- 13.3.2. Technology
- 13.3.3. Test Parameter
- 13.3.4. Portability
- 13.3.5. End-User Type
- 13.3.6. Distribution Channel
- 13.3.7. Country
- 13.3.7.1. USA
- 13.3.7.2. Canada
- 13.3.7.3. Mexico
- 13.4. USA Water Testing Equipment Market
- 13.4.1. Country Segmental Analysis
- 13.4.2. Product Type
- 13.4.3. Technology
- 13.4.4. Test Parameter
- 13.4.5. Portability
- 13.4.6. End-User Type
- 13.4.7. Distribution Channel
- 13.5. Canada Water Testing Equipment Market
- 13.5.1. Country Segmental Analysis
- 13.5.2. Product Type
- 13.5.3. Technology
- 13.5.4. Test Parameter
- 13.5.5. Portability
- 13.5.6. End-User Type
- 13.5.7. Distribution Channel
- 13.6. Mexico Water Testing Equipment Market
- 13.6.1. Country Segmental Analysis
- 13.6.2. Product Type
- 13.6.3. Technology
- 13.6.4. Test Parameter
- 13.6.5. Portability
- 13.6.6. End-User Type
- 13.6.7. Distribution Channel
- 14. Europe Water Testing Equipment Market Analysis
- 14.1. Key Segment Analysis
- 14.2. Regional Snapshot
- 14.3. Europe Water Testing Equipment Market Size (Volume - Thousand Units and Value - US$ Bn), Analysis, and Forecasts, 2021-2035
- 14.3.1. Product Type
- 14.3.2. Technology
- 14.3.3. Test Parameter
- 14.3.4. Portability
- 14.3.5. End-User Type
- 14.3.6. Distribution Channel
- 14.3.7. Country
- 14.3.7.1. Germany
- 14.3.7.2. United Kingdom
- 14.3.7.3. France
- 14.3.7.4. Italy
- 14.3.7.5. Spain
- 14.3.7.6. Netherlands
- 14.3.7.7. Nordic Countries
- 14.3.7.8. Poland
- 14.3.7.9. Russia & CIS
- 14.3.7.10. Rest of Europe
- 14.4. Germany Water Testing Equipment Market
- 14.4.1. Country Segmental Analysis
- 14.4.2. Product Type
- 14.4.3. Technology
- 14.4.4. Test Parameter
- 14.4.5. Portability
- 14.4.6. End-User Type
- 14.4.7. Distribution Channel
- 14.5. United Kingdom Water Testing Equipment Market
- 14.5.1. Country Segmental Analysis
- 14.5.2. Product Type
- 14.5.3. Technology
- 14.5.4. Test Parameter
- 14.5.5. Portability
- 14.5.6. End-User Type
- 14.5.7. Distribution Channel
- 14.6. France Water Testing Equipment Market
- 14.6.1. Country Segmental Analysis
- 14.6.2. Product Type
- 14.6.3. Technology
- 14.6.4. Test Parameter
- 14.6.5. Portability
- 14.6.6. End-User Type
- 14.6.7. Distribution Channel
- 14.7. Italy Water Testing Equipment Market
- 14.7.1. Country Segmental Analysis
- 14.7.2. Product Type
- 14.7.3. Technology
- 14.7.4. Test Parameter
- 14.7.5. Portability
- 14.7.6. End-User Type
- 14.7.7. Distribution Channel
- 14.8. Spain Water Testing Equipment Market
- 14.8.1. Country Segmental Analysis
- 14.8.2. Product Type
- 14.8.3. Technology
- 14.8.4. Test Parameter
- 14.8.5. Portability
- 14.8.6. End-User Type
- 14.8.7. Distribution Channel
- 14.9. Netherlands Water Testing Equipment Market
- 14.9.1. Country Segmental Analysis
- 14.9.2. Product Type
- 14.9.3. Technology
- 14.9.4. Test Parameter
- 14.9.5. Portability
- 14.9.6. End-User Type
- 14.9.7. Distribution Channel
- 14.10. Nordic Countries Water Testing Equipment Market
- 14.10.1. Country Segmental Analysis
- 14.10.2. Product Type
- 14.10.3. Technology
- 14.10.4. Test Parameter
- 14.10.5. Portability
- 14.10.6. End-User Type
- 14.10.7. Distribution Channel
- 14.11. Poland Water Testing Equipment Market
- 14.11.1. Country Segmental Analysis
- 14.11.2. Product Type
- 14.11.3. Technology
- 14.11.4. Test Parameter
- 14.11.5. Portability
- 14.11.6. End-User Type
- 14.11.7. Distribution Channel
- 14.12. Russia & CIS Water Testing Equipment Market
- 14.12.1. Country Segmental Analysis
- 14.12.2. Product Type
- 14.12.3. Technology
- 14.12.4. Test Parameter
- 14.12.5. Portability
- 14.12.6. End-User Type
- 14.12.7. Distribution Channel
- 14.13. Rest of Europe Water Testing Equipment Market
- 14.13.1. Country Segmental Analysis
- 14.13.2. Product Type
- 14.13.3. Technology
- 14.13.4. Test Parameter
- 14.13.5. Portability
- 14.13.6. End-User Type
- 14.13.7. Distribution Channel
- 15. Asia Pacific Water Testing Equipment Market Analysis
- 15.1. Key Segment Analysis
- 15.2. Regional Snapshot
- 15.3. Asia Pacific Water Testing Equipment Market Size (Volume - Thousand Units and Value - US$ Bn), Analysis, and Forecasts, 2021-2035
- 15.3.1. Product Type
- 15.3.2. Technology
- 15.3.3. Test Parameter
- 15.3.4. Portability
- 15.3.5. End-User Type
- 15.3.6. Distribution Channel
- 15.3.7. Country
- 15.3.7.1. China
- 15.3.7.2. India
- 15.3.7.3. Japan
- 15.3.7.4. South Korea
- 15.3.7.5. Australia and New Zealand
- 15.3.7.6. Indonesia
- 15.3.7.7. Malaysia
- 15.3.7.8. Thailand
- 15.3.7.9. Vietnam
- 15.3.7.10. Rest of Asia Pacific
- 15.4. China Water Testing Equipment Market
- 15.4.1. Country Segmental Analysis
- 15.4.2. Product Type
- 15.4.3. Technology
- 15.4.4. Test Parameter
- 15.4.5. Portability
- 15.4.6. End-User Type
- 15.4.7. Distribution Channel
- 15.5. India Water Testing Equipment Market
- 15.5.1. Country Segmental Analysis
- 15.5.2. Product Type
- 15.5.3. Technology
- 15.5.4. Test Parameter
- 15.5.5. Portability
- 15.5.6. End-User Type
- 15.5.7. Distribution Channel
- 15.6. Japan Water Testing Equipment Market
- 15.6.1. Country Segmental Analysis
- 15.6.2. Product Type
- 15.6.3. Technology
- 15.6.4. Test Parameter
- 15.6.5. Portability
- 15.6.6. End-User Type
- 15.6.7. Distribution Channel
- 15.7. South Korea Water Testing Equipment Market
- 15.7.1. Country Segmental Analysis
- 15.7.2. Product Type
- 15.7.3. Technology
- 15.7.4. Test Parameter
- 15.7.5. Portability
- 15.7.6. End-User Type
- 15.7.7. Distribution Channel
- 15.8. Australia and New Zealand Water Testing Equipment Market
- 15.8.1. Country Segmental Analysis
- 15.8.2. Product Type
- 15.8.3. Technology
- 15.8.4. Test Parameter
- 15.8.5. Portability
- 15.8.6. End-User Type
- 15.8.7. Distribution Channel
- 15.9. Indonesia Water Testing Equipment Market
- 15.9.1. Country Segmental Analysis
- 15.9.2. Product Type
- 15.9.3. Technology
- 15.9.4. Test Parameter
- 15.9.5. Portability
- 15.9.6. End-User Type
- 15.9.7. Distribution Channel
- 15.10. Malaysia Water Testing Equipment Market
- 15.10.1. Country Segmental Analysis
- 15.10.2. Product Type
- 15.10.3. Technology
- 15.10.4. Test Parameter
- 15.10.5. Portability
- 15.10.6. End-User Type
- 15.10.7. Distribution Channel
- 15.11. Thailand Water Testing Equipment Market
- 15.11.1. Country Segmental Analysis
- 15.11.2. Product Type
- 15.11.3. Technology
- 15.11.4. Test Parameter
- 15.11.5. Portability
- 15.11.6. End-User Type
- 15.11.7. Distribution Channel
- 15.12. Vietnam Water Testing Equipment Market
- 15.12.1. Country Segmental Analysis
- 15.12.2. Product Type
- 15.12.3. Technology
- 15.12.4. Test Parameter
- 15.12.5. Portability
- 15.12.6. End-User Type
- 15.12.7. Distribution Channel
- 15.13. Rest of Asia Pacific Water Testing Equipment Market
- 15.13.1. Country Segmental Analysis
- 15.13.2. Product Type
- 15.13.3. Technology
- 15.13.4. Test Parameter
- 15.13.5. Portability
- 15.13.6. End-User Type
- 15.13.7. Distribution Channel
- 16. Middle East Water Testing Equipment Market Analysis
- 16.1. Key Segment Analysis
- 16.2. Regional Snapshot
- 16.3. Middle East Water Testing Equipment Market Size (Volume - Thousand Units and Value - US$ Bn), Analysis, and Forecasts, 2021-2035
- 16.3.1. Product Type
- 16.3.2. Technology
- 16.3.3. Test Parameter
- 16.3.4. Portability
- 16.3.5. End-User Type
- 16.3.6. Distribution Channel
- 16.3.7. Country
- 16.3.7.1. Turkey
- 16.3.7.2. UAE
- 16.3.7.3. Saudi Arabia
- 16.3.7.4. Israel
- 16.3.7.5. Rest of Middle East
- 16.4. Turkey Water Testing Equipment Market
- 16.4.1. Country Segmental Analysis
- 16.4.2. Product Type
- 16.4.3. Technology
- 16.4.4. Test Parameter
- 16.4.5. Portability
- 16.4.6. End-User Type
- 16.4.7. Distribution Channel
- 16.5. UAE Water Testing Equipment Market
- 16.5.1. Country Segmental Analysis
- 16.5.2. Product Type
- 16.5.3. Technology
- 16.5.4. Test Parameter
- 16.5.5. Portability
- 16.5.6. End-User Type
- 16.5.7. Distribution Channel
- 16.6. Saudi Arabia Water Testing Equipment Market
- 16.6.1. Country Segmental Analysis
- 16.6.2. Product Type
- 16.6.3. Technology
- 16.6.4. Test Parameter
- 16.6.5. Portability
- 16.6.6. End-User Type
- 16.6.7. Distribution Channel
- 16.7. Israel Water Testing Equipment Market
- 16.7.1. Country Segmental Analysis
- 16.7.2. Product Type
- 16.7.3. Technology
- 16.7.4. Test Parameter
- 16.7.5. Portability
- 16.7.6. End-User Type
- 16.7.7. Distribution Channel
- 16.8. Rest of Middle East Water Testing Equipment Market
- 16.8.1. Country Segmental Analysis
- 16.8.2. Product Type
- 16.8.3. Technology
- 16.8.4. Test Parameter
- 16.8.5. Portability
- 16.8.6. End-User Type
- 16.8.7. Distribution Channel
- 17. Africa Water Testing Equipment Market Analysis
- 17.1. Key Segment Analysis
- 17.2. Regional Snapshot
- 17.3. Africa Water Testing Equipment Market Size (Volume - Thousand Units and Value - US$ Bn), Analysis, and Forecasts, 2021-2035
- 17.3.1. Product Type
- 17.3.2. Technology
- 17.3.3. Test Parameter
- 17.3.4. Portability
- 17.3.5. End-User Type
- 17.3.6. Distribution Channel
- 17.3.7. Country
- 17.3.7.1. South Africa
- 17.3.7.2. Egypt
- 17.3.7.3. Nigeria
- 17.3.7.4. Algeria
- 17.3.7.5. Rest of Africa
- 17.4. South Africa Water Testing Equipment Market
- 17.4.1. Country Segmental Analysis
- 17.4.2. Product Type
- 17.4.3. Technology
- 17.4.4. Test Parameter
- 17.4.5. Portability
- 17.4.6. End-User Type
- 17.4.7. Distribution Channel
- 17.5. Egypt Water Testing Equipment Market
- 17.5.1. Country Segmental Analysis
- 17.5.2. Product Type
- 17.5.3. Technology
- 17.5.4. Test Parameter
- 17.5.5. Portability
- 17.5.6. End-User Type
- 17.5.7. Distribution Channel
- 17.6. Nigeria Water Testing Equipment Market
- 17.6.1. Country Segmental Analysis
- 17.6.2. Product Type
- 17.6.3. Technology
- 17.6.4. Test Parameter
- 17.6.5. Portability
- 17.6.6. End-User Type
- 17.6.7. Distribution Channel
- 17.7. Algeria Water Testing Equipment Market
- 17.7.1. Country Segmental Analysis
- 17.7.2. Product Type
- 17.7.3. Technology
- 17.7.4. Test Parameter
- 17.7.5. Portability
- 17.7.6. End-User Type
- 17.7.7. Distribution Channel
- 17.8. Rest of Africa Water Testing Equipment Market
- 17.8.1. Country Segmental Analysis
- 17.8.2. Product Type
- 17.8.3. Technology
- 17.8.4. Test Parameter
- 17.8.5. Portability
- 17.8.6. End-User Type
- 17.8.7. Distribution Channel
- 18. South America Water Testing Equipment Market Analysis
- 18.1. Key Segment Analysis
- 18.2. Regional Snapshot
- 18.3. South America Water Testing Equipment Market Size (Volume - Thousand Units and Value - US$ Bn), Analysis, and Forecasts, 2021-2035
- 18.3.1. Lifting Capacity
- 18.3.2. Product Type
- 18.3.3. Technology
- 18.3.4. Test Parameter
- 18.3.5. Portability
- 18.3.6. End-User Type
- 18.3.7. Distribution Channel
- 18.3.8. Country
- 18.3.8.1. Brazil
- 18.3.8.2. Argentina
- 18.3.8.3. Rest of South America
- 18.4. Brazil Water Testing Equipment Market
- 18.4.1. Country Segmental Analysis
- 18.4.2. Product Type
- 18.4.3. Technology
- 18.4.4. Test Parameter
- 18.4.5. Portability
- 18.4.6. End-User Type
- 18.4.7. Distribution Channel
- 18.5. Argentina Water Testing Equipment Market
- 18.5.1. Country Segmental Analysis
- 18.5.2. Product Type
- 18.5.3. Technology
- 18.5.4. Test Parameter
- 18.5.5. Portability
- 18.5.6. End-User Type
- 18.5.7. Distribution Channel
- 18.6. Rest of South America Water Testing Equipment Market
- 18.6.1. Country Segmental Analysis
- 18.6.2. Product Type
- 18.6.3. Technology
- 18.6.4. Test Parameter
- 18.6.5. Portability
- 18.6.6. End-User Type
- 18.6.7. Distribution Channel
- 19. Key Players/ Company Profile
- 19.1. ABB Ltd.
- 19.1.1. Company Details/ Overview
- 19.1.2. Company Financials
- 19.1.3. Key Customers and Competitors
- 19.1.4. Business/ Industry Portfolio
- 19.1.5. Product Portfolio/ Specification Details
- 19.1.6. Pricing Data
- 19.1.7. Strategic Overview
- 19.1.8. Recent Developments
- 19.2. Agilent Technologies
- 19.3. Analytik Jena AG
- 19.4. Danaher Corporation (Hach)
- 19.5. Emerson Electric Co.
- 19.6. Endress+Hauser Group
- 19.7. Eurofins Scientific
- 19.8. Hanna Instruments
- 19.9. Honeywell International Inc.
- 19.10. Horiba Ltd.
- 19.11. Lamotte Company
- 19.12. Merck KGaA
- 19.13. Mettler-Toledo International
- 19.14. Palintest (Halma plc)
- 19.15. PerkinElmer Inc.
- 19.16. Shimadzu Corporation
- 19.17. Thermo Fisher Scientific
- 19.18. Tintometer GmbH (Lovibond)
- 19.19. Xylem Inc.
- 19.20. Yokogawa Electric Corporation
- 19.21. Teledyne Technologies
- 19.22. Other Key Players
- 19.1. ABB Ltd.
Note* - This is just tentative list of players. While providing the report, we will cover more number of players based on their revenue and share for each geography
Research Design
Our research design integrates both demand-side and supply-side analysis through a balanced combination of primary and secondary research methodologies. By utilizing both bottom-up and top-down approaches alongside rigorous data triangulation methods, we deliver robust market intelligence that supports strategic decision-making.
MarketGenics' comprehensive research design framework ensures the delivery of accurate, reliable, and actionable market intelligence. Through the integration of multiple research approaches, rigorous validation processes, and expert analysis, we provide our clients with the insights needed to make informed strategic decisions and capitalize on market opportunities.

MarketGenics leverages a dedicated industry panel of experts and a comprehensive suite of paid databases to effectively collect, consolidate, and analyze market intelligence.
Our approach has consistently proven to be reliable and effective in generating accurate market insights, identifying key industry trends, and uncovering emerging business opportunities.
Through both primary and secondary research, we capture and analyze critical company-level data such as manufacturing footprints, including technical centers, R&D facilities, sales offices, and headquarters.
Our expert panel further enhances our ability to estimate market size for specific brands based on validated field-level intelligence.
Our data mining techniques incorporate both parametric and non-parametric methods, allowing for structured data collection, sorting, processing, and cleaning.
Demand projections are derived from large-scale data sets analyzed through proprietary algorithms, culminating in robust and reliable market sizing.
Research Approach
The bottom-up approach builds market estimates by starting with the smallest addressable market units and systematically aggregating them to create comprehensive market size projections.
This method begins with specific, granular data points and builds upward to create the complete market landscape.
Customer Analysis → Segmental Analysis → Geographical Analysis
The top-down approach starts with the broadest possible market data and systematically narrows it down through a series of filters and assumptions to arrive at specific market segments or opportunities.
This method begins with the big picture and works downward to increasingly specific market slices.
TAM → SAM → SOM


Research Methods
Desk / Secondary Research
While analysing the market, we extensively study secondary sources, directories, and databases to identify and collect information useful for this technical, market-oriented, and commercial report. Secondary sources that we utilize are not only the public sources, but it is a combination of Open Source, Associations, Paid Databases, MG Repository & Knowledgebase, and others.
- Company websites, annual reports, financial reports, broker reports, and investor presentations
- National government documents, statistical databases and reports
- News articles, press releases and web-casts specific to the companies operating in the market, Magazines, reports, and others
- We gather information from commercial data sources for deriving company specific data such as segmental revenue, share for geography, product revenue, and others
- Internal and external proprietary databases (industry-specific), relevant patent, and regulatory databases
- Governing Bodies, Government Organizations
- Relevant Authorities, Country-specific Associations for Industries
We also employ the model mapping approach to estimate the product level market data through the players' product portfolio
Primary Research
Primary research/ interviews is vital in analyzing the market. Most of the cases involves paid primary interviews. Primary sources include primary interviews through e-mail interactions, telephonic interviews, surveys as well as face-to-face interviews with the different stakeholders across the value chain including several industry experts.
| Type of Respondents | Number of Primaries |
|---|---|
| Tier 2/3 Suppliers | ~20 |
| Tier 1 Suppliers | ~25 |
| End-users | ~25 |
| Industry Expert/ Panel/ Consultant | ~30 |
| Total | ~100 |
MG Knowledgebase
• Repository of industry blog, newsletter and case studies
• Online platform covering detailed market reports, and company profiles
Forecasting Factors and Models
Forecasting Factors
- Historical Trends – Past market patterns, cycles, and major events that shaped how markets behave over time. Understanding past trends helps predict future behavior.
- Industry Factors – Specific characteristics of the industry like structure, regulations, and innovation cycles that affect market dynamics.
- Macroeconomic Factors – Economic conditions like GDP growth, inflation, and employment rates that affect how much money people have to spend.
- Demographic Factors – Population characteristics like age, income, and location that determine who can buy your product.
- Technology Factors – How quickly people adopt new technology and how much technology infrastructure exists.
- Regulatory Factors – Government rules, laws, and policies that can help or restrict market growth.
- Competitive Factors – Analyzing competition structure such as degree of competition and bargaining power of buyers and suppliers.
Forecasting Models / Techniques
Multiple Regression Analysis
- Identify and quantify factors that drive market changes
- Statistical modeling to establish relationships between market drivers and outcomes
Time Series Analysis – Seasonal Patterns
- Understand regular cyclical patterns in market demand
- Advanced statistical techniques to separate trend, seasonal, and irregular components
Time Series Analysis – Trend Analysis
- Identify underlying market growth patterns and momentum
- Statistical analysis of historical data to project future trends
Expert Opinion – Expert Interviews
- Gather deep industry insights and contextual understanding
- In-depth interviews with key industry stakeholders
Multi-Scenario Development
- Prepare for uncertainty by modeling different possible futures
- Creating optimistic, pessimistic, and most likely scenarios
Time Series Analysis – Moving Averages
- Sophisticated forecasting for complex time series data
- Auto-regressive integrated moving average models with seasonal components
Econometric Models
- Apply economic theory to market forecasting
- Sophisticated economic models that account for market interactions
Expert Opinion – Delphi Method
- Harness collective wisdom of industry experts
- Structured, multi-round expert consultation process
Monte Carlo Simulation
- Quantify uncertainty and probability distributions
- Thousands of simulations with varying input parameters
Research Analysis
Our research framework is built upon the fundamental principle of validating market intelligence from both demand and supply perspectives. This dual-sided approach ensures comprehensive market understanding and reduces the risk of single-source bias.
Demand-Side Analysis: We understand end-user/application behavior, preferences, and market needs along with the penetration of the product for specific application.
Supply-Side Analysis: We estimate overall market revenue, analyze the segmental share along with industry capacity, competitive landscape, and market structure.
Validation & Evaluation
Data triangulation is a validation technique that uses multiple methods, sources, or perspectives to examine the same research question, thereby increasing the credibility and reliability of research findings. In market research, triangulation serves as a quality assurance mechanism that helps identify and minimize bias, validate assumptions, and ensure accuracy in market estimates.
- Data Source Triangulation – Using multiple data sources to examine the same phenomenon
- Methodological Triangulation – Using multiple research methods to study the same research question
- Investigator Triangulation – Using multiple researchers or analysts to examine the same data
- Theoretical Triangulation – Using multiple theoretical perspectives to interpret the same data

Custom Market Research Services
We will customise the research for you, in case the report listed above does not meet your requirements.
Get 10% Free Customisation