Wire and Cable Market Size, Share & Trends Analysis Report by Product Type (Power Cables, Control Cables, Communication Cables, Instrumentation Cables, Special Cables, Building Wires, Others), Voltage Rating, Conductor Material, Insulation Material, Installation Type, Number of Cores, Current Type, Cable Size/Cross-Section, Shielding Type, End-Use Industry, and Geography (North America, Europe, Asia Pacific, Middle East, Africa, and South America) – Global Industry Data, Trends, and Forecasts, 2026–2035
|
|
|
Segmental Data Insights |
|
|
Demand Trends |
|
|
Competitive Landscape |
|
|
Strategic Development |
|
|
Future Outlook & Opportunities |
|
Wire and Cable Market Size, Share, and Growth
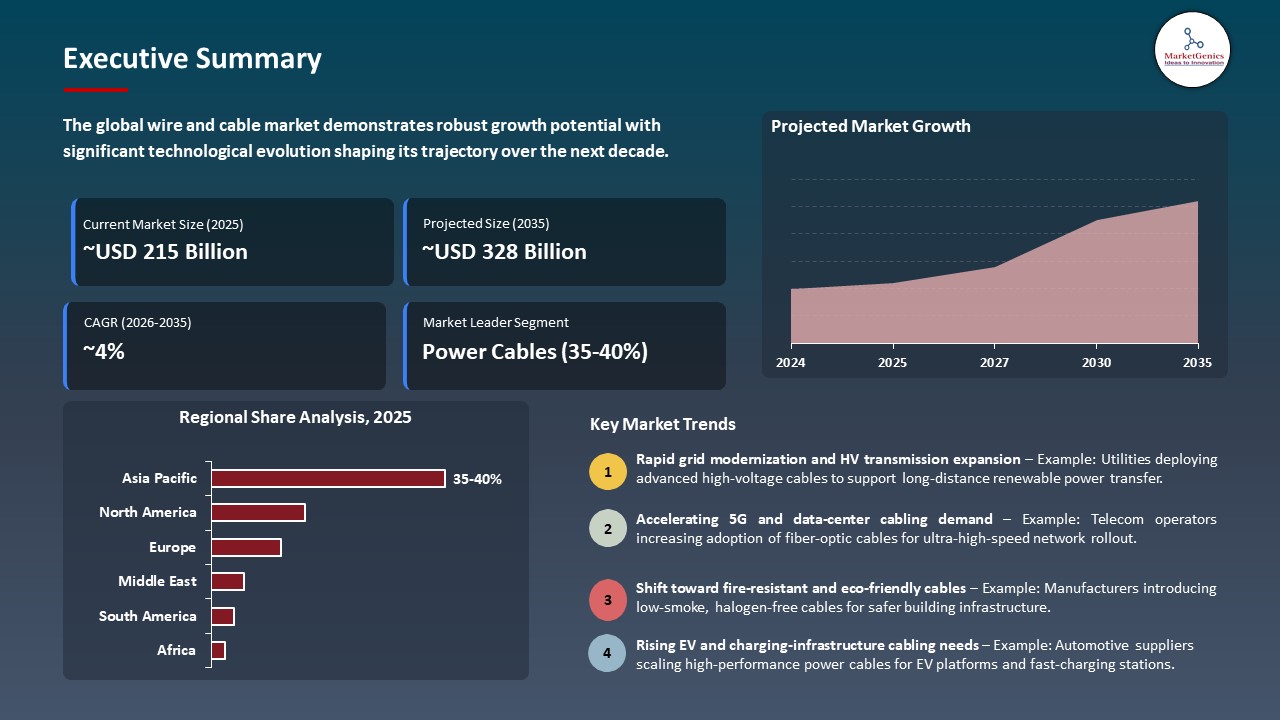
The global wire and cable market is experiencing robust growth, with its estimated value of USD 215.3 billion in the year 2025 and ~USD 328 billion by the period 2035, registering a CAGR of 4.3%, during the forecast period. The global wire and cable market driven by rapid industrialization, expanding infrastructure projects, and growing adoption of renewable energy systems. Increasing digitalization, smart grid deployments, and rising demand for high-speed data transmission further fuel market growth globally.
Rich Stinson, Southwire’s President and CEO, said, “The re-electrification of America will bring unprecedented opportunity for the electrical industry, and we stand ready to meet the needs that lie ahead for the markets we serve. We continue to purposely invest in modernization - across our facilities, equipment, systems, technologies and more - allowing us to best serve our customers and help power a more sustainable future.”
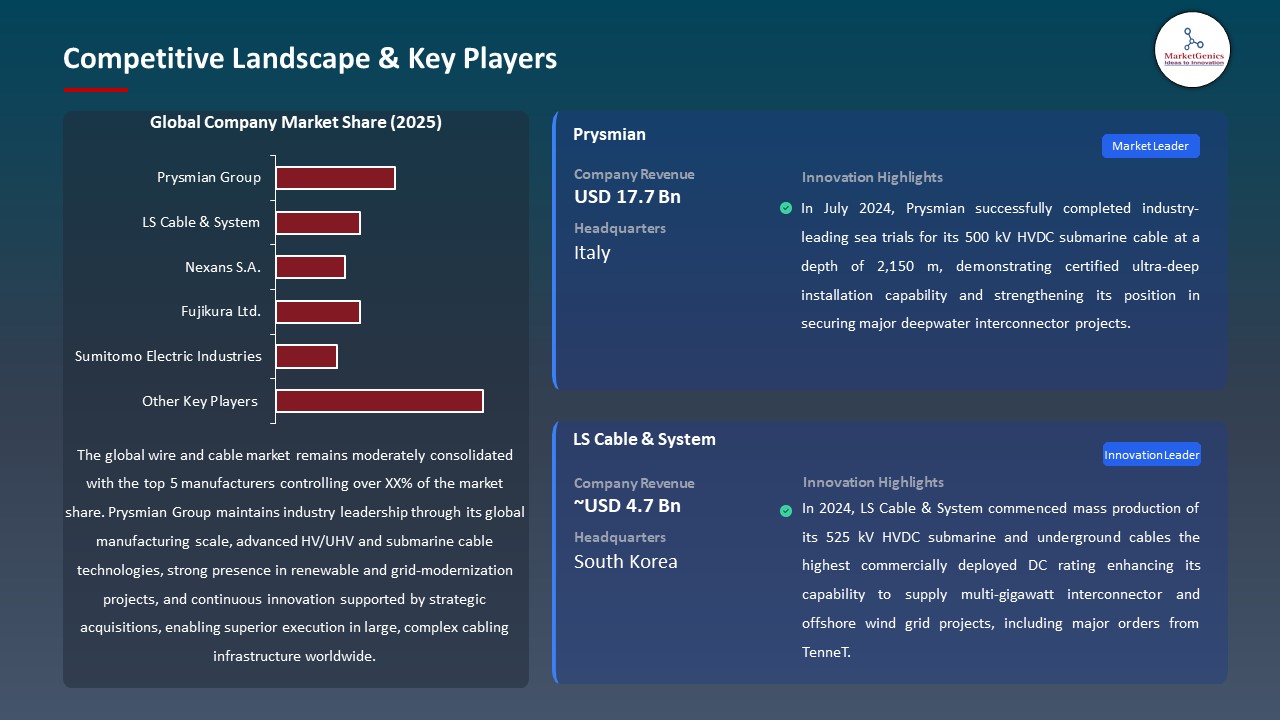
The wire and cable market, significantly driven by the increase in investments in power transmission and distribution systems and telecommunications networks, demand high performance cables to provide reliable delivery of electricity and high-speed data transfer. For instance, in March 2025, Prysmian Group purchased Channel Commercial Corp at a price of US$ 1.15 billion, which added to its capability to meet data center, 5G and energy project projects in North America and Europe. This enhances market growth and competition, particularly with major players in the world, and speeds up technology usage and economies of scale.
Additionally, the wire and cable market, driven by the high rate of electrification and development of infrastructure in the emerging economies, stipulates the need of residential, commercial, and industrial solutions of wiring. For instance, in October 2025, India’s R R Kabel reported over 22 % revenue growth and more than doubled profits in its wires and cables segment, driven by strong infrastructure and real estate demand. This trend increases the revenues of the market and stimulates the expansion of the capacity, but puts the players at risk of fluctuations in the prices of raw materials and competition.
The global wire and cable market present adjacent opportunities in electric vehicle (EV) charging infrastructure, renewable energy projects, smart grid systems, data center connectivity, and industrial automation cabling. These industries fuel the need to have specialized and high-performance cables and a combination of integrated products. The growth to such adjacent markets increases revenue diversification and drives technological advancement.
Wire and Cable Market Dynamics and Trends
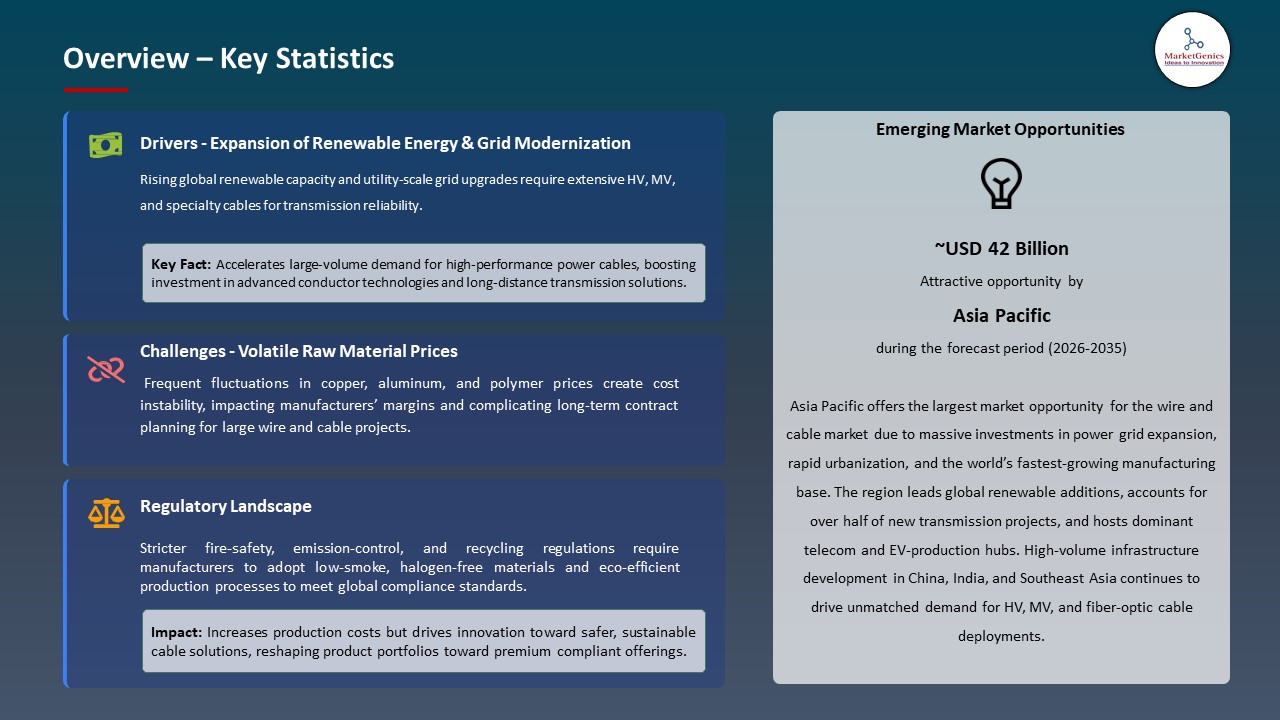
Driver: Government Infrastructure and Energy Modernization Stimulus Policies Propel Demand for Wire & Cable Solutions
-
Government infrastructure and energy modernization projects are increasing global wire and cable demand through funding power, telecom and urban development, such as grid upgrades, broadband expansion and renewable integration which need high-performance cables to ensure reliable transmission of power and data.
- These projects pose significant demand on the high cabling solutions that would make the system more resilient and efficient. High-performance wires and cables are needed to accommodate the contemporary infrastructure needs such as smart grids, data centers, and renewable energy integration, which are very essential to sustainable development and urbanization.
- For example, in 2025, the U.S. federal Infrastructure Investment and Jobs Act provided several billion dollars of grid modernization and national broadband coverage. This investment forced the major manufacturers such as Prysmian Group and Nexans to increase their production capacities and invest in the next-generation cable technologies that fit the large-scale projects.
- These policies also stimulate demand in the long terms, innovation in materials and intelligent, market stability, private investment and expansion in utility, industrial and telecom cable markets monitoring.
Restraint: Raw Material Price Volatility and Supply Chain Cost Pressures Hamper Profitability
-
The global wire and cable market face experiences a huge challenge through the fluctuation of prices of raw materials and the escalating costs of supply chains that can directly affect the profitability. Such critical raw materials as copper and aluminum can be subject to price fluctuations influenced by the global demand, production limitations, and political influences.
- For instance, in 2025, the rising copper prices highly amplified production expenses among the major producers like Southwire Company and Polycab India. This compelled firms to change pricing strategies, to manage their working budgets keenly and pursue cost efficiency to remain competitive in the market.
- Additionally, the problems with logistics, a slow delivery schedule, and the increased freight costs also contribute to the cost pressure, especially to the specialty cables and high-volume projects. The smaller manufacturers that have less hedging ability are particularly susceptible because they are unable to bear these extra costs with ease.
- These difficulties are limiting profit margins, stalling capital investments and can postpone expansion plans. Market agility and profitability are thus critical in the areas of efficient supply chain management, strategic procurement, and the avoidance of risks.
Opportunity: Expansion of Electric Vehicle Charging and Automotive Electrification Cable Demand
-
The increase in the number of electric vehicles (EVs) and charge infrastructure is creating a high demand of specialized global wire and cable solutions market. EVs demand high voltage and high-current traction battery, onboard system, and charging station cables, which make them safe and efficient.
- Fast-charging networks also push the need to have long-lasting cabling with the capacity to deliver more power on a consistent basis. The growth of these networks is essential to ensuring the massive adoption of EV and in order to sustain increasing consumer and commercial transportation demands.
- For instance, Southwire Company, which collaborates with Orange Charger to speed up EV charging installations especially in multifamily houses by combining cabling solutions with charging platforms, will cut the complexity of deployment and lower the cost. The move is strategic because it puts the company in a position to take advantage of the fast-growing market of EV and charging infrastructure.
- Government incentives and clean transportation policies increase the deployment of EV even more. The manufacturers are also investing in new cable design, lightweight materials, and new safety measures to match the stringent automotive standards.
- The cable demand that is driven by EV is offering high-growth potential and diversification of revenue sources compared to traditional sectors.
Key Trend: Digitalization and Smart Cable Technology Integration Across Energy Networks
-
The wire and cable market, changed by the digitalization of energy networks and integration of smart cable technologies, which allows real-time monitoring of the network or predictive maintenance and more operational insights, which enhance reliability and minimize downtime. With these technologies, utilities and operators of industries can detect problems at the early stage and optimize network performance.
- For instance, in 2025, Nexans introduced its Smart Cable Guard system, which inserts an intelligent sensor into a power cable network of medium voltage to constantly identify faults, insulation vulnerability, and abnormal performance of a network to enable operators to precisely locate problems and take proactive action to minimize outages and maintenance expenses.
- These innovations represent the general trends in the industry of IoT-enabled and AI-assisted cable systems that facilitate grid modernization and smart infrastructure.
- Digitalization enhances the resilience of the systems, reduces the cost of lifecycle, and opens up high-value service opportunities to cable manufactures.
Wire-Cable-Market Analysis and Segmental Data
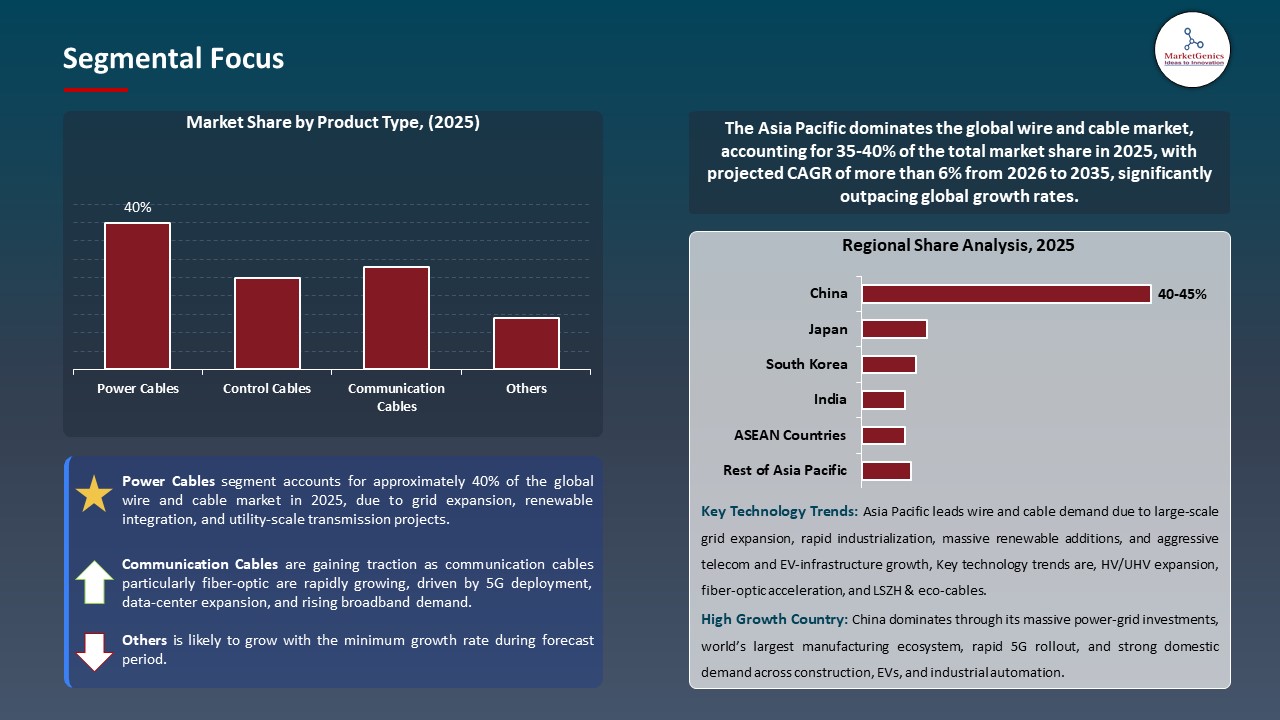
Power Cables Dominate Global Wire and Cable Market
-
The power cables segment dominates the global wire and cable market, as the development of electricity network has increased at a significant rate and the demand on the quality of energy transmission has grown. These cables are necessary in the effective transmission of electricity in the industries, commerce and home-based industries across the economy.
- The adoption of renewable sources of energy also contributes to the high voltage and medium voltage power cable demand. The use of smart grids, urban electrification, and high-scale solar and wind projects demand high-quality and heavy-duty cabling that would be able to sustain higher loads and guarantee the long-term stability.
- For instance, the 2025 projects of Prysmian Group with the provision of high-capacity power cables to U.S. solar and wind farms emphasize the key place of power cables in the contemporary energy infrastructure.
- This leadership of the power cables stimulates sustained market expansion and helps its manufacturers to tap in the energy transition opportunities across the globe.
Asia Pacific Leads Global Wire and Cable Market Demand
-
Asia Pacific leads the wire and cable market, due to high rate of industrialization, urbanization and huge investment in the power, telecom and infrastructure projects. The trends generate a high demand of high-performance wiring technology in various industries.
- The growth in energy generation and distribution, smart grids implementation, and integration of renewable energy is increasing at a faster pace in such countries as China, India, and South Korea, which also promotes the demand in power and communication cables.
- China, specifically, dominates the market with the massive government programmes, such as the development of renewable energy capacity, the implementation of 5G networks, and the modernization of urban infrastructure. These programs spur ongoing purchases of cutting-edge cable solutions and favor technology enhancements.
- For instance, in September 2025, LS Cable & System secured a USD 114 million contract to supply submarine cables for the Formosa 4 offshore wind power project in Taiwan, reinforcing its role in supporting Asia Pacific’s renewable energy infrastructure expansion through high‑capacity cable deliveries to key wind farm developments.
- The high demand in the Asian Pacific and massive infrastructural projects have spurred consistent growth in market, promoted technology advancement and made regional manufacturers significant participants in the global wire and cable industry.
Wire-Cable-Market Ecosystem
The global wire and cable market is slightly consolidated, with high concentration among key players such as Prysmian Group, LS Cable & System, Nexans S.A., Fujikura Ltd., and Sumitomo Electric Industries, who dominate through the presence of large manufacturing networks around the globe, large distribution channels, diversified product lines and constant investments in new advanced technologies. Their scale and capabilities allow them to secure large infrastructure, energy, and telecom projects, while smaller regional players compete in niche segments or specialized applications.
The merger helps these major players to shape the price, industry standards, and innovate the high-performance, smart, and sustainable cable solutions. Consolidation of markets promotes competitive advantages to large producers, technology leadership, and influences the dynamics of global supply, and promotes entry barriers to new entrants in high-capacity and technologically advanced cable segments.
Recent Development and Strategic Overview:
-
In November 2025, Southwire Company LLC announced substantial upgrades to its Heflin, Alabama facility to expand and modernize medium-voltage cable manufacturing, strengthening its core production capacity to support large-scale power infrastructure and utility sector requirements.
- In August 2025, Belden Inc. announced the launch of next-generation connectivity solutions, featuring gel-free loose tube fiber optic cables and extended Ethernet reach technologies. These offerings are designed to optimize data performance and reliability in industrial networks, supporting advanced automation and smart infrastructure applications.
Report Scope
|
Detail |
|
|
Market Size in 2025 |
USD 215.3 Bn |
|
Market Forecast Value in 2035 |
~USD 328 Bn |
|
Growth Rate (CAGR) |
4.3% |
|
Forecast Period |
2026 – 2035 |
|
Historical Data Available for |
2021 – 2024 |
|
Market Size Units |
US$ Billion for Value |
|
Report Format |
Electronic (PDF) + Excel |
|
North America |
Europe |
Asia Pacific |
Middle East |
Africa |
South America |
|
|
|
|
|
|
|
Companies Covered |
|||||
|
|
|
|
|
|
Wire-&-Cable-Market Segmentation and Highlights
|
Segment |
Sub-segment |
|
Wire and Cable Market, By Product Type |
|
|
Wire and Cable Market, By Voltage Rating |
|
|
Wire and Cable Market, By Conductor Material |
|
|
Wire and Cable Market, By Insulation Material |
|
|
Wire and Cable Market, By Installation Type
|
|
|
Wire and Cable Market, By Number of Cores
|
|
|
Wire and Cable Market, By Current Type |
|
|
Wire and Cable Market, By Cable Size/Cross-Section |
|
|
Wire and Cable Market, By Shielding Type |
|
|
Wire and Cable Market, By End-Use Industry |
|
Frequently Asked Questions
Table of Contents
- 1. Research Methodology and Assumptions
- 1.1. Definitions
- 1.2. Research Design and Approach
- 1.3. Data Collection Methods
- 1.4. Base Estimates and Calculations
- 1.5. Forecasting Models
- 1.5.1. Key Forecast Factors & Impact Analysis
- 1.6. Secondary Research
- 1.6.1. Open Sources
- 1.6.2. Paid Databases
- 1.6.3. Associations
- 1.7. Primary Research
- 1.7.1. Primary Sources
- 1.7.2. Primary Interviews with Stakeholders across Ecosystem
- 2. Executive Summary
- 2.1. Global Wire and Cable Market Outlook
- 2.1.1. Wire and Cable Market Size (Value - US$ Bn), and Forecasts, 2021-2035
- 2.1.2. Compounded Annual Growth Rate Analysis
- 2.1.3. Growth Opportunity Analysis
- 2.1.4. Segmental Share Analysis
- 2.1.5. Geographical Share Analysis
- 2.2. Market Analysis and Facts
- 2.3. Supply-Demand Analysis
- 2.4. Competitive Benchmarking
- 2.5. Go-to- Market Strategy
- 2.5.1. Customer/ End-use Industry Assessment
- 2.5.2. Growth Opportunity Data, 2026-2035
- 2.5.2.1. Regional Data
- 2.5.2.2. Country Data
- 2.5.2.3. Segmental Data
- 2.5.3. Identification of Potential Market Spaces
- 2.5.4. GAP Analysis
- 2.5.5. Potential Attractive Price Points
- 2.5.6. Prevailing Market Risks & Challenges
- 2.5.7. Preferred Sales & Marketing Strategies
- 2.5.8. Key Recommendations and Analysis
- 2.5.9. A Way Forward
- 2.1. Global Wire and Cable Market Outlook
- 3. Industry Data and Premium Insights
- 3.1. Global Energy & Power Industry Overview, 2025
- 3.1.1. Energy & Power Industry Ecosystem Analysis
- 3.1.2. Key Trends for Energy & Power Industry
- 3.1.3. Regional Distribution for Energy & Power Industry
- 3.2. Supplier Customer Data
- 3.3. Technology Roadmap and Developments
- 3.4. Trade Analysis
- 3.4.1. Import & Export Analysis, 2025
- 3.4.2. Top Importing Countries
- 3.4.3. Top Exporting Countries
- 3.5. Trump Tariff Impact Analysis
- 3.5.1. Manufacturer
- 3.5.1.1. Based on the component & Raw material
- 3.5.2. Supply Chain
- 3.5.3. End Consumer
- 3.5.1. Manufacturer
- 3.6. Raw Material Analysis
- 3.1. Global Energy & Power Industry Overview, 2025
- 4. Market Overview
- 4.1. Market Dynamics
- 4.1.1. Drivers
- 4.1.1.1. Increasing global infrastructure development and electrification demand
- 4.1.1.2. Rapid expansion of digital and telecom networks, including 5G and data centers
- 4.1.1.3. Growth of renewable energy projects and EV charging infrastructure
- 4.1.2. Restraints
- 4.1.2.1. Volatility in raw material prices, especially copper and aluminum
- 4.1.2.2. Stringent environmental and regulatory compliance increasing operational costs
- 4.1.1. Drivers
- 4.2. Key Trend Analysis
- 4.3. Regulatory Framework
- 4.3.1. Key Regulations, Norms, and Subsidies, by Key Countries
- 4.3.2. Tariffs and Standards
- 4.3.3. Impact Analysis of Regulations on the Market
- 4.4. Value Chain Analysis
- 4.4.1. Raw Material Sourcing
- 4.4.2. Wire and Cable Manufacturers
- 4.4.3. Distribution & Supply Chain
- 4.4.4. End-Use Industries
- 4.5. Porter’s Five Forces Analysis
- 4.6. PESTEL Analysis
- 4.7. Global Wire and Cable Market Demand
- 4.7.1. Historical Market Size – Value (US$ Bn), 2020-2024
- 4.7.2. Current and Future Market Size – Value (US$ Bn), 2026–2035
- 4.7.2.1. Y-o-Y Growth Trends
- 4.7.2.2. Absolute $ Opportunity Assessment
- 4.1. Market Dynamics
- 5. Competition Landscape
- 5.1. Competition structure
- 5.1.1. Fragmented v/s consolidated
- 5.2. Company Share Analysis, 2025
- 5.2.1. Global Company Market Share
- 5.2.2. By Region
- 5.2.2.1. North America
- 5.2.2.2. Europe
- 5.2.2.3. Asia Pacific
- 5.2.2.4. Middle East
- 5.2.2.5. Africa
- 5.2.2.6. South America
- 5.3. Product Comparison Matrix
- 5.3.1. Specifications
- 5.3.2. Market Positioning
- 5.3.3. Pricing
- 5.1. Competition structure
- 6. Global Wire and Cable Market Analysis, by Product Type
- 6.1. Key Segment Analysis
- 6.2. Wire and Cable Market Size (Value - US$ Bn), Analysis, and Forecasts, by Product Type, 2021-2035
- 6.2.1. Power Cables
- 6.2.1.1. Low Voltage Power Cables
- 6.2.1.2. Medium Voltage Power Cables
- 6.2.1.3. High Voltage Power Cables
- 6.2.1.4. Extra High Voltage Power Cables
- 6.2.2. Control Cables
- 6.2.3. Communication Cables
- 6.2.3.1. Fiber Optic Cables
- 6.2.3.2. Coaxial Cables
- 6.2.3.3. Ethernet Cables
- 6.2.3.4. Others
- 6.2.4. Instrumentation Cables
- 6.2.5. Special Cables
- 6.2.6. Building Wires
- 6.2.7. Others
- 6.2.1. Power Cables
- 7. Global Wire and Cable Market Analysis, by Voltage Rating
- 7.1. Key Segment Analysis
- 7.2. Wire and Cable Market Size (Value - US$ Bn), Analysis, and Forecasts, by Voltage Rating, 2021-2035
- 7.2.1. Up to 1 kV
- 7.2.2. 1 kV to 33 kV
- 7.2.3. 33 kV to 220 kV
- 7.2.4. Above 220 kV
- 8. Global Wire and Cable Market Analysis, by Conductor Material
- 8.1. Key Segment Analysis
- 8.2. Wire and Cable Market Size (Value - US$ Bn), Analysis, and Forecasts, by Conductor Material, 2021-2035
- 8.2.1. Copper
- 8.2.1.1. Bare Copper
- 8.2.1.2. Tinned Copper
- 8.2.1.3. Silver-Coated Copper
- 8.2.1.4. Others
- 8.2.2. Aluminum
- 8.2.2.1. Pure Aluminum
- 8.2.2.2. Aluminum Alloy
- 8.2.3. Copper-Clad Aluminum
- 8.2.4. Specialty Alloys
- 8.2.5. Others
- 8.2.1. Copper
- 9. Global Wire and Cable Market Analysis, by Insulation Material
- 9.1. Key Segment Analysis
- 9.2. Wire and Cable Market Size (Value - US$ Bn), Analysis, and Forecasts, by Insulation Material, 2021-2035
- 9.2.1. PVC (Polyvinyl Chloride)
- 9.2.2. XLPE (Cross-Linked Polyethylene)
- 9.2.3. EPR (Ethylene Propylene Rubber)
- 9.2.4. Silicone Rubber
- 9.2.5. Polyethylene (PE)
- 9.2.6. Teflon (PTFE/FEP)
- 9.2.7. Paper Insulated
- 9.2.8. Others
- 10. Global Wire and Cable Market Analysis, by Installation Type
- 10.1. Key Segment Analysis
- 10.2. Wire and Cable Market Size (Value - US$ Bn), Analysis, and Forecasts, by Installation Type, 2021-2035
- 10.2.1. Underground Cables
- 10.2.2. Overhead Cables
- 10.2.3. Submarine Cables
- 10.2.4. Aerial Bundled Cables
- 10.2.5. Indoor Installation
- 11. Global Wire and Cable Market Analysis, by Number of Cores
- 11.1. Key Segment Analysis
- 11.2. Wire and Cable Market Size (Value - US$ Bn), Analysis, and Forecasts, by Number of Cores, 2021-2035
- 11.2.1. Single Core
- 11.2.2. Two Core
- 11.2.3. Three Core
- 11.2.4. Multi-Core
- 12. Global Wire and Cable Market Analysis, by Current Type
- 12.1. Key Segment Analysis
- 12.2. Wire and Cable Market Size (Value - US$ Bn), Analysis, and Forecasts, by Current Type, 2021-2035
- 12.2.1. AC (Alternating Current) Cables
- 12.2.2. DC (Direct Current) Cables
- 12.2.3. Hybrid Cables
- 13. Global Wire and Cable Market Analysis, by Cable Size/Cross-Section
- 13.1. Key Segment Analysis
- 13.2. Wire and Cable Market Size (Value - US$ Bn), Analysis, and Forecasts, by Cable Size/Cross-Section, 2021-2035
- 13.2.1. Up to 10 sq mm
- 13.2.2. 10 to 50 sq mm
- 13.2.3. 50 to 300 sq mm
- 13.2.4. Above 300 sq mm
- 14. Global Wire and Cable Market Analysis and Forecasts, by Shielding Type
- 14.1. Key Findings
- 14.2. Wire and Cable Market Size (Value - US$ Bn), Analysis, and Forecasts, by Shielding Type, 2021-2035
- 14.2.1. Unshielded
- 14.2.2. Foil Shielded
- 14.2.3. Braided Shielded
- 14.2.4. Combination Shielded
- 15. Global Wire and Cable Market Analysis and Forecasts, by End-Use Industry
- 15.1. Key Findings
- 15.2. Wire and Cable Market Size (Value - US$ Bn), Analysis, and Forecasts, by End-Use Industry, 2021-2035
- 15.2.1. Power & Energy Sector
- 15.2.1.1. Power Generation
- 15.2.1.2. Power Transmission
- 15.2.1.3. Power Distribution
- 15.2.1.4. Grid Interconnection
- 15.2.1.5. Renewable Energy Integration
- 15.2.1.6. Others
- 15.2.2. Construction & Infrastructure
- 15.2.3. Industrial/Manufacturing
- 15.2.4. Telecommunications
- 15.2.4.1. Telecom Networks
- 15.2.4.2. Data Centers
- 15.2.4.3. Broadcasting
- 15.2.4.4. Fiber Optic Networks
- 15.2.4.5. 5G Infrastructure
- 15.2.4.6. Others
- 15.2.5. IT & Data Centers
- 15.2.6. Transportation
- 15.2.7. Marine & Offshore
- 15.2.8. Aerospace & Defense
- 15.2.9. Mining & Metals
- 15.2.10. Automotive
- 15.2.11. Healthcare
- 15.2.12. Other Industries
- 15.2.1. Power & Energy Sector
- 16. Global Wire and Cable Market Analysis and Forecasts, by Region
- 16.1. Key Findings
- 16.2. Wire and Cable Market Size (Value - US$ Bn), Analysis, and Forecasts, by Region, 2021-2035
- 16.2.1. North America
- 16.2.2. Europe
- 16.2.3. Asia Pacific
- 16.2.4. Middle East
- 16.2.5. Africa
- 16.2.6. South America
- 17. North America Wire and Cable Market Analysis
- 17.1. Key Segment Analysis
- 17.2. Regional Snapshot
- 17.3. North America Wire and Cable Market Size (Value - US$ Bn), Analysis, and Forecasts, 2021-2035
- 17.3.1. Product Type
- 17.3.2. Voltage Rating
- 17.3.3. Conductor Material
- 17.3.4. Insulation Material
- 17.3.5. Installation Type
- 17.3.6. Number of Cores
- 17.3.7. Current Type
- 17.3.8. Cable Size/Cross-Section
- 17.3.9. Shielding Type
- 17.3.10. End-Use Industry
- 17.3.11. Country
- 17.3.11.1. USA
- 17.3.11.2. Canada
- 17.3.11.3. Mexico
- 17.4. USA Wire and Cable Market
- 17.4.1. Country Segmental Analysis
- 17.4.2. Product Type
- 17.4.3. Voltage Rating
- 17.4.4. Conductor Material
- 17.4.5. Insulation Material
- 17.4.6. Installation Type
- 17.4.7. Number of Cores
- 17.4.8. Current Type
- 17.4.9. Cable Size/Cross-Section
- 17.4.10. Shielding Type
- 17.4.11. End-Use Industry
- 17.5. Canada Wire and Cable Market
- 17.5.1. Country Segmental Analysis
- 17.5.2. Product Type
- 17.5.3. Voltage Rating
- 17.5.4. Conductor Material
- 17.5.5. Insulation Material
- 17.5.6. Installation Type
- 17.5.7. Number of Cores
- 17.5.8. Current Type
- 17.5.9. Cable Size/Cross-Section
- 17.5.10. Shielding Type
- 17.5.11. End-Use Industry
- 17.6. Mexico Wire and Cable Market
- 17.6.1. Country Segmental Analysis
- 17.6.2. Product Type
- 17.6.3. Voltage Rating
- 17.6.4. Conductor Material
- 17.6.5. Insulation Material
- 17.6.6. Installation Type
- 17.6.7. Number of Cores
- 17.6.8. Current Type
- 17.6.9. Cable Size/Cross-Section
- 17.6.10. Shielding Type
- 17.6.11. End-Use Industry
- 18. Europe Wire and Cable Market Analysis
- 18.1. Key Segment Analysis
- 18.2. Regional Snapshot
- 18.3. Europe Wire and Cable Market Size (Value - US$ Bn), Analysis, and Forecasts, 2021-2035
- 18.3.1. Product Type
- 18.3.2. Voltage Rating
- 18.3.3. Conductor Material
- 18.3.4. Insulation Material
- 18.3.5. Installation Type
- 18.3.6. Number of Cores
- 18.3.7. Current Type
- 18.3.8. Cable Size/Cross-Section
- 18.3.9. Shielding Type
- 18.3.10. End-Use Industry
- 18.3.11. Country
- 18.3.11.1. Germany
- 18.3.11.2. United Kingdom
- 18.3.11.3. France
- 18.3.11.4. Italy
- 18.3.11.5. Spain
- 18.3.11.6. Netherlands
- 18.3.11.7. Nordic Countries
- 18.3.11.8. Poland
- 18.3.11.9. Russia & CIS
- 18.3.11.10. Rest of Europe
- 18.4. Germany Wire and Cable Market
- 18.4.1. Country Segmental Analysis
- 18.4.2. Product Type
- 18.4.3. Voltage Rating
- 18.4.4. Conductor Material
- 18.4.5. Insulation Material
- 18.4.6. Installation Type
- 18.4.7. Number of Cores
- 18.4.8. Current Type
- 18.4.9. Cable Size/Cross-Section
- 18.4.10. Shielding Type
- 18.4.11. End-Use Industry
- 18.5. United Kingdom Wire and Cable Market
- 18.5.1. Country Segmental Analysis
- 18.5.2. Product Type
- 18.5.3. Voltage Rating
- 18.5.4. Conductor Material
- 18.5.5. Insulation Material
- 18.5.6. Installation Type
- 18.5.7. Number of Cores
- 18.5.8. Current Type
- 18.5.9. Cable Size/Cross-Section
- 18.5.10. Shielding Type
- 18.5.11. End-Use Industry
- 18.6. France Wire and Cable Market
- 18.6.1. Country Segmental Analysis
- 18.6.2. Product Type
- 18.6.3. Voltage Rating
- 18.6.4. Conductor Material
- 18.6.5. Insulation Material
- 18.6.6. Installation Type
- 18.6.7. Number of Cores
- 18.6.8. Current Type
- 18.6.9. Cable Size/Cross-Section
- 18.6.10. Shielding Type
- 18.6.11. End-Use Industry
- 18.7. Italy Wire and Cable Market
- 18.7.1. Country Segmental Analysis
- 18.7.2. Product Type
- 18.7.3. Voltage Rating
- 18.7.4. Conductor Material
- 18.7.5. Insulation Material
- 18.7.6. Installation Type
- 18.7.7. Number of Cores
- 18.7.8. Current Type
- 18.7.9. Cable Size/Cross-Section
- 18.7.10. Shielding Type
- 18.7.11. End-Use Industry
- 18.8. Spain Wire and Cable Market
- 18.8.1. Country Segmental Analysis
- 18.8.2. Product Type
- 18.8.3. Voltage Rating
- 18.8.4. Conductor Material
- 18.8.5. Insulation Material
- 18.8.6. Installation Type
- 18.8.7. Number of Cores
- 18.8.8. Current Type
- 18.8.9. Cable Size/Cross-Section
- 18.8.10. Shielding Type
- 18.8.11. End-Use Industry
- 18.9. Netherlands Wire and Cable Market
- 18.9.1. Country Segmental Analysis
- 18.9.2. Product Type
- 18.9.3. Voltage Rating
- 18.9.4. Conductor Material
- 18.9.5. Insulation Material
- 18.9.6. Installation Type
- 18.9.7. Number of Cores
- 18.9.8. Current Type
- 18.9.9. Cable Size/Cross-Section
- 18.9.10. Shielding Type
- 18.9.11. End-Use Industry
- 18.10. Nordic Countries Wire and Cable Market
- 18.10.1. Country Segmental Analysis
- 18.10.2. Product Type
- 18.10.3. Voltage Rating
- 18.10.4. Conductor Material
- 18.10.5. Insulation Material
- 18.10.6. Installation Type
- 18.10.7. Number of Cores
- 18.10.8. Current Type
- 18.10.9. Cable Size/Cross-Section
- 18.10.10. Shielding Type
- 18.10.11. End-Use Industry
- 18.11. Poland Wire and Cable Market
- 18.11.1. Country Segmental Analysis
- 18.11.2. Product Type
- 18.11.3. Voltage Rating
- 18.11.4. Conductor Material
- 18.11.5. Insulation Material
- 18.11.6. Installation Type
- 18.11.7. Number of Cores
- 18.11.8. Current Type
- 18.11.9. Cable Size/Cross-Section
- 18.11.10. Shielding Type
- 18.11.11. End-Use Industry
- 18.12. Russia & CIS Wire and Cable Market
- 18.12.1. Country Segmental Analysis
- 18.12.2. Product Type
- 18.12.3. Voltage Rating
- 18.12.4. Conductor Material
- 18.12.5. Insulation Material
- 18.12.6. Installation Type
- 18.12.7. Number of Cores
- 18.12.8. Current Type
- 18.12.9. Cable Size/Cross-Section
- 18.12.10. Shielding Type
- 18.12.11. End-Use Industry
- 18.13. Rest of Europe Wire and Cable Market
- 18.13.1. Country Segmental Analysis
- 18.13.2. Product Type
- 18.13.3. Voltage Rating
- 18.13.4. Conductor Material
- 18.13.5. Insulation Material
- 18.13.6. Installation Type
- 18.13.7. Number of Cores
- 18.13.8. Current Type
- 18.13.9. Cable Size/Cross-Section
- 18.13.10. Shielding Type
- 18.13.11. End-Use Industry
- 19. Asia Pacific Wire and Cable Market Analysis
- 19.1. Key Segment Analysis
- 19.2. Regional Snapshot
- 19.3. Asia Pacific Wire and Cable Market Size (Value - US$ Bn), Analysis, and Forecasts, 2021-2035
- 19.3.1. Product Type
- 19.3.2. Voltage Rating
- 19.3.3. Conductor Material
- 19.3.4. Insulation Material
- 19.3.5. Installation Type
- 19.3.6. Number of Cores
- 19.3.7. Current Type
- 19.3.8. Cable Size/Cross-Section
- 19.3.9. Shielding Type
- 19.3.10. End-Use Industry
- 19.3.11. Country
- 19.3.11.1. China
- 19.3.11.2. India
- 19.3.11.3. Japan
- 19.3.11.4. South Korea
- 19.3.11.5. Australia and New Zealand
- 19.3.11.6. Indonesia
- 19.3.11.7. Malaysia
- 19.3.11.8. Thailand
- 19.3.11.9. Vietnam
- 19.3.11.10. Rest of Asia Pacific
- 19.4. China Wire and Cable Market
- 19.4.1. Country Segmental Analysis
- 19.4.2. Product Type
- 19.4.3. Voltage Rating
- 19.4.4. Conductor Material
- 19.4.5. Insulation Material
- 19.4.6. Installation Type
- 19.4.7. Number of Cores
- 19.4.8. Current Type
- 19.4.9. Cable Size/Cross-Section
- 19.4.10. Shielding Type
- 19.4.11. End-Use Industry
- 19.5. India Wire and Cable Market
- 19.5.1. Country Segmental Analysis
- 19.5.2. Product Type
- 19.5.3. Voltage Rating
- 19.5.4. Conductor Material
- 19.5.5. Insulation Material
- 19.5.6. Installation Type
- 19.5.7. Number of Cores
- 19.5.8. Current Type
- 19.5.9. Cable Size/Cross-Section
- 19.5.10. Shielding Type
- 19.5.11. End-Use Industry
- 19.6. Japan Wire and Cable Market
- 19.6.1. Country Segmental Analysis
- 19.6.2. Product Type
- 19.6.3. Voltage Rating
- 19.6.4. Conductor Material
- 19.6.5. Insulation Material
- 19.6.6. Installation Type
- 19.6.7. Number of Cores
- 19.6.8. Current Type
- 19.6.9. Cable Size/Cross-Section
- 19.6.10. Shielding Type
- 19.6.11. End-Use Industry
- 19.7. South Korea Wire and Cable Market
- 19.7.1. Country Segmental Analysis
- 19.7.2. Product Type
- 19.7.3. Voltage Rating
- 19.7.4. Conductor Material
- 19.7.5. Insulation Material
- 19.7.6. Installation Type
- 19.7.7. Number of Cores
- 19.7.8. Current Type
- 19.7.9. Cable Size/Cross-Section
- 19.7.10. Shielding Type
- 19.7.11. End-Use Industry
- 19.8. Australia and New Zealand Wire and Cable Market
- 19.8.1. Country Segmental Analysis
- 19.8.2. Product Type
- 19.8.3. Voltage Rating
- 19.8.4. Conductor Material
- 19.8.5. Insulation Material
- 19.8.6. Installation Type
- 19.8.7. Number of Cores
- 19.8.8. Current Type
- 19.8.9. Cable Size/Cross-Section
- 19.8.10. Shielding Type
- 19.8.11. End-Use Industry
- 19.9. Indonesia Wire and Cable Market
- 19.9.1. Country Segmental Analysis
- 19.9.2. Product Type
- 19.9.3. Voltage Rating
- 19.9.4. Conductor Material
- 19.9.5. Insulation Material
- 19.9.6. Installation Type
- 19.9.7. Number of Cores
- 19.9.8. Current Type
- 19.9.9. Cable Size/Cross-Section
- 19.9.10. Shielding Type
- 19.9.11. End-Use Industry
- 19.10. Malaysia Wire and Cable Market
- 19.10.1. Country Segmental Analysis
- 19.10.2. Product Type
- 19.10.3. Voltage Rating
- 19.10.4. Conductor Material
- 19.10.5. Insulation Material
- 19.10.6. Installation Type
- 19.10.7. Number of Cores
- 19.10.8. Current Type
- 19.10.9. Cable Size/Cross-Section
- 19.10.10. Shielding Type
- 19.10.11. End-Use Industry
- 19.11. Thailand Wire and Cable Market
- 19.11.1. Country Segmental Analysis
- 19.11.2. Product Type
- 19.11.3. Voltage Rating
- 19.11.4. Conductor Material
- 19.11.5. Insulation Material
- 19.11.6. Installation Type
- 19.11.7. Number of Cores
- 19.11.8. Current Type
- 19.11.9. Cable Size/Cross-Section
- 19.11.10. Shielding Type
- 19.11.11. End-Use Industry
- 19.12. Vietnam Wire and Cable Market
- 19.12.1. Country Segmental Analysis
- 19.12.2. Product Type
- 19.12.3. Voltage Rating
- 19.12.4. Conductor Material
- 19.12.5. Insulation Material
- 19.12.6. Installation Type
- 19.12.7. Number of Cores
- 19.12.8. Current Type
- 19.12.9. Cable Size/Cross-Section
- 19.12.10. Shielding Type
- 19.12.11. End-Use Industry
- 19.13. Rest of Asia Pacific Wire and Cable Market
- 19.13.1. Country Segmental Analysis
- 19.13.2. Product Type
- 19.13.3. Voltage Rating
- 19.13.4. Conductor Material
- 19.13.5. Insulation Material
- 19.13.6. Installation Type
- 19.13.7. Number of Cores
- 19.13.8. Current Type
- 19.13.9. Cable Size/Cross-Section
- 19.13.10. Shielding Type
- 19.13.11. End-Use Industry
- 20. Middle East Wire and Cable Market Analysis
- 20.1. Key Segment Analysis
- 20.2. Regional Snapshot
- 20.3. Middle East Wire and Cable Market Size (Value - US$ Bn), Analysis, and Forecasts, 2021-2035
- 20.3.1. Product Type
- 20.3.2. Voltage Rating
- 20.3.3. Conductor Material
- 20.3.4. Insulation Material
- 20.3.5. Installation Type
- 20.3.6. Number of Cores
- 20.3.7. Current Type
- 20.3.8. Cable Size/Cross-Section
- 20.3.9. Shielding Type
- 20.3.10. End-Use Industry
- 20.3.11. Country
- 20.3.11.1. Turkey
- 20.3.11.2. UAE
- 20.3.11.3. Saudi Arabia
- 20.3.11.4. Israel
- 20.3.11.5. Rest of Middle East
- 20.4. Turkey Wire and Cable Market
- 20.4.1. Country Segmental Analysis
- 20.4.2. Product Type
- 20.4.3. Voltage Rating
- 20.4.4. Conductor Material
- 20.4.5. Insulation Material
- 20.4.6. Installation Type
- 20.4.7. Number of Cores
- 20.4.8. Current Type
- 20.4.9. Cable Size/Cross-Section
- 20.4.10. Shielding Type
- 20.4.11. End-Use Industry
- 20.5. UAE Wire and Cable Market
- 20.5.1. Country Segmental Analysis
- 20.5.2. Product Type
- 20.5.3. Voltage Rating
- 20.5.4. Conductor Material
- 20.5.5. Insulation Material
- 20.5.6. Installation Type
- 20.5.7. Number of Cores
- 20.5.8. Current Type
- 20.5.9. Cable Size/Cross-Section
- 20.5.10. Shielding Type
- 20.5.11. End-Use Industry
- 20.6. Saudi Arabia Wire and Cable Market
- 20.6.1. Country Segmental Analysis
- 20.6.2. Product Type
- 20.6.3. Voltage Rating
- 20.6.4. Conductor Material
- 20.6.5. Insulation Material
- 20.6.6. Installation Type
- 20.6.7. Number of Cores
- 20.6.8. Current Type
- 20.6.9. Cable Size/Cross-Section
- 20.6.10. Shielding Type
- 20.6.11. End-Use Industry
- 20.7. Israel Wire and Cable Market
- 20.7.1. Country Segmental Analysis
- 20.7.2. Product Type
- 20.7.3. Voltage Rating
- 20.7.4. Conductor Material
- 20.7.5. Insulation Material
- 20.7.6. Installation Type
- 20.7.7. Number of Cores
- 20.7.8. Current Type
- 20.7.9. Cable Size/Cross-Section
- 20.7.10. Shielding Type
- 20.7.11. End-Use Industry
- 20.8. Rest of Middle East Wire and Cable Market
- 20.8.1. Country Segmental Analysis
- 20.8.2. Product Type
- 20.8.3. Voltage Rating
- 20.8.4. Conductor Material
- 20.8.5. Insulation Material
- 20.8.6. Installation Type
- 20.8.7. Number of Cores
- 20.8.8. Current Type
- 20.8.9. Cable Size/Cross-Section
- 20.8.10. Shielding Type
- 20.8.11. End-Use Industry
- 21. Africa Wire and Cable Market Analysis
- 21.1. Key Segment Analysis
- 21.2. Regional Snapshot
- 21.3. Africa Wire and Cable Market Size (Value - US$ Bn), Analysis, and Forecasts, 2021-2035
- 21.3.1. Product Type
- 21.3.2. Voltage Rating
- 21.3.3. Conductor Material
- 21.3.4. Insulation Material
- 21.3.5. Installation Type
- 21.3.6. Number of Cores
- 21.3.7. Current Type
- 21.3.8. Cable Size/Cross-Section
- 21.3.9. Shielding Type
- 21.3.10. End-Use Industry
- 21.3.11. Country
- 21.3.11.1. South Africa
- 21.3.11.2. Egypt
- 21.3.11.3. Nigeria
- 21.3.11.4. Algeria
- 21.3.11.5. Rest of Africa
- 21.4. South Africa Wire and Cable Market
- 21.4.1. Country Segmental Analysis
- 21.4.2. Product Type
- 21.4.3. Voltage Rating
- 21.4.4. Conductor Material
- 21.4.5. Insulation Material
- 21.4.6. Installation Type
- 21.4.7. Number of Cores
- 21.4.8. Current Type
- 21.4.9. Cable Size/Cross-Section
- 21.4.10. Shielding Type
- 21.4.11. End-Use Industry
- 21.5. Egypt Wire and Cable Market
- 21.5.1. Country Segmental Analysis
- 21.5.2. Product Type
- 21.5.3. Voltage Rating
- 21.5.4. Conductor Material
- 21.5.5. Insulation Material
- 21.5.6. Installation Type
- 21.5.7. Number of Cores
- 21.5.8. Current Type
- 21.5.9. Cable Size/Cross-Section
- 21.5.10. Shielding Type
- 21.5.11. End-Use Industry
- 21.6. Nigeria Wire and Cable Market
- 21.6.1. Country Segmental Analysis
- 21.6.2. Product Type
- 21.6.3. Voltage Rating
- 21.6.4. Conductor Material
- 21.6.5. Insulation Material
- 21.6.6. Installation Type
- 21.6.7. Number of Cores
- 21.6.8. Current Type
- 21.6.9. Cable Size/Cross-Section
- 21.6.10. Shielding Type
- 21.6.11. End-Use Industry
- 21.7. Algeria Wire and Cable Market
- 21.7.1. Country Segmental Analysis
- 21.7.2. Product Type
- 21.7.3. Voltage Rating
- 21.7.4. Conductor Material
- 21.7.5. Insulation Material
- 21.7.6. Installation Type
- 21.7.7. Number of Cores
- 21.7.8. Current Type
- 21.7.9. Cable Size/Cross-Section
- 21.7.10. Shielding Type
- 21.7.11. End-Use Industry
- 21.8. Rest of Africa Wire and Cable Market
- 21.8.1. Country Segmental Analysis
- 21.8.2. Product Type
- 21.8.3. Voltage Rating
- 21.8.4. Conductor Material
- 21.8.5. Insulation Material
- 21.8.6. Installation Type
- 21.8.7. Number of Cores
- 21.8.8. Current Type
- 21.8.9. Cable Size/Cross-Section
- 21.8.10. Shielding Type
- 21.8.11. End-Use Industry
- 22. South America Wire and Cable Market Analysis
- 22.1. Key Segment Analysis
- 22.2. Regional Snapshot
- 22.3. South America Wire and Cable Market Size (Value - US$ Bn), Analysis, and Forecasts, 2021-2035
- 22.3.1. Product Type
- 22.3.2. Voltage Rating
- 22.3.3. Conductor Material
- 22.3.4. Insulation Material
- 22.3.5. Installation Type
- 22.3.6. Number of Cores
- 22.3.7. Current Type
- 22.3.8. Cable Size/Cross-Section
- 22.3.9. Shielding Type
- 22.3.10. End-Use Industry
- 22.3.11. Country
- 22.3.11.1. Brazil
- 22.3.11.2. Argentina
- 22.3.11.3. Rest of South America
- 22.4. Brazil Wire and Cable Market
- 22.4.1. Country Segmental Analysis
- 22.4.2. Product Type
- 22.4.3. Voltage Rating
- 22.4.4. Conductor Material
- 22.4.5. Insulation Material
- 22.4.6. Installation Type
- 22.4.7. Number of Cores
- 22.4.8. Current Type
- 22.4.9. Cable Size/Cross-Section
- 22.4.10. Shielding Type
- 22.4.11. End-Use Industry
- 22.5. Argentina Wire and Cable Market
- 22.5.1. Country Segmental Analysis
- 22.5.2. Product Type
- 22.5.3. Voltage Rating
- 22.5.4. Conductor Material
- 22.5.5. Insulation Material
- 22.5.6. Installation Type
- 22.5.7. Number of Cores
- 22.5.8. Current Type
- 22.5.9. Cable Size/Cross-Section
- 22.5.10. Shielding Type
- 22.5.11. End-Use Industry
- 22.6. Rest of South America Wire and Cable Market
- 22.6.1. Country Segmental Analysis
- 22.6.2. Product Type
- 22.6.3. Voltage Rating
- 22.6.4. Conductor Material
- 22.6.5. Insulation Material
- 22.6.6. Installation Type
- 22.6.7. Number of Cores
- 22.6.8. Current Type
- 22.6.9. Cable Size/Cross-Section
- 22.6.10. Shielding Type
- 22.6.11. End-Use Industry
- 23. Key Players/ Company Profile
- 23.1. Baosheng Science and Technology Innovation
- 23.1.1. Company Details/ Overview
- 23.1.2. Company Financials
- 23.1.3. Key Customers and Competitors
- 23.1.4. Business/ Industry Portfolio
- 23.1.5. Product Portfolio/ Specification Details
- 23.1.6. Pricing Data
- 23.1.7. Strategic Overview
- 23.1.8. Recent Developments
- 23.2. Belden Inc.
- 23.3. Encore Wire Corporation
- 23.4. Far East Cable Co., Ltd.
- 23.5. Finolex Cables Ltd.
- 23.6. Fujikura Ltd.
- 23.7. Furukawa Electric Co., Ltd.
- 23.8. Galaxy Wire & Cable Inc.
- 23.9. General Cable (Prysmian Group)
- 23.10. Havells India Ltd.
- 23.11. Hengtong Group Co., Ltd.
- 23.12. Hitachi Metals Ltd.
- 23.13. Jiangnan Cable Company
- 23.14. KEI Industries Limited
- 23.15. Leoni AG
- 23.16. LS Cable & System
- 23.17. Nexans S.A.
- 23.18. Ningbo Suntech Wire & Cable Co., Ltd.
- 23.19. NKT A/S
- 23.20. Polycab Wires Pvt. Ltd.
- 23.21. Prysmian Group
- 23.22. Southwire Company LLC
- 23.23. Sumitomo Electric Industries
- 23.24. TPC Wire & Cable Corp.
- 23.25. Other Key Players
- 23.1. Baosheng Science and Technology Innovation
Note* - This is just tentative list of players. While providing the report, we will cover more number of players based on their revenue and share for each geography
Research Design
Our research design integrates both demand-side and supply-side analysis through a balanced combination of primary and secondary research methodologies. By utilizing both bottom-up and top-down approaches alongside rigorous data triangulation methods, we deliver robust market intelligence that supports strategic decision-making.
MarketGenics' comprehensive research design framework ensures the delivery of accurate, reliable, and actionable market intelligence. Through the integration of multiple research approaches, rigorous validation processes, and expert analysis, we provide our clients with the insights needed to make informed strategic decisions and capitalize on market opportunities.

MarketGenics leverages a dedicated industry panel of experts and a comprehensive suite of paid databases to effectively collect, consolidate, and analyze market intelligence.
Our approach has consistently proven to be reliable and effective in generating accurate market insights, identifying key industry trends, and uncovering emerging business opportunities.
Through both primary and secondary research, we capture and analyze critical company-level data such as manufacturing footprints, including technical centers, R&D facilities, sales offices, and headquarters.
Our expert panel further enhances our ability to estimate market size for specific brands based on validated field-level intelligence.
Our data mining techniques incorporate both parametric and non-parametric methods, allowing for structured data collection, sorting, processing, and cleaning.
Demand projections are derived from large-scale data sets analyzed through proprietary algorithms, culminating in robust and reliable market sizing.
Research Approach
The bottom-up approach builds market estimates by starting with the smallest addressable market units and systematically aggregating them to create comprehensive market size projections.
This method begins with specific, granular data points and builds upward to create the complete market landscape.
Customer Analysis → Segmental Analysis → Geographical Analysis
The top-down approach starts with the broadest possible market data and systematically narrows it down through a series of filters and assumptions to arrive at specific market segments or opportunities.
This method begins with the big picture and works downward to increasingly specific market slices.
TAM → SAM → SOM


Research Methods
Desk / Secondary Research
While analysing the market, we extensively study secondary sources, directories, and databases to identify and collect information useful for this technical, market-oriented, and commercial report. Secondary sources that we utilize are not only the public sources, but it is a combination of Open Source, Associations, Paid Databases, MG Repository & Knowledgebase, and others.
- Company websites, annual reports, financial reports, broker reports, and investor presentations
- National government documents, statistical databases and reports
- News articles, press releases and web-casts specific to the companies operating in the market, Magazines, reports, and others
- We gather information from commercial data sources for deriving company specific data such as segmental revenue, share for geography, product revenue, and others
- Internal and external proprietary databases (industry-specific), relevant patent, and regulatory databases
- Governing Bodies, Government Organizations
- Relevant Authorities, Country-specific Associations for Industries
We also employ the model mapping approach to estimate the product level market data through the players' product portfolio
Primary Research
Primary research/ interviews is vital in analyzing the market. Most of the cases involves paid primary interviews. Primary sources include primary interviews through e-mail interactions, telephonic interviews, surveys as well as face-to-face interviews with the different stakeholders across the value chain including several industry experts.
| Type of Respondents | Number of Primaries |
|---|---|
| Tier 2/3 Suppliers | ~20 |
| Tier 1 Suppliers | ~25 |
| End-users | ~25 |
| Industry Expert/ Panel/ Consultant | ~30 |
| Total | ~100 |
MG Knowledgebase
• Repository of industry blog, newsletter and case studies
• Online platform covering detailed market reports, and company profiles
Forecasting Factors and Models
Forecasting Factors
- Historical Trends – Past market patterns, cycles, and major events that shaped how markets behave over time. Understanding past trends helps predict future behavior.
- Industry Factors – Specific characteristics of the industry like structure, regulations, and innovation cycles that affect market dynamics.
- Macroeconomic Factors – Economic conditions like GDP growth, inflation, and employment rates that affect how much money people have to spend.
- Demographic Factors – Population characteristics like age, income, and location that determine who can buy your product.
- Technology Factors – How quickly people adopt new technology and how much technology infrastructure exists.
- Regulatory Factors – Government rules, laws, and policies that can help or restrict market growth.
- Competitive Factors – Analyzing competition structure such as degree of competition and bargaining power of buyers and suppliers.
Forecasting Models / Techniques
Multiple Regression Analysis
- Identify and quantify factors that drive market changes
- Statistical modeling to establish relationships between market drivers and outcomes
Time Series Analysis – Seasonal Patterns
- Understand regular cyclical patterns in market demand
- Advanced statistical techniques to separate trend, seasonal, and irregular components
Time Series Analysis – Trend Analysis
- Identify underlying market growth patterns and momentum
- Statistical analysis of historical data to project future trends
Expert Opinion – Expert Interviews
- Gather deep industry insights and contextual understanding
- In-depth interviews with key industry stakeholders
Multi-Scenario Development
- Prepare for uncertainty by modeling different possible futures
- Creating optimistic, pessimistic, and most likely scenarios
Time Series Analysis – Moving Averages
- Sophisticated forecasting for complex time series data
- Auto-regressive integrated moving average models with seasonal components
Econometric Models
- Apply economic theory to market forecasting
- Sophisticated economic models that account for market interactions
Expert Opinion – Delphi Method
- Harness collective wisdom of industry experts
- Structured, multi-round expert consultation process
Monte Carlo Simulation
- Quantify uncertainty and probability distributions
- Thousands of simulations with varying input parameters
Research Analysis
Our research framework is built upon the fundamental principle of validating market intelligence from both demand and supply perspectives. This dual-sided approach ensures comprehensive market understanding and reduces the risk of single-source bias.
Demand-Side Analysis: We understand end-user/application behavior, preferences, and market needs along with the penetration of the product for specific application.
Supply-Side Analysis: We estimate overall market revenue, analyze the segmental share along with industry capacity, competitive landscape, and market structure.
Validation & Evaluation
Data triangulation is a validation technique that uses multiple methods, sources, or perspectives to examine the same research question, thereby increasing the credibility and reliability of research findings. In market research, triangulation serves as a quality assurance mechanism that helps identify and minimize bias, validate assumptions, and ensure accuracy in market estimates.
- Data Source Triangulation – Using multiple data sources to examine the same phenomenon
- Methodological Triangulation – Using multiple research methods to study the same research question
- Investigator Triangulation – Using multiple researchers or analysts to examine the same data
- Theoretical Triangulation – Using multiple theoretical perspectives to interpret the same data

Custom Market Research Services
We will customise the research for you, in case the report listed above does not meet your requirements.
Get 10% Free Customisation