Application Performance Monitoring Market Size, Share & Trends Analysis Report Component (Solutions, Services), Deployment Mode, Organization Size, Application Type, Monitoring Type, Technology, Business Function, Pricing Model, End-use Industry, and Geography (North America, Europe, Asia Pacific, Middle East, Africa, and South America) – Global Industry Data, Trends, and Forecasts, 2026–2035
Market Overview:
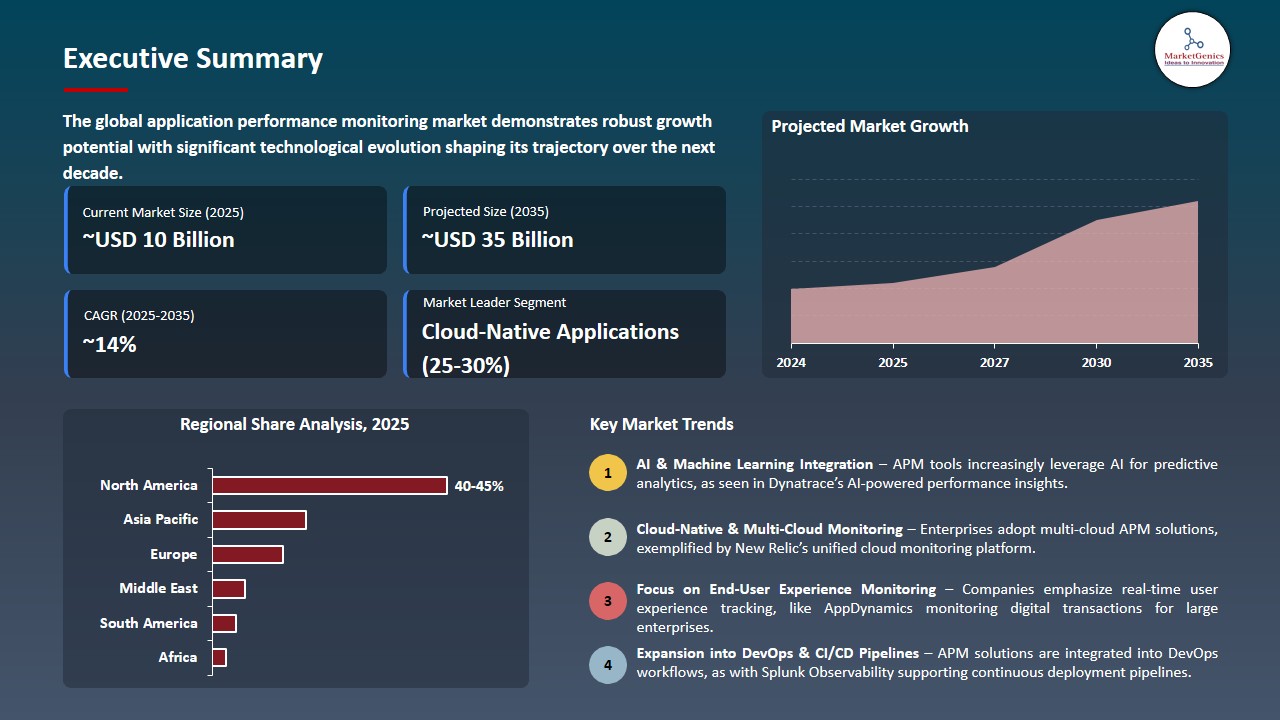
As per MarketGenics, the global Application Performance Monitoring (APM) Market is projected to grow from USD 9.7 billion in 2025 to USD 34.7 billion by 2035, registering a CAGR of 13.6% during the forecast period.
|
|
|
Segmental Data Insights |
|
|
Demand Trends |
|
|
Competitive Landscape |
|
|
Strategic Development |
|
|
Future Outlook & Opportunities |
|
Application Performance Monitoring Market Size, Share, and Growth
The global application performance monitoring market is driven by rapid cloud and microservices adoption, growing reliance on digital applications, increasing DevOps and CI/CD usage, and the need for real-time visibility to ensure application reliability, user experience, and faster issue resolution across complex, distributed IT environments.
IDC Group Vice President Stephen Elliot said, “Observability platforms will need to fill that gap by making observability capabilities available to any MCP-compatible agent. By creating an intelligent feedback loop where AI systems become more observable and reliable, while observability platforms become more intelligent and proactive, the industry can equip enterprises with the confidence needed to innovate at speed.”
The necessity of enterprises to oversee complicated, distributed applications utilizing real-time performance analytics and automated diagnostics is driving the application performance monitoring market. For instance, in December 2025, Datadog released Bits AI which added AI-driven agents that automatically triage the incident and help with root-cause analysis as well as remediation insights in its APM suite, improving responsiveness in cloud-native environments. AI-APM increases the speed of solving issues, enhances the reliability of applications and maximizes their operations.
Additionally, the enterprises are progressively implementing the application performance monitoring solutions which offer real-time insights into the AI-native workloads to be able to track the model performance, response time and resource consumption. This is enabled to make the organizations streamline AI-based applications, assure reliability, and operational efficiency in the complex cloud-native environments. For instance, in June 2024, New Relic launched enhanced APM that allows real-time monitoring machine model performance, including model response times and token utilization, which allows enterprises to optimize the delivery of applications and ensure reliability in the fast-changing AI-driven world. AI-conscious APM promotes the reliability of the application, efficiency in the AI workload, and operations efficiency.
Adjacent opportunities to the global application performance monitoring (APM) market include observability platforms, cloud infrastructure monitoring, AI-powered IT operations (AIOps), log management and analytics, and digital experience monitoring (DEM) solutions. These markets are complimentary to APM in that they offer a deeper insight, issue detection, and improved user experience monitoring. Expansion of adjacent markets enhances the consumption of APM, operational efficiency, as well as increasing the visibility of enterprise performance.
Application Performance Monitoring Market Dynamics and Trends
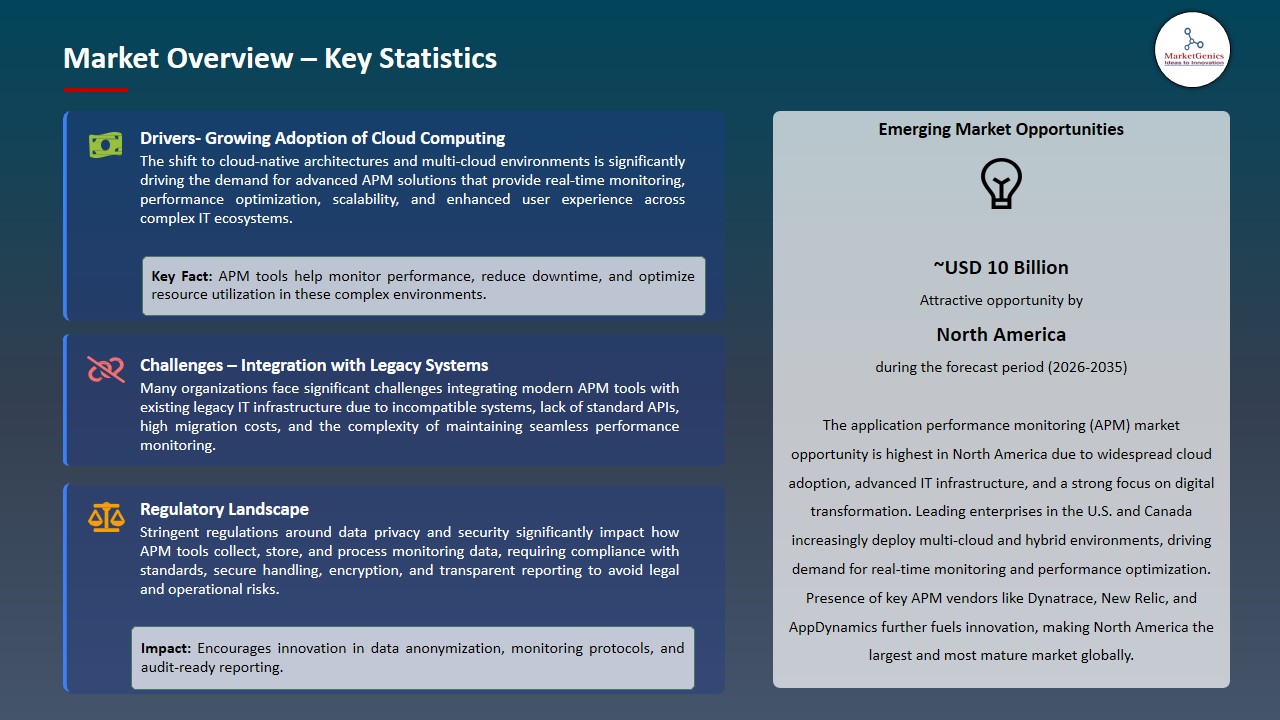
Driver: Increasing Adoption of Cloud‑Native APM Solutions for Hybrid Environments
-
The need for APM solutions that offer reliable, real-time visibility across dispersed services is growing rapidly as businesses utilize hybrid and multi-cloud architectures and have accelerated cloud migration. The complexity of cloud-native applications, including container orchestration, microservices, and dynamic scaling, renders conventional monitoring insufficient. The end-to-end tracing of transactions, mapping service dependencies, and automation of diagnostic features are now vital to the critical elements of APM platforms that guarantee the best performance.
- For instance, in 2025 Cisco AppDynamics added features to its APM platform that provided more capabilities in cloud-native systems, an automated microservice discovery and enhanced distributed tracing of Kubernetes clusters and serverless functions. These features allow the IT teams to quickly identify performance degradation and acquire knowledge about interdependencies of services in a running system, which helps to decrease the mean time to resolution.
- Hybrid environments become more popular, and cloud-native APM technologies provide the consistency of performance and can facilitate digital transformation.
- APM adoption of clouds leads to the operational performance and reliability in complicated enterprise infrastructures.
Restraint: High Implementation and Management Complexity Limits APM Scalability
-
Technical complexity, integration overhead, and scalability resource requirements impede enterprise operational value and implementation and management of APM solutions on large scales. APM platforms need to be carefully configured to prevent noise and optimize relevance by using mature APM platforms, instrumentation, service tagging, and alert policies.
- Large organizations with legacy systems and heterogeneous technology stacks might require bespoke connectors or middleware to bind APM into its fabric, extending configuration times and burdening IT departments. Firms facing limited funding and specialized skills struggle to maintain elaborate APM implementations, which generates inadequately used tools and patchy coverage.
- Smaller and mid-market businesses, especially, can be less concerned with complete adoption of APM in favor of more straightforward monitoring methods because of the perceived risk of overly burdening operations and continuous upkeep. These obstacles hinder thorough implementation and can push the achievement of performance insight to all services.
- The complexity of implementing it inhibits the scalability of APM and delays wider enterprise adoption.
Opportunity: Integration of APM with Customer Experience Monitoring for Business Value
-
APM vendors can also seize an opportunity to diversify into customer experience monitoring, which is a key aspect of performance monitoring by linking back-end application performance with front-end user experience metrics to provide end-to-end business intelligence. The current digital services need not only technical reliability but smooth user interactions since performance has a direct impact on conversions, customer retention, and revenue generation.
- Vendors can use the combination of APM and real-user monitoring, session analytics, and synthetic testing to offer a single view of infrastructure performance to end-user experience. For instance, in February 2026, Dynatrace announced that it developed its digital experience by combining APM with real-user and synthetic monitoring to allow enterprises to see consolidated performance and experience dashboards. This enables organizations to evaluate how latency and error in the backend affect the behavior of the user and some of the important business metrics.
- These integration places APM solutions in a position to deliver a greater business value providing IT and business stakeholders with attributes that they can act on in strategic decision-making.
- Integrated APM and customer experience monitoring enhances business performance intelligence and leads to enterprise adoption.
Key Trend: Rise of AI‑Driven Performance Insights and Predictive Analytics in APM Platforms
-
The application of AI and machine learning to facilitate automated anomaly detection, root-cause investigation, and predictive performance insights is a major development in the application performance market. With the growth of complexity of application ecosystems, the traditional rule-based alerting cannot effectively handle dynamically growing workloads and changing system behavior. Artificial Intelligence APM systems set performance standards, identify anomalies and autonomously suggest remediation measures with little to no human involvement.
- For instance, in January 2025 Datadog released AI-powered Bits AI as part of its APM offering, which includes automated incident triage, cross-service performance correlation, and AI-assisted cloud-native environment diagnostics. These features reduce alert fatigue, fasten problem-solving and even reveal the most significant problems. Predictive analytics also enable the organization to forecast performance bottlenecks before they impact the end-users thus providing proactive operational control.
- By integrating AI, APM platforms have become intelligent solutions that complement human expertise, improve service reliability, and can contribute to the overall operational efficiency of the enterprise.
- AI-based performance analytics increases operational efficiency, lessens the time to resolution, and increase the reliability of applications within multihybridized environments.
Application Performance Monitoring Market Analysis and Segmental Data
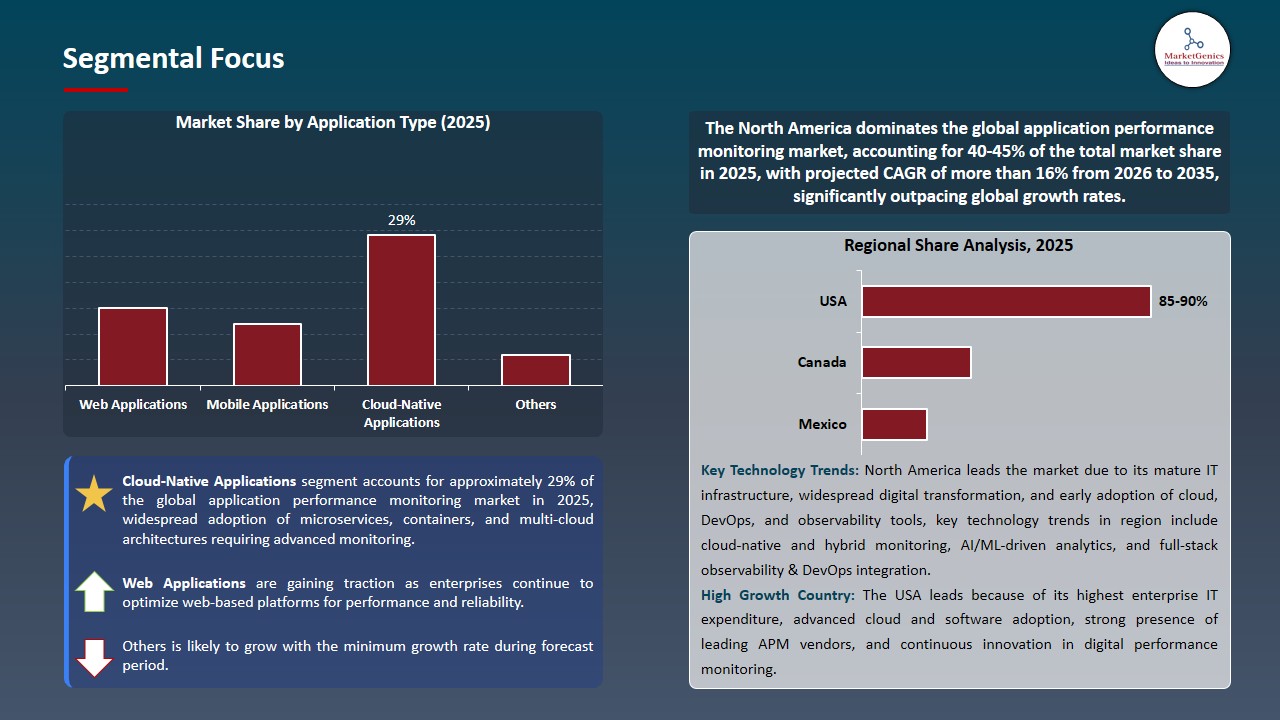
Cloud-Native Applications Dominate Global Application Performance Monitoring Market
-
The cloud-native applications segment dominates the global application performance monitoring market, since contemporary enterprise applications are becoming cloud-native, decentralized, and agile in code. These applications create complexity to transaction flows, service-dependent and performance bottlenecks which are not adequately addressed using traditional monitoring tools. The core features of APM platforms include real-time tracing, dependency mapping, and automatic diagnostics, which makes sure that applications perform and are reliable in terms of hybrid and multi-cloud environments.
- Large observability vendors are enhancing their APM products to meet this need; in Dynatrace, a cloud-native application monitoring will be showcasing full-stack, end-to-end visibility with AI-driven analytics and automatic discovery in Kubernetes, containers, and cloud services are used to help an enterprise quickly identify performance problems and optimize service delivery.
- The importance of APM in guaranteeing real-time application performance and reliability is significant enough to encourage broad observability usage and promote the digital transformation efforts of enterprises.
North America Leads Global Application Performance Monitoring Market Demand
-
North America leads the application performance monitoring market is driven by the large enterprise investments in digital transformation, monitoring of cloud-native architecture, and performance optimization projects. The major vendors like Datadog are constantly upgrading their cloud monitoring and APM services out of their U.S. base, with integrated, scalable solutions to distributed systems in support of large enterprise workloads.
- Furthermore, the area is supported by the existence of leading APM and observability vendors such as Dynatrace and New Relic based in North America that constantly advance with AI based diagnostics, distributed tracing, and real-time performance analytics to adjust to the intricate enterprise demands.
- These drivers cement the dominant role of North America in APM implementation and speed up the implementation of advanced performance monitoring on enterprise IT ecosystems.
Application Performance Monitoring Market Ecosystem
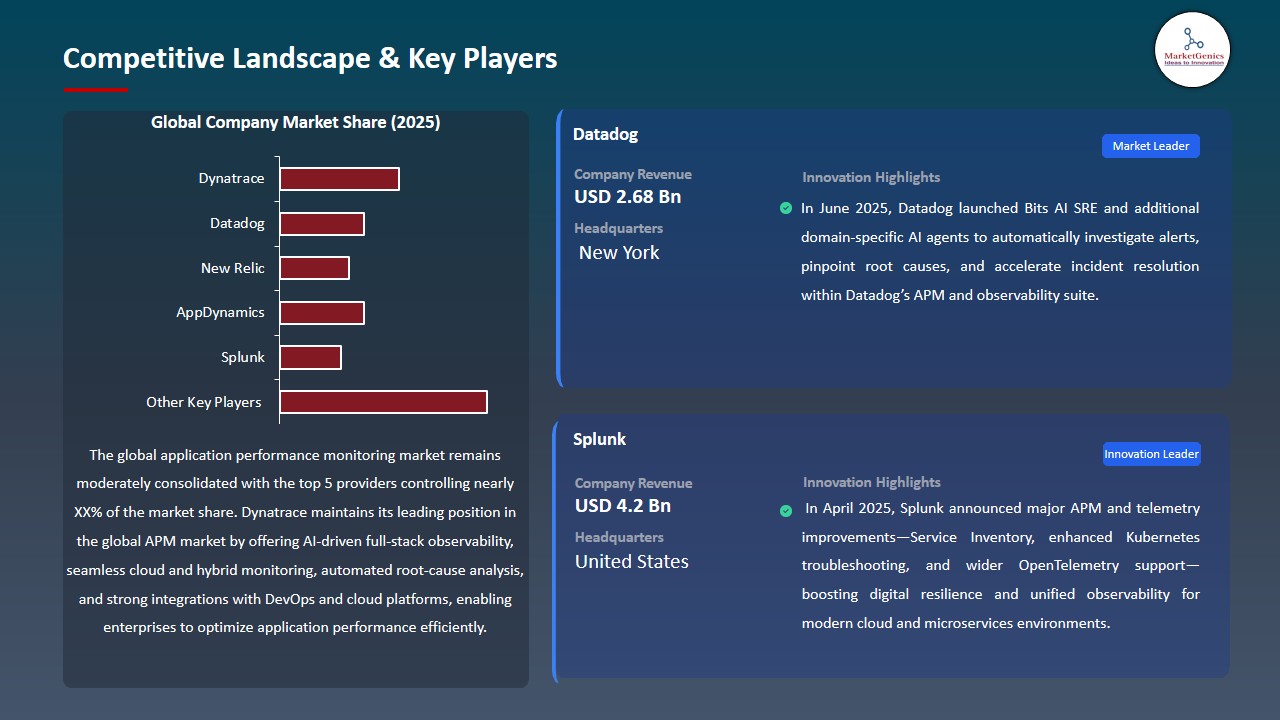
The global application performance monitoring market moderately consolidated, with leading players such as Dynatrace, Datadog, New Relic, AppDynamics (Cisco), and Splunk dominating through advanced AI-driven observability, automation, and full-stack monitoring technologies. These companies use cloud-native applications, real-time analytics, and smart automation to handle the increased complexity of the distributed, hybrid, and multi-cloud applications environment.
The major players are placing more emphasis on specialty and niche competencies to fuel innovation and market growth. Dynatrace focuses on autonomous observability that is driven by causal AI to provide accurate root cause analysis, and Datadog reinforces its platform with AI-driven incident management and developer-friendly monitoring platforms. New Relic is the innovator of open observability and AI-powered insights, AppDynamics is the company that is business-oriented APM and application security integration, and Splunk is the one that fosters data-driven observability with unified telemetry and analytics.
Government bodies, research institutions, and industry-led R&D initiatives play a vital role in advancing APM technologies. For instance, in March 2024, a federal digital modernization effort by the U.S. government assisted AI-based observability research to enhance resilience and performance of applications in cloud systems implemented in the public sector catalyzing the implementation of intelligent monitoring systems.
Product diversification, portfolio expansion and integrated solutions that promote operational efficiency and digital productivity is another market leader preoccupation. The vendors are integrating APM and infrastructure monitoring, log analytics, security, and user experience management more often to provide single observability platforms which minimize downtime and maximize use of resources.
These innovations are enhancing the reliability of the applications, minimizing the mean time of resolution, and operational resiliency of digitally intensive businesses.
Recent Development and Strategic Overview:
-
In November 2025, New Relic launched Agentic AI Monitoring and the AI Model Context Protocol (MCP) Server, enhancing its observability platform with advanced capabilities to provide deeper visibility, improved performance insights, and optimized operational workflows across interconnected AI systems and application layers.
- In June 2025, Datadog introduced Bits AI SRE along with domain-specific AI agents, enhancing its APM and observability portfolio by automating alert investigation, enabling faster root-cause analysis, and improving incident response efficiency across complex application environments.
Report Scope
|
Detail |
|
|
Market Size in 2025 |
USD 9.7 Bn |
|
Market Forecast Value in 2035 |
USD 34.7 Bn |
|
Growth Rate (CAGR) |
13.6% |
|
Forecast Period |
2026 – 2035 |
|
Historical Data Available for |
2021 – 2024 |
|
Market Size Units |
US$ Billion for Value |
|
Report Format |
Electronic (PDF) + Excel |
|
North America |
Europe |
Asia Pacific |
Middle East |
Africa |
South America |
|
|
|
|
|
|
|
Companies Covered |
|||||
|
|
|
|
|
|
Application Performance Monitoring Market Segmentation and Highlights
|
Segment |
Sub-segment |
|
Application Performance Monitoring Market, By Component |
|
|
Application Performance Monitoring Market, By Deployment Mode |
|
|
Application Performance Monitoring Market, By Organization Size |
|
|
Application Performance Monitoring Market, By Application Type |
|
|
Application Performance Monitoring Market, By Monitoring Type |
|
|
Application Performance Monitoring Market, By Technology |
|
|
Application Performance Monitoring Market, By Business Function |
|
|
Application Performance Monitoring Market, By Pricing Model |
|
|
Application Performance Monitoring Market, By End-use Industry |
|
Frequently Asked Questions
Table of Contents
- 1. Research Methodology and Assumptions
- 1.1. Definitions
- 1.2. Research Design and Approach
- 1.3. Data Collection Methods
- 1.4. Base Estimates and Calculations
- 1.5. Forecasting Models
- 1.5.1. Key Forecast Factors & Impact Analysis
- 1.6. Secondary Research
- 1.6.1. Open Sources
- 1.6.2. Paid Databases
- 1.6.3. Associations
- 1.7. Primary Research
- 1.7.1. Primary Sources
- 1.7.2. Primary Interviews with Stakeholders across Ecosystem
- 2. Executive Summary
- 2.1. Global Application Performance Monitoring Market Outlook
- 2.1.1. Application Performance Monitoring Market Size (Value - US$ Bn), and Forecasts, 2021-2035
- 2.1.2. Compounded Annual Growth Rate Analysis
- 2.1.3. Growth Opportunity Analysis
- 2.1.4. Segmental Share Analysis
- 2.1.5. Geographical Share Analysis
- 2.2. Market Analysis and Facts
- 2.3. Supply-Demand Analysis
- 2.4. Competitive Benchmarking
- 2.5. Go-to- Market Strategy
- 2.5.1. Customer/ End-use Industry Assessment
- 2.5.2. Growth Opportunity Data, 2026-2035
- 2.5.2.1. Regional Data
- 2.5.2.2. Country Data
- 2.5.2.3. Segmental Data
- 2.5.3. Identification of Potential Market Spaces
- 2.5.4. GAP Analysis
- 2.5.5. Potential Attractive Price Points
- 2.5.6. Prevailing Market Risks & Challenges
- 2.5.7. Preferred Sales & Marketing Strategies
- 2.5.8. Key Recommendations and Analysis
- 2.5.9. A Way Forward
- 2.1. Global Application Performance Monitoring Market Outlook
- 3. Industry Data and Premium Insights
- 3.1. Global Information Technology & Media Overview, 2025
- 3.1.1. Information Technology & Media Ecosystem Analysis
- 3.1.2. Key Trends for Information Technology & Media Industry
- 3.1.3. Regional Distribution for Information Technology & Media Industry
- 3.2. Supplier Customer Data
- 3.3. Technology Roadmap and Developments
- 3.4. Trade Analysis
- 3.4.1. Import & Export Analysis, 2025
- 3.4.2. Top Importing Countries
- 3.4.3. Top Exporting Countries
- 3.5. Trump Tariff Impact Analysis
- 3.5.1. Manufacturer
- 3.5.1.1. Based on the component & Raw material
- 3.5.2. Supply Chain
- 3.5.3. End Consumer
- 3.5.1. Manufacturer
- 3.6. Raw Material Analysis
- 3.1. Global Information Technology & Media Overview, 2025
- 4. Market Overview
- 4.1. Market Dynamics
- 4.1.1. Drivers
- 4.1.1.1. Increasing adoption of cloud computing and mobile/modern IT environments driving demand for APM tools
- 4.1.1.2. Rising complexity of applications (microservices, multi‑cloud) and need for real‑time observability and performance assurance
- 4.1.1.3. Growing focus on enhanced user experience and digital transformation initiatives
- 4.1.2. Restraints
- 4.1.2.1. High implementation and total cost of ownership
- 4.1.2.2. Integration challenges with existing legacy systems
- 4.1.1. Drivers
- 4.2. Key Trend Analysis
- 4.3. Regulatory Framework
- 4.3.1. Key Regulations, Norms, and Subsidies, by Key Countries
- 4.3.2. Tariffs and Standards
- 4.3.3. Impact Analysis of Regulations on the Market
- 4.4. Ecosystem Analysis
- 4.5. Porter’s Five Forces Analysis
- 4.6. PESTEL Analysis
- 4.7. Global Application Performance Monitoring Market Demand
- 4.7.1. Historical Market Size – in Value (US$ Bn), 2020-2024
- 4.7.2. Current and Future Market Size – in Value (US$ Bn), 2026–2035
- 4.7.2.1. Y-o-Y Growth Trends
- 4.7.2.2. Absolute $ Opportunity Assessment
- 4.1. Market Dynamics
- 5. Competition Landscape
- 5.1. Competition structure
- 5.1.1. Fragmented v/s consolidated
- 5.2. Company Share Analysis, 2025
- 5.2.1. Global Company Market Share
- 5.2.2. By Region
- 5.2.2.1. North America
- 5.2.2.2. Europe
- 5.2.2.3. Asia Pacific
- 5.2.2.4. Middle East
- 5.2.2.5. Africa
- 5.2.2.6. South America
- 5.3. Product Comparison Matrix
- 5.3.1. Specifications
- 5.3.2. Market Positioning
- 5.3.3. Pricing
- 5.1. Competition structure
- 6. Global Application Performance Monitoring Market Analysis, by Component
- 6.1. Key Segment Analysis
- 6.2. Application Performance Monitoring Market Size (Value - US$ Bn), Analysis, and Forecasts, Component, 2021-2035
- 6.2.1. Solutions
- 6.2.1.1. Application Discovery, Tracing, and Diagnostics
- 6.2.1.2. Application Analytics
- 6.2.1.3. Artificial Intelligence for IT Operations (AIOps)
- 6.2.1.4. Others
- 6.2.2. Services
- 6.2.2.1. Professional Services
- 6.2.2.1.1. Consulting Services
- 6.2.2.1.2. Integration & Implementation Services
- 6.2.2.1.3. Support & Maintenance Services
- 6.2.2.2. Managed Services
- 6.2.2.1. Professional Services
- 6.2.1. Solutions
- 7. Global Application Performance Monitoring Market Analysis, by Deployment Mode
- 7.1. Key Segment Analysis
- 7.2. Application Performance Monitoring Market Size (Value - US$ Bn), Analysis, and Forecasts, by Deployment Mode, 2021-2035
- 7.2.1. Cloud-based
- 7.2.1.1. Public Cloud
- 7.2.1.2. Private Cloud
- 7.2.1.3. Hybrid Cloud
- 7.2.2. On-premises
- 7.2.3. Hybrid
- 7.2.1. Cloud-based
- 8. Global Application Performance Monitoring Market Analysis, by Organization Size
- 8.1. Key Segment Analysis
- 8.2. Application Performance Monitoring Market Size (Value - US$ Bn), Analysis, and Forecasts, by Organization Size, 2021-2035
- 8.2.1. Large Enterprises
- 8.2.2. Small and Medium Enterprises (SMEs)
- 9. Global Application Performance Monitoring Market Analysis, by Application Type
- 9.1. Key Segment Analysis
- 9.2. Application Performance Monitoring Market Size (Value - US$ Bn), Analysis, and Forecasts, by Application Type, 2021-2035
- 9.2.1. Web Applications
- 9.2.2. Mobile Applications
- 9.2.3. Cloud-Native Applications
- 9.2.4. Legacy Applications
- 9.2.5. Microservices-based Applications
- 9.2.6. Others
- 10. Global Application Performance Monitoring Market Analysis, by Monitoring Type
- 10.1. Key Segment Analysis
- 10.2. Application Performance Monitoring Market Size (Value - US$ Bn), Analysis, and Forecasts, by Monitoring Type, 2021-2035
- 10.2.1. Real User Monitoring (RUM)
- 10.2.2. Synthetic Monitoring
- 10.2.3. Network Monitoring
- 10.2.4. Server Monitoring
- 10.2.5. Database Monitoring
- 10.2.6. Application Infrastructure Monitoring
- 10.2.7. Others
- 11. Global Application Performance Monitoring Market Analysis, by Technology
- 11.1. Key Segment Analysis
- 11.2. Application Performance Monitoring Market Size (Value - US$ Bn), Analysis, and Forecasts, by Technology, 2021-2035
- 11.2.1. Agent-based Monitoring
- 11.2.2. Agentless Monitoring
- 11.2.3. Hybrid Monitoring
- 12. Global Application Performance Monitoring Market Analysis, by Business Function
- 12.1. Key Segment Analysis
- 12.2. Application Performance Monitoring Market Size (Value - US$ Bn), Analysis, and Forecasts, by Business Function, 2021-2035
- 12.2.1. IT Operations
- 12.2.2. DevOps
- 12.2.3. Application Development
- 12.2.4. Business Analytics
- 12.2.5. Customer Experience Management
- 12.2.6. Others
- 13. Global Application Performance Monitoring Market Analysis, by Pricing Model
- 13.1. Key Segment Analysis
- 13.2. Application Performance Monitoring Market Size (Value - US$ Bn), Analysis, and Forecasts, by Pricing Model, 2021-2035
- 13.2.1. Subscription-based
- 13.2.2. Perpetual License
- 13.2.3. Pay-as-you-go
- 13.2.4. Freemium
- 14. Global Application Performance Monitoring Market Analysis, by End-use Industry
- 14.1. Key Segment Analysis
- 14.2. Application Performance Monitoring Market Size (Value - US$ Bn), Analysis, and Forecasts, by End-use Industry, 2021-2035
- 14.2.1. Banking, Financial Services, and Insurance (BFSI)
- 14.2.2. IT & Telecommunications
- 14.2.3. Retail & E-commerce
- 14.2.4. Healthcare & Life Sciences
- 14.2.5. Manufacturing
- 14.2.6. Media & Entertainment
- 14.2.7. Government & Public Sector
- 14.2.8. Education
- 14.2.9. Energy & Utilities
- 14.2.10. Travel & Hospitality
- 14.2.11. Transportation & Logistics
- 14.2.12. Others
- 15. Global Application Performance Monitoring Market Analysis, by Region
- 15.1. Key Findings
- 15.2. Application Performance Monitoring Market Size (Value - US$ Bn), Analysis, and Forecasts, by Region, 2021-2035
- 15.2.1. North America
- 15.2.2. Europe
- 15.2.3. Asia Pacific
- 15.2.4. Middle East
- 15.2.5. Africa
- 15.2.6. South America
- 16. North America Application Performance Monitoring Market Analysis
- 16.1. Key Segment Analysis
- 16.2. Regional Snapshot
- 16.3. North America Application Performance Monitoring Market Size (Value - US$ Bn), Analysis, and Forecasts, 2021-2035
- 16.3.1. Component
- 16.3.2. Deployment Mode
- 16.3.3. Organization Size
- 16.3.4. Application Type
- 16.3.5. Monitoring Type
- 16.3.6. Technology
- 16.3.7. Business Function
- 16.3.8. Pricing Model
- 16.3.9. End-use Industry
- 16.3.10. Country
- 16.3.10.1. USA
- 16.3.10.2. Canada
- 16.3.10.3. Mexico
- 16.4. USA Application Performance Monitoring Market
- 16.4.1. Country Segmental Analysis
- 16.4.2. Component
- 16.4.3. Deployment Mode
- 16.4.4. Organization Size
- 16.4.5. Application Type
- 16.4.6. Monitoring Type
- 16.4.7. Technology
- 16.4.8. Business Function
- 16.4.9. Pricing Model
- 16.4.10. End-use Industry
- 16.5. Canada Application Performance Monitoring Market
- 16.5.1. Country Segmental Analysis
- 16.5.2. Component
- 16.5.3. Deployment Mode
- 16.5.4. Organization Size
- 16.5.5. Application Type
- 16.5.6. Monitoring Type
- 16.5.7. Technology
- 16.5.8. Business Function
- 16.5.9. Pricing Model
- 16.5.10. End-use Industry
- 16.6. Mexico Application Performance Monitoring Market
- 16.6.1. Country Segmental Analysis
- 16.6.2. Component
- 16.6.3. Deployment Mode
- 16.6.4. Organization Size
- 16.6.5. Application Type
- 16.6.6. Monitoring Type
- 16.6.7. Technology
- 16.6.8. Business Function
- 16.6.9. Pricing Model
- 16.6.10. End-use Industry
- 17. Europe Application Performance Monitoring Market Analysis
- 17.1. Key Segment Analysis
- 17.2. Regional Snapshot
- 17.3. Europe Application Performance Monitoring Market Size (Value - US$ Bn), Analysis, and Forecasts, 2021-2035
- 17.3.1. Component
- 17.3.2. Deployment Mode
- 17.3.3. Organization Size
- 17.3.4. Application Type
- 17.3.5. Monitoring Type
- 17.3.6. Technology
- 17.3.7. Business Function
- 17.3.8. Pricing Model
- 17.3.9. End-use Industry
- 17.3.10. Country
- 17.3.10.1. Germany
- 17.3.10.2. United Kingdom
- 17.3.10.3. France
- 17.3.10.4. Italy
- 17.3.10.5. Spain
- 17.3.10.6. Netherlands
- 17.3.10.7. Nordic Countries
- 17.3.10.8. Poland
- 17.3.10.9. Russia & CIS
- 17.3.10.10. Rest of Europe
- 17.4. Germany Application Performance Monitoring Market
- 17.4.1. Country Segmental Analysis
- 17.4.2. Component
- 17.4.3. Deployment Mode
- 17.4.4. Organization Size
- 17.4.5. Application Type
- 17.4.6. Monitoring Type
- 17.4.7. Technology
- 17.4.8. Business Function
- 17.4.9. Pricing Model
- 17.4.10. End-use Industry
- 17.5. United Kingdom Application Performance Monitoring Market
- 17.5.1. Country Segmental Analysis
- 17.5.2. Component
- 17.5.3. Deployment Mode
- 17.5.4. Organization Size
- 17.5.5. Application Type
- 17.5.6. Monitoring Type
- 17.5.7. Technology
- 17.5.8. Business Function
- 17.5.9. Pricing Model
- 17.5.10. End-use Industry
- 17.6. France Application Performance Monitoring Market
- 17.6.1. Country Segmental Analysis
- 17.6.2. Component
- 17.6.3. Deployment Mode
- 17.6.4. Organization Size
- 17.6.5. Application Type
- 17.6.6. Monitoring Type
- 17.6.7. Technology
- 17.6.8. Business Function
- 17.6.9. Pricing Model
- 17.6.10. End-use Industry
- 17.7. Italy Application Performance Monitoring Market
- 17.7.1. Country Segmental Analysis
- 17.7.2. Component
- 17.7.3. Deployment Mode
- 17.7.4. Organization Size
- 17.7.5. Application Type
- 17.7.6. Monitoring Type
- 17.7.7. Technology
- 17.7.8. Business Function
- 17.7.9. Pricing Model
- 17.7.10. End-use Industry
- 17.8. Spain Application Performance Monitoring Market
- 17.8.1. Country Segmental Analysis
- 17.8.2. Component
- 17.8.3. Deployment Mode
- 17.8.4. Organization Size
- 17.8.5. Application Type
- 17.8.6. Monitoring Type
- 17.8.7. Technology
- 17.8.8. Business Function
- 17.8.9. Pricing Model
- 17.8.10. End-use Industry
- 17.9. Netherlands Application Performance Monitoring Market
- 17.9.1. Country Segmental Analysis
- 17.9.2. Component
- 17.9.3. Deployment Mode
- 17.9.4. Organization Size
- 17.9.5. Application Type
- 17.9.6. Monitoring Type
- 17.9.7. Technology
- 17.9.8. Business Function
- 17.9.9. Pricing Model
- 17.9.10. End-use Industry
- 17.10. Nordic Countries Application Performance Monitoring Market
- 17.10.1. Country Segmental Analysis
- 17.10.2. Component
- 17.10.3. Deployment Mode
- 17.10.4. Organization Size
- 17.10.5. Application Type
- 17.10.6. Monitoring Type
- 17.10.7. Technology
- 17.10.8. Business Function
- 17.10.9. Pricing Model
- 17.10.10. End-use Industry
- 17.11. Poland Application Performance Monitoring Market
- 17.11.1. Country Segmental Analysis
- 17.11.2. Component
- 17.11.3. Deployment Mode
- 17.11.4. Organization Size
- 17.11.5. Application Type
- 17.11.6. Monitoring Type
- 17.11.7. Technology
- 17.11.8. Business Function
- 17.11.9. Pricing Model
- 17.11.10. End-use Industry
- 17.12. Russia & CIS Application Performance Monitoring Market
- 17.12.1. Country Segmental Analysis
- 17.12.2. Component
- 17.12.3. Deployment Mode
- 17.12.4. Organization Size
- 17.12.5. Application Type
- 17.12.6. Monitoring Type
- 17.12.7. Technology
- 17.12.8. Business Function
- 17.12.9. Pricing Model
- 17.12.10. End-use Industry
- 17.13. Rest of Europe Application Performance Monitoring Market
- 17.13.1. Country Segmental Analysis
- 17.13.2. Component
- 17.13.3. Deployment Mode
- 17.13.4. Organization Size
- 17.13.5. Application Type
- 17.13.6. Monitoring Type
- 17.13.7. Technology
- 17.13.8. Business Function
- 17.13.9. Pricing Model
- 17.13.10. End-use Industry
- 18. Asia Pacific Application Performance Monitoring Market Analysis
- 18.1. Key Segment Analysis
- 18.2. Regional Snapshot
- 18.3. Asia Pacific Application Performance Monitoring Market Size (Value - US$ Bn), Analysis, and Forecasts, 2021-2035
- 18.3.1. Component
- 18.3.2. Deployment Mode
- 18.3.3. Organization Size
- 18.3.4. Application Type
- 18.3.5. Monitoring Type
- 18.3.6. Technology
- 18.3.7. Business Function
- 18.3.8. Pricing Model
- 18.3.9. End-use Industry
- 18.3.10. Country
- 18.3.10.1. China
- 18.3.10.2. India
- 18.3.10.3. Japan
- 18.3.10.4. South Korea
- 18.3.10.5. Australia and New Zealand
- 18.3.10.6. Indonesia
- 18.3.10.7. Malaysia
- 18.3.10.8. Thailand
- 18.3.10.9. Vietnam
- 18.3.10.10. Rest of Asia Pacific
- 18.4. China Application Performance Monitoring Market
- 18.4.1. Country Segmental Analysis
- 18.4.2. Component
- 18.4.3. Deployment Mode
- 18.4.4. Organization Size
- 18.4.5. Application Type
- 18.4.6. Monitoring Type
- 18.4.7. Technology
- 18.4.8. Business Function
- 18.4.9. Pricing Model
- 18.4.10. End-use Industry
- 18.5. India Application Performance Monitoring Market
- 18.5.1. Country Segmental Analysis
- 18.5.2. Component
- 18.5.3. Deployment Mode
- 18.5.4. Organization Size
- 18.5.5. Application Type
- 18.5.6. Monitoring Type
- 18.5.7. Technology
- 18.5.8. Business Function
- 18.5.9. Pricing Model
- 18.5.10. End-use Industry
- 18.6. Japan Application Performance Monitoring Market
- 18.6.1. Country Segmental Analysis
- 18.6.2. Component
- 18.6.3. Deployment Mode
- 18.6.4. Organization Size
- 18.6.5. Application Type
- 18.6.6. Monitoring Type
- 18.6.7. Technology
- 18.6.8. Business Function
- 18.6.9. Pricing Model
- 18.6.10. End-use Industry
- 18.7. South Korea Application Performance Monitoring Market
- 18.7.1. Country Segmental Analysis
- 18.7.2. Component
- 18.7.3. Deployment Mode
- 18.7.4. Organization Size
- 18.7.5. Application Type
- 18.7.6. Monitoring Type
- 18.7.7. Technology
- 18.7.8. Business Function
- 18.7.9. Pricing Model
- 18.7.10. End-use Industry
- 18.8. Australia and New Zealand Application Performance Monitoring Market
- 18.8.1. Country Segmental Analysis
- 18.8.2. Component
- 18.8.3. Deployment Mode
- 18.8.4. Organization Size
- 18.8.5. Application Type
- 18.8.6. Monitoring Type
- 18.8.7. Technology
- 18.8.8. Business Function
- 18.8.9. Pricing Model
- 18.8.10. End-use Industry
- 18.9. Indonesia Application Performance Monitoring Market
- 18.9.1. Country Segmental Analysis
- 18.9.2. Component
- 18.9.3. Deployment Mode
- 18.9.4. Organization Size
- 18.9.5. Application Type
- 18.9.6. Monitoring Type
- 18.9.7. Technology
- 18.9.8. Business Function
- 18.9.9. Pricing Model
- 18.9.10. End-use Industry
- 18.10. Malaysia Application Performance Monitoring Market
- 18.10.1. Country Segmental Analysis
- 18.10.2. Component
- 18.10.3. Deployment Mode
- 18.10.4. Organization Size
- 18.10.5. Application Type
- 18.10.6. Monitoring Type
- 18.10.7. Technology
- 18.10.8. Business Function
- 18.10.9. Pricing Model
- 18.10.10. End-use Industry
- 18.11. Thailand Application Performance Monitoring Market
- 18.11.1. Country Segmental Analysis
- 18.11.2. Component
- 18.11.3. Deployment Mode
- 18.11.4. Organization Size
- 18.11.5. Application Type
- 18.11.6. Monitoring Type
- 18.11.7. Technology
- 18.11.8. Business Function
- 18.11.9. Pricing Model
- 18.11.10. End-use Industry
- 18.12. Vietnam Application Performance Monitoring Market
- 18.12.1. Country Segmental Analysis
- 18.12.2. Component
- 18.12.3. Deployment Mode
- 18.12.4. Organization Size
- 18.12.5. Application Type
- 18.12.6. Monitoring Type
- 18.12.7. Technology
- 18.12.8. Business Function
- 18.12.9. Pricing Model
- 18.12.10. End-use Industry
- 18.13. Rest of Asia Pacific Application Performance Monitoring Market
- 18.13.1. Country Segmental Analysis
- 18.13.2. Component
- 18.13.3. Deployment Mode
- 18.13.4. Organization Size
- 18.13.5. Application Type
- 18.13.6. Monitoring Type
- 18.13.7. Technology
- 18.13.8. Business Function
- 18.13.9. Pricing Model
- 18.13.10. End-use Industry
- 19. Middle East Application Performance Monitoring Market Analysis
- 19.1. Key Segment Analysis
- 19.2. Regional Snapshot
- 19.3. Middle East Application Performance Monitoring Market Size (Value - US$ Bn), Analysis, and Forecasts, 2021-2035
- 19.3.1. Component
- 19.3.2. Deployment Mode
- 19.3.3. Organization Size
- 19.3.4. Application Type
- 19.3.5. Monitoring Type
- 19.3.6. Technology
- 19.3.7. Business Function
- 19.3.8. Pricing Model
- 19.3.9. End-use Industry
- 19.3.10. Country
- 19.3.10.1. Turkey
- 19.3.10.2. UAE
- 19.3.10.3. Saudi Arabia
- 19.3.10.4. Israel
- 19.3.10.5. Rest of Middle East
- 19.4. Turkey Application Performance Monitoring Market
- 19.4.1. Country Segmental Analysis
- 19.4.2. Component
- 19.4.3. Deployment Mode
- 19.4.4. Organization Size
- 19.4.5. Application Type
- 19.4.6. Monitoring Type
- 19.4.7. Technology
- 19.4.8. Business Function
- 19.4.9. Pricing Model
- 19.4.10. End-use Industry
- 19.5. UAE Application Performance Monitoring Market
- 19.5.1. Country Segmental Analysis
- 19.5.2. Component
- 19.5.3. Deployment Mode
- 19.5.4. Organization Size
- 19.5.5. Application Type
- 19.5.6. Monitoring Type
- 19.5.7. Technology
- 19.5.8. Business Function
- 19.5.9. Pricing Model
- 19.5.10. End-use Industry
- 19.6. Saudi Arabia Application Performance Monitoring Market
- 19.6.1. Country Segmental Analysis
- 19.6.2. Component
- 19.6.3. Deployment Mode
- 19.6.4. Organization Size
- 19.6.5. Application Type
- 19.6.6. Monitoring Type
- 19.6.7. Technology
- 19.6.8. Business Function
- 19.6.9. Pricing Model
- 19.6.10. End-use Industry
- 19.7. Israel Application Performance Monitoring Market
- 19.7.1. Country Segmental Analysis
- 19.7.2. Component
- 19.7.3. Deployment Mode
- 19.7.4. Organization Size
- 19.7.5. Application Type
- 19.7.6. Monitoring Type
- 19.7.7. Technology
- 19.7.8. Business Function
- 19.7.9. Pricing Model
- 19.7.10. End-use Industry
- 19.8. Rest of Middle East Application Performance Monitoring Market
- 19.8.1. Country Segmental Analysis
- 19.8.2. Component
- 19.8.3. Deployment Mode
- 19.8.4. Organization Size
- 19.8.5. Application Type
- 19.8.6. Monitoring Type
- 19.8.7. Technology
- 19.8.8. Business Function
- 19.8.9. Pricing Model
- 19.8.10. End-use Industry
- 20. Africa Application Performance Monitoring Market Analysis
- 20.1. Key Segment Analysis
- 20.2. Regional Snapshot
- 20.3. Africa Application Performance Monitoring Market Size (Value - US$ Bn), Analysis, and Forecasts, 2021-2035
- 20.3.1. Component
- 20.3.2. Deployment Mode
- 20.3.3. Organization Size
- 20.3.4. Application Type
- 20.3.5. Monitoring Type
- 20.3.6. Technology
- 20.3.7. Business Function
- 20.3.8. Pricing Model
- 20.3.9. End-use Industry
- 20.3.10. Country
- 20.3.10.1. South Africa
- 20.3.10.2. Egypt
- 20.3.10.3. Nigeria
- 20.3.10.4. Algeria
- 20.3.10.5. Rest of Africa
- 20.4. South Africa Application Performance Monitoring Market
- 20.4.1. Country Segmental Analysis
- 20.4.2. Component
- 20.4.3. Deployment Mode
- 20.4.4. Organization Size
- 20.4.5. Application Type
- 20.4.6. Monitoring Type
- 20.4.7. Technology
- 20.4.8. Business Function
- 20.4.9. Pricing Model
- 20.4.10. End-use Industry
- 20.5. Egypt Application Performance Monitoring Market
- 20.5.1. Country Segmental Analysis
- 20.5.2. Component
- 20.5.3. Deployment Mode
- 20.5.4. Organization Size
- 20.5.5. Application Type
- 20.5.6. Monitoring Type
- 20.5.7. Technology
- 20.5.8. Business Function
- 20.5.9. Pricing Model
- 20.5.10. End-use Industry
- 20.6. Nigeria Application Performance Monitoring Market
- 20.6.1. Country Segmental Analysis
- 20.6.2. Component
- 20.6.3. Deployment Mode
- 20.6.4. Organization Size
- 20.6.5. Application Type
- 20.6.6. Monitoring Type
- 20.6.7. Technology
- 20.6.8. Business Function
- 20.6.9. Pricing Model
- 20.6.10. End-use Industry
- 20.7. Algeria Application Performance Monitoring Market
- 20.7.1. Country Segmental Analysis
- 20.7.2. Component
- 20.7.3. Deployment Mode
- 20.7.4. Organization Size
- 20.7.5. Application Type
- 20.7.6. Monitoring Type
- 20.7.7. Technology
- 20.7.8. Business Function
- 20.7.9. Pricing Model
- 20.7.10. End-use Industry
- 20.8. Rest of Africa Application Performance Monitoring Market
- 20.8.1. Country Segmental Analysis
- 20.8.2. Component
- 20.8.3. Deployment Mode
- 20.8.4. Organization Size
- 20.8.5. Application Type
- 20.8.6. Monitoring Type
- 20.8.7. Technology
- 20.8.8. Business Function
- 20.8.9. Pricing Model
- 20.8.10. End-use Industry
- 21. South America Application Performance Monitoring Market Analysis
- 21.1. Key Segment Analysis
- 21.2. Regional Snapshot
- 21.3. South America Application Performance Monitoring Market Size (Value - US$ Bn), Analysis, and Forecasts, 2021-2035
- 21.3.1. Component
- 21.3.2. Deployment Mode
- 21.3.3. Organization Size
- 21.3.4. Application Type
- 21.3.5. Monitoring Type
- 21.3.6. Technology
- 21.3.7. Business Function
- 21.3.8. Pricing Model
- 21.3.9. End-use Industry
- 21.3.10. Country
- 21.3.10.1. Brazil
- 21.3.10.2. Argentina
- 21.3.10.3. Rest of South America
- 21.4. Brazil Application Performance Monitoring Market
- 21.4.1. Country Segmental Analysis
- 21.4.2. Component
- 21.4.3. Deployment Mode
- 21.4.4. Organization Size
- 21.4.5. Application Type
- 21.4.6. Monitoring Type
- 21.4.7. Technology
- 21.4.8. Business Function
- 21.4.9. Pricing Model
- 21.4.10. End-use Industry
- 21.5. Argentina Application Performance Monitoring Market
- 21.5.1. Country Segmental Analysis
- 21.5.2. Component
- 21.5.3. Deployment Mode
- 21.5.4. Organization Size
- 21.5.5. Application Type
- 21.5.6. Monitoring Type
- 21.5.7. Technology
- 21.5.8. Business Function
- 21.5.9. Pricing Model
- 21.5.10. End-use Industry
- 21.6. Rest of South America Application Performance Monitoring Market
- 21.6.1. Country Segmental Analysis
- 21.6.2. Component
- 21.6.3. Deployment Mode
- 21.6.4. Organization Size
- 21.6.5. Application Type
- 21.6.6. Monitoring Type
- 21.6.7. Technology
- 21.6.8. Business Function
- 21.6.9. Pricing Model
- 21.6.10. End-use Industry
- 22. Key Players/ Company Profile
- 22.1. AppDynamics (Cisco)
- 22.1.1. Company Details/ Overview
- 22.1.2. Company Financials
- 22.1.3. Key Customers and Competitors
- 22.1.4. Business/ Industry Portfolio
- 22.1.5. Product Portfolio/ Specification Details
- 22.1.6. Pricing Data
- 22.1.7. Strategic Overview
- 22.1.8. Recent Developments
- 22.2. Aternity
- 22.3. BMC Software
- 22.4. Broadcom (CA Technologies)
- 22.5. Datadog
- 22.6. Dynatrace
- 22.7. IBM Corporation
- 22.8. LogicMonitor
- 22.9. ManageEngine
- 22.10. Microsoft Corporation
- 22.11. New Relic
- 22.12. Oracle Corporation
- 22.13. Progress Software Corporation
- 22.14. Riverbed Technology
- 22.15. ServiceNow
- 22.16. Site24x7
- 22.17. SolarWinds
- 22.18. Splunk
- 22.19. Sumo Logic
- 22.20. Other Key Players
- 22.1. AppDynamics (Cisco)
Note* - This is just tentative list of players. While providing the report, we will cover more number of players based on their revenue and share for each geography
Research Design
Our research design integrates both demand-side and supply-side analysis through a balanced combination of primary and secondary research methodologies. By utilizing both bottom-up and top-down approaches alongside rigorous data triangulation methods, we deliver robust market intelligence that supports strategic decision-making.
MarketGenics' comprehensive research design framework ensures the delivery of accurate, reliable, and actionable market intelligence. Through the integration of multiple research approaches, rigorous validation processes, and expert analysis, we provide our clients with the insights needed to make informed strategic decisions and capitalize on market opportunities.

MarketGenics leverages a dedicated industry panel of experts and a comprehensive suite of paid databases to effectively collect, consolidate, and analyze market intelligence.
Our approach has consistently proven to be reliable and effective in generating accurate market insights, identifying key industry trends, and uncovering emerging business opportunities.
Through both primary and secondary research, we capture and analyze critical company-level data such as manufacturing footprints, including technical centers, R&D facilities, sales offices, and headquarters.
Our expert panel further enhances our ability to estimate market size for specific brands based on validated field-level intelligence.
Our data mining techniques incorporate both parametric and non-parametric methods, allowing for structured data collection, sorting, processing, and cleaning.
Demand projections are derived from large-scale data sets analyzed through proprietary algorithms, culminating in robust and reliable market sizing.
Research Approach
The bottom-up approach builds market estimates by starting with the smallest addressable market units and systematically aggregating them to create comprehensive market size projections.
This method begins with specific, granular data points and builds upward to create the complete market landscape.
Customer Analysis → Segmental Analysis → Geographical Analysis
The top-down approach starts with the broadest possible market data and systematically narrows it down through a series of filters and assumptions to arrive at specific market segments or opportunities.
This method begins with the big picture and works downward to increasingly specific market slices.
TAM → SAM → SOM


Research Methods
Desk / Secondary Research
While analysing the market, we extensively study secondary sources, directories, and databases to identify and collect information useful for this technical, market-oriented, and commercial report. Secondary sources that we utilize are not only the public sources, but it is a combination of Open Source, Associations, Paid Databases, MG Repository & Knowledgebase, and others.
- Company websites, annual reports, financial reports, broker reports, and investor presentations
- National government documents, statistical databases and reports
- News articles, press releases and web-casts specific to the companies operating in the market, Magazines, reports, and others
- We gather information from commercial data sources for deriving company specific data such as segmental revenue, share for geography, product revenue, and others
- Internal and external proprietary databases (industry-specific), relevant patent, and regulatory databases
- Governing Bodies, Government Organizations
- Relevant Authorities, Country-specific Associations for Industries
We also employ the model mapping approach to estimate the product level market data through the players' product portfolio
Primary Research
Primary research/ interviews is vital in analyzing the market. Most of the cases involves paid primary interviews. Primary sources include primary interviews through e-mail interactions, telephonic interviews, surveys as well as face-to-face interviews with the different stakeholders across the value chain including several industry experts.
| Type of Respondents | Number of Primaries |
|---|---|
| Tier 2/3 Suppliers | ~20 |
| Tier 1 Suppliers | ~25 |
| End-users | ~25 |
| Industry Expert/ Panel/ Consultant | ~30 |
| Total | ~100 |
MG Knowledgebase
• Repository of industry blog, newsletter and case studies
• Online platform covering detailed market reports, and company profiles
Forecasting Factors and Models
Forecasting Factors
- Historical Trends – Past market patterns, cycles, and major events that shaped how markets behave over time. Understanding past trends helps predict future behavior.
- Industry Factors – Specific characteristics of the industry like structure, regulations, and innovation cycles that affect market dynamics.
- Macroeconomic Factors – Economic conditions like GDP growth, inflation, and employment rates that affect how much money people have to spend.
- Demographic Factors – Population characteristics like age, income, and location that determine who can buy your product.
- Technology Factors – How quickly people adopt new technology and how much technology infrastructure exists.
- Regulatory Factors – Government rules, laws, and policies that can help or restrict market growth.
- Competitive Factors – Analyzing competition structure such as degree of competition and bargaining power of buyers and suppliers.
Forecasting Models / Techniques
Multiple Regression Analysis
- Identify and quantify factors that drive market changes
- Statistical modeling to establish relationships between market drivers and outcomes
Time Series Analysis – Seasonal Patterns
- Understand regular cyclical patterns in market demand
- Advanced statistical techniques to separate trend, seasonal, and irregular components
Time Series Analysis – Trend Analysis
- Identify underlying market growth patterns and momentum
- Statistical analysis of historical data to project future trends
Expert Opinion – Expert Interviews
- Gather deep industry insights and contextual understanding
- In-depth interviews with key industry stakeholders
Multi-Scenario Development
- Prepare for uncertainty by modeling different possible futures
- Creating optimistic, pessimistic, and most likely scenarios
Time Series Analysis – Moving Averages
- Sophisticated forecasting for complex time series data
- Auto-regressive integrated moving average models with seasonal components
Econometric Models
- Apply economic theory to market forecasting
- Sophisticated economic models that account for market interactions
Expert Opinion – Delphi Method
- Harness collective wisdom of industry experts
- Structured, multi-round expert consultation process
Monte Carlo Simulation
- Quantify uncertainty and probability distributions
- Thousands of simulations with varying input parameters
Research Analysis
Our research framework is built upon the fundamental principle of validating market intelligence from both demand and supply perspectives. This dual-sided approach ensures comprehensive market understanding and reduces the risk of single-source bias.
Demand-Side Analysis: We understand end-user/application behavior, preferences, and market needs along with the penetration of the product for specific application.
Supply-Side Analysis: We estimate overall market revenue, analyze the segmental share along with industry capacity, competitive landscape, and market structure.
Validation & Evaluation
Data triangulation is a validation technique that uses multiple methods, sources, or perspectives to examine the same research question, thereby increasing the credibility and reliability of research findings. In market research, triangulation serves as a quality assurance mechanism that helps identify and minimize bias, validate assumptions, and ensure accuracy in market estimates.
- Data Source Triangulation – Using multiple data sources to examine the same phenomenon
- Methodological Triangulation – Using multiple research methods to study the same research question
- Investigator Triangulation – Using multiple researchers or analysts to examine the same data
- Theoretical Triangulation – Using multiple theoretical perspectives to interpret the same data

Custom Market Research Services
We will customise the research for you, in case the report listed above does not meet your requirements.
Get 10% Free Customisation