Augmented Reality Market Size, Share & Trends Analysis Report by Component (Hardware, Software, Services), Technology, Device Type, Deployment Mode, Organization Size, Content Type, Pricing Model, End-User Industry and Geography (North America, Europe, Asia Pacific, Middle East, Africa, and South America) – Global Industry Data, Trends, and Forecasts, 2026–2035
|
Market Structure & Evolution |
|
|
Segmental Data Insights |
|
|
Demand Trends |
|
|
Competitive Landscape |
|
|
Strategic Development |
|
|
Future Outlook & Opportunities |
|
Augmented Reality Market Size, Share, and Growth
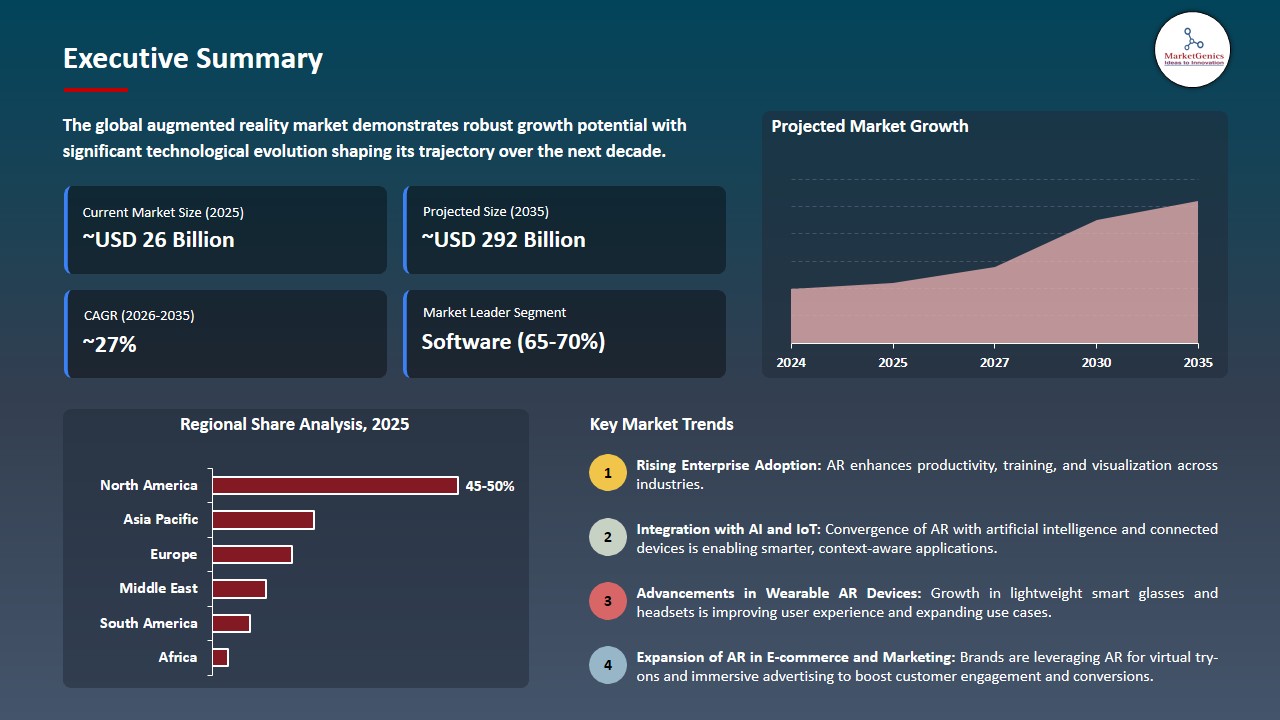
The global augmented reality market is experiencing robust growth, with its estimated value of USD 26.4 billion in the year 2025 and USD 292.5 billion by 2035, registering a CAGR of 27.2% during the forecast period. The augmented reality market experienced robust global growth, fueled by advancements in immersive technologies and widespread adoption by enterprises.
Apple Inc. CEO Tim Cook remarked, "Augmented reality is going to be as big of an idea as the smartphone," pointing out that augmented reality has the potential to fundamentally change the way people use digital content. Indeed, AR is set to enable more immersive experiences, thereby greatly increasing user engagement, and it will revolutionize the application of technologies not only in consumer but also in business markets.
Real-time visualization, interaction, and collaboration have greatly improved owing to new augmented reality delivery platforms and devices that enhance these capabilities. For instance, in 2024, Apple launched its Vision Pro headset, which combines spatial computing and AR technology for use by both consumers and businesses alike.
Demand for augmented reality solutions will continue to grow because of rapid growth in interactive experiences across all industries such as retail, healthcare, and manufacturing. Many businesses - including PTC - are now providing more AR solutions, including the Vuforia platform, for many different use cases (remote support, AR glasses, and process optimization, etc.).
The combination of AI and cloud computing has enabled enterprises to adopt and scale augmented reality solutions quickly and cost-effectively; however, data security is still an important consideration when implementing any enterprise technology.
There are numerous markets that have complementary technologies to augmented reality such as smart wearables; 3D content development; spatial computing; immersive training solutions; and digital twins. By leveraging any of these adjacent markets, organizations create better engagement with their customers, enhance their capabilities across their organization, and ultimately, create new sources of revenue across multiple industries.
Augmented Reality Market Dynamics and Trends
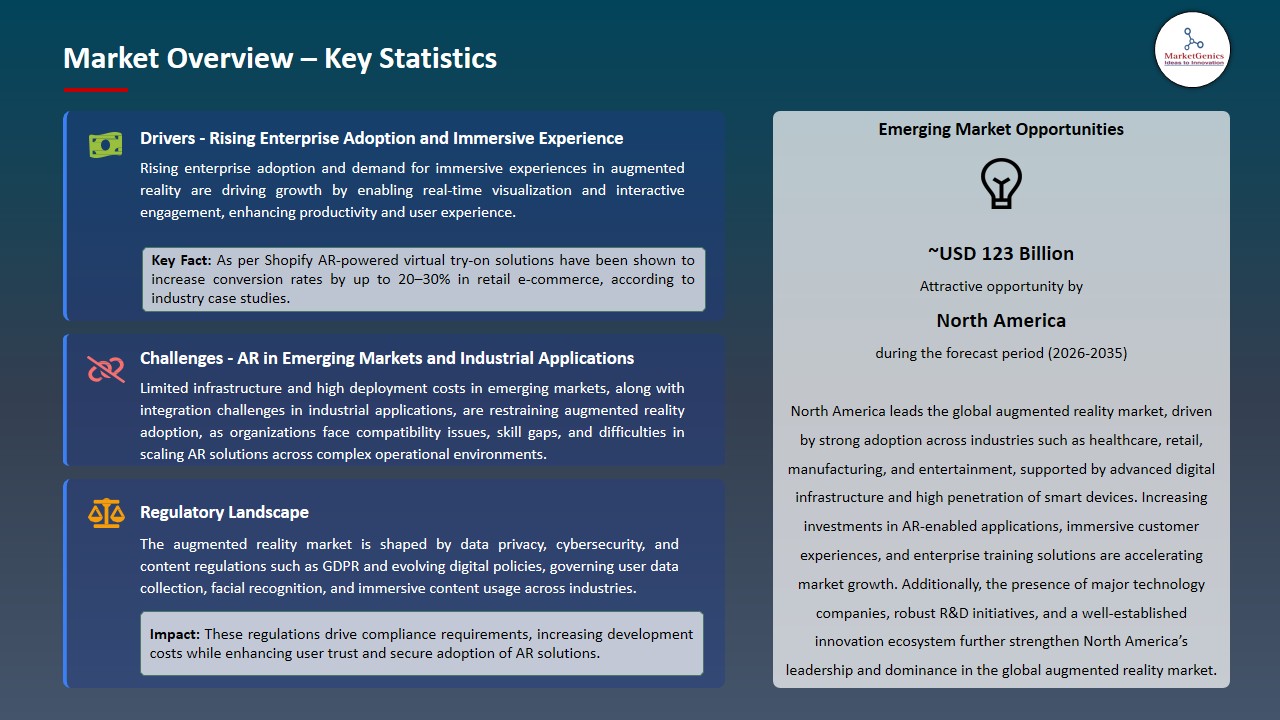
Driver: Rising Enterprise Adoption and Immersive Experience Demand Accelerating Augmented Reality Market Growth
-
While more enterprises from different industries (e.g., healthcare, manufacturing, retail, logistics) adopt augmented reality and reap the benefits of improved productivity, reduced errors, and enhanced real-time visualization, training, and operational efficiency, the augmented reality market is experiencing rapid growth.
- With the continued advancement of augmented reality hardware and software, businesses and consumers will be able to use augmented reality tools, and Microsoft Corporation recently added to its HoloLens ecosystem by adding new mixed reality capabilities for both industrial and healthcare applications. These improvements enable employees engaged in mixed reality to perform tasks with greater precision and immersion.
- The augmented reality market is also being driven by increased consumer demand for more interactive and personalized experiences within gaming, e-commerce, and digital marketing. As a result, many companies are furthering their efforts to integrate augmented reality into mobile devices and equipment. All these factors are likely to continue to escalate the growth of the augmented reality market.
Restraint: Expansion of AR in Emerging Markets and Industrial Applications
-
Although AR is experiencing rapid growth, the high cost of hardware, creating content, and integrating systems are obstacles to widespread adoption of AR in enterprise environments in particular for small-to-medium enterprises.
- In addition to the cost barriers to widespread adoption of AR in enterprises, technical issues such as limited battery life, restricted field of view, and lack of industry-wide standards present additional challenges to creating seamless user experiences as well as scalability.
- Furthermore, integrating AR with existing enterprise systems and ensuring data security and privacy add to the complexity of AR deployment thereby impeding AR adoption in cost-sensitive or regulated markets. All these elements are expected to restrict the expansion of the augmented reality market.
Opportunity: Industry‑Specific Solutions and Edge AI Deployments
-
Augmented reality streaming in emerging-market geographies (Asia Pacific, Latin America, MEA) has grown significantly as governments and businesses invest in augmented reality technologies to modernize their industries.
- Attributed to the digital transformation initiatives, mobile device growth, and expanding industrial sectors, augmented reality is being increasingly adopted throughout these regions. Lenovo Group Limited made significant investments in developing augmented reality solutions for enterprise-level training to meet the growing need for developing markets to use augmented reality technologies.
- Emerging markets offer compelling opportunities for suppliers of both augmented reality platforms and content, as well as for developers of augmented reality content and hardware to deliver scalable, broadly applicable AR solutions and capabilities. However, it is expected to create more opportunities in future for augmented reality market.
Key Trend: Convergence of Spatial Computing, AI Integration, and Real-Time 3D Content Shaping the Augmented Reality Market
-
The confluence of AI and real-time 3D visualization is a major trend in augmented reality, creating intelligent, contextually relevant and interactive experiences.
- AI powered capabilities for object recognition, scene comprehension and gesture tracking improve the usability of many types of applications. Increased usage of augmented reality on the cloud through digital twins has helped all industries scale their deployments and collaboratively work non-correlatively in real-time.
- For example, through its ever-evolving Omniverse platform, NVIDIA Corporation continues to provide a comprehensive suite of capabilities for real-time simulation and 3D collaboration in support of industrial and enterprise augmented reality applications. All these elements are expected to influence significant trends in the augmented reality market.
Augmented Reality Market Analysis and Segmental Data
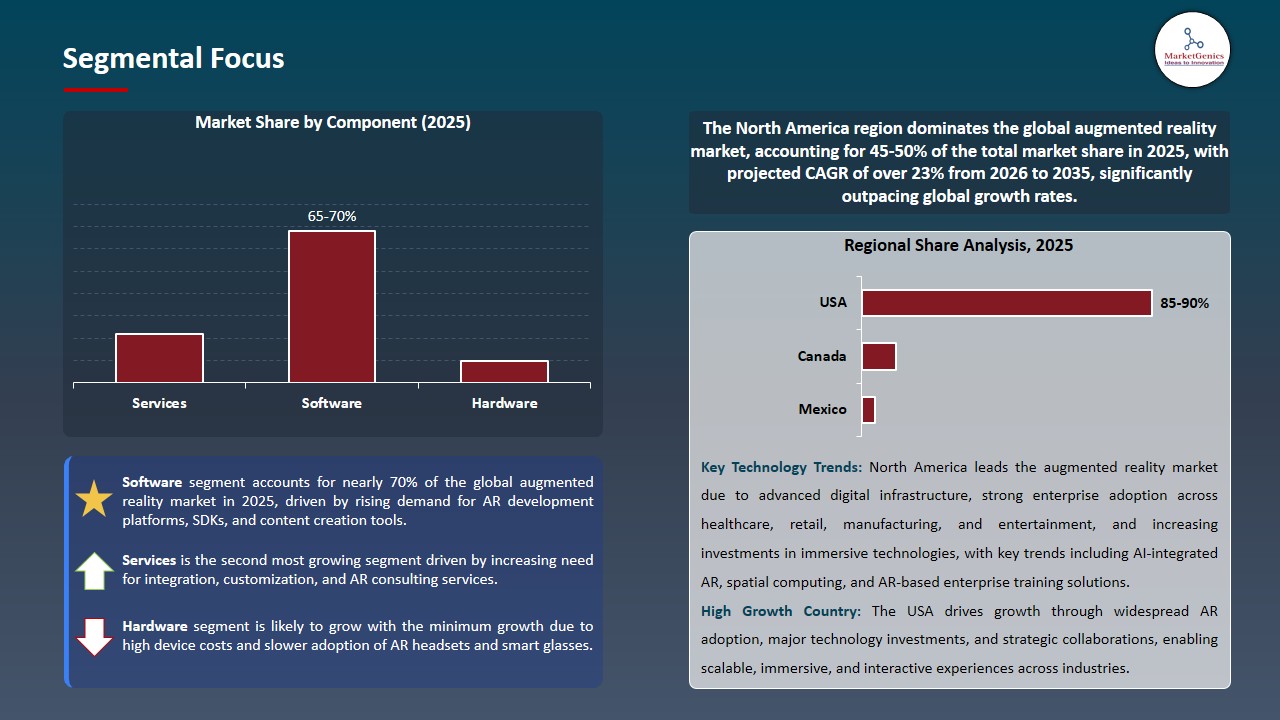
Software Segment Leads Global Augmented Reality Market amid Rising Demand for Augmented Reality Development Platforms and Immersive Content Creation
-
Globally, the largest segment of the augmented reality market is software. The demand for augmented reality development platforms, SDKs, and tools that create immersive content is on the rise, allowing for wider access to augmented reality across many industries.
- Because enterprises are focusing on software for solutions like remote assistance, training, and interactive visualization, they will become less dependent on expensive hardware. Since, augmented reality is becoming increasingly integrated with AI, cloud computing, and real-time analytics, this trend will continue to support the use of augmented reality throughout many industries.
- Augmented reality is continuing to improve as platforms are developed rather than reliant on hardware. For example, in 2024, Snap Inc. created significant enhancements to its augmented reality developmental ecosystem by adding features to Lens Studio, allowing for greater interactivity in the way creators and companies can develop advanced and interactive augmented reality experiences, thereby accelerating software segment dominance in augmented reality market.
North America Dominates Augmented Reality Market amid Strong Enterprise Adoption and Advanced Digital Infrastructure
-
Owing to high enterprise usage of augmented reality technology in industries such as retail and manufacturing as well as healthcare, with support from modern internet technology infrastructure and high cloud percentage usage in the area. North America also has numerous large investments made into immersive technology as well as a large mature startup ecosystem.
- This innovative environment allows for early use of augmented reality in a variety of ways within the enterprise, such as in employee training, maintenance, and customer engagement. The presence of numerous leading augmented reality technology companies coupled with ongoing innovations in the field provide opportunities for continued expansion of the augmented reality market.
- For example, Niantic, Inc. continued to expand its Lightship augmented reality platform through the addition of new real-world mapping and spatial computing features, enabling developers to create more sophisticated and scalable augmented reality applications, further reinforcing regional leadership in the global augmented reality market.
Augmented Reality Market Ecosystem
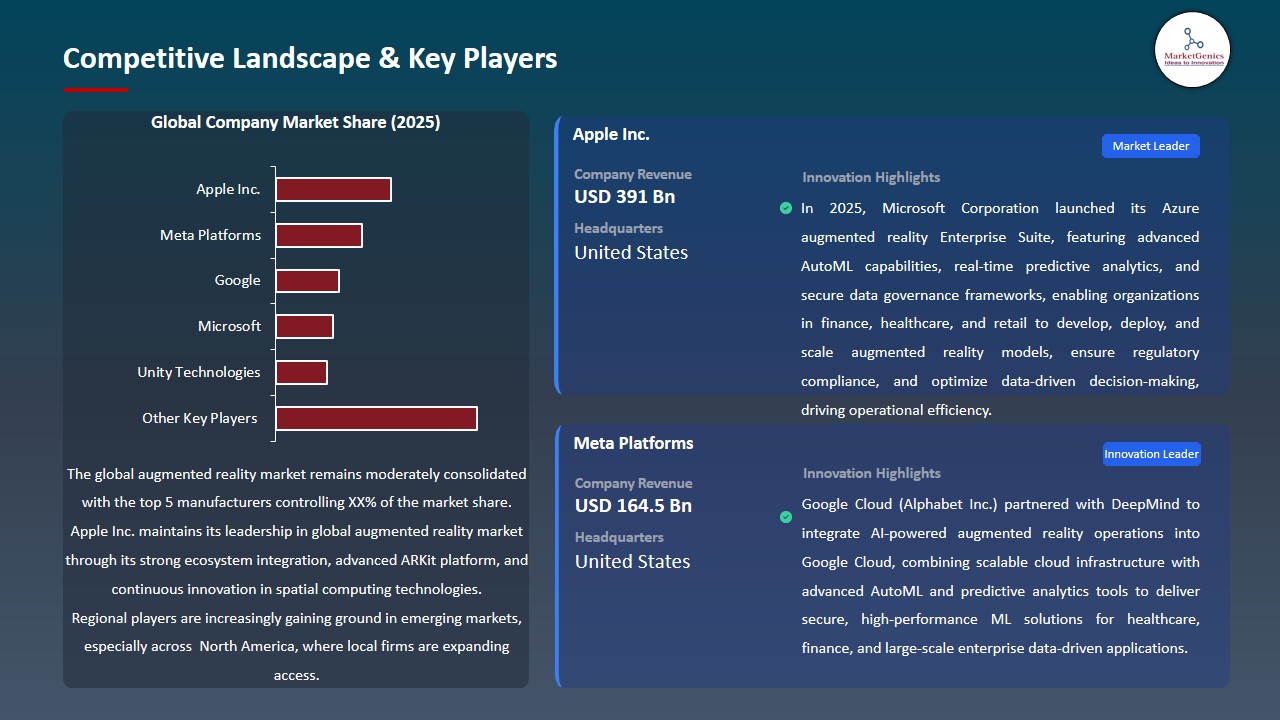
The augmented reality market is moderately consolidated; Tier 1 firms (Microsoft, Apple, and Google) lead the way in terms of innovating platforms while Tier 2 firms (PTC and Vuzix) and Tier 3 niche developers focus on developing specialized applications that show moderate consolidation within the overall market.
The hardware manufacturing and development of software/platform are at the center of the value chain; with the launch of Apple's Vision Pro, new technologies have increased integration of the different ecosystems and accelerated enterprise adoption, thus promoted more intense competition and encouraged cross-tier collaborations.
Recent Development and Strategic Overview:
-
In June 2025, Unity Technologies implemented additional AR development functions into their Unity engine that facilitate the creation of 3D content in real-time as well as the deployment of this content to multiple platforms including both mobile and wearable devices. Developers and companies can now create scalable and interactive AR applications to enhance visualization, engage users more effectively, and deploy more efficiently across an array of industries.
- In April 2025, Magic Leap, Inc. added to its enterprise AR offering an expansion to their spatial computing capabilities to further enhance their platform's benefit to healthcare and industrial markets. With these enhanced capabilities, Magic Leap's platform provides increased accuracy in visualizing physical assets, remote collaboration between team members located in different locations, and optimization of work processes so that enterprises can achieve operational accuracy and be able to adopt immersive technology faster.
Report Scope
|
Attribute |
Detail |
|
Market Size in 2025 |
USD 26.4 Bn |
|
Market Forecast Value in 2035 |
USD 292.5 Bn |
|
Growth Rate (CAGR) |
27.2% |
|
Forecast Period |
2026 – 2035 |
|
Historical Data Available for |
2021 – 2024 |
|
Market Size Units |
USD Bn for Value |
|
Report Format |
Electronic (PDF) + Excel |
|
Regions and Countries Covered |
|||||
|
North America |
Europe |
Asia Pacific |
Middle East |
Africa |
South America |
|
|
|
|
|
|
|
Companies Covered |
|||||
|
|
|
|
|
|
Augmented Reality Market Segmentation and Highlights
|
Segment |
Sub-segment |
|
Augmented Reality Market, By Component |
|
|
Augmented Reality Market, By Technology |
|
|
Augmented Reality Market, By Device Type |
|
|
Augmented Reality Market, By Deployment Mode |
|
|
Augmented Reality Market, By Organization Size |
|
|
Augmented Reality Market, By Content Type |
|
|
Augmented Reality Market, By Pricing Model |
|
|
Augmented Reality Market, By End-User Industry |
|
Frequently Asked Questions
Table of Contents
- 1. Research Methodology and Assumptions
- 1.1. Definitions
- 1.2. Research Design and Approach
- 1.3. Data Collection Methods
- 1.4. Base Estimates and Calculations
- 1.5. Forecasting Models
- 1.5.1. Key Forecast Factors & Impact Analysis
- 1.6. Secondary Research
- 1.6.1. Open Sources
- 1.6.2. Paid Databases
- 1.6.3. Associations
- 1.7. Primary Research
- 1.7.1. Primary Sources
- 1.7.2. Primary Interviews with Stakeholders across Ecosystem
- 2. Executive Summary
- 2.1. Global Augmented Reality Market Outlook
- 2.1.1. Augmented Reality Market Size (Value - US$ Bn), and Forecasts, 2021-2035
- 2.1.2. Compounded Annual Growth Rate Analysis
- 2.1.3. Growth Opportunity Analysis
- 2.1.4. Segmental Share Analysis
- 2.1.5. Geographical Share Analysis
- 2.2. Market Analysis and Facts
- 2.3. Supply-Demand Analysis
- 2.4. Competitive Benchmarking
- 2.5. Go-to- Market Strategy
- 2.5.1. Customer/ End-use Industry Assessment
- 2.5.2. Growth Opportunity Data, 2026-2035
- 2.5.2.1. Regional Data
- 2.5.2.2. Country Data
- 2.5.2.3. Segmental Data
- 2.5.3. Identification of Potential Market Spaces
- 2.5.4. GAP Analysis
- 2.5.5. Potential Attractive Price Points
- 2.5.6. Prevailing Market Risks & Challenges
- 2.5.7. Preferred Sales & Marketing Strategies
- 2.5.8. Key Recommendations and Analysis
- 2.5.9. A Way Forward
- 2.1. Global Augmented Reality Market Outlook
- 3. Industry Data and Premium Insights
- 3.1. Global Information Technology & Media Ecosystem Overview, 2025
- 3.1.1. Information Technology & Media Ecosystem Analysis
- 3.1.2. Key Trends for Information Technology & Media Industry
- 3.1.3. Regional Distribution for Information Technology & Media Industry
- 3.2. Supplier Customer Data
- 3.3. Technology Roadmap and Developments
- 3.1. Global Information Technology & Media Ecosystem Overview, 2025
- 4. Market Overview
- 4.1. Market Dynamics
- 4.1.1. Drivers
- 4.1.1.1. Rapid technological advancements in AR hardware, software, and AI integration enhancing immersive experiences.
- 4.1.1.2. Growing enterprise adoption across healthcare, manufacturing, retail, and logistics for training, visualization, and operational efficiency.
- 4.1.1.3. Increasing investments in digital infrastructure, including 5G networks, edge computing, and cloud-based AR platforms.
- 4.1.2. Restraints
- 4.1.2.1. High development and deployment costs for AR hardware and software limiting adoption among SMEs.
- 4.1.2.2. Technical challenges in creating accurate AR experiences in complex environments or low-light conditions.
- 4.1.1. Drivers
- 4.2. Key Trend Analysis
- 4.3. Regulatory Framework
- 4.3.1. Key Regulations, Norms, and Subsidies, by Key Countries
- 4.3.2. Tariffs and Standards
- 4.3.3. Impact Analysis of Regulations on the Market
- 4.4. Value Chain Analysis
- 4.5. Cost Structure Analysis
- 4.6. Porter’s Five Forces Analysis
- 4.7. PESTEL Analysis
- 4.8. Global Augmented Reality Market Demand
- 4.8.1. Historical Market Size – Value (US$ Bn), 2020-2024
- 4.8.2. Current and Future Market Size – Value (US$ Bn), 2026–2035
- 4.8.2.1. Y-o-Y Growth Trends
- 4.8.2.2. Absolute $ Opportunity Assessment
- 4.1. Market Dynamics
- 5. Competition Landscape
- 5.1. Competition structure
- 5.1.1. Fragmented v/s consolidated
- 5.2. Company Share Analysis, 2025
- 5.2.1. Global Company Market Share
- 5.2.2. By Region
- 5.2.2.1. North America
- 5.2.2.2. Europe
- 5.2.2.3. Asia Pacific
- 5.2.2.4. Middle East
- 5.2.2.5. Africa
- 5.2.2.6. South America
- 5.3. Product Comparison Matrix
- 5.3.1. Specifications
- 5.3.2. Market Positioning
- 5.3.3. Pricing
- 5.1. Competition structure
- 6. Global Augmented Reality Market Analysis, by Component
- 6.1. Key Segment Analysis
- 6.2. Augmented Reality Market Size (Value - US$ Bn), Analysis, and Forecasts, by Component, 2021-2035
- 6.2.1. Hardware
- 6.2.1.1. Head-Mounted Displays (HMDs)
- 6.2.1.2. Smart Glasses
- 6.2.1.3. AR-Enabled Smartphones & Tablets
- 6.2.1.4. Wearable AR Devices (AR Headsets, AR Helmets)
- 6.2.1.5. AR Projectors & Displays
- 6.2.1.6. Sensors & Cameras (Depth Sensors, Motion Sensors)
- 6.2.1.7. Tracking & Localization Devices
- 6.2.1.8. AR Optics & Lenses
- 6.2.1.9. Others
- 6.2.1.10. Software
- 6.2.1.11. AR Development Platforms & SDKs
- 6.2.1.12. AR Operating Systems & Frameworks
- 6.2.1.13. AR Content Creation Tools
- 6.2.1.14. AR Mapping & Spatial Recognition Software
- 6.2.1.15. AR Visualization & Rendering Software
- 6.2.1.16. AR Analytics & Reporting Software
- 6.2.1.17. AR Security & Privacy Software
- 6.2.1.18. AR Integration & Middleware Software
- 6.2.1.19. Others
- 6.2.2. Services
- 6.2.2.1. Consulting & Strategy Services
- 6.2.2.2. Implementation & Deployment Services
- 6.2.2.3. Custom AR App/Content Development
- 6.2.2.4. System Integration Services
- 6.2.2.5. Training & Education Services
- 6.2.2.6. Support & Maintenance Services
- 6.2.2.7. Managed AR Services
- 6.2.2.8. Data Annotation & AR Content Management Services
- 6.2.2.9. Others
- 6.2.1. Hardware
- 7. OthersGlobal Augmented Reality Market Analysis, by Technology
- 7.1. Key Segment Analysis
- 7.2. Augmented Reality Market Size (Value - US$ Bn), Analysis, and Forecasts, by Technology, 2021-2035
- 7.2.1. Marker-Based AR
- 7.2.2. Marker-less AR
- 7.2.3. Projection-Based AR
- 7.2.4. Superimposition-Based AR
- 7.2.5. Location-Based AR
- 7.2.6. Others
- 8. Global Augmented Reality Market Analysis, by Device Type
- 8.1. Key Segment Analysis
- 8.2. Augmented Reality Market Size (Value - US$ Bn), Analysis, and Forecasts, by Device Type, 2021-2035
- 8.2.1. Smartphones & Tablets
- 8.2.2. Head-Mounted Displays (HMDs)
- 8.2.3. Smart Glasses
- 8.2.4. Wearables
- 8.2.5. AR Projectors
- 8.2.6. AR Enabled PCs & Laptops
- 8.2.7. AR Eyewear
- 8.2.8. Others
- 9. Global Augmented Reality Market Analysis, by Deployment Mode
- 9.1. Key Segment Analysis
- 9.2. Augmented Reality Market Size (Value - US$ Bn), Analysis, and Forecasts, by Deployment Mode, 2021-2035
- 9.2.1. On-Premise
- 9.2.2. Cloud-Based
- 9.2.3. Hybrid
- 10. Global Augmented Reality Market Analysis, by Organization Size
- 10.1. Key Segment Analysis
- 10.2. Augmented Reality Market Size (Value - US$ Bn), Analysis, and Forecasts, by Organization Size, 2021-2035
- 10.2.1. Large Enterprises
- 10.2.2. Small & Medium-Sized Enterprises (SMEs)
- 11. Global Augmented Reality Market Analysis, by Content Type
- 11.1. Key Segment Analysis
- 11.2. Augmented Reality Market Size (Value - US$ Bn), Analysis, and Forecasts, by Content Type, 2021-2035
- 11.2.1. 2D AR Content
- 11.2.2. 3D AR Content
- 11.2.3. Audio AR Content
- 11.2.4. Gesture-Based AR Content
- 11.2.5. Others
- 12. Global Augmented Reality Market Analysis, by Pricing Model
- 12.1. Key Segment Analysis
- 12.2. Augmented Reality Market Size (Value - US$ Bn), Analysis, and Forecasts, by Pricing Model, 2021-2035
- 12.2.1. Subscription Licensing
- 12.2.2. Usage-Based/Consumption
- 12.2.3. Perpetual Licensing
- 13. Global Augmented Reality Market Analysis, by End-User Industry
- 13.1. Key Segment Analysis
- 13.2. Augmented Reality Market Size (Value - US$ Bn), Analysis, and Forecasts, by End-User Industry, 2021-2035
- 13.2.1. Retail & E-Commerce
- 13.2.2. Healthcare
- 13.2.3. Manufacturing
- 13.2.4. Automotive
- 13.2.5. Education & Training
- 13.2.6. Gaming & Entertainment
- 13.2.7. Real Estate & Construction
- 13.2.8. Advertising & Marketing
- 13.2.9. Military & Defense
- 13.2.10. Others
- 14. Global Augmented Reality Market Analysis and Forecasts, by Region
- 14.1. Key Findings
- 14.2. Augmented Reality Market Size (Value - US$ Bn), Analysis, and Forecasts, by Region, 2021-2035
- 14.2.1. North America
- 14.2.2. Europe
- 14.2.3. Asia Pacific
- 14.2.4. Middle East
- 14.2.5. Africa
- 14.2.6. South America
- 15. North America Augmented Reality Market Analysis
- 15.1. Key Segment Analysis
- 15.2. Regional Snapshot
- 15.3. North America Augmented Reality Market Size (Value - US$ Bn), Analysis, and Forecasts, 2021-2035
- 15.3.1. Component
- 15.3.2. Technology
- 15.3.3. Device Type
- 15.3.4. Deployment Mode
- 15.3.5. Organization Size
- 15.3.6. Content Type
- 15.3.7. Pricing Model
- 15.3.8. End-User Industry
- 15.3.9. Country
- 15.3.9.1. USA
- 15.3.9.2. Canada
- 15.3.9.3. Mexico
- 15.4. USA Augmented Reality Market
- 15.4.1. Country Segmental Analysis
- 15.4.2. Component
- 15.4.3. Technology
- 15.4.4. Device Type
- 15.4.5. Deployment Mode
- 15.4.6. Organization Size
- 15.4.7. Content Type
- 15.4.8. Pricing Model
- 15.4.9. End-User Industry
- 15.5. Canada Augmented Reality Market
- 15.5.1. Country Segmental Analysis
- 15.5.2. Component
- 15.5.3. Technology
- 15.5.4. Device Type
- 15.5.5. Deployment Mode
- 15.5.6. Organization Size
- 15.5.7. Content Type
- 15.5.8. Pricing Model
- 15.5.9. End-User Industry
- 15.6. Mexico Augmented Reality Market
- 15.6.1. Country Segmental Analysis
- 15.6.2. Component
- 15.6.3. Technology
- 15.6.4. Device Type
- 15.6.5. Deployment Mode
- 15.6.6. Organization Size
- 15.6.7. Content Type
- 15.6.8. Pricing Model
- 15.6.9. End-User Industry
- 16. Europe Augmented Reality Market Analysis
- 16.1. Key Segment Analysis
- 16.2. Regional Snapshot
- 16.3. Europe Augmented Reality Market Size (Value - US$ Bn), Analysis, and Forecasts, 2021-2035
- 16.3.1. Component
- 16.3.2. Technology
- 16.3.3. Device Type
- 16.3.4. Deployment Mode
- 16.3.5. Organization Size
- 16.3.6. Content Type
- 16.3.7. Pricing Model
- 16.3.8. End-User Industry
- 16.3.9. Country
- 16.3.9.1. Germany
- 16.3.9.2. United Kingdom
- 16.3.9.3. France
- 16.3.9.4. Italy
- 16.3.9.5. Spain
- 16.3.9.6. Netherlands
- 16.3.9.7. Nordic Countries
- 16.3.9.8. Poland
- 16.3.9.9. Russia & CIS
- 16.3.9.10. Rest of Europe
- 16.4. Germany Augmented Reality Market
- 16.4.1. Country Segmental Analysis
- 16.4.2. Component
- 16.4.3. Technology
- 16.4.4. Device Type
- 16.4.5. Deployment Mode
- 16.4.6. Organization Size
- 16.4.7. Content Type
- 16.4.8. Pricing Model
- 16.4.9. End-User Industry
- 16.5. United Kingdom Augmented Reality Market
- 16.5.1. Country Segmental Analysis
- 16.5.2. Component
- 16.5.3. Technology
- 16.5.4. Device Type
- 16.5.5. Deployment Mode
- 16.5.6. Organization Size
- 16.5.7. Content Type
- 16.5.8. Pricing Model
- 16.5.9. End-User Industry
- 16.6. France Augmented Reality Market
- 16.6.1. Country Segmental Analysis
- 16.6.2. Component
- 16.6.3. Technology
- 16.6.4. Device Type
- 16.6.5. Deployment Mode
- 16.6.6. Organization Size
- 16.6.7. Content Type
- 16.6.8. Pricing Model
- 16.6.9. End-User Industry
- 16.7. Italy Augmented Reality Market
- 16.7.1. Country Segmental Analysis
- 16.7.2. Component
- 16.7.3. Technology
- 16.7.4. Device Type
- 16.7.5. Deployment Mode
- 16.7.6. Organization Size
- 16.7.7. Content Type
- 16.7.8. Pricing Model
- 16.7.9. End-User Industry
- 16.8. Spain Augmented Reality Market
- 16.8.1. Country Segmental Analysis
- 16.8.2. Component
- 16.8.3. Technology
- 16.8.4. Device Type
- 16.8.5. Deployment Mode
- 16.8.6. Organization Size
- 16.8.7. Content Type
- 16.8.8. Pricing Model
- 16.8.9. End-User Industry
- 16.9. Netherlands Augmented Reality Market
- 16.9.1. Country Segmental Analysis
- 16.9.2. Component
- 16.9.3. Technology
- 16.9.4. Device Type
- 16.9.5. Deployment Mode
- 16.9.6. Organization Size
- 16.9.7. Content Type
- 16.9.8. Pricing Model
- 16.9.9. End-User Industry
- 16.10. Nordic Countries Augmented Reality Market
- 16.10.1. Country Segmental Analysis
- 16.10.2. Component
- 16.10.3. Technology
- 16.10.4. Device Type
- 16.10.5. Deployment Mode
- 16.10.6. Organization Size
- 16.10.7. Content Type
- 16.10.8. Pricing Model
- 16.10.9. End-User Industry
- 16.11. Poland Augmented Reality Market
- 16.11.1. Country Segmental Analysis
- 16.11.2. Component
- 16.11.3. Technology
- 16.11.4. Device Type
- 16.11.5. Deployment Mode
- 16.11.6. Organization Size
- 16.11.7. Content Type
- 16.11.8. Pricing Model
- 16.11.9. End-User Industry
- 16.12. Russia & CIS Augmented Reality Market
- 16.12.1. Country Segmental Analysis
- 16.12.2. Component
- 16.12.3. Technology
- 16.12.4. Device Type
- 16.12.5. Deployment Mode
- 16.12.6. Organization Size
- 16.12.7. Content Type
- 16.12.8. Pricing Model
- 16.12.9. End-User Industry
- 16.13. Rest of Europe Augmented Reality Market
- 16.13.1. Country Segmental Analysis
- 16.13.2. Component
- 16.13.3. Technology
- 16.13.4. Device Type
- 16.13.5. Deployment Mode
- 16.13.6. Organization Size
- 16.13.7. Content Type
- 16.13.8. Pricing Model
- 16.13.9. End-User Industry
- 17. Asia Pacific Augmented Reality Market Analysis
- 17.1. Key Segment Analysis
- 17.2. Regional Snapshot
- 17.3. Asia Pacific Augmented Reality Market Size (Value - US$ Bn), Analysis, and Forecasts, 2021-2035
- 17.3.1. Component
- 17.3.2. Technology
- 17.3.3. Device Type
- 17.3.4. Deployment Mode
- 17.3.5. Organization Size
- 17.3.6. Content Type
- 17.3.7. Pricing Model
- 17.3.8. End-User Industry
- 17.3.9. Country
- 17.3.9.1. China
- 17.3.9.2. India
- 17.3.9.3. Japan
- 17.3.9.4. South Korea
- 17.3.9.5. Australia and New Zealand
- 17.3.9.6. Indonesia
- 17.3.9.7. Malaysia
- 17.3.9.8. Thailand
- 17.3.9.9. Vietnam
- 17.3.9.10. Rest of Asia Pacific
- 17.4. China Augmented Reality Market
- 17.4.1. Country Segmental Analysis
- 17.4.2. Component
- 17.4.3. Technology
- 17.4.4. Device Type
- 17.4.5. Deployment Mode
- 17.4.6. Organization Size
- 17.4.7. Content Type
- 17.4.8. Pricing Model
- 17.4.9. End-User Industry
- 17.5. India Augmented Reality Market
- 17.5.1. Country Segmental Analysis
- 17.5.2. Component
- 17.5.3. Technology
- 17.5.4. Device Type
- 17.5.5. Deployment Mode
- 17.5.6. Organization Size
- 17.5.7. Content Type
- 17.5.8. Pricing Model
- 17.5.9. End-User Industry
- 17.6. Japan Augmented Reality Market
- 17.6.1. Country Segmental Analysis
- 17.6.2. Component
- 17.6.3. Technology
- 17.6.4. Device Type
- 17.6.5. Deployment Mode
- 17.6.6. Organization Size
- 17.6.7. Content Type
- 17.6.8. Pricing Model
- 17.6.9. End-User Industry
- 17.7. South Korea Augmented Reality Market
- 17.7.1. Country Segmental Analysis
- 17.7.2. Component
- 17.7.3. Technology
- 17.7.4. Device Type
- 17.7.5. Deployment Mode
- 17.7.6. Organization Size
- 17.7.7. Content Type
- 17.7.8. Pricing Model
- 17.7.9. End-User Industry
- 17.8. Australia and New Zealand Augmented Reality Market
- 17.8.1. Country Segmental Analysis
- 17.8.2. Component
- 17.8.3. Technology
- 17.8.4. Device Type
- 17.8.5. Deployment Mode
- 17.8.6. Organization Size
- 17.8.7. Content Type
- 17.8.8. Pricing Model
- 17.8.9. End-User Industry
- 17.9. Indonesia Augmented Reality Market
- 17.9.1. Country Segmental Analysis
- 17.9.2. Component
- 17.9.3. Technology
- 17.9.4. Device Type
- 17.9.5. Deployment Mode
- 17.9.6. Organization Size
- 17.9.7. Content Type
- 17.9.8. Pricing Model
- 17.9.9. End-User Industry
- 17.10. Malaysia Augmented Reality Market
- 17.10.1. Country Segmental Analysis
- 17.10.2. Component
- 17.10.3. Technology
- 17.10.4. Device Type
- 17.10.5. Deployment Mode
- 17.10.6. Organization Size
- 17.10.7. Content Type
- 17.10.8. Pricing Model
- 17.10.9. End-User Industry
- 17.11. Thailand Augmented Reality Market
- 17.11.1. Country Segmental Analysis
- 17.11.2. Component
- 17.11.3. Technology
- 17.11.4. Device Type
- 17.11.5. Deployment Mode
- 17.11.6. Organization Size
- 17.11.7. Content Type
- 17.11.8. Pricing Model
- 17.11.9. End-User Industry
- 17.12. Vietnam Augmented Reality Market
- 17.12.1. Country Segmental Analysis
- 17.12.2. Component
- 17.12.3. Technology
- 17.12.4. Device Type
- 17.12.5. Deployment Mode
- 17.12.6. Organization Size
- 17.12.7. Content Type
- 17.12.8. Pricing Model
- 17.12.9. End-User Industry
- 17.13. Rest of Asia Pacific Augmented Reality Market
- 17.13.1. Country Segmental Analysis
- 17.13.2. Component
- 17.13.3. Technology
- 17.13.4. Device Type
- 17.13.5. Deployment Mode
- 17.13.6. Organization Size
- 17.13.7. Content Type
- 17.13.8. Pricing Model
- 17.13.9. End-User Industry
- 18. Middle East Augmented Reality Market Analysis
- 18.1. Key Segment Analysis
- 18.2. Regional Snapshot
- 18.3. Middle East Augmented Reality Market Size (Value - US$ Bn), Analysis, and Forecasts, 2021-2035
- 18.3.1. Component
- 18.3.2. Technology
- 18.3.3. Device Type
- 18.3.4. Deployment Mode
- 18.3.5. Organization Size
- 18.3.6. Content Type
- 18.3.7. Pricing Model
- 18.3.8. End-User Industry
- 18.3.9. Country
- 18.3.9.1. Turkey
- 18.3.9.2. UAE
- 18.3.9.3. Saudi Arabia
- 18.3.9.4. Israel
- 18.3.9.5. Rest of Middle East
- 18.4. Turkey Augmented Reality Market
- 18.4.1. Country Segmental Analysis
- 18.4.2. Component
- 18.4.3. Technology
- 18.4.4. Device Type
- 18.4.5. Deployment Mode
- 18.4.6. Organization Size
- 18.4.7. Content Type
- 18.4.8. Pricing Model
- 18.4.9. End-User Industry
- 18.5. UAE Augmented Reality Market
- 18.5.1. Country Segmental Analysis
- 18.5.2. Component
- 18.5.3. Technology
- 18.5.4. Device Type
- 18.5.5. Deployment Mode
- 18.5.6. Organization Size
- 18.5.7. Content Type
- 18.5.8. Pricing Model
- 18.5.9. End-User Industry
- 18.6. Saudi Arabia Augmented Reality Market
- 18.6.1. Country Segmental Analysis
- 18.6.2. Component
- 18.6.3. Technology
- 18.6.4. Device Type
- 18.6.5. Deployment Mode
- 18.6.6. Organization Size
- 18.6.7. Content Type
- 18.6.8. Pricing Model
- 18.6.9. End-User Industry
- 18.7. Israel Augmented Reality Market
- 18.7.1. Country Segmental Analysis
- 18.7.2. Component
- 18.7.3. Technology
- 18.7.4. Device Type
- 18.7.5. Deployment Mode
- 18.7.6. Organization Size
- 18.7.7. Content Type
- 18.7.8. Pricing Model
- 18.7.9. End-User Industry
- 18.8. Rest of Middle East Augmented Reality Market
- 18.8.1. Country Segmental Analysis
- 18.8.2. Component
- 18.8.3. Technology
- 18.8.4. Device Type
- 18.8.5. Deployment Mode
- 18.8.6. Organization Size
- 18.8.7. Content Type
- 18.8.8. Pricing Model
- 18.8.9. End-User Industry
- 19. Africa Augmented Reality Market Analysis
- 19.1. Key Segment Analysis
- 19.2. Regional Snapshot
- 19.3. Africa Augmented Reality Market Size (Value - US$ Bn), Analysis, and Forecasts, 2021-2035
- 19.3.1. Component
- 19.3.2. Technology
- 19.3.3. Device Type
- 19.3.4. Deployment Mode
- 19.3.5. Organization Size
- 19.3.6. Content Type
- 19.3.7. Pricing Model
- 19.3.8. End-User Industry
- 19.3.9. Country
- 19.3.9.1. South Africa
- 19.3.9.2. Egypt
- 19.3.9.3. Nigeria
- 19.3.9.4. Algeria
- 19.3.9.5. Rest of Africa
- 19.4. South Africa Augmented Reality Market
- 19.4.1. Country Segmental Analysis
- 19.4.2. Component
- 19.4.3. Technology
- 19.4.4. Device Type
- 19.4.5. Deployment Mode
- 19.4.6. Organization Size
- 19.4.7. Content Type
- 19.4.8. Pricing Model
- 19.4.9. End-User Industry
- 19.5. Egypt Augmented Reality Market
- 19.5.1. Country Segmental Analysis
- 19.5.2. Component
- 19.5.3. Technology
- 19.5.4. Device Type
- 19.5.5. Deployment Mode
- 19.5.6. Organization Size
- 19.5.7. Content Type
- 19.5.8. Pricing Model
- 19.5.9. End-User Industry
- 19.6. Nigeria Augmented Reality Market
- 19.6.1. Country Segmental Analysis
- 19.6.2. Component
- 19.6.3. Technology
- 19.6.4. Device Type
- 19.6.5. Deployment Mode
- 19.6.6. Organization Size
- 19.6.7. Content Type
- 19.6.8. Pricing Model
- 19.6.9. End-User Industry
- 19.7. Algeria Augmented Reality Market
- 19.7.1. Country Segmental Analysis
- 19.7.2. Component
- 19.7.3. Technology
- 19.7.4. Device Type
- 19.7.5. Deployment Mode
- 19.7.6. Organization Size
- 19.7.7. Content Type
- 19.7.8. Pricing Model
- 19.7.9. End-User Industry
- 19.8. Rest of Africa Augmented Reality Market
- 19.8.1. Country Segmental Analysis
- 19.8.2. Component
- 19.8.3. Technology
- 19.8.4. Device Type
- 19.8.5. Deployment Mode
- 19.8.6. Organization Size
- 19.8.7. Content Type
- 19.8.8. Pricing Model
- 19.8.9. End-User Industry
- 20. South America Augmented Reality Market Analysis
- 20.1. Key Segment Analysis
- 20.2. Regional Snapshot
- 20.3. South America Augmented Reality Market Size (Value - US$ Bn), Analysis, and Forecasts, 2021-2035
- 20.3.1. Component
- 20.3.2. Technology
- 20.3.3. Device Type
- 20.3.4. Deployment Mode
- 20.3.5. Organization Size
- 20.3.6. Content Type
- 20.3.7. Pricing Model
- 20.3.8. End-User Industry
- 20.3.9. Country
- 20.3.9.1. Brazil
- 20.3.9.2. Argentina
- 20.3.9.3. Rest of South America
- 20.4. Brazil Augmented Reality Market
- 20.4.1. Country Segmental Analysis
- 20.4.2. Component
- 20.4.3. Technology
- 20.4.4. Device Type
- 20.4.5. Deployment Mode
- 20.4.6. Organization Size
- 20.4.7. Content Type
- 20.4.8. Pricing Model
- 20.4.9. End-User Industry
- 20.5. Argentina Augmented Reality Market
- 20.5.1. Country Segmental Analysis
- 20.5.2. Component
- 20.5.3. Technology
- 20.5.4. Device Type
- 20.5.5. Deployment Mode
- 20.5.6. Organization Size
- 20.5.7. Content Type
- 20.5.8. Pricing Model
- 20.5.9. End-User Industry
- 20.6. Rest of South America Augmented Reality Market
- 20.6.1. Country Segmental Analysis
- 20.6.2. Component
- 20.6.3. Technology
- 20.6.4. Device Type
- 20.6.5. Deployment Mode
- 20.6.6. Organization Size
- 20.6.7. Content Type
- 20.6.8. Pricing Model
- 20.6.9. End-User Industry
- 21. Key Players/ Company Profile
- 21.1. Adobe
- 21.1.1. Company Details/ Overview
- 21.1.2. Company Financials
- 21.1.3. Key Customers and Competitors
- 21.1.4. Business/ Industry Portfolio
- 21.1.5. Product Portfolio/ Specification Details
- 21.1.6. Pricing Data
- 21.1.7. Strategic Overview
- 21.1.8. Recent Developments
- 21.2. Apple
- 21.3. Blippar
- 21.4. Epson
- 21.5. Facebook (Meta Platforms)
- 21.6. Google
- 21.7. HTC Corporation
- 21.8. Huawei
- 21.9. Lenovo
- 21.10. Magic Leap
- 21.11. Microsoft
- 21.12. Niantic
- 21.13. PTC Inc.
- 21.14. Qualcomm
- 21.15. Samsung Electronics
- 21.16. Snap Inc.
- 21.17. Sony
- 21.18. Unity Technologies
- 21.19. Vuzix Corporation
- 21.20. Zappar
- 21.21. Other Key Players
- 21.1. Adobe
Note* - This is just tentative list of players. While providing the report, we will cover more number of players based on their revenue and share for each geography
Research Design
Our research design integrates both demand-side and supply-side analysis through a balanced combination of primary and secondary research methodologies. By utilizing both bottom-up and top-down approaches alongside rigorous data triangulation methods, we deliver robust market intelligence that supports strategic decision-making.
MarketGenics' comprehensive research design framework ensures the delivery of accurate, reliable, and actionable market intelligence. Through the integration of multiple research approaches, rigorous validation processes, and expert analysis, we provide our clients with the insights needed to make informed strategic decisions and capitalize on market opportunities.

MarketGenics leverages a dedicated industry panel of experts and a comprehensive suite of paid databases to effectively collect, consolidate, and analyze market intelligence.
Our approach has consistently proven to be reliable and effective in generating accurate market insights, identifying key industry trends, and uncovering emerging business opportunities.
Through both primary and secondary research, we capture and analyze critical company-level data such as manufacturing footprints, including technical centers, R&D facilities, sales offices, and headquarters.
Our expert panel further enhances our ability to estimate market size for specific brands based on validated field-level intelligence.
Our data mining techniques incorporate both parametric and non-parametric methods, allowing for structured data collection, sorting, processing, and cleaning.
Demand projections are derived from large-scale data sets analyzed through proprietary algorithms, culminating in robust and reliable market sizing.
Research Approach
The bottom-up approach builds market estimates by starting with the smallest addressable market units and systematically aggregating them to create comprehensive market size projections.
This method begins with specific, granular data points and builds upward to create the complete market landscape.
Customer Analysis → Segmental Analysis → Geographical Analysis
The top-down approach starts with the broadest possible market data and systematically narrows it down through a series of filters and assumptions to arrive at specific market segments or opportunities.
This method begins with the big picture and works downward to increasingly specific market slices.
TAM → SAM → SOM


Research Methods
Desk / Secondary Research
While analysing the market, we extensively study secondary sources, directories, and databases to identify and collect information useful for this technical, market-oriented, and commercial report. Secondary sources that we utilize are not only the public sources, but it is a combination of Open Source, Associations, Paid Databases, MG Repository & Knowledgebase, and others.
- Company websites, annual reports, financial reports, broker reports, and investor presentations
- National government documents, statistical databases and reports
- News articles, press releases and web-casts specific to the companies operating in the market, Magazines, reports, and others
- We gather information from commercial data sources for deriving company specific data such as segmental revenue, share for geography, product revenue, and others
- Internal and external proprietary databases (industry-specific), relevant patent, and regulatory databases
- Governing Bodies, Government Organizations
- Relevant Authorities, Country-specific Associations for Industries
We also employ the model mapping approach to estimate the product level market data through the players' product portfolio
Primary Research
Primary research/ interviews is vital in analyzing the market. Most of the cases involves paid primary interviews. Primary sources include primary interviews through e-mail interactions, telephonic interviews, surveys as well as face-to-face interviews with the different stakeholders across the value chain including several industry experts.
| Type of Respondents | Number of Primaries |
|---|---|
| Tier 2/3 Suppliers | ~20 |
| Tier 1 Suppliers | ~25 |
| End-users | ~25 |
| Industry Expert/ Panel/ Consultant | ~30 |
| Total | ~100 |
MG Knowledgebase
• Repository of industry blog, newsletter and case studies
• Online platform covering detailed market reports, and company profiles
Forecasting Factors and Models
Forecasting Factors
- Historical Trends – Past market patterns, cycles, and major events that shaped how markets behave over time. Understanding past trends helps predict future behavior.
- Industry Factors – Specific characteristics of the industry like structure, regulations, and innovation cycles that affect market dynamics.
- Macroeconomic Factors – Economic conditions like GDP growth, inflation, and employment rates that affect how much money people have to spend.
- Demographic Factors – Population characteristics like age, income, and location that determine who can buy your product.
- Technology Factors – How quickly people adopt new technology and how much technology infrastructure exists.
- Regulatory Factors – Government rules, laws, and policies that can help or restrict market growth.
- Competitive Factors – Analyzing competition structure such as degree of competition and bargaining power of buyers and suppliers.
Forecasting Models / Techniques
Multiple Regression Analysis
- Identify and quantify factors that drive market changes
- Statistical modeling to establish relationships between market drivers and outcomes
Time Series Analysis – Seasonal Patterns
- Understand regular cyclical patterns in market demand
- Advanced statistical techniques to separate trend, seasonal, and irregular components
Time Series Analysis – Trend Analysis
- Identify underlying market growth patterns and momentum
- Statistical analysis of historical data to project future trends
Expert Opinion – Expert Interviews
- Gather deep industry insights and contextual understanding
- In-depth interviews with key industry stakeholders
Multi-Scenario Development
- Prepare for uncertainty by modeling different possible futures
- Creating optimistic, pessimistic, and most likely scenarios
Time Series Analysis – Moving Averages
- Sophisticated forecasting for complex time series data
- Auto-regressive integrated moving average models with seasonal components
Econometric Models
- Apply economic theory to market forecasting
- Sophisticated economic models that account for market interactions
Expert Opinion – Delphi Method
- Harness collective wisdom of industry experts
- Structured, multi-round expert consultation process
Monte Carlo Simulation
- Quantify uncertainty and probability distributions
- Thousands of simulations with varying input parameters
Research Analysis
Our research framework is built upon the fundamental principle of validating market intelligence from both demand and supply perspectives. This dual-sided approach ensures comprehensive market understanding and reduces the risk of single-source bias.
Demand-Side Analysis: We understand end-user/application behavior, preferences, and market needs along with the penetration of the product for specific application.
Supply-Side Analysis: We estimate overall market revenue, analyze the segmental share along with industry capacity, competitive landscape, and market structure.
Validation & Evaluation
Data triangulation is a validation technique that uses multiple methods, sources, or perspectives to examine the same research question, thereby increasing the credibility and reliability of research findings. In market research, triangulation serves as a quality assurance mechanism that helps identify and minimize bias, validate assumptions, and ensure accuracy in market estimates.
- Data Source Triangulation – Using multiple data sources to examine the same phenomenon
- Methodological Triangulation – Using multiple research methods to study the same research question
- Investigator Triangulation – Using multiple researchers or analysts to examine the same data
- Theoretical Triangulation – Using multiple theoretical perspectives to interpret the same data

Custom Market Research Services
We will customise the research for you, in case the report listed above does not meet your requirements.
Get 10% Free Customisation