Automotive Display Market Size, Share & Trends Analysis Report by Type (Instrument Cluster Display, Infotainment Display, Head-Up Display (HUD), Rear-Seat Entertainment Display, Rearview Mirror Display (Smart Mirror), Surround View / 360° Display, Steering Wheel Display, Others), Display Technology, Touch Technology, Display Size, Resolution, Vehicle Type, Sales Channel, and Geography (North America, Europe, Asia Pacific, Middle East, Africa, and South America) – Global Industry Data, Trends, and Forecasts, 2026–2035
Market Overview:
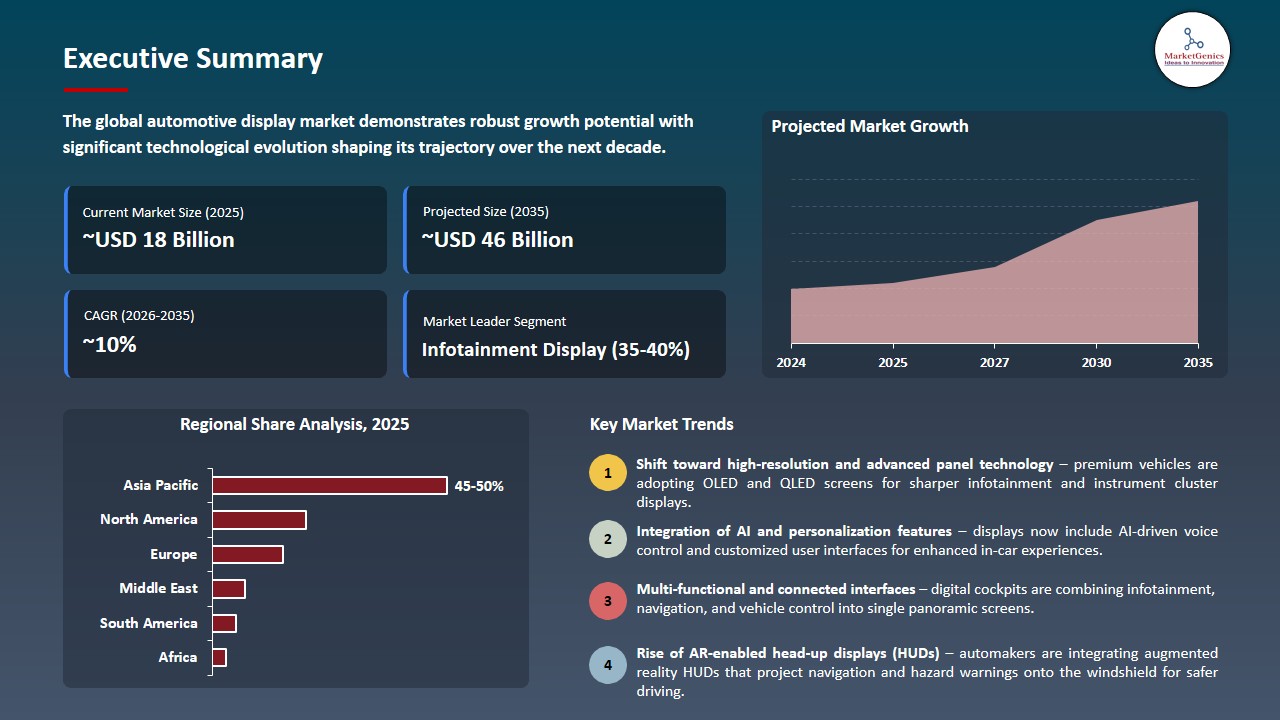
According to MarketGenics, the global Automotive Display market is projected to grow from USD 18.3 billion in 2025 to USD 46.2 billion by 2035, registering a CAGR of 9.7% during the forecast period.
|
|
|
Segmental Data Insights |
|
|
Demand Trends |
|
|
Competitive Landscape |
|
|
Strategic Development |
|
|
Future Outlook & Opportunities |
|
Automotive Display Market Size, Share, and Growth
The global automotive-display-market is driven by rapid adoption of electric and connected vehicles, rising consumer preference for advanced infotainment and digital dashboards, increasing integration of OLED and touchscreen technologies, government support for smart mobility solutions, and growing focus on in-cabin safety and user experience enhancements.
“Through our robust customer base, unmatched technologies, stable supply and quality, and dedicated Fab operation, we aim to create the world’s best automotive display business,” said Byeong-koo Kim, Senior Vice President and Head of Auto Business Group at LG Display.
The growing trend toward electric vehicles (EVs) and connected car experiences is pushing up the need to use larger and higher resolution automotive displays, offering real-time battery messages, navigation, and infotainment as well as energy efficiency information. For instance, in February 2025, Toyota official press releases about its 2027 Highlander EV confirm the integration of a 14-inch central touchscreen and a 12.3-inch fully digital driver display to enable those functions. The trend is increasing the pace of installing advanced digital cockpits, which is enhancing growth and innovation in the automotive-display-market.
Additionally, the integration of more sophisticated and multifunctional automotive display interfaces in contemporary cars is being fueled by the unrelenting technological advancements of display suppliers. For instance, in February 2025, LG Display started mass manufacturing ultra-large automotive displays, with 40-inch class solutions, to support high-end and software-defined car cockpit use cases and further industry use of immersive and multifunctional in-car interfaces. This increases market growth and uptake of next generation digital cockpits.
Key adjacent opportunities to the global automotive display market include augmented reality (AR) head-up displays, in-car infotainment systems, smart dashboards for EVs, connected vehicle telematics, and gesture‑based control interfaces. These industries are using display technology to improve user experience, safety and connectivity of the vehicles. Innovation and revenue growth in automotive display solutions are driven by expansion of adjacent markets.
Automotive Display Market Dynamics and Trends
Driver: Continuous Advancements in Automotive Display Controller and Driver IC Technologies Enhancing Vehicle Interfaces
-
Increased need in advanced automotive display controllers and driver ICs are facilitating higher resolution, higher response rate and more energy efficient display systems, which are motivating increased functionality and user experience in modern vehicle cockpits.
- The component-level innovation is also improving the display performance and integration within the automotive applications. For instance, in November 2024 Himax Technologies started third-generation TDDI and high-end OLED touch ICs mass-production, already used by brands such as Zeekr in next-generation in-vehicle displays.
- These technological advances strengthen supplier leadership, optimize OEM development cycles, and speed the introduction of sophisticated automotive display systems in various vehicle segments.
Restraint: Persistent software reliability and recall challenges limiting display adoption
-
Software errors in car display systems continue to create consumer concern, high recall costs, and barriers to broader market acceptance, even with major hardware improvements.
- For instance, in October 2025, Toyota recalled around 394,000 cars because of a malfunction of the rearview camera display, which obstructed the visibility of drivers and had to be fixed by installing software updates to the vehicles by dealers.
- These software-based recalls add to the quality control costs and create a sense of caution among the OEMs, retarding the growth in demand and highlighting the necessity to be more reliable in the use of displays in automotive applications.
Opportunity: Integration of panoramic digital experience displays in luxury and premium vehicles
-
The shift of the automotive industry to large, integrated digital cockpits currently is a significant growth opportunity, and the premium and luxury brands can distinguish the interior of the vehicle and provide more experiences to the users. The panoramic display systems bring together all display areas into one continuous digital interface, including the instrument cluster, infotainment, and driver assistance interfaces, creating smooth interaction and high-end aesthetics.
- In 2024, Lincoln introduced the Nautilus with a 48‑inch panoramic display, combining the instrument cluster and infotainment screens into a unified interface, exemplifying how large-format displays can enhance driver engagement, simplify information access, and provide a visually immersive environment.
- The introduction of such embedded, high-resolution displays solutions is to respond to consumer demand of customizable and advanced cockpits, enhance the value of available in-vehicle content, enhance brand value, and create greater revenue generation possibilities on the part of display suppliers and OEMs in the automotive industry.
Key Trend: Adoption of Software‑Defined Vehicle Architectures Integrating Display Systems and AI Services
-
The automotive sector is progressing towards software-defined vehicles (SDVs) that merge display interfaces, computers and AI-based services into a centralized upgradable system. This strategy is transforming the interaction of in-vehicle displays with the rest of the car electronics and making it possible to integrate various features seamlessly.
- For instance, in January 2026, Visteon Corporation announced of an all-encompassing intelligent cockpit tender which integrates enhanced displays, smart computing, connectivity, and domain level software applications, demonstrating global OEMs with production ready software-defined cockpit systems.
- The combination of software, AI, display technologies and the trend is leading to a continuous update of features, custom user interfaces and more vehicle connectivity, growing the revenue opportunities and competitive differentiation of both the OEM and the automotive display suppliers.
Automotive Display Market Analysis and Segmental Data
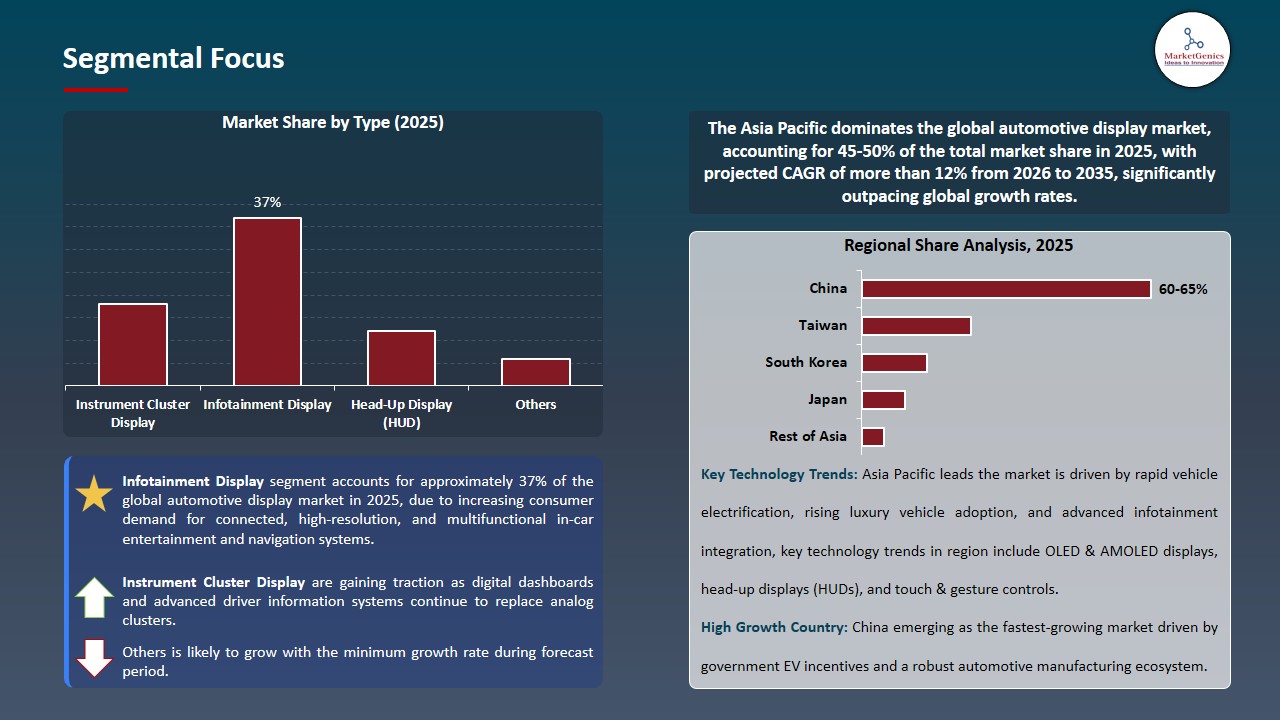
Infotainment Display Dominate Global Automotive Display Market
-
The infotainment display segment dominates the global automotive display market is driven by as vehicles increasingly integrate advanced connectivity, entertainment, and driver interaction capabilities. High-end manufacturing companies have been on the forefront of this trend with the incorporation of large, high-resolution infotainment screens which act as focal points of navigation, multimedia, vehicle controls, and also connected services.
- For instance, the MBUX Hyperscreen of Mercedes-Benz in its EQS electric model consists of multiple OLED and LCD displays beneath a curvy glass cover to create a large digital interface that covers a large portion of the dashboard, providing voice, touch, and gesture response.
- This trend has resulted in extensive use of sophisticated infotainment systems, a better user experience, and a high level of demand on high-resolution automotive display technologies.
Asia Pacific Leads Global Automotive Display Market Demand
-
Asia Pacific leads the automotive display market is driven by the high growth of EV production and sales in Asia Pacific is pushing the automotive display market with more and more vehicles featuring advanced digital cockpits and infotainment systems. For instance, the Huawei-sponsored AITO M9 SUV, which was released in China in 2025 and has a 75-inch augmented reality head-up display, a 12.3-inch instrument panel, 15.6-inch central display, and 16-inch front passenger display.
- Moreover, demand in in-vehicle display systems is rising as Asia Pacific is the largest automotive manufacturing center globally, as OEMs are incorporating them into mass-market, premium, and connected vehicles. The focus on high-tech cockpit solutions in the region can be demonstrated by such brands like Xiaomi with SU7 EV, which has high-tech Qualcomm-powered infotainment displays and HyperOS integration.
- The combination of accelerating EV adoption and extensive regional automotive production positions Asia Pacific as the leading market for automotive displays, driving widespread deployment of advanced cockpit technologies and enhancing regional market growth.
Automotive Display Market Ecosystem
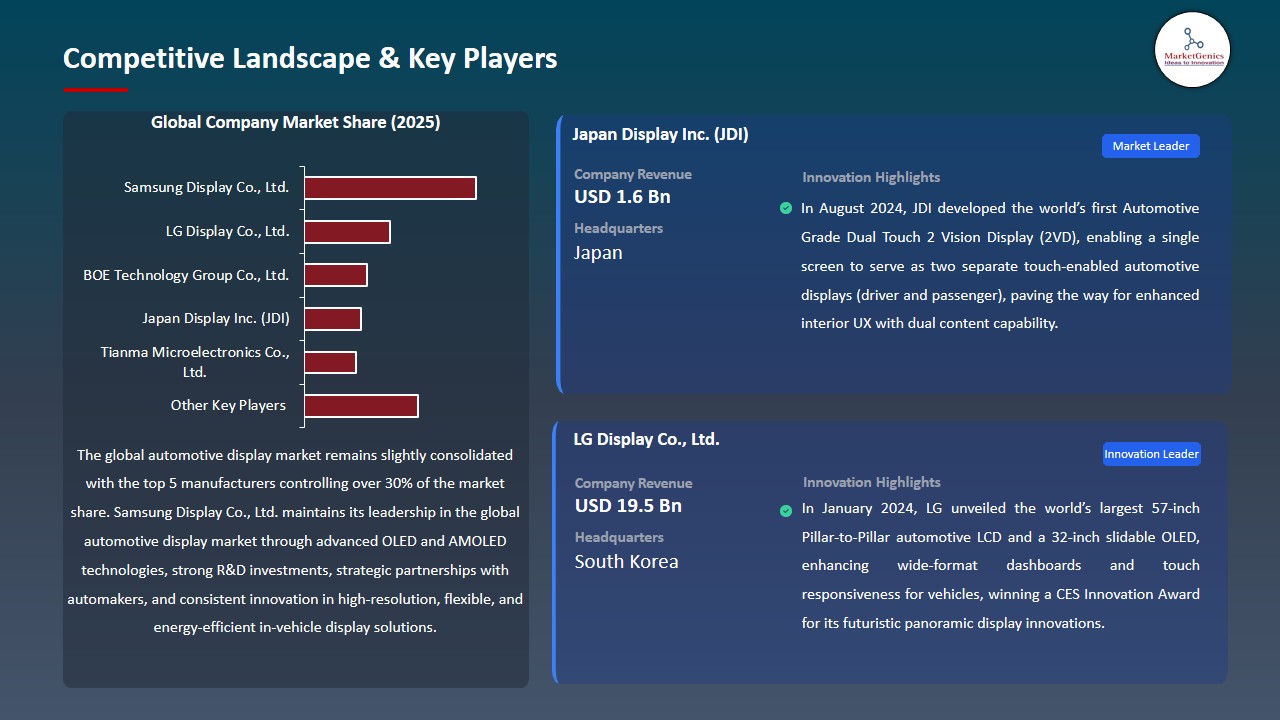
The global automotive display market is slightly consolidated, with leading manufacturers such as Samsung Display Co., Ltd., LG Display Co., Ltd., BOE Technology Group Co., Ltd., Japan Display Inc. (JDI), and Tianma Microelectronics Co., Ltd. dominating global supply through advanced OLED, AMOLED, and high-performance TFT-LCD technologies for premium cockpits and infotainment systems.
These key players are becoming more specialized display solutions to spur innovations, such as flexible OLED and quantum-dot OLED panels by Samsung in immersive dashboards, curved and dual-view displays by LG, ultra-wide panoramic displays by BOE, and large-format curved displays by Tianma, to suit the changing OEM requirements and improved user interfaces.
Government agencies, research organizations, and consortia of R&D are important in the development of automotive display technology. In March 2025, the Japan Automobile Manufacturers Association and Japan MLIT Strategic Innovation Program favored the next generation 3D display integration of autonomous driving interfaces and advanced technological maturity and in-cabin safety improvements.
Product diversification and integrated solutions enable companies to stay competitive, as does expanding portfolios beyond standalone groups of instruments, to full-digital cockpits with HUDs, infotainment, and head-unit display, to increase energy efficiency, modularity, and operational performance.
For instance, in January 2026, LG and Harman launched the first automotive dual-view OLED display in the world, giving driver and passenger independent content streams, using highly advanced image processing to achieve a better in-vehicle user experience and operational flexibility. The technological improvement, strategic OEM partnerships, and the investments in smarter, higher-resolution, and fully integrated display ecosystem are the main drivers of the market.
Recent Development and Strategic Overview:
- In September 2025, Samsung Display presented its advanced automotive OLED displays and digital cockpit solutions, featuring a 10.25 inch moving OLED cluster prototype and custom in‑vehicle OLED panels, demonstrating its commitment to next-generation automotive user experiences and reinforcing its leadership in OLED automotive technology.
- In May 2025, BOE Technology Group Co., Ltd. unveiled the world’s first OLED Smart Cockpit, incorporating ultra‑wide panoramic OLED screens, transparent sunroof displays, and integrated steering wheel OLED panels, marking a significant advancement in comprehensive automotive display solutions.
Report Scope
|
Detail |
|
|
Market Size in 2025 |
USD 18.3 Bn |
|
Market Forecast Value in 2035 |
USD 46.2 Bn |
|
Growth Rate (CAGR) |
9.7% |
|
Forecast Period |
2026 – 2035 |
|
Historical Data Available for |
2021 – 2024 |
|
Market Size Units |
US$ Billion for Value Thousand Units for Volume |
|
Report Format |
Electronic (PDF) + Excel |
|
North America |
Europe |
Asia Pacific |
Middle East |
Africa |
South America |
|
|
|
|
|
|
|
Companies Covered |
|||||
|
|
|
|
|
|
Automotive Display Market Segmentation and Highlights
|
Segment |
Sub-segment |
|
Automotive Display Market, By Type |
|
|
Automotive Display Market, By Display Technology |
|
|
Automotive Display Market, By Touch Technology |
|
|
Automotive Display Market, By Display Size |
|
|
Automotive Display Market, By Resolution |
|
|
Automotive Display Market, By Vehicle Type |
|
|
Automotive Display Market, By Sales Channel |
|
Frequently Asked Questions
Table of Contents
- 1. Research Methodology and Assumptions
- 1.1. Definitions
- 1.2. Research Design and Approach
- 1.3. Data Collection Methods
- 1.4. Base Estimates and Calculations
- 1.5. Forecasting Models
- 1.5.1. Key Forecast Factors & Impact Analysis
- 1.6. Secondary Research
- 1.6.1. Open Sources
- 1.6.2. Paid Databases
- 1.6.3. Associations
- 1.7. Primary Research
- 1.7.1. Primary Sources
- 1.7.2. Primary Interviews with Stakeholders across Ecosystem
- 2. Executive Summary
- 2.1. Global Automotive Display Market Outlook
- 2.1.1. Automotive Display Market Size (Volume - Thousand Units and Value - US$ Bn), and Forecasts, 2021-2035
- 2.1.2. Compounded Annual Growth Rate Analysis
- 2.1.3. Growth Opportunity Analysis
- 2.1.4. Segmental Share Analysis
- 2.1.5. Geographical Share Analysis
- 2.2. Market Analysis and Facts
- 2.3. Supply-Demand Analysis
- 2.4. Competitive Benchmarking
- 2.5. Go-to- Market Strategy
- 2.5.1. Customer/ End-use Industry Assessment
- 2.5.2. Growth Opportunity Data, 2026-2035
- 2.5.2.1. Regional Data
- 2.5.2.2. Country Data
- 2.5.2.3. Segmental Data
- 2.5.3. Identification of Potential Market Spaces
- 2.5.4. GAP Analysis
- 2.5.5. Potential Attractive Price Points
- 2.5.6. Prevailing Market Risks & Challenges
- 2.5.7. Preferred Sales & Marketing Strategies
- 2.5.8. Key Recommendations and Analysis
- 2.5.9. A Way Forward
- 2.1. Global Automotive Display Market Outlook
- 3. Industry Data and Premium Insights
- 3.1. Global Automotive & Transportation Industry Overview, 2025
- 3.1.1. Automotive & Transportation Ecosystem Analysis
- 3.1.2. Key Trends for Automotive & Transportation Industry
- 3.1.3. Regional Distribution for Automotive & Transportation Industry
- 3.2. Supplier Customer Data
- 3.3. Technology Roadmap and Developments
- 3.4. Trade Analysis
- 3.4.1. Import & Export Analysis, 2025
- 3.4.2. Top Importing Countries
- 3.4.3. Top Exporting Countries
- 3.5. Trump Tariff Impact Analysis
- 3.5.1. Manufacturer
- 3.5.1.1. Based on the component & Raw material
- 3.5.2. Supply Chain
- 3.5.3. End Consumer
- 3.5.1. Manufacturer
- 3.6. Raw Material Analysis
- 3.1. Global Automotive & Transportation Industry Overview, 2025
- 4. Market Overview
- 4.1. Market Dynamics
- 4.1.1. Drivers
- 4.1.1.1. Increasing consumer demand for advanced and connected vehicle displays, such as high‑resolution infotainment and digital cockpits
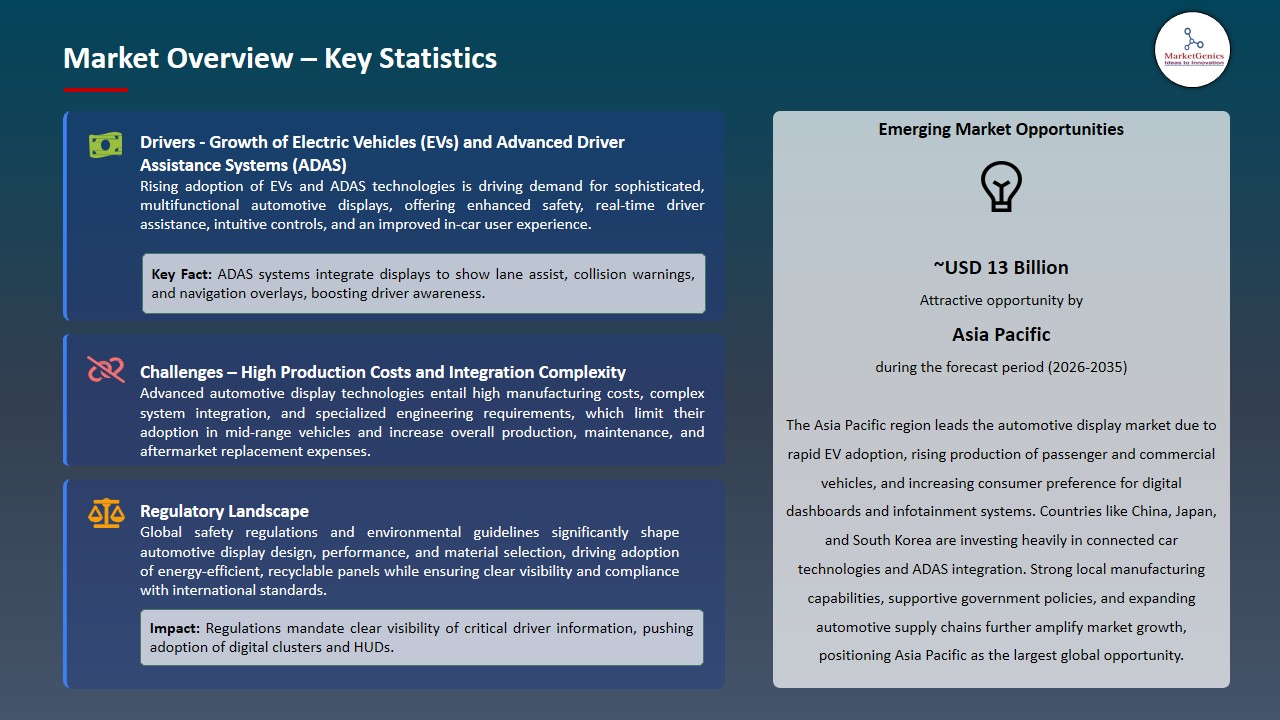
- 4.1.1.2. Growth in electric vehicles and advanced driver assistance systems (ADAS) requiring sophisticated display interfaces
- 4.1.1.3. Stringent safety regulations encouraging integration of displays for improved driver information
- 4.1.2. Restraints
- 4.1.2.1. High production and integration costs of advanced automotive display technologies
- 4.1.2.2. Complexity in system integration and reliability challenges in automotive environments
- 4.1.1. Drivers
- 4.2. Key Trend Analysis
- 4.3. Regulatory Framework
- 4.3.1. Key Regulations, Norms, and Subsidies, by Key Countries
- 4.3.2. Tariffs and Standards
- 4.3.3. Impact Analysis of Regulations on the Market
- 4.4. Value Chain Analysis
- 4.4.1. Component Suppliers
- 4.4.2. Display Manufacturers
- 4.4.3. Distributors & Dealers
- 4.4.4. Vehicle Manufacturers/ Aftermarket
- 4.5. Cost Structure Analysis
- 4.5.1. Parameter’s Share for Cost Associated
- 4.5.2. COGP vs COGS
- 4.5.3. Profit Margin Analysis
- 4.6. Pricing Analysis
- 4.6.1. Regional Pricing Analysis
- 4.6.2. Segmental Pricing Trends
- 4.6.3. Factors Influencing Pricing
- 4.7. Porter’s Five Forces Analysis
- 4.8. PESTEL Analysis
- 4.9. Global Automotive Display Market Demand
- 4.9.1. Historical Market Size – in Volume (Thousand Units) and Value (US$ Bn), 2020-2024
- 4.9.2. Current and Future Market Size – in Volume (Thousand Units) and Value (US$ Bn), 2026–2035
- 4.9.2.1. Y-o-Y Growth Trends
- 4.9.2.2. Absolute $ Opportunity Assessment
- 4.1. Market Dynamics
- 5. Competition Landscape
- 5.1. Competition structure
- 5.1.1. Fragmented v/s consolidated
- 5.2. Company Share Analysis, 2025
- 5.2.1. Global Company Market Share
- 5.2.2. By Region
- 5.2.2.1. North America
- 5.2.2.2. Europe
- 5.2.2.3. Asia Pacific
- 5.2.2.4. Middle East
- 5.2.2.5. Africa
- 5.2.2.6. South America
- 5.3. Product Comparison Matrix
- 5.3.1. Specifications
- 5.3.2. Market Positioning
- 5.3.3. Pricing
- 5.1. Competition structure
- 6. Global Automotive Display Market Analysis, by Type
- 6.1. Key Segment Analysis
- 6.2. Automotive Display Market Size (Volume - Thousand Units and Value - US$ Bn), Analysis, and Forecasts, by Type, 2021-2035
- 6.2.1. Instrument Cluster Display
- 6.2.2. Infotainment Display
- 6.2.3. Head-Up Display (HUD)
- 6.2.4. Rear-Seat Entertainment Display
- 6.2.5. Rearview Mirror Display (Smart Mirror)
- 6.2.6. Surround View / 360° Display
- 6.2.7. Steering Wheel Display
- 6.2.8. Others
- 7. Global Automotive Display Market Analysis, by Display Technology
- 7.1. Key Segment Analysis
- 7.2. Automotive Display Market Size (Volume - Thousand Units and Value - US$ Bn), Analysis, and Forecasts, by Display Technology, 2021-2035
- 7.2.1. LCD (Liquid Crystal Display)
- 7.2.1.1. TFT-LCD
- 7.2.1.2. IPS-LCD
- 7.2.1.3. VA-LCD
- 7.2.2. OLED (Organic Light Emitting Diode)
- 7.2.2.1. Rigid OLED
- 7.2.2.2. Flexible OLED
- 7.2.2.3. Transparent OLED
- 7.2.3. AMOLED (Active Matrix OLED)
- 7.2.4. MicroLED
- 7.2.5. Holographic Display
- 7.2.6. Others
- 7.2.1. LCD (Liquid Crystal Display)
- 8. Global Automotive Display Market Analysis, by Touch Technology
- 8.1. Key Segment Analysis
- 8.2. Automotive Display Market Size (Volume - Thousand Units and Value - US$ Bn), Analysis, and Forecasts, by Touch Technology, 2021-2035
- 8.2.1. Resistive Touch
- 8.2.2. Capacitive Touch
- 8.2.3. Haptic Feedback Touch
- 8.2.4. Force Touch / 3D Touch
- 8.2.5. Gesture-Controlled Display
- 8.2.6. Non-Touch
- 9. Global Automotive Display Market Analysis, by Display Size
- 9.1. Key Segment Analysis
- 9.2. Automotive Display Market Size (Volume - Thousand Units and Value - US$ Bn), Analysis, and Forecasts, by Display Size, 2021-2035
- 9.2.1. Below 5 Inches
- 9.2.2. 5 to 8 Inches
- 9.2.3. 8 to 12 Inches
- 9.2.4. 12 to 16 Inches
- 9.2.5. Above 16 Inches
- 10. Global Automotive Display Market Analysis, by Resolution
- 10.1. Key Segment Analysis
- 10.2. Automotive Display Market Size (Volume - Thousand Units and Value - US$ Bn), Analysis, and Forecasts, by Resolution, 2021-2035
- 10.2.1. Standard Definition (SD)
- 10.2.2. High Definition (HD)
- 10.2.3. Full High Definition (FHD)
- 10.2.4. Ultra High Definition / 4K (UHD)
- 11. Global Automotive Display Market Analysis, by Vehicle Type
- 11.1. Key Segment Analysis
- 11.2. Automotive Display Market Size (Volume - Thousand Units and Value - US$ Bn), Analysis, and Forecasts, by Vehicle Type, 2021-2035
- 11.2.1. Passenger Cars
- 11.2.1.1. Hatchback
- 11.2.1.2. Sedan
- 11.2.1.3. SUV / Crossover
- 11.2.1.4. Coupe / Convertible
- 11.2.1.5. MPV / Minivan
- 11.2.2. Light Commercial Vehicles (LCV)
- 11.2.2.1. Pickup Trucks
- 11.2.2.2. Vans
- 11.2.3. Heavy Commercial Vehicles (HCV)
- 11.2.3.1. Trucks
- 11.2.3.2. Buses & Coaches
- 11.2.4. Electric Vehicles (EV)
- 11.2.5. Autonomous / Self-Driving Vehicles
- 11.2.6. Two-Wheelers & Micromobility
- 11.2.7. Off-Road & Agricultural Vehicles
- 11.2.1. Passenger Cars
- 12. Global Automotive Display Market Analysis, by Sales Channel
- 12.1. Key Segment Analysis
- 12.2. Automotive Display Market Size (Volume - Thousand Units and Value - US$ Bn), Analysis, and Forecasts, by Sales Channel, 2021-2035
- 12.2.1. Original Equipment Manufacturer (OEM)
- 12.2.2. Aftermarket
- 12.2.2.1. Independent Aftermarket (IAM)
- 12.2.2.2. Authorized Dealer Network
- 13. Global Automotive Display Market Analysis, by Region
- 13.1. Key Findings
- 13.2. Automotive Display Market Size (Volume - Thousand Units and Value - US$ Bn), Analysis, and Forecasts, by Region, 2021-2035
- 13.2.1. North America
- 13.2.2. Europe
- 13.2.3. Asia Pacific
- 13.2.4. Middle East
- 13.2.5. Africa
- 13.2.6. South America
- 14. North America Automotive Display Market Analysis
- 14.1. Key Segment Analysis
- 14.2. Regional Snapshot
- 14.3. North America Automotive Display Market Size (Volume - Thousand Units and Value - US$ Bn), Analysis, and Forecasts, 2021-2035
- 14.3.1. Type
- 14.3.2. Display Technology
- 14.3.3. Touch Technology
- 14.3.4. Display Size
- 14.3.5. Resolution
- 14.3.6. Vehicle Type
- 14.3.7. Sales Channel
- 14.3.8. Country
- 14.3.8.1. USA
- 14.3.8.2. Canada
- 14.3.8.3. Mexico
- 14.4. USA Automotive Display Market
- 14.4.1. Country Segmental Analysis
- 14.4.2. Type
- 14.4.3. Display Technology
- 14.4.4. Touch Technology
- 14.4.5. Display Size
- 14.4.6. Resolution
- 14.4.7. Vehicle Type
- 14.4.8. Sales Channel
- 14.5. Canada Automotive Display Market
- 14.5.1. Country Segmental Analysis
- 14.5.2. Type
- 14.5.3. Display Technology
- 14.5.4. Touch Technology
- 14.5.5. Display Size
- 14.5.6. Resolution
- 14.5.7. Vehicle Type
- 14.5.8. Sales Channel
- 14.6. Mexico Automotive Display Market
- 14.6.1. Country Segmental Analysis
- 14.6.2. Type
- 14.6.3. Display Technology
- 14.6.4. Touch Technology
- 14.6.5. Display Size
- 14.6.6. Resolution
- 14.6.7. Vehicle Type
- 14.6.8. Sales Channel
- 15. Europe Automotive Display Market Analysis
- 15.1. Key Segment Analysis
- 15.2. Regional Snapshot
- 15.3. Europe Automotive Display Market Size (Volume - Thousand Units and Value - US$ Bn), Analysis, and Forecasts, 2021-2035
- 15.3.1. Type
- 15.3.2. Display Technology
- 15.3.3. Touch Technology
- 15.3.4. Display Size
- 15.3.5. Resolution
- 15.3.6. Vehicle Type
- 15.3.7. Sales Channel
- 15.3.8. Country
- 15.3.8.1. Germany
- 15.3.8.2. United Kingdom
- 15.3.8.3. France
- 15.3.8.4. Italy
- 15.3.8.5. Spain
- 15.3.8.6. Netherlands
- 15.3.8.7. Nordic Countries
- 15.3.8.8. Poland
- 15.3.8.9. Russia & CIS
- 15.3.8.10. Rest of Europe
- 15.4. Germany Automotive Display Market
- 15.4.1. Country Segmental Analysis
- 15.4.2. Type
- 15.4.3. Display Technology
- 15.4.4. Touch Technology
- 15.4.5. Display Size
- 15.4.6. Resolution
- 15.4.7. Vehicle Type
- 15.4.8. Sales Channel
- 15.5. United Kingdom Automotive Display Market
- 15.5.1. Country Segmental Analysis
- 15.5.2. Type
- 15.5.3. Display Technology
- 15.5.4. Touch Technology
- 15.5.5. Display Size
- 15.5.6. Resolution
- 15.5.7. Vehicle Type
- 15.5.8. Sales Channel
- 15.6. France Automotive Display Market
- 15.6.1. Country Segmental Analysis
- 15.6.2. Type
- 15.6.3. Display Technology
- 15.6.4. Touch Technology
- 15.6.5. Display Size
- 15.6.6. Resolution
- 15.6.7. Vehicle Type
- 15.6.8. Sales Channel
- 15.7. Italy Automotive Display Market
- 15.7.1. Country Segmental Analysis
- 15.7.2. Type
- 15.7.3. Display Technology
- 15.7.4. Touch Technology
- 15.7.5. Display Size
- 15.7.6. Resolution
- 15.7.7. Vehicle Type
- 15.7.8. Sales Channel
- 15.8. Spain Automotive Display Market
- 15.8.1. Country Segmental Analysis
- 15.8.2. Type
- 15.8.3. Display Technology
- 15.8.4. Touch Technology
- 15.8.5. Display Size
- 15.8.6. Resolution
- 15.8.7. Vehicle Type
- 15.8.8. Sales Channel
- 15.9. Netherlands Automotive Display Market
- 15.9.1. Country Segmental Analysis
- 15.9.2. Type
- 15.9.3. Display Technology
- 15.9.4. Touch Technology
- 15.9.5. Display Size
- 15.9.6. Resolution
- 15.9.7. Vehicle Type
- 15.9.8. Sales Channel
- 15.10. Nordic Countries Automotive Display Market
- 15.10.1. Country Segmental Analysis
- 15.10.2. Type
- 15.10.3. Display Technology
- 15.10.4. Touch Technology
- 15.10.5. Display Size
- 15.10.6. Resolution
- 15.10.7. Vehicle Type
- 15.10.8. Sales Channel
- 15.11. Poland Automotive Display Market
- 15.11.1. Country Segmental Analysis
- 15.11.2. Type
- 15.11.3. Display Technology
- 15.11.4. Touch Technology
- 15.11.5. Display Size
- 15.11.6. Resolution
- 15.11.7. Vehicle Type
- 15.11.8. Sales Channel
- 15.12. Russia & CIS Automotive Display Market
- 15.12.1. Country Segmental Analysis
- 15.12.2. Type
- 15.12.3. Display Technology
- 15.12.4. Touch Technology
- 15.12.5. Display Size
- 15.12.6. Resolution
- 15.12.7. Vehicle Type
- 15.12.8. Sales Channel
- 15.13. Rest of Europe Automotive Display Market
- 15.13.1. Country Segmental Analysis
- 15.13.2. Type
- 15.13.3. Display Technology
- 15.13.4. Touch Technology
- 15.13.5. Display Size
- 15.13.6. Resolution
- 15.13.7. Vehicle Type
- 15.13.8. Sales Channel
- 16. Asia Pacific Automotive Display Market Analysis
- 16.1. Key Segment Analysis
- 16.2. Regional Snapshot
- 16.3. Asia Pacific Automotive Display Market Size (Volume - Thousand Units and Value - US$ Bn), Analysis, and Forecasts, 2021-2035
- 16.3.1. Type
- 16.3.2. Display Technology
- 16.3.3. Touch Technology
- 16.3.4. Display Size
- 16.3.5. Resolution
- 16.3.6. Vehicle Type
- 16.3.7. Sales Channel
- 16.3.8. Country
- 16.3.8.1. China
- 16.3.8.2. India
- 16.3.8.3. Japan
- 16.3.8.4. South Korea
- 16.3.8.5. Australia and New Zealand
- 16.3.8.6. Indonesia
- 16.3.8.7. Malaysia
- 16.3.8.8. Thailand
- 16.3.8.9. Vietnam
- 16.3.8.10. Rest of Asia Pacific
- 16.4. China Automotive Display Market
- 16.4.1. Country Segmental Analysis
- 16.4.2. Type
- 16.4.3. Display Technology
- 16.4.4. Touch Technology
- 16.4.5. Display Size
- 16.4.6. Resolution
- 16.4.7. Vehicle Type
- 16.4.8. Sales Channel
- 16.5. India Automotive Display Market
- 16.5.1. Country Segmental Analysis
- 16.5.2. Type
- 16.5.3. Display Technology
- 16.5.4. Touch Technology
- 16.5.5. Display Size
- 16.5.6. Resolution
- 16.5.7. Vehicle Type
- 16.5.8. Sales Channel
- 16.6. Japan Automotive Display Market
- 16.6.1. Country Segmental Analysis
- 16.6.2. Type
- 16.6.3. Display Technology
- 16.6.4. Touch Technology
- 16.6.5. Display Size
- 16.6.6. Resolution
- 16.6.7. Vehicle Type
- 16.6.8. Sales Channel
- 16.7. South Korea Automotive Display Market
- 16.7.1. Country Segmental Analysis
- 16.7.2. Type
- 16.7.3. Display Technology
- 16.7.4. Touch Technology
- 16.7.5. Display Size
- 16.7.6. Resolution
- 16.7.7. Vehicle Type
- 16.7.8. Sales Channel
- 16.8. Australia and New Zealand Automotive Display Market
- 16.8.1. Country Segmental Analysis
- 16.8.2. Type
- 16.8.3. Display Technology
- 16.8.4. Touch Technology
- 16.8.5. Display Size
- 16.8.6. Resolution
- 16.8.7. Vehicle Type
- 16.8.8. Sales Channel
- 16.9. Indonesia Automotive Display Market
- 16.9.1. Country Segmental Analysis
- 16.9.2. Type
- 16.9.3. Display Technology
- 16.9.4. Touch Technology
- 16.9.5. Display Size
- 16.9.6. Resolution
- 16.9.7. Vehicle Type
- 16.9.8. Sales Channel
- 16.10. Malaysia Automotive Display Market
- 16.10.1. Country Segmental Analysis
- 16.10.2. Type
- 16.10.3. Display Technology
- 16.10.4. Touch Technology
- 16.10.5. Display Size
- 16.10.6. Resolution
- 16.10.7. Vehicle Type
- 16.10.8. Sales Channel
- 16.11. Thailand Automotive Display Market
- 16.11.1. Country Segmental Analysis
- 16.11.2. Type
- 16.11.3. Display Technology
- 16.11.4. Touch Technology
- 16.11.5. Display Size
- 16.11.6. Resolution
- 16.11.7. Vehicle Type
- 16.11.8. Sales Channel
- 16.12. Vietnam Automotive Display Market
- 16.12.1. Country Segmental Analysis
- 16.12.2. Type
- 16.12.3. Display Technology
- 16.12.4. Touch Technology
- 16.12.5. Display Size
- 16.12.6. Resolution
- 16.12.7. Vehicle Type
- 16.12.8. Sales Channel
- 16.13. Rest of Asia Pacific Automotive Display Market
- 16.13.1. Country Segmental Analysis
- 16.13.2. Type
- 16.13.3. Display Technology
- 16.13.4. Touch Technology
- 16.13.5. Display Size
- 16.13.6. Resolution
- 16.13.7. Vehicle Type
- 16.13.8. Sales Channel
- 17. Middle East Automotive Display Market Analysis
- 17.1. Key Segment Analysis
- 17.2. Regional Snapshot
- 17.3. Middle East Automotive Display Market Size (Volume - Thousand Units and Value - US$ Bn), Analysis, and Forecasts, 2021-2035
- 17.3.1. Type
- 17.3.2. Display Technology
- 17.3.3. Touch Technology
- 17.3.4. Display Size
- 17.3.5. Resolution
- 17.3.6. Vehicle Type
- 17.3.7. Sales Channel
- 17.3.8. Country
- 17.3.8.1. Turkey
- 17.3.8.2. UAE
- 17.3.8.3. Saudi Arabia
- 17.3.8.4. Israel
- 17.3.8.5. Rest of Middle East
- 17.4. Turkey Automotive Display Market
- 17.4.1. Country Segmental Analysis
- 17.4.2. Type
- 17.4.3. Display Technology
- 17.4.4. Touch Technology
- 17.4.5. Display Size
- 17.4.6. Resolution
- 17.4.7. Vehicle Type
- 17.4.8. Sales Channel
- 17.5. UAE Automotive Display Market
- 17.5.1. Country Segmental Analysis
- 17.5.2. Type
- 17.5.3. Display Technology
- 17.5.4. Touch Technology
- 17.5.5. Display Size
- 17.5.6. Resolution
- 17.5.7. Vehicle Type
- 17.5.8. Sales Channel
- 17.6. Saudi Arabia Automotive Display Market
- 17.6.1. Country Segmental Analysis
- 17.6.2. Type
- 17.6.3. Display Technology
- 17.6.4. Touch Technology
- 17.6.5. Display Size
- 17.6.6. Resolution
- 17.6.7. Vehicle Type
- 17.6.8. Sales Channel
- 17.7. Israel Automotive Display Market
- 17.7.1. Country Segmental Analysis
- 17.7.2. Type
- 17.7.3. Display Technology
- 17.7.4. Touch Technology
- 17.7.5. Display Size
- 17.7.6. Resolution
- 17.7.7. Vehicle Type
- 17.7.8. Sales Channel
- 17.8. Rest of Middle East Automotive Display Market
- 17.8.1. Country Segmental Analysis
- 17.8.2. Type
- 17.8.3. Display Technology
- 17.8.4. Touch Technology
- 17.8.5. Display Size
- 17.8.6. Resolution
- 17.8.7. Vehicle Type
- 17.8.8. Sales Channel
- 18. Africa Automotive Display Market Analysis
- 18.1. Key Segment Analysis
- 18.2. Regional Snapshot
- 18.3. Africa Automotive Display Market Size (Volume - Thousand Units and Value - US$ Bn), Analysis, and Forecasts, 2021-2035
- 18.3.1. Type
- 18.3.2. Display Technology
- 18.3.3. Touch Technology
- 18.3.4. Display Size
- 18.3.5. Resolution
- 18.3.6. Vehicle Type
- 18.3.7. Sales Channel
- 18.3.8. Country
- 18.3.8.1. South Africa
- 18.3.8.2. Egypt
- 18.3.8.3. Nigeria
- 18.3.8.4. Algeria
- 18.3.8.5. Rest of Africa
- 18.4. South Africa Automotive Display Market
- 18.4.1. Country Segmental Analysis
- 18.4.2. Type
- 18.4.3. Display Technology
- 18.4.4. Touch Technology
- 18.4.5. Display Size
- 18.4.6. Resolution
- 18.4.7. Vehicle Type
- 18.4.8. Sales Channel
- 18.5. Egypt Automotive Display Market
- 18.5.1. Country Segmental Analysis
- 18.5.2. Type
- 18.5.3. Display Technology
- 18.5.4. Touch Technology
- 18.5.5. Display Size
- 18.5.6. Resolution
- 18.5.7. Vehicle Type
- 18.5.8. Sales Channel
- 18.6. Nigeria Automotive Display Market
- 18.6.1. Country Segmental Analysis
- 18.6.2. Type
- 18.6.3. Display Technology
- 18.6.4. Touch Technology
- 18.6.5. Display Size
- 18.6.6. Resolution
- 18.6.7. Vehicle Type
- 18.6.8. Sales Channel
- 18.7. Algeria Automotive Display Market
- 18.7.1. Country Segmental Analysis
- 18.7.2. Type
- 18.7.3. Display Technology
- 18.7.4. Touch Technology
- 18.7.5. Display Size
- 18.7.6. Resolution
- 18.7.7. Vehicle Type
- 18.7.8. Sales Channel
- 18.8. Rest of Africa Automotive Display Market
- 18.8.1. Country Segmental Analysis
- 18.8.2. Type
- 18.8.3. Display Technology
- 18.8.4. Touch Technology
- 18.8.5. Display Size
- 18.8.6. Resolution
- 18.8.7. Vehicle Type
- 18.8.8. Sales Channel
- 19. South America Automotive Display Market Analysis
- 19.1. Key Segment Analysis
- 19.2. Regional Snapshot
- 19.3. South America Automotive Display Market Size (Volume - Thousand Units and Value - US$ Bn), Analysis, and Forecasts, 2021-2035
- 19.3.1. Type
- 19.3.2. Display Technology
- 19.3.3. Touch Technology
- 19.3.4. Display Size
- 19.3.5. Resolution
- 19.3.6. Vehicle Type
- 19.3.7. Sales Channel
- 19.3.8. Country
- 19.3.8.1. Brazil
- 19.3.8.2. Argentina
- 19.3.8.3. Rest of South America
- 19.4. Brazil Automotive Display Market
- 19.4.1. Country Segmental Analysis
- 19.4.2. Type
- 19.4.3. Display Technology
- 19.4.4. Touch Technology
- 19.4.5. Display Size
- 19.4.6. Resolution
- 19.4.7. Vehicle Type
- 19.4.8. Sales Channel
- 19.5. Argentina Automotive Display Market
- 19.5.1. Country Segmental Analysis
- 19.5.2. Type
- 19.5.3. Display Technology
- 19.5.4. Touch Technology
- 19.5.5. Display Size
- 19.5.6. Resolution
- 19.5.7. Vehicle Type
- 19.5.8. Sales Channel
- 19.6. Rest of South America Automotive Display Market
- 19.6.1. Country Segmental Analysis
- 19.6.2. Type
- 19.6.3. Display Technology
- 19.6.4. Touch Technology
- 19.6.5. Display Size
- 19.6.6. Resolution
- 19.6.7. Vehicle Type
- 19.6.8. Sales Channel
- 20. Key Players/ Company Profile
- 20.1. Alpine Electronics, Inc.
- 20.1.1. Company Details/ Overview
- 20.1.2. Company Financials
- 20.1.3. Key Customers and Competitors
- 20.1.4. Business/ Industry Portfolio
- 20.1.5. Product Portfolio/ Specification Details
- 20.1.6. Pricing Data
- 20.1.7. Strategic Overview
- 20.1.8. Recent Developments
- 20.2. Aptiv PLC
- 20.3. BOE Technology Group Co., Ltd.
- 20.4. Continental AG
- 20.5. Denso Corporation
- 20.6. Garmin Ltd.
- 20.7. GENTEX CORPORATION
- 20.8. Japan Display Inc. (JDI)
- 20.9. LG Display Co., Ltd.
- 20.10. Marelli Holdings Co., Ltd.
- 20.11. Mitsubishi Electric Corporation
- 20.12. Nippon Seiki Co., Ltd.
- 20.13. Panasonic Automotive Systems
- 20.14. Pioneer Corporation
- 20.15. Robert Bosch GmbH
- 20.16. Samsung Display Co., Ltd.
- 20.17. Tianma Microelectronics Co., Ltd.
- 20.18. Valeo S.A.
- 20.19. Visteon Corporation
- 20.20. Yazaki Corporation
- 20.21. Other Key Players
- 20.1. Alpine Electronics, Inc.
Note* - This is just tentative list of players. While providing the report, we will cover more number of players based on their revenue and share for each geography
Research Design
Our research design integrates both demand-side and supply-side analysis through a balanced combination of primary and secondary research methodologies. By utilizing both bottom-up and top-down approaches alongside rigorous data triangulation methods, we deliver robust market intelligence that supports strategic decision-making.
MarketGenics' comprehensive research design framework ensures the delivery of accurate, reliable, and actionable market intelligence. Through the integration of multiple research approaches, rigorous validation processes, and expert analysis, we provide our clients with the insights needed to make informed strategic decisions and capitalize on market opportunities.

MarketGenics leverages a dedicated industry panel of experts and a comprehensive suite of paid databases to effectively collect, consolidate, and analyze market intelligence.
Our approach has consistently proven to be reliable and effective in generating accurate market insights, identifying key industry trends, and uncovering emerging business opportunities.
Through both primary and secondary research, we capture and analyze critical company-level data such as manufacturing footprints, including technical centers, R&D facilities, sales offices, and headquarters.
Our expert panel further enhances our ability to estimate market size for specific brands based on validated field-level intelligence.
Our data mining techniques incorporate both parametric and non-parametric methods, allowing for structured data collection, sorting, processing, and cleaning.
Demand projections are derived from large-scale data sets analyzed through proprietary algorithms, culminating in robust and reliable market sizing.
Research Approach
The bottom-up approach builds market estimates by starting with the smallest addressable market units and systematically aggregating them to create comprehensive market size projections.
This method begins with specific, granular data points and builds upward to create the complete market landscape.
Customer Analysis → Segmental Analysis → Geographical Analysis
The top-down approach starts with the broadest possible market data and systematically narrows it down through a series of filters and assumptions to arrive at specific market segments or opportunities.
This method begins with the big picture and works downward to increasingly specific market slices.
TAM → SAM → SOM


Research Methods
Desk / Secondary Research
While analysing the market, we extensively study secondary sources, directories, and databases to identify and collect information useful for this technical, market-oriented, and commercial report. Secondary sources that we utilize are not only the public sources, but it is a combination of Open Source, Associations, Paid Databases, MG Repository & Knowledgebase, and others.
- Company websites, annual reports, financial reports, broker reports, and investor presentations
- National government documents, statistical databases and reports
- News articles, press releases and web-casts specific to the companies operating in the market, Magazines, reports, and others
- We gather information from commercial data sources for deriving company specific data such as segmental revenue, share for geography, product revenue, and others
- Internal and external proprietary databases (industry-specific), relevant patent, and regulatory databases
- Governing Bodies, Government Organizations
- Relevant Authorities, Country-specific Associations for Industries
We also employ the model mapping approach to estimate the product level market data through the players' product portfolio
Primary Research
Primary research/ interviews is vital in analyzing the market. Most of the cases involves paid primary interviews. Primary sources include primary interviews through e-mail interactions, telephonic interviews, surveys as well as face-to-face interviews with the different stakeholders across the value chain including several industry experts.
| Type of Respondents | Number of Primaries |
|---|---|
| Tier 2/3 Suppliers | ~20 |
| Tier 1 Suppliers | ~25 |
| End-users | ~25 |
| Industry Expert/ Panel/ Consultant | ~30 |
| Total | ~100 |
MG Knowledgebase
• Repository of industry blog, newsletter and case studies
• Online platform covering detailed market reports, and company profiles
Forecasting Factors and Models
Forecasting Factors
- Historical Trends – Past market patterns, cycles, and major events that shaped how markets behave over time. Understanding past trends helps predict future behavior.
- Industry Factors – Specific characteristics of the industry like structure, regulations, and innovation cycles that affect market dynamics.
- Macroeconomic Factors – Economic conditions like GDP growth, inflation, and employment rates that affect how much money people have to spend.
- Demographic Factors – Population characteristics like age, income, and location that determine who can buy your product.
- Technology Factors – How quickly people adopt new technology and how much technology infrastructure exists.
- Regulatory Factors – Government rules, laws, and policies that can help or restrict market growth.
- Competitive Factors – Analyzing competition structure such as degree of competition and bargaining power of buyers and suppliers.
Forecasting Models / Techniques
Multiple Regression Analysis
- Identify and quantify factors that drive market changes
- Statistical modeling to establish relationships between market drivers and outcomes
Time Series Analysis – Seasonal Patterns
- Understand regular cyclical patterns in market demand
- Advanced statistical techniques to separate trend, seasonal, and irregular components
Time Series Analysis – Trend Analysis
- Identify underlying market growth patterns and momentum
- Statistical analysis of historical data to project future trends
Expert Opinion – Expert Interviews
- Gather deep industry insights and contextual understanding
- In-depth interviews with key industry stakeholders
Multi-Scenario Development
- Prepare for uncertainty by modeling different possible futures
- Creating optimistic, pessimistic, and most likely scenarios
Time Series Analysis – Moving Averages
- Sophisticated forecasting for complex time series data
- Auto-regressive integrated moving average models with seasonal components
Econometric Models
- Apply economic theory to market forecasting
- Sophisticated economic models that account for market interactions
Expert Opinion – Delphi Method
- Harness collective wisdom of industry experts
- Structured, multi-round expert consultation process
Monte Carlo Simulation
- Quantify uncertainty and probability distributions
- Thousands of simulations with varying input parameters
Research Analysis
Our research framework is built upon the fundamental principle of validating market intelligence from both demand and supply perspectives. This dual-sided approach ensures comprehensive market understanding and reduces the risk of single-source bias.
Demand-Side Analysis: We understand end-user/application behavior, preferences, and market needs along with the penetration of the product for specific application.
Supply-Side Analysis: We estimate overall market revenue, analyze the segmental share along with industry capacity, competitive landscape, and market structure.
Validation & Evaluation
Data triangulation is a validation technique that uses multiple methods, sources, or perspectives to examine the same research question, thereby increasing the credibility and reliability of research findings. In market research, triangulation serves as a quality assurance mechanism that helps identify and minimize bias, validate assumptions, and ensure accuracy in market estimates.
- Data Source Triangulation – Using multiple data sources to examine the same phenomenon
- Methodological Triangulation – Using multiple research methods to study the same research question
- Investigator Triangulation – Using multiple researchers or analysts to examine the same data
- Theoretical Triangulation – Using multiple theoretical perspectives to interpret the same data

Custom Market Research Services
We will customise the research for you, in case the report listed above does not meet your requirements.
Get 10% Free Customisation